fuel treatments and fire severity: a meta-analysis
TRANSCRIPT
7/28/2019 Fuel Treatments and Fire Severity: A Meta-Analysis
http://slidepdf.com/reader/full/fuel-treatments-and-fire-severity-a-meta-analysis 1/40
United StatesDepartmentof Agriculture
Forest Service
Rocky MountainResearch Station
Research PaperRMRS-RP-103WWW
June 2013
Fuel Treatments and FireSeverity: A Meta-Analysis
Erik J. Martinson and Philip N. Omi

7/28/2019 Fuel Treatments and Fire Severity: A Meta-Analysis
http://slidepdf.com/reader/full/fuel-treatments-and-fire-severity-a-meta-analysis 2/40
You may order additional copies of this publication by sending your mailing information in label form through one of the following media.Please specify the publication title and number.
Publishing Services Telephone (970) 498-1392
FAX (970) 498-1122
E-mail [email protected]
Web site http://www.fs.fed.us/rmrs
Mailing Address Publications Distribution
Rocky Mountain Research Station
240 West Prospect Road
Fort Collins, CO 80526
Martinson, E.J.; Omi, P.N. 2013. Fuel treatments and fire severity: A meta-analysis. Res. Pap.
RMRS-RP-103WWW. Fort Collins, CO: U.S. Department of Agriculture, Forest Service, Rocky
Mountain Research Station. 35 p.
Abstract We employed meta-analysis and information theory to synthesize findings reported in the literature
on the effects of fuel treatments on subsequent fire intensity and severity. Data were compiled from 19
publications that reported observed fire responses from 62 treated versus untreated contrasts. Effect
sizes varied widely and the most informative grouping of studies distinguished three vegetation types
and three types of fuel treatment. The resultant meta-analytic model is highly significant (p<0.001)and explains 78% of the variability in reported observations of fuel treatment effectiveness. Our syn-
thesis highlights several considerations that both support and inform the current fuels management
paradigm.
Keywords: thinning, prescribed burning, wildfire, effect size, synthesis
AuthorsErik J. Martinson is a Consultant and Partner at MarLynn Ecological Consulting in Fort Collins,
Colorado.
Philip N. Omi is a Professor Emeritus at Colorado State University and Principal of Omi Associates
in Sebastopol, California.
7/28/2019 Fuel Treatments and Fire Severity: A Meta-Analysis
http://slidepdf.com/reader/full/fuel-treatments-and-fire-severity-a-meta-analysis 3/40
1USDA Forest Service Res. Pap. RMRS-RP-103WWW. 2013
Introduction ______________________________________________________
Changes in land use and management over the last century or more have increased
the vertical and horizontal continuity of wildland fuels in many areas of North America
(Pyne 1982, but see Keeley and Fotheringham [2001] and Johnson and others [2001]
for discussion of exceptions). This increase in fuel hazard is compounding with climate
change (Brown and others 2004) and ex-urban development (Cova and others 2004) to
place ever more values at risk to wildfire damages. While the problem has been recog-nized for decades (Cooper 1960), political and land management attention on mitigating
hazardous fuels has recently increased (Stephens and Ruth 2005), piquing an interest
for more research into the effects and effectiveness of these activities (Botti and others
1998). Consequently, the volume of fuel treatment studies has expanded greatly over the
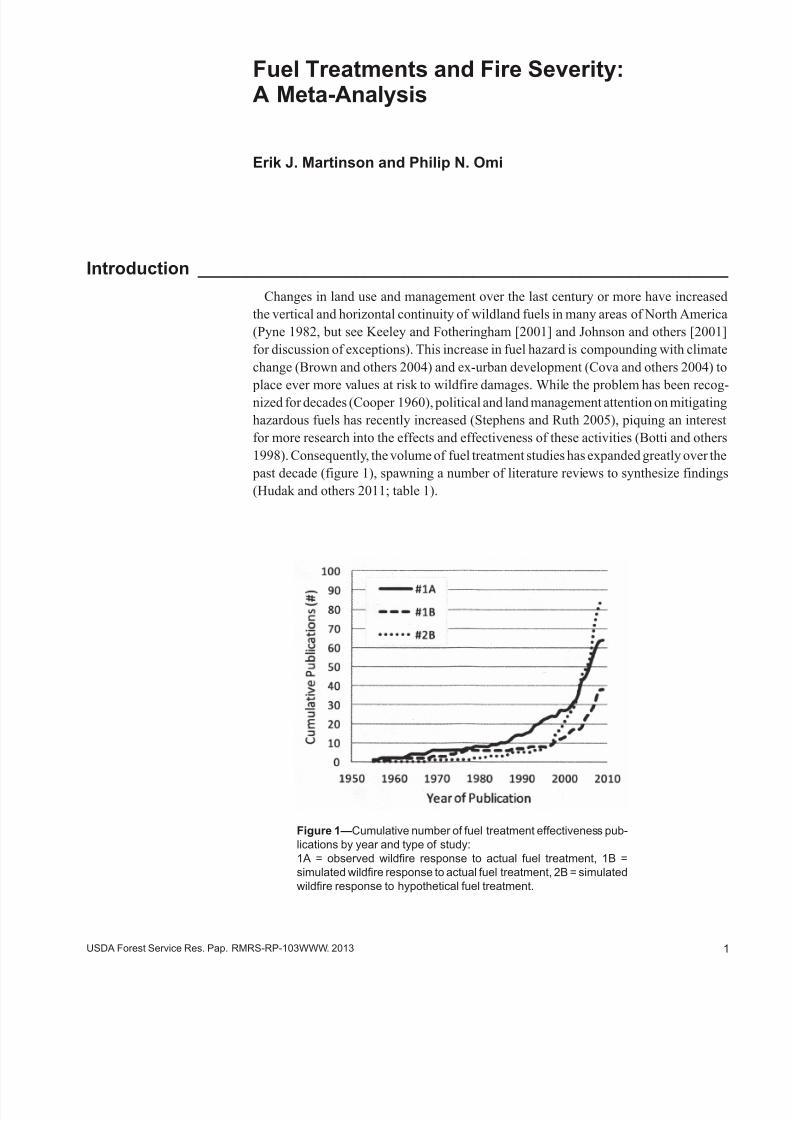
past decade (figure 1), spawning a number of literature reviews to synthesize findings
(Hudak and others 2011; table 1).
Figure 1—Cumulative number of fuel treatment effectiveness pub-
lications by year and type of study:
1A = observed wildfire response to actual fuel treatment, 1B =
simulated wildfire response to actual fuel treatment, 2B = simulated
wildfire response to hypothetical fuel treatment.
Fuel Treatments and Fire Severity:A Meta-Analysis
Erik J. Martinson and Philip N. Omi

7/28/2019 Fuel Treatments and Fire Severity: A Meta-Analysis
http://slidepdf.com/reader/full/fuel-treatments-and-fire-severity-a-meta-analysis 4/40
2 USDA Forest Service Res. Pap. RMRS-RP-103WWW. 2013
A paradigm for fuels management has emerged from these reviews that emphasizes
the importance of first distinguishing ecosystems where fire was historically frequent
and benign while limited primarily by fuel quantity (such as dry conifer forests) from
those where fire was historically infrequent and stand-replacing while limited more by
climate (such as sub-arctic and sub-alpine forests or California chaparral). The paradigm
suggests that large-scale fuels management may be inappropriate and counter-productivein the latter types of ecosystems (Johnson and others 2001; Keeley and Fotheringham
2001), but should be successful in the former to the degree that more resilient conditions
result from reducing surface fuels, removing ladders, opening canopies, and selecting for
fire resistance (such as by leaving large trees), in that order (Agee and Skinner 2005).
Keeley and others (2009) noted that empirical studies in lower-elevation western conifer
forests consistently demonstrate reduced wildfire severity from combinations of thin-
ning and burning, but caution that the slash produced by thinning will exacerbate fire
hazard until it is also treated. Guidance is less clear for ecosystems where the interac-
tions among fire, weather, and fuels are more complex and the historic fire regime was a
mixture of frequencies and severities (such as mesic mixed forests at middle elevations
and latitudes). Thus, the recommendation for fuels management in these systems has
been for limited and cautious application (Schoennagle and others 2004).
However, traditional literature reviews are inherently qualitative in their syntheses of
the information provided in research reports (Cooper and others 2009). They are also
prone to bias in selection and interpretation of findings and tend to over-emphasize
contradictory conclusions with inadequate attention to sources of variability. Since
1955, the medical sciences have relied instead on an alternative approach to research
synthesis using the techniques of meta-analysis (Stroup and others 2000).
Table 1—Recent literature reviews related to fuel management that were used to identify studies to consider for inclusion in our
synthesis. The Joint Fire Science Program database of final reports for completed projects (www.firescience.org) was
also searched.
1. Greenlee, J.M.; Sapsis, D.B. 1996. Prefire effectiveness in fire management: A summary and a review of the state-of-
knowledge. Fairfield, WA: International Association of Wildland Fire.
2. Carey, H.; Schumann, M. 2003. Modifying wildfire behavior—the effectiveness of fuel treatments. Santa Fe, NM: Na-
tional Community Forestry Center Southwest Region Working Paper #2.
3. Martinson, E.J.; Omi, P.N. 2003. Performance of fuel treatments subjected to wildfires. USDA Forest Service Proceed-
ings RMRS-P-29: 7-14.
4. Fernandes, P.M.; Botelho, H.S. 2003. A review of prescribed burning effectiveness in fire hazard reduction. International
Journal of Wildland Fire 12: 117-128.
5. Graham, R.T.; McCaffrey, S.; Jain, T.B. 2004. Science basis for changing forest structure to modify wildfire behavior and
severity. USDA Forest Service General Technical Report RMRS-GTR-120: 143.
6. Agee, J.K.; Skinner, C.N. 2005. Basic principles of forest fuel reduction treatments. Forest Ecology and Management
211: 83-96.
7. Peterson, D.L.; Johnson, M.C.; Agee, J.K.; Jain, T.B.; McKenzie, D.; Reinhardt, E.D. 2005. Forest structure and fire haz-
ard in dry forests of the Western United States. USDA Forest Service General Technical Report PNW-GTR-628: 1-30.
8. Keeley, J.E.; Aplet, G.H.; Christensen, N.L.; Conard, S.C.; Johnson, E.A.; Omi, P.N.; Peterson, D.L.; Swetnam, T.W.
2009. Ecological foundations for fire management in North American forest and shrubland ecosystems. USDA Forest
Service General Technical Report PNW-GTR-779: 1-92.

7/28/2019 Fuel Treatments and Fire Severity: A Meta-Analysis
http://slidepdf.com/reader/full/fuel-treatments-and-fire-severity-a-meta-analysis 5/40
3USDA Forest Service Res. Pap. RMRS-RP-103WWW. 2013
Meta-analysis is a systematic and quantitative approach to research synthesis that
combines and compares results from independent trials to assess the direction, magni-
tude, and consistency of reported responses (Cooper and others 2009). Meta-analysis
is now commonly applied to ecological questions (Gurevitch and others 2001) and has
been recently applied to the wildland fuels treatment literature, as well (Martinson 1998,
Wan and others 2001, Kopper 2002, Boerner and others 2009, Kalies and others 2010,
Youngblood 2010). Kopper and others (2002, 2009) conducted a meta-analysis on the
effects of prescribed fire on fuel reduction. The focus of the current meta-analysis ison the literature documenting fuel treatment performance in mitigating subsequent fire
intensity and severity to assess the empirical support for the current fuel management
paradigm.
Methods _________________________________________________________
Meta-analysis involves a comprehensive literature search for relevant studies, quanti-
fication of the magnitude of effects reported in the studies selected for inclusion, and an
analysis of study heterogeneity to identify the strength and significance of any emergent
trends. Robust methods for extracting and analyzing data embedded in disparate studies
contribute to the strength of meta-analytic investigations.
Literature Search
Our literature search employed eight documents (table 1) as sources to identify the
scientific publications relevant to our meta-analysis. These sources are traditional lit-
erature reviews that address fuel management issues and all references cited in them
were subjected to an initial screening, as was any subsequent document published prior
to September 1, 2009, that included at least one of the reviews in its literature cited (as
identified by Google Scholar [http://scholar.google.com]). Final reports submitted to
the Joint Fire Science Program (http://www.firescience.gov) prior to June 1, 2010, were
also screened for relevant data and additional publications.
Study Selection
The initial screening broadly categorized all identified publications (n = 1213) based
on the characteristics of the fuel treatments investigated (actual treatment [n = 280],
hypothetical or planned treatment [n = 97], or no fuel treatment [n = 836]) and the
response variable analyzed (actual fire characteristic [n = 105], simulated fire charac-
teristic [n = 161], or no fire characteristic reported as a response variable [n = 947]). All
publications that included information from actual fuel treatments exposed to actual fire
(n = 60) were thoroughly reviewed and coded with respect to the following information:
study design, location, dominant vegetation, fuel and fire variables measured, and treat-
ment characteristics reported (Appendix A). Publications that did not include both a fuel
treatment and a subsequent fire test were outside the focus of our meta-analysis, while
simulation studies were excluded from further consideration for being more theoreti-
cal than empirical and overly encumbered by inherent inconsistencies in investigator
assumptions and model errors (Cruz and Alexander 2010).
Studies of fuel treatment performance generally employ one of three basic designs:
pre-planned block experiments (n = 9) burned intentionally or serendipitously, retrospec-
tive paired comparisons of treated and untreated areas affected by wildfire (n = 18), and
landscape or regional surveys of wildfire severity or area burned (n = 33). Most of the
7/28/2019 Fuel Treatments and Fire Severity: A Meta-Analysis
http://slidepdf.com/reader/full/fuel-treatments-and-fire-severity-a-meta-analysis 6/40
4 USDA Forest Service Res. Pap. RMRS-RP-103WWW. 2013
latter lacked any semblance of control for variations in weather and topography (n = 28)
and were excluded from further analysis, though recent advances in the application of
spatial statistics show promise of improved information from such studies in the future
by accounting for auto-correlated influences on fire behavior (for example, Wimberly
and others 2009).
A variety of response variables are reported in the fuel treatment performance literature,
and many report more than one measure. Among the 32 publications that remained under
consideration for our meta-analysis, reported response variables comprised flame length(n = 7), fire spread rate (n = 5), percent canopy consumption (n = 6), percent canopy
scorch (n = 11), scorch height (n = 7), bole char height (n = 8), percent mortality (n = 8),
categorical canopy damage rating (n = 10), categorical ground char rating (n = 9), remotely
sensed severity (n = 4), and area burned (n = 2). Rather than restricting our analysis to
a single response or performing separate meta-analyses for each, we used correlation
and simple regression analysis to determine if any could be reasonably treated as sub-
stitutes for one another and combined in a single meta-analysis. This allowed inclusion
of a broader range of vegetation and treatment types in our meta-analysis, but also may
have introduced additional error, so we compared the results of our meta-analysis with
and without incorporating response variable substitution. Publications that reported
responses with metrics that could not be equated to others were reserved for potentialseparate meta-analyses, resulting in the exclusion of 13 additional publications from
the primary meta-analysis and a remainder of 19.
Data Extraction
Central to any meta-analysis is the calculation of effect sizes: dimensionless measures
of the magnitude of difference between treatment and control means reported in the
selected publications. Hedge’s d (Hedges and Olkin 1985) is the conventional effect size
metric for difference data (such as treatment-control comparisons), but the log response
ratio (Hedges and others 1999) has been found to be a more flexible metric for meta-
analysis of ecological and natural resource studies (Kopper and others 2009). The log
response ratio is calculated as a treatment mean divided by a control mean with the ratio
log transformed, and is the measure of effect size used in in the current application. Data
on responses and explanatory variables were extracted and effect sizes were calculated
for the 19 publications selected for inclusion in a step-wise analysis of heterogeneity
using MetaWin software (Rosenberg and others 2000).
Our primary hypothesis was that there would be broad differences in effects reported
from different types of ecosystems, as defined by general categories of geographic location
(Northwestern, Southwestern, and Eastern United States and outside of the continental
United States) and vegetation (long-needle conifer forests, mixed conifer forests, other
woodlands, and grasslands). We also hypothesized that fuel treatment effects would vary
among different types of fuel treatment. Treatments were categorized for comparisons
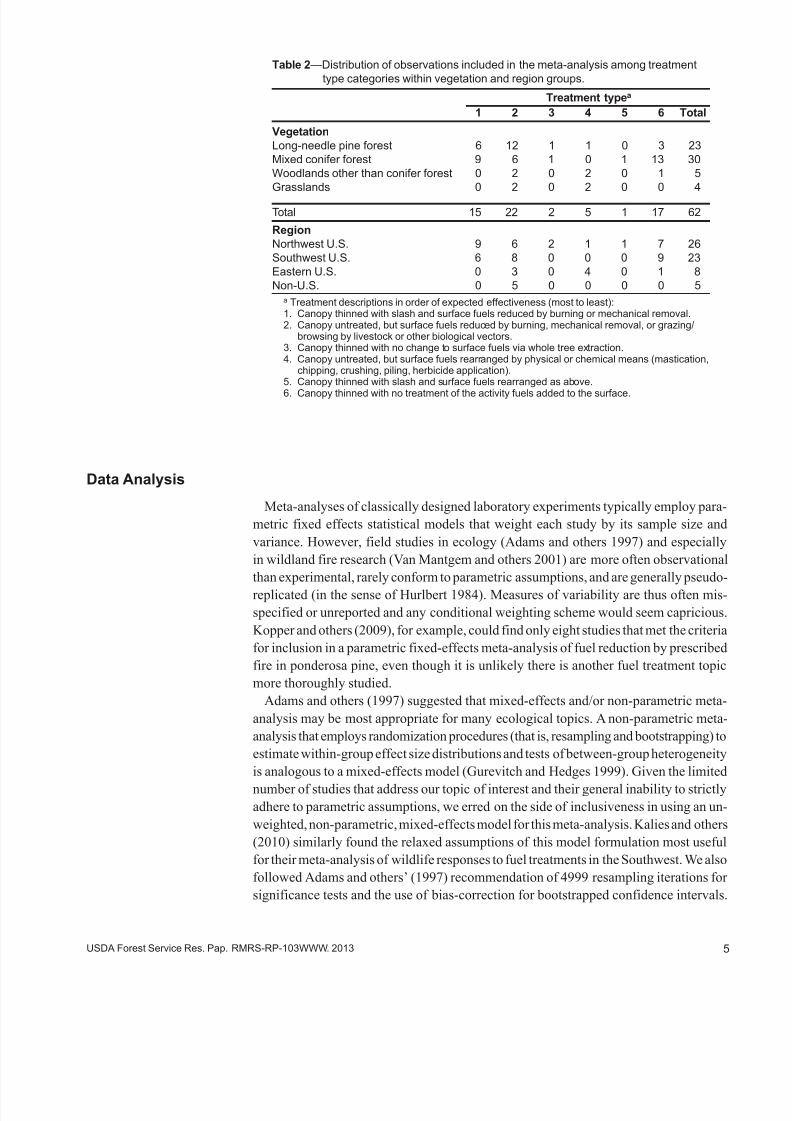
into six broad types based on expected change to canopy and surface fuels (table 2).
Many of the 19 studies selected for inclusion in the meta-analysis contained information
from more than one treatment type, and these were considered independent observations
such that a total of 62 were included; their distribution among vegetation, region, and
treatment categories is summarized in table 2 and listed along with reported responses
and calculated effect sizes in Appendix B. Any remaining variability in effect sizes
within the ecosystem and treatment categories was explored for relationships to treat-
ment age and treatment intensity, as indicated by changes to measured fuel conditions.
7/28/2019 Fuel Treatments and Fire Severity: A Meta-Analysis
http://slidepdf.com/reader/full/fuel-treatments-and-fire-severity-a-meta-analysis 7/40
5USDA Forest Service Res. Pap. RMRS-RP-103WWW. 2013
Data Analysis
Meta-analyses of classically designed laboratory experiments typically employ para-
metric fixed effects statistical models that weight each study by its sample size and
variance. However, field studies in ecology (Adams and others 1997) and especially
in wildland fire research (Van Mantgem and others 2001) are more often observational
than experimental, rarely conform to parametric assumptions, and are generally pseudo-replicated (in the sense of Hurlbert 1984). Measures of variability are thus often mis-
specified or unreported and any conditional weighting scheme would seem capricious.
Kopper and others (2009), for example, could find only eight studies that met the criteria
for inclusion in a parametric fixed-effects meta-analysis of fuel reduction by prescribed
fire in ponderosa pine, even though it is unlikely there is another fuel treatment topic
more thoroughly studied.
Adams and others (1997) suggested that mixed-effects and/or non-parametric meta-
analysis may be most appropriate for many ecological topics. A non-parametric meta-
analysis that employs randomization procedures (that is, resampling and bootstrapping) to
estimate within-group effect size distributions and tests of between-group heterogeneity
is analogous to a mixed-effects model (Gurevitch and Hedges 1999). Given the limitednumber of studies that address our topic of interest and their general inability to strictly
adhere to parametric assumptions, we erred on the side of inclusiveness in using an un-
weighted, non-parametric, mixed-effects model for this meta-analysis. Kalies and others
(2010) similarly found the relaxed assumptions of this model formulation most useful
for their meta-analysis of wildlife responses to fuel treatments in the Southwest. We also
followed Adams and others’ (1997) recommendation of 4999 resampling iterations for
significance tests and the use of bias-correction for bootstrapped confidence intervals.
Table 2—Distribution of observations included in the meta-analysis among treatment
type categories within vegetation and region groups.
Treatment typea
1 2 3 4 5 6 Total
Vegetation
Long-needle pine forest 6 12 1 1 0 3 23
Mixed conifer forest 9 6 1 0 1 13 30
Woodlands other than conifer forest 0 2 0 2 0 1 5
Grasslands 0 2 0 2 0 0 4
Total 15 22 2 5 1 17 62
Region
Northwest U.S. 9 6 2 1 1 7 26
Southwest U.S. 6 8 0 0 0 9 23
Eastern U.S. 0 3 0 4 0 1 8
Non-U.S. 0 5 0 0 0 0 5a Treatment descriptions in order of expected effectiveness (most to least):1. Canopy thinned with slash and surface fuels reduced by burning or mechanical removal.2. Canopy untreated, but surface fuels reduced by burning, mechanical removal, or grazing/
browsing by livestock or other biological vectors.3. Canopy thinned with no change to surface fuels via whole tree extraction.4. Canopy untreated, but surface fuels rearranged by physical or chemical means (mastication,
chipping, crushing, piling, herbicide application).
5. Canopy thinned with slash and surface fuels rearranged as above.6. Canopy thinned with no treatment of the activity fuels added to the surface.

7/28/2019 Fuel Treatments and Fire Severity: A Meta-Analysis
http://slidepdf.com/reader/full/fuel-treatments-and-fire-severity-a-meta-analysis 8/40
6 USDA Forest Service Res. Pap. RMRS-RP-103WWW. 2013
Nonetheless, an unweighted meta-analysis is more prone to bias from small studies.
We performed diagnostic checks for the potential influence of small study bias on our
meta-analysis with funnel plots and correlation analysis of study size versus effect size
(Rothstein and others 2005). However, statistical reporting is inconsistent across the
publications synthesized in our meta-analysis, including the definition of a sampling
unit. We therefore determined the apparent number of distinct treatment units sampled
for each study as the measure of its relative size for purposes of our bias diagnostics.
Parametric meta-analyses proceed with study segregation and tests for between-groupheterogeneity until within-group heterogeneity is no longer found to be significant or
there are no additional grouping variables available. But no statistical test for within-
group heterogeneity is available for non-parametric meta-analysis (Gurevitch and Hedges
1999). We instead relied on an information-theoretic approach (Burnham and Anderson
2002) to determine whether additional segregation within groups was warranted given
the information available. Specifically, additional segregation of studies within groups
was added only if it reduced model error when adjusted for degrees of freedom as cal-
culated by Akaiki’s Information Criterion ( AICc) corrected for small samples:
= ∗
+ 2 +2 + 1
− − 1 , [1]
where n is the number of observations, k is the number of parameters (that is, group
means) estimated, and Q is the maximum likelihood value for the meta-analytic model
(also known as the homogeneity statistic), calculated in an unweighted meta-analysis
as the sum of the squared errors for observed study effects when estimated from group
means (Rosenberg and others 2000).
Model selection proceeded in a step-wise fashion, initiating with the most informative
fully categorized main effect. The best model was determined at each step by compari-
son of Akaiki weights (w) representing the probability that a given model is the most
informative of those considered (Burnham and Anderson 2002):
!=
exp −∆! 2
exp−∆!2!
!!! , [2]
where Δi and Δr are differences between the AICc value for a given model and the mini-
mum AICc value found in the set of models considered at each selection step, and M
is the number of models considered at each selection step. The model with the greatest
Akaiki weight in each selection step was retained as the null model for the next step
until all available explanatory variables had been considered.
Results __________________________________________________________
Correlation Among Response VariablesPercent crown volume scorch was the most prevalent response variable reported in
studies of actual fuel treatment performance when subjected to fire. Within studies
that reported more than one response measure, strong correlations were found among
effect sizes calculated from percent crown scorch, scorch height, and canopy damage
ratings (table 3). All studies that reported responses in terms of one of these three vari-
ables were equated to a common measure of effect with the regression relationships
shown in figure 2. However, effect sizes were calculated from percent crown volume

7/28/2019 Fuel Treatments and Fire Severity: A Meta-Analysis
http://slidepdf.com/reader/full/fuel-treatments-and-fire-severity-a-meta-analysis 9/40
7USDA Forest Service Res. Pap. RMRS-RP-103WWW. 2013
scorch for most (77%) of the studies included in the meta-analysis. Effect sizes were
calculated from canopy damage ratings for three studies from prescribed burns in north-
western long-needled pine forests and one study from a prescribed burn in an eastern
long-needled pine forest. Effect sizes were calculated from scorch height for the one
study of surface fuel rearrangement in a long-needled pine forest, as they were for all
studies in woodlands and grasslands by conversion of flame length measurements on
experimental fires to potential scorch heights using relationships developed by Byram
(1959) and Van Wagner (1973). The influence of these effect size substitutions on the
final meta-analytic model is subsequently discussed.
Distribution of Fuel Treatment Effect Sizes
Fuel treatment effect sizes varied widely among the studies included in the meta-analysis
(figure 3), but the overall mean is large (0.90) and significant with a 95% confidence
interval that does not include zero (1.32 to 0.56). Effect sizes ranged from 6.72 to 2.89
with 14 observations (22.5% of the total) demonstrating a negligible treatment effect,
defined by convention as an absolute effect size less than 0.20 (Cohen 1988). Observa-
tions of non-negligible effects were mostly in the intended direction (43 of 48 [90%]) and
Table 3—Cross-correlation matrix for effect sizes derived from studies that reported multiple response
variables. Number of contrasts for each pair of variables is in parentheses, and significant (p<0.05)
correlation coefficients are emboldened.
Response % scorch scorch ht char ht ratinga mortality intensity
%scorch 1
scorch ht 0.78 (34) 1
char ht 0.54 (32) 0.45 (30) 1
ratinga 0.78 (33) 0.78 (29) 0.69 (26) 1
mortality 0.56 (7) 0.80 (4) 0.40 (3) na (0) 1intensity 0.98 (3) na (0) na (0) na (0) 0.99 (3) 1
aRating of canopy damage based on scorch and/or consumption.
Figure 2—Regression relationships to equate effect sizes calculated from (a) scorch height
and (b) canopy damage ratings to effect sizes calculated from percent canopy scorch.

7/28/2019 Fuel Treatments and Fire Severity: A Meta-Analysis
http://slidepdf.com/reader/full/fuel-treatments-and-fire-severity-a-meta-analysis 10/40
8 USDA Forest Service Res. Pap. RMRS-RP-103WWW. 2013
these tended to be large (22 of 43 effect sizes <-0.8). Just one observation demonstrated
a large counter-productive treatment effect, that is, a positive effect size greater than 0.8,
indicating more extreme fire behavior in the treated areas as compared to surrounding
untreated areas. Paired photographs representing a range of effect sizes corresponding
to those presented here are shown in figure 4, and additional examples from treatments
sampled by Omi and Martinson (2002) and Omi and others (2006) are available online
(http://omiassociates.net/fueltreatment/) along with a database selection tool.
Figure 3—Distribution of fuel treatment effect sizes calculated from the 19 publications included in themeta-analysis, distinguished by the characteristics found to be most informative from the model selection
process. Legend abbreviations are: cone = conifer forest, wood = woodland other than conifer forest, grass
= grassland, C = canopy thin, HC = heavy thin, LC = light thin, Rx = recent surface fuel reduction, and S =
surface fuel treatment other than recent reduction. Negative effect sizes indicate lower fire intensity/sever-
ity in areas that received fuel treatment. Effect sizes are arranged from top to bottom in order of increasing
absolute difference from zero, or no effect. Additional details and literature citations for the referenced data
sources are provided in the appendices.

7/28/2019 Fuel Treatments and Fire Severity: A Meta-Analysis
http://slidepdf.com/reader/full/fuel-treatments-and-fire-severity-a-meta-analysis 11/40
9USDA Forest Service Res. Pap. RMRS-RP-103WWW. 2013
F i g u r e 4 — P i c t o r i a l r
e p r e s e n t a t i o n o f a r a n g e o f e f f e c t s i z e s
c o r r e s p o n d i n g t o t h o s e u s e d t o s t a n d a r d i z e s t u d y f i n d i n g s f o r t h e c u r r e n t m e
t a - a n a l y s i s . P h o t o s i n t h e
t o p r o w a r e o f t r e a t e d a r e a s a d j a c e n t a n d t o p o g r a p h i c a l l y s i m i l a r t o t h e u n t r e a t e d a r e a s p i c t u r e d i n
t h e b o t t o m r o w w i t h b o t h a f f e c t e d b y w
i l d f i r e i n t h e s a m e b u r n i n g
p e r i o d ( O m i a n d M a r t i n s o n 2 0 0 2 , O m i a n d o t h e r s 2 0 0 6 ) :
( a ) m e c h a n i c a l t h i n w
i t h s l a s h y a r d e d a n d b u r n e d i n 2 0 0 1 w
i t h i n t h e 2 0 0 3 D a v i s F i r e i n O r e g o n
( b ) m e c h a n i c a l t h i n w
i t h s l a s h p i l e d a n d b u r n e d i n 2 0 0 2 w i t h i n t h e 2 0 0 4 F i s c h e r F i r e i n W a s h i n g t o n
( c ) 1 9 9 4 u n d e r b u r n w i t h i n t h e 2 0 0 4 P o w e r F i r e i n C a l i f o r n i a
( d ) b l o w d o w n f u e l s y
a r d e d a n d b u r n e d i n 1 9 9 7 w i t h i n t h e 1 9 9 9 M e g r a m F i r e i n C a l i f o r n i a
( e ) m e c h a n i c a l t h i n w
i t h n o s l a s h t r e a t m e n t w i t h i n t h e 2 0 0 0
C e r r o G r a n d e F i r e i n N e w M e x i c o
( f ) m e c h a n i c a l t h i n w
i t h n o s l a s h t r e a t m e n t w i t h i n t h e 2 0 0 3 A s p e n F i r e i n A r i z o n a

7/28/2019 Fuel Treatments and Fire Severity: A Meta-Analysis
http://slidepdf.com/reader/full/fuel-treatments-and-fire-severity-a-meta-analysis 12/40
10 USDA Forest Service Res. Pap. RMRS-RP-103WWW. 2013
Model Selection
The goal of our meta-analysis was to identify the most informative organizing char-
acteristics of fuel treatment studies to explain the variability in reported findings. Study
characteristics considered were ecosystem and treatment conditions defined in terms of:
vegetation, geographic region, treatment type, treatment age, and treatment intensity.
Vegetation Type
Most studies of fuel treatment effectiveness that met our study selection criteria
were conducted in conifer forests (85%), with nearly half of those in long-needle pine
systems (table 2). Just five studies were identified from grassland ecosystems and only
four from woodlands other than conifer forests. Initial model selection suggested that
the most informative study segregation was by these vegetation types (w>0.99, rela-
tive to a maximum possible value of 1.0) when compared to grouping studies only by
geographic region or treatment type (table 4, step 1). Three study grouping schemes by
vegetation type were then considered: separating grasslands from non-grasslands (table
4, step 2.a), further separating non-grasslands into conifer forests and other woodlands
(table 4, step 2.b), and further separating long-needled pine from other conifer forests
(table 4, step 2.c). The model with three vegetation groups (grassland, conifer forest,
and other woodlands) had the most support in the data (w = 0.54), while the model that
further distinguished long-needled-pine from other conifer forests had the least support
(w = 0.17).
Geographic Region
The fuel treatment studies included in our synthesis were concentrated in the western
United States (79%), with these divided roughly evenly between northwest and south-
west (distinguished approximately by the 40th parallel). Eight studies were identified
from east of the Rocky Mountains and five from outside of the continental United
States (Portugal and Australia). We next assessed whether there was support in the
data for adding these regional groupings within the selected vegetation groupings for
grasslands, conifer forests, and other woodlands. We first separated studies conducted
in the continental United States from those that were not (table 4, step 3.a), then sepa-
rated the western United States from the eastern (step 3.b), and finally northwest from
southwest (step 3.c). However, the data did not support a more refined separation of
studies than simply continental United States versus non-United States (w = 0.40), and
the second best model for a regional effect was the null (table 4, step 3.0). Treatments
in conifer forests appear to perform better in the United States (lower 95% confidence
interval<mean effect size<upper 95% confidence interval = 1.25<0.85<0.56) than else-
where (0.11<0.06<0.00), while treatments in woodlands performed better outside the
United States (1.70<1.02<0.34) than within (0.27<1.23<2.89). However, any regional
influence on treatment effectiveness proved uninformative upon inclusion of treatmenttype and age as explanatory variables (table 4, step 5.c).

7/28/2019 Fuel Treatments and Fire Severity: A Meta-Analysis
http://slidepdf.com/reader/full/fuel-treatments-and-fire-severity-a-meta-analysis 13/40
11USDA Forest Service Res. Pap. RMRS-RP-103WWW. 2013
Table 4—Selection of most informative meta-analytic model for fuel treatment effect sizes: variables included (Model), the
homogeneity statistic (Q), number of estimated parameters (k ), Akaiki’s Information Criterion ( AICc ), and probability
(w ) of each model being the most informative of those considered at each step in the selection process. The model
selected from each step is emboldened and italicized and was included as the null for the subsequent step.
Model Q k AICc w
Step 1: Most informative main effect
null 140.07 1 52.60 0.00
Region (R) 133.93 4 56.45 0.00
Treatment (T) 123.79 6 56.40 0.00
Vegetation (V) 100.42 4 38.60 1.00
Step 2: Vegetation categories
a) V(g = grassland) x V(w+c = non-grassland) 106.28 2 37.62 0.28
b) V(g) x V(w = woodland) x V(c = conifer forest) 100.44 3 36.32 0.54
c) V(g) x V(w) x V(cm = mixed conifer) x V(cp = long-needle pine) 100.42 4 38.60 0.17
Step 3: Geographic categories
0) V* = V(g) x V(w) x V(c) x R( null) 100.44 3 36.32 0.33
a) V* x R(US = United States) x R(xUS = non-US) 92.64 5 35.97 0.40
b) V* x R(xUS) x R(USw = west of Rocky Mountains) x R(USe = eastern US) 91.02 6 37.33 0.20
c) V* x R(xUS) x R(USe) x R(USnw = north of 40th parallel) x R(USsw = Southwest) 90.68 7 39.65 0.06
Step 4: Treatment types
0) V* x R* = R(US) x R(xUS) x T(null) 92.64 5 35.97 0.02
a) V* x R* x T(c = canopy thin) x T(no c) 92.24 6 38.16 0.01
b) V* x R* x T(s = surface treatment) x T(no s) 86.56 6 34.90 0.03
c) V* x R* x T(c&s) x T(c or s) 83.93 6 32.30 0.10
d) V* x R* x T(c) x T(s) x T(c&s) 82.58 7 34.59 0.03
e) V* x R* x T(c) x T(s- = reduce) x T(c&s-) x T(so = other surface treatment) 71.33 8 28.31 0.73
f) V* x R* x T(c) x T(s+) x T(s-) x T(c&so) x T(c&s-) 71.77 9 32.35 0.10
Step 5: Treatment age
0) V* x R* x T* = T(c) x T(so
) x T(s-) x T(c&s-) x age(null) 71.33 8 28.31 0.07
a) V* x R* x T* x T(10s- = recent surface fuel reduction) 66.92 9 27.18 0.13
b) V* x R* x T* x T(10s-) x T(10c = recent thin) 66.93 9 27.19 0.13
c) V* x T* X T(10s-) 67.88 8 24.34 0.52
d) V* x T* X T(10s-) x T(c&so) 67.69 9 26.90 0.15
e) V* x T* x T(ages- = age of surface reduction) 74.46 9 32.81 0.01
Step 6: Treatment intensity
0) V* x T* = T(c) x T(so) x T(10s-) x T(c&10s-) x Ti = treatment intensity(null) 67.88 8 24.34 0.00
a) V* x T* x Ti(c&10s-) 40.61 9 -3.28 0.00
b) V* x T* x Ti (10s-) x Ti (c&10 s-) 43.30 10 9.11 0.00
c) V* x T* x T(ch=heavy thin&10s-) 40.64 8 -7.47 0.00
d) V* x T* x Ti (ch&10s-) 31.42 9 -20.69 0.11
e) V* x T* x Ti(c) x Ti (ch&10s-) 31.09 10 -4.70 0.00
f) V* x T( 10 s-) x T i (c h&10 s-) x T(- 10 s- = treated w/o recent surface reduction) 30.73 8 -24.80 0.89

7/28/2019 Fuel Treatments and Fire Severity: A Meta-Analysis
http://slidepdf.com/reader/full/fuel-treatments-and-fire-severity-a-meta-analysis 14/40
12 USDA Forest Service Res. Pap. RMRS-RP-103WWW. 2013
Treatment Type
Different treatment types varied in prevalence among vegetation types and geographic
regions (table 2). Reduction of natural fuels (treatment type 2), primarily by underburn-
ing, was the most common treatment overall (35%), but concentrated in long-needle
pine forests (55%), while fairly evenly distributed across all regions. Canopy thinning
without subsequent treatment of activity fuels (type 6) was the next most common
treatment (27%), but concentrated in mixed conifer forests (74%) and roughly evenly
divided between the northwest and southwest regions of the continental United States.Canopy thinning followed by reduction of activity and natural surface fuels (type 1) was
somewhat less common overall (24%) but more prevalent in the northwest region (60%)
and in mixed conifer forests (60%). The remaining 14% of the observations included in
our analysis were scattered scantily among the other treatment types and across vegeta-
tion and region categories, though it is notable that rearrangement of natural fuels (type
4) was concentrated in non-conifer systems east of the Rocky Mountains.
Given the grouping of studies among the three vegetation types in U.S. ecosystems
versus non-U.S. ecosystems, we next explored further distinguishing observations of
treatment performance by treatment type (table 4, step 4). We first considered the sim-
plest models of treatment type by separating studies into two groups based on the fuel
strata treated (steps 4a-c): (a) canopy (table 2 treatment types 1, 3, 5, and 6 versus types2 and 4), (b) surface (types 1, 2, 4, and 5 versus types 3 and 6), and (c) canopy plus
surface (types 1 and 5 versus types 2, 3, 4, and 6). Next, we grouped studies into three
treatment categories (table 4, step 4.d): canopy plus surface treatment (table 2, types
1 and 5), canopy treatment-only (types 3 and 6), and surface treatment-only (types 2
and 4). Finally, we distinguished between surface treatments that result in fuel reduc-
tion (types 1 and 2) versus rearrangement (types 4 and 5). The most informative model
(w = 0.73) included four treatment groups (table 4, step 4.e): canopy thin with surface
fuel reduction (type 1), surface fuel reduction-only (type 2), canopy thin without surface
fuel reduction regardless of whether the slash was otherwise rearranged (types 3, 5, and
6), and surface rearrangement-only (type 4). There are currently not enough studies to
support a separation of whole-tree extraction from slash rearrangement or simply letting
it lay (table 4, step 4.f: w = 0.10). The one study of thinning-only in a deciduous forest
was grouped with the two studies of surface fuel rearrangements in that vegetation type,
as the effect sizes were similar (0.80 versus 0.00<1.45<2.89).
Treatment Age
The median age of the treatments included in our synthesis was 3 years old when
tested by fire, with a maximum of 20 years old in conifer forests, 8 years old in other
woodlands, and 2 years old in grasslands. Treatments involving rearrangement of surface
fuels were the most recent (median age of less than 1 year), followed by surface fuel
reduction treatments (median age of 2.5 years). Canopy-only treatments were generally
oldest when affected by fire with a median age of 5 years.
We considered several variations of treatment age to further explain remaining vari-
ability within conifer forests, including surface reduction treatments categorized as
recent (less than 10 years) or old (table 4, step 5.a), both surface reduction treatments
and canopy treatments categorized as recent or old (table 4, step 5.b), and age of surface
reduction as a continuous predictor of treatment effect size (table 4, step 5.e). The sepa-
ration of old and new at approximately 10 years was apparent from visual inspection

7/28/2019 Fuel Treatments and Fire Severity: A Meta-Analysis
http://slidepdf.com/reader/full/fuel-treatments-and-fire-severity-a-meta-analysis 15/40
13USDA Forest Service Res. Pap. RMRS-RP-103WWW. 2013
of the scatter plot of effect size versus treatment age (figure 5) and was the break point
that minimized model error and AICc.
The most informative treatment age model distinguished recent surface reduction
treatments in conifer forests from those older than 10 years, with older surface reduc-
tion treatments then grouped with surface rearrangement treatments (table 4, step 5.a).
The model was further improved by removing the regional distinction between U.S.
and non-U.S. studies (table 4, step 5.c: w = 0.52). Distinguishing slash treatments by
any method other than recent reduction remained unsupported given the available data(table 4, step 5.d), thus treatment types 3, 5, and 6 from table 2 were grouped together
along with those treatments of type 1 that were more than 10 years old. Treatment age
was not explored as a predictor of effect size in grasslands and woodlands due to the
paucity of available studies within treatment categories and the limited range of treat-
ment ages that have been investigated in these vegetation types. Mean effect sizes with
95% confidence intervals for the three vegetation groups and separated by the selected
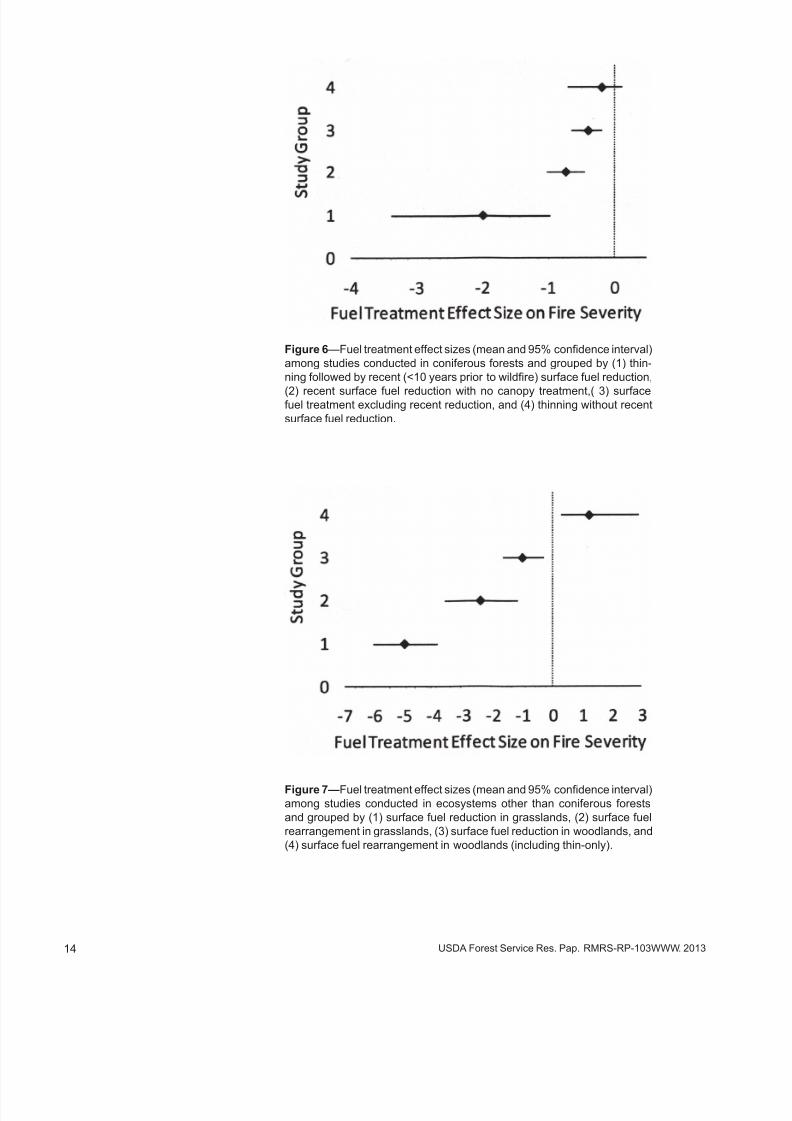
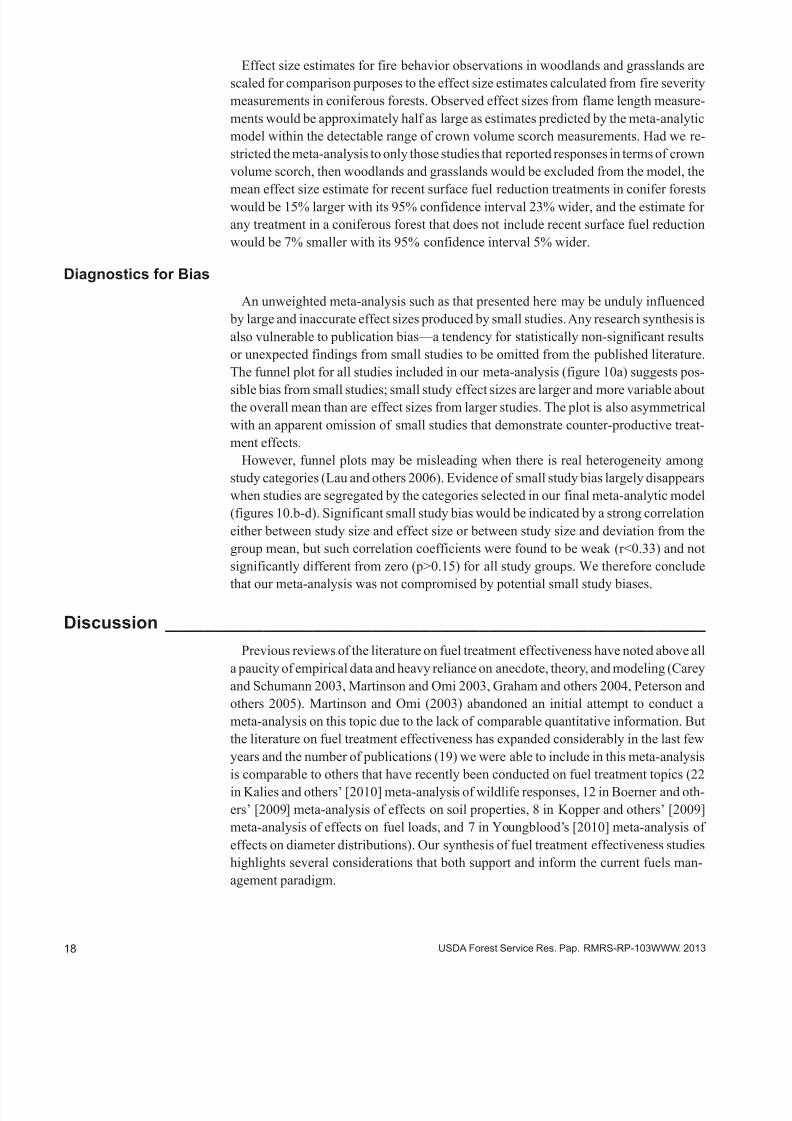
treatment type and age categories are displayed in figure 6 for coniferous forests and in
figure 7 for grasslands and woodlands.
Figure 5—Fuel treatment effect size versus treatment age distinguished by treat-
ment type among studies conducted in coniferous forests.
7/28/2019 Fuel Treatments and Fire Severity: A Meta-Analysis
http://slidepdf.com/reader/full/fuel-treatments-and-fire-severity-a-meta-analysis 16/40
14 USDA Forest Service Res. Pap. RMRS-RP-103WWW. 2013
Figure 6—Fuel treatment effect sizes (mean and 95% confidence interval)
among studies conducted in coniferous forests and grouped by (1) thin-
ning followed by recent (<10 years prior to wildfire) surface fuel reduction,
(2) recent surface fuel reduction with no canopy treatment,( 3) surface
fuel treatment excluding recent reduction, and (4) thinning without recent
surface fuel reduction.
Figure 7—Fuel treatment effect sizes (mean and 95% confidence interval)
among studies conducted in ecosystems other than coniferous forests
and grouped by (1) surface fuel reduction in grasslands, (2) surface fuel
rearrangement in grasslands, (3) surface fuel reduction in woodlands, and
(4) surface fuel rearrangement in woodlands (including thin-only).

7/28/2019 Fuel Treatments and Fire Severity: A Meta-Analysis
http://slidepdf.com/reader/full/fuel-treatments-and-fire-severity-a-meta-analysis 17/40
15USDA Forest Service Res. Pap. RMRS-RP-103WWW. 2013
Treatment Intensity
Finally, we investigated whether our meta-analytic model would be improved by
including a measure of treatment intensity. We considered four measures of treatment
intensity for studies conducted in conifer forests: treatment effect size (log response
ratio) on residual tree diameter, effect size on height to canopy, effect size on canopy
bulk density, and a composite measure of treatment intensity calculated as the average
of treatment effect sizes on all of the above (with the effect on canopy bulk density
inverted). As a point of reference, untreated stands had an average tree diameter of 25.3 cm, an average height to canopy of 4.7 m, and an average canopy bulk density
of 0.11 kg/m3. Though treatment effects on surface fuels likely would be an informa-
tive measure of treatment intensity as well, pre-wildfire loadings generally cannot be
reconstructed in retrospective studies (Martinson and Omi 2008) and were not reported
with enough consistency to include in our synthesis (n<5 for all treatment categories).
Recent surface reduction treatments preceded by canopy thinning produced the
greatest change in all measures of treatment intensity (MES = 0.51, 0.73, and -0.93 for
residual tree diameter, height to canopy, and canopy bulk density, respectively, with all
95% confidence intervals excluding zero). The best predictor of this treatment type’s
effect on crown scorch metrics of wildfire severity was the composite that combined
all three measures (r 2 = 0.62, versus 0.43 for residual diameter, 0.36 for canopy bulk density, and 0.26 for height to canopy). Thinning followed by surface fuel reduction on
average increased mean tree diameter by 16.8 cm (range in percent change = 11% to
228%), raised height to canopy by 5.0 m (range in percent change = 0% to 267%), and
reduced canopy bulk density by 0.07 kg/m3 (range in percent change = 78% to 6%).
Recent surface reduction without canopy treatment was found to increase both residual
tree diameters (mean effect size [MES] = 0.22) and height to live canopy (MES = 0.42)
by significant amounts (95% confidence interval does not include zero), though the
differences in tree diameters had the strongest relationship to differences in wildfire
severity for this treatment type (r 2 = 0.28 versus r 2<0.04 for all other measures of treat-
ment intensity). Recent surface reduction treatments on average effectively increased
mean tree diameter by 6.2 cm (range in percent change = 15% to 95%) and heightto canopy by 2.5 m (range in percent change = 11% to 828%).
Canopy treatments not followed by recent surface reduction significantly increased
residual tree diameters (MES = 0.22) and decreased canopy bulk density (MES = 0.74),
but no measure of treatment intensity demonstrated a relationship to wildfire severity
for this treatment type (all r 2<0.06 with canopy bulk density marginally strongest).
These treatments on average increased mean tree diameter by 6.2 cm (range in percent
change = 11% to 112%) and reduced canopy bulk density by 0.06 kg/m3 (range in per-
cent change = 93% to 70%).
Surface treatments other than recent fuel reduction and not preceded by canopy thin-
ning had no significant effect on any measure of treatment intensity, and these were
not assessed for a relationship to wildfire severity due to the small number of available
studies in this treatment category (n = 3 that included treatment intensity data).
The best measure of treatment intensity for each treatment type was then considered
for inclusion in the overall meta-analytic model (table 4, steps 6.a-b, e). Visual inspection
of the scatter plots of treatment intensity effect sizes versus fire severity effect sizes also
suggested a threshold effect for the thinning followed by surface reduction treatment
type, such that studies with a composite intensity value less than 0.80 (a change to a

7/28/2019 Fuel Treatments and Fire Severity: A Meta-Analysis
http://slidepdf.com/reader/full/fuel-treatments-and-fire-severity-a-meta-analysis 18/40
16 USDA Forest Service Res. Pap. RMRS-RP-103WWW. 2013
less hazardous condition of approximately 125%, as measured by the combination of
tree diameter, height to canopy, and canopy bulk density) appear to perform more like
surface reduction-only treatments (figure 8).
The most informative treatment intensity models distinguished “heavy” thinning
from “light” thinning (table 4, step 6.c), grouped light thinning with no thinning when
followed by recent surface fuel reduction, and included the composite indicator of treat-
ment intensity as a continuous predictor of the effectiveness of heavy thinning treatments
that were followed by recent surface fuel reduction (table 4, step 6.d). The final modelselected (table 4, step 6.f: w = 0.89) also grouped thinning treatments not followed by
recent surface fuel reduction with surface treatments in conifer forests other than those
involving recent reduction (that is, rearrangement or reduction treatments more than
10 years old). While there appears to be some relationship between the effect of recent
surface reduction on residual tree diameter and subsequent fire severity (figure 8.a), it is
not strong enough to support inclusion in the overall model (table 4, step 6.b: w = 0.00).
Figure 8—Scatter plots for studies conducted in coniferous forests that included recent surface reduction
treatments showing fuel treatment effect sizes on fire severity versus two measures of treatment intensity;
(a) effect size on residual tree diameter and (b) a composite of effect sizes on residual tree diameter (DBH),
height to canopy (CBH), and inverted canopy bulk density (-CBD). Surface reduction treatments are distin-guished by whether they were preceded by “heavy” thinning (composite measure of intensity≥0.8), “light”
thinning (composite intensity<0.8), or no thinning.

7/28/2019 Fuel Treatments and Fire Severity: A Meta-Analysis
http://slidepdf.com/reader/full/fuel-treatments-and-fire-severity-a-meta-analysis 19/40
17USDA Forest Service Res. Pap. RMRS-RP-103WWW. 2013
Final Model Parameterization
The last model displayed at the bottom of table 4 was the final model selected for our
meta-analysis of the literature on fuel treatment effectiveness; it is highly significant
(p < 0.001) and explains 78% of the variability in reported findings (figure 9). The
parameterized final model may be expressed as:
ŷ = ‐0.36 ‐ 0.32T( 10s‐) + 6.11T(ch+10s‐) ‐ 9.43T(ch+10s‐) * T i
+ 1.59V(w) – 1.93V(w) * T( 10s‐) – 2.07V(g) – 2.24V(g) * T( 10s‐),
[3]
where ŷ is the estimated fire severity effect size expressed as the natural log of the
ratio of percent crown volume scorch in a treated area to crown scorch in an adjacent
and topographically similar untreated area; T( 10 s-) is an indicator variable equal to 1
for surface fuel reduction treatments completed less than 10 years prior to a wildfire;
T(ch+10 s-) is an indicator variable equal to 1 for surface fuel reduction treatments
completed less than 10 years prior to a wildfire and preceded by heavy thinning such
that T i is at least 0.8; T i is a measure of thinning intensity calculated as the average of
the treatment effect sizes on mean residual tree diameter, height to canopy, and canopy
bulk density with the latter multiplied by -1;V(w) is an indicator variable equal to 1 for woodlands other than conifer forests; and V(g) is an indicator variable equal to 1 for
grasslands. The intercept value of 0.36 thus represents the expected effect size when all
indicator variables are equal to zero, that is, any treatment in a conifer forest that does
not include recent surface fuel reduction.
Figure 9—Predicted versus observed fuel treatment effect sizes on fire severity (negative values
indicate lower severity in a treated area). Legend abbreviations are: cone = conifer forest, wood =
woodland other than conifer forest, grass = grassland, C = canopy thin, HC = heavy thin, LC = light
thin, Rx = recent surface fuel reduction, and S = surface fuel treatment other than recent reduction.
7/28/2019 Fuel Treatments and Fire Severity: A Meta-Analysis
http://slidepdf.com/reader/full/fuel-treatments-and-fire-severity-a-meta-analysis 20/40
18 USDA Forest Service Res. Pap. RMRS-RP-103WWW. 2013
Effect size estimates for fire behavior observations in woodlands and grasslands are
scaled for comparison purposes to the effect size estimates calculated from fire severity
measurements in coniferous forests. Observed effect sizes from flame length measure-
ments would be approximately half as large as estimates predicted by the meta-analytic
model within the detectable range of crown volume scorch measurements. Had we re-
stricted the meta-analysis to only those studies that reported responses in terms of crown
volume scorch, then woodlands and grasslands would be excluded from the model, the
mean effect size estimate for recent surface fuel reduction treatments in conifer forestswould be 15% larger with its 95% confidence interval 23% wider, and the estimate for
any treatment in a coniferous forest that does not include recent surface fuel reduction
would be 7% smaller with its 95% confidence interval 5% wider.
Diagnostics for Bias
An unweighted meta-analysis such as that presented here may be unduly influenced
by large and inaccurate effect sizes produced by small studies. Any research synthesis is
also vulnerable to publication bias—a tendency for statistically non-significant results
or unexpected findings from small studies to be omitted from the published literature.
The funnel plot for all studies included in our meta-analysis (figure 10a) suggests pos-
sible bias from small studies; small study effect sizes are larger and more variable about
the overall mean than are effect sizes from larger studies. The plot is also asymmetrical
with an apparent omission of small studies that demonstrate counter-productive treat-
ment effects.
However, funnel plots may be misleading when there is real heterogeneity among
study categories (Lau and others 2006). Evidence of small study bias largely disappears
when studies are segregated by the categories selected in our final meta-analytic model
(figures 10.b-d). Significant small study bias would be indicated by a strong correlation
either between study size and effect size or between study size and deviation from the
group mean, but such correlation coefficients were found to be weak (r<0.33) and not
significantly different from zero (p>0.15) for all study groups. We therefore conclude
that our meta-analysis was not compromised by potential small study biases.
Discussion _______________________________________________________
Previous reviews of the literature on fuel treatment effectiveness have noted above all
a paucity of empirical data and heavy reliance on anecdote, theory, and modeling (Carey
and Schumann 2003, Martinson and Omi 2003, Graham and others 2004, Peterson and
others 2005). Martinson and Omi (2003) abandoned an initial attempt to conduct a
meta-analysis on this topic due to the lack of comparable quantitative information. But
the literature on fuel treatment effectiveness has expanded considerably in the last few
years and the number of publications (19) we were able to include in this meta-analysis
is comparable to others that have recently been conducted on fuel treatment topics (22
in Kalies and others’ [2010] meta-analysis of wildlife responses, 12 in Boerner and oth-
ers’ [2009] meta-analysis of effects on soil properties, 8 in Kopper and others’ [2009]
meta-analysis of effects on fuel loads, and 7 in Youngblood’s [2010] meta-analysis of
effects on diameter distributions). Our synthesis of fuel treatment effectiveness studies
highlights several considerations that both support and inform the current fuels man-
agement paradigm.

7/28/2019 Fuel Treatments and Fire Severity: A Meta-Analysis
http://slidepdf.com/reader/full/fuel-treatments-and-fire-severity-a-meta-analysis 21/40
19USDA Forest Service Res. Pap. RMRS-RP-103WWW. 2013
Figure 10—Funnel plots of study size versus effect size: (a) across all studies, (b) among studies in conifer-
ous forests that included recent surface fuel reduction not preceded by heavy thinning, (c) among studies in
coniferous forests treated by any means that did not include recent surface fuel reduction, and (d) among the
less well-studied groups not included in (b) or (c). The asymmetrical form of (a) is suggestive of publication
bias in the fuel treatment literature, but also appears to be explained by the study grouping selected for the final
meta-analytical model. Legend abbreviations are: cone = conifer forest, wood = woodland other than conifer
forest, grass = grassland, C = canopy thin, HC = heavy thin, LC = light thin, Rx = recent surface fuel reduction,
and S = surface fuel treatment other than recent reduction.
We found that the overall mean effect of fuel treatments on fire responses is large and
significant, equating to a reduction in canopy volume scorch from 100% in an untreated
stand to 40% in a treated stand, a reduction in scorch height from 30.5 m to 16.1 m, or an inferred reduction in flame length from 3.4 m to 2.1 m. But our synthesis demon-
strates that fuel treatments vary widely in effectiveness, which is largely explained by
vegetation and treatment type.
Treatments have proved most effective in grasslands and in conifer forests that were
heavily thinned and subsequently burned, while the least effective treatments have been
mechanical rearrangements in woodlands. The extreme case of treatment effectiveness
observed a reduction in crown volume scorch from 83% in untreated mixed conifer

7/28/2019 Fuel Treatments and Fire Severity: A Meta-Analysis
http://slidepdf.com/reader/full/fuel-treatments-and-fire-severity-a-meta-analysis 22/40
20 USDA Forest Service Res. Pap. RMRS-RP-103WWW. 2013
forest to less than 1% in an adjacent stand that was thinned and burned one year previ-
ously (an effect size 7.5 times larger than the overall mean). The extreme case of treat-
ment ineffectiveness reported an increase in flame length from 25 cm in untreated oak
woodland to 74 cm in adjacent fuels treated by mechanical mastication (an effect size
3.2 times greater than the mean and in the opposite direction).
The relative effectiveness of treatments in grasslands, conifer forests, and woodlands
is as would be expected from the hypothesis that treatments will be most effective where
available fuel accumulates most rapidly and where fire was historically most frequent, based on coarse fire regime constructs (such as Schmidt and others 2002). However,
we were surprised to find no differences in fuel treatment effectiveness between long-
needle pine and mixed conifer forests or between the northern and southern latitudes of
the western United States. This suggests that fuel treatment effectiveness may be less
sensitive to climatic gradients in western forests than has been proposed in previous
reviews (Schoennagel and others 2004), though it should be noted that none of the studies
included in our synthesis extended into the upper elevations or latitudes dominated by
short-needle conifers where fire was historically least frequent. One anecdote from such
systems indicates that thinning may exacerbate fire behavior (Alexander and Lanoville
2004), but data have not been presented that could be included in our synthesis.
That no relationship (r 2<0.06) was found between canopy fuel variables and the ef-fectiveness of either surface reduction treatments without thinning or thinning treatments
without subsequent slash treatment supports the assertion that surface fuel reduction is
of primary importance in influencing treatment effectiveness. Much of the variability
within these treatment types would likely be explained by the amount of change in
surface fuels that was actually produced, but surface fuels information was not reported
with enough consistency to include in our synthesis.
However, it is notable that more often than not, thin-only treatments have been found
to moderate fire responses in spite of the addition of slash fuels to the surface, though
to a lesser degree than surface reduction treatments with or without prior thinning. Just
5 of the 18 studies of untreated slash (including the one where slash was left in piles)
reported a counter-productive treatment effect, as compared to 1 of 3 studies of masti-cated fuels, 1 of 3 studies of underburns more than 10 years old, and 1 of 17 studies of
more recent surface fuel reduction treatments (figure 3). The effectiveness of thin-only
treatments likely depends on whether fire enters the treated stand as an active crown
fire or as a surface fire, as the additional surface fuels increase the likelihood of torch-
ing, but the more open canopy reduces the likelihood of sustained crown fire (Scott
and Reinhardt 2001).
The best available predictor of the effectiveness of surface reduction treatments was
residual tree diameter. This variable was also included along with canopy variables as a
predictor of the effectiveness of treatments that combined thinning and burning. Thus,
Agee and Skinner’s (2005) recommendation to favor retaining large trees over small
ones in order to improve the fire resistance of treated stands is supported. Thinning fol-lowed by surface fuel reduction was found to be the most effective type of treatment,
as expected, but the added benefit of thinning appears to depend upon achieving a sub-
stantial change to canopy fuel conditions. A threshold was identified for the effective-
ness of these combination treatments; those that achieved at least a 100% change to a
less hazardous stand condition increased in effectiveness as fuel hazard decreased (as
measured by the average change to mean tree diameter, height to canopy, and canopy
bulk density). Lighter thinning treatments that reduced canopy fuel hazard by less than

7/28/2019 Fuel Treatments and Fire Severity: A Meta-Analysis
http://slidepdf.com/reader/full/fuel-treatments-and-fire-severity-a-meta-analysis 23/40
21USDA Forest Service Res. Pap. RMRS-RP-103WWW. 2013
125% appear to perform no differently than surface fuel reduction treatments that did
not include any mechanical thinning (figure 8). Based on average conditions in the rep-
resented untreated stands, the necessary thinning intensity to achieve any benefit beyond
what would be produced by the surface treatment alone corresponds to an increase in
mean tree diameter from 19 cm to 42 cm, an increase in height to canopy from 4 m to
9 m, and a decrease in canopy bulk density from 0.09 kg/m3 to 0.04 kg/m3. We hasten
to caution against any inference of thinning effectiveness beyond the data included in
our meta-analysis and note that further reductions in canopy fuel hazard beyond 150%would be of marginal practical value even when followed by treatment of the slash,
corresponding to a reduction in expected crown volume scorch in the treated area from
5% to something less. Also, no relationship was found between thinning intensity and
subsequent fire response among the thin-only treatments, suggesting that any benefit
from the reduction in canopy fuels is largely offset by the increase in surface fuels until
they are reduced as well.
Management Implications
The results of this meta-analysis add empirical support for the basic principles of
fuels management proposed by Agee and Skinner (2005) that emphasize the reduction
of surface fuels and the preservation of the largest trees in a stand, while recognizing the
importance of opening the canopy in order to achieve the maximum benefits of hazard
reduction. This meta-analysis also confirms that all treatments may not be beneficial in
all locations and provides a quantifiable estimate of the expected relative effectiveness
of different types of treatment in broad vegetation categories. However, caution is war-
ranted in extrapolating the results to ecosystems other than long-needle pine and mixed
conifer forests due to the lack of empirical information on treatment effectiveness and
the potential for negative ecological consequences, such as invasion by more flammable
non-native species (Martinson and others 2008).
But treatments that include surface fuel reduction, particularly by prescribed burning,
are well supported for moderating potential wildfire behavior in both long-needle pine
and mixed conifer forests. These treatments appear to remain effective for up to 10
years, though longevity should be expected to vary by ecosystem productivity. Where
crown fire hazard has become so high as to preclude initial entry with prescribed fire,
mechanical thinning may be a necessary precursor. Thinning treatments have demonstrated
the greatest reductions in wildfire severity, but only by those treatments that produce
substantial changes to canopy fuels, shift the diameter distribution towards larger trees,
and are followed by broadcast burning or other means of removal. Until the residual
activity fuels are disposed, they will largely offset much of the hazard reduction benefit
achieved from opening the canopy. While follow-up slash treatment may be generally
intended, untreated slash seems to be encountered by large wildfires with surprising
frequency (table 2, treatment type 6).
Modifications in fire behavior achieved within a single treated stand, however sig-
nificant, are unlikely to change the total area burned by a large wildfire, aid fire control
efforts, or impact the distribution of severities across a landscape (Finney and others
2003). Fuel treatment effectiveness ultimately depends on the cumulative impact of a
treatment regime applied across landscapes and maintained through time. Optimiza-
tion and assessment of treatment regimes rely on models that presume treatments will
perform as expected (Finney and others 2007). Empirical fuel treatment performance
studies, such as those included in this meta-analysis, help define the conditions under

7/28/2019 Fuel Treatments and Fire Severity: A Meta-Analysis
http://slidepdf.com/reader/full/fuel-treatments-and-fire-severity-a-meta-analysis 24/40
22 USDA Forest Service Res. Pap. RMRS-RP-103WWW. 2013
which theoretical expectations are met. Records of treatment boundaries, prescriptions,
and fuel conditions are therefore critical components of fuel treatment implementation
to enable effective adaptive management.
Recommendations for Future Research
Wildfires provide the best test of treatment performance under extreme conditions, but
information from retrospective studies is limited to that provided by chance encounters.
Such encounters are most likely where treatments and wildfires are most common, thusinformation is unevenly distributed among ecosystems, geographic locations, treatment
types, and treatment ages (table 2; figure 10). Our search for studies to include in this
synthesis highlights the need for greater attention to identifying treatments encountered
by wildfires in all areas other than long-needle pine and mixed conifer forests west of
the Rocky Mountains. Also, alternatives to prescribed fire for treating surface fuels
have so far received little evaluation in any ecosystem from a fuel hazard perspective.
Few of the studies included in our synthesis documented more than a single treatment
entry other than follow-up slash treatments, and the relative effectiveness of initial entry
treatments versus treatments that have been maintained at varying frequencies is in need
of investigation as opportunities arise. The influence of treatment scale on modifying
fire behavior both within treatments and beyond them is another consideration that has
received little empirical evaluation.
Retrospective wildfire investigations are also limited by their maximum detectable
response, which decreases with the height of the dominant vegetation, as well as their
capacity to connect treatment effectiveness to the altered condition of any fuels the
wildfire consumes. Despite the large overall mean and wide variability in fuel treatment
effect sizes demonstrated by our meta-analysis, these were likely small relative to what
might have been produced had the recording vegetation been taller or had fire behavior
been measured directly. The addition of percent crown volume consumed to percent
scorch estimates may provide a closer approximation to the effect of fuel treatments on
modifying fire behavior, but has so far not been reported in the literature with enough
frequency to include in our meta-analysis (Appendix A).
We suspect that fuel treatment effectiveness also depends on fire weather conditions,
such that potential effect size is maximized somewhere between the extremes of low
and high fire danger. Under very moderate conditions, fire behavior may be so benign
regardless of fuelbed characteristics that there will be little detectable difference be-
tween treated and untreated areas. For example, negligible responses to treatments that
included recent fuel reduction in our own investigations (Omi and Martinson 2002,
Omi and others 2006) occurred on days when the Burning Index of the National Fire
Danger Rating System was below the 80th percentile. At the other extreme, fire weather
may overwhelm the influence of fuel manipulations, especially those applied at small
scales (for example, Finney and others 2003). However, observations of fuel treatment
performance have not been connected to fire weather conditions with enough consis-
tency in the extant literature to be considered quantitatively in our meta-analysis. Future
studies should fully report all available metrics of fire weather and fuel conditions, as
well as treatment responses.
The focus of the literature included in this meta-analysis has been on indicators of fire
behavior at the flaming front. But fuel treatment effectiveness also ultimately depends on
long-term effects determined by the total heat release that is augmented by post-frontal
combustion, including smoldering of large or deeply buried fuels (Neary and others
7/28/2019 Fuel Treatments and Fire Severity: A Meta-Analysis
http://slidepdf.com/reader/full/fuel-treatments-and-fire-severity-a-meta-analysis 25/40
23USDA Forest Service Res. Pap. RMRS-RP-103WWW. 2013
1999). Indicators of total heat release have been long proposed (Wells and others 1979)
with some standardization attempted (Ryan and Noste 1985, Key and Benson 2006), but
the ground component of fire severity measurement remains subjective, qualitative, and
poorly connected to fire behavior, and thus needs further research attention.
An ideal evaluation of fuel treatment effectiveness would include measurement of
all fuelbed components that contribute to flammability, would compare potential fire
behavior in treated and untreated fuelbeds with predictive models, and would compare
model predictions to observations from experimental fires or serendipitous wildfireevents, with connection to post-fire evaluation of fire severity and repeated measure-
ments of vegetation response over time. Direct measurement of fire behavior is the only
comparable means to evaluate fuel treatment performance in non-forest ecosystems and
is a worthy research endeavor in all, despite a high potential for failure to fully meet
experimental objectives (Fites and Henson 2004).
Acknowledgments _________________________________________________
This project was funded by the Joint Fire Science Program project 08-2-1-09. We thank
L. Scott Baggett, Brandon Collins, Molly Hunter, and Jolie Pollet for thoughtful reviews
that improved this manuscript and Paula Fornwalt for coordinating publication throughthe U.S. Department of Agriculture, Forest Service, Rocky Mountain Research Station.
Literature Cited ___________________________________________________
Adams, D.C.; Gurevitch, J.; Rosenberg, M.S. 1997. Resampling tests for meta-analysis of ecological data.
Ecology 78: 1277-1283.
Agee, J.K.; Skinner, C.N. 2005. Basic principles of forest fuel reduction treatments. Forest Ecology and
Management 211: 83-96.
Alexander, M.E.; Lanoville, R.A. 2004. The International Crown Fire Modelling Experiment fuel treatment
trials. Tall Timbers Fire Ecology Conference Proceedings 22: 222.
Boerner, R.E.J.; Huang, J.; Hart, S.C. 2009. Impacts of fire and fire surrogate treatments on forest soil
properties: a meta-analytical approach. Ecological Applications 19: 338-358.
Botti, S.; Saveland, J.; Carlile, L.; Conard, S.; Eidenshink, J.; Ferry, G.; Miller, M.; Schmidt, G.; van Wag-tendonk, J. 1998. Joint fire science plan. Report to Congress submitted by U.S. Department of Interior
and U.S. Department of Agriculture Forest Service, Washington DC.
Brown, T.J.; Hall, B.L.; Westerling, A.L. 2004. The impact of Twenty-First Century climate change on wild-
land fire danger in the western United States: an applications perspective. Climatic Change 62: 365-388.
Burnham, K.P.; Anderson, D.R. 2002. Model selection and multimodel inference: a practical information-
theoretic approach, second edition. Springer-Verlag New York, NY. 488 p.
Byram, G.M. 1959. Combustion of forest fuels. Pages 61-89 in Davis, K.P. (ed.) Forest fire: control and
use. McGraw-Hill, New York, NY.
Carey, H.; Schumann, M. 2003. Modifying wildfire behavior—the effectiveness of fuel treatments. South-
west Region Working Paper #2. National Community Forestry Center, Santa Fe, NM.
Cohen, J. 1988. Statistical power analysis for the behavioral sciences, second edition. Erlbaum, Hillsdale,
NJ. 567 p.
Cooper, C.F. 1960. Changes in vegetation structure and growth of southwestern pine forests since white
settlement. Ecological Monographs 30: 129-164.Cooper, H.M.; Hedges, L.V.; Valentine, J.C. 2009. The handbook of research synthesis and meta-analysis,
second edition. Russell Sage Foundation, New York, NY. 621 p.
Cova, T.J.; Sutton, P.C.; Theobald, D.M. 2004. Exurban change detection in fire-prone areas with nighttime
satellite imagery. Photogrammetric Engineering & Remote Sensing 70: 1249-1257.
Cruz, M.G.; Alexander, M.E. 2010. Assessing crown fire potential in coniferous forests of western North
America: a critique of current approaches and recent simulation studies. International Journal of Wild-
land Fire 19: 377-398.
Finney, M.A.; Bartlette, R.; Bradshaw, L.; and others. 2003. Fire behavior, fuel treatments, and fire sup-
pression on the Hayman fire. USDA Forest Service, General Technical Report RMRS-GTR-114: 33-180.
7/28/2019 Fuel Treatments and Fire Severity: A Meta-Analysis
http://slidepdf.com/reader/full/fuel-treatments-and-fire-severity-a-meta-analysis 26/40
24 USDA Forest Service Res. Pap. RMRS-RP-103WWW. 2013
Finney M.A.; Seli, R.C.; McHugh, C.W.; Ager, A.A.; Bahro, B.; Agee, J.K. 2007. Simulation of long-term
landscape-level fuel treatment effects on large wildfires. International Journal of Wildland Fire 16: 712-727.
Fites, J.; Henson, C. 2004. Real-time evaluation of effects of fuel-treatments and other previous land
management activities on fire behavior during wildfires. Final report submitted to the Joint Fire Science
Program Governing Board. Adaptive Management Services Enterprise Team, Nevada City, CA.
Graham, R.T.; McCaffrey, S.; Jain, T.B. 2004. Science basis for changing forest structure to modify wildfire
behavior and severity. USDA Forest Service, General Technical Report RMRS-GTR-120: 1-43.
Gurevitch, J.; Curtis, P.S.; Jones, M.H. 2001. Meta-analysis in ecology. Advances in Ecological Research
32: 199-247.
Gurevitch, J.; Hedges, L.V. 1999. Statistical issues in ecological meta-analyses. Ecology 80: 1142-1149.Hedges, L.V.; Gurevitch, J.; Curtis, P.S. 1999. The meta-analysis of response ratios in experimental ecol-
ogy. Ecology 80: 1150-1156.
Hedges, L.V.; Olkin, I. 1985. Statistical methods for meta-analysis. New York: Academic Press. 369 p.
Hudak, A.T.; Rickert, I.; Morgan, P.; Strand, E.; Lewis, S.A.; Robichaud, P.R.; Hoffman, C.; Holden, Z.A.
2011. Review of fuel treatment effectiveness in forests and rangelands and a case study from the 2007
megafires in central, Idaho, USA. USDA Forest Service, General Technical Report RMRS-GTR-252: 1-60.
Hurlbert, S.H. 1984. Pseudoreplication and the design of ecological field experiments. Ecological Mono-
graphs 54: 187-211.
Johnson, E.A.; Miyanishi, K.; Bridge S.R.J. 2001. Wildfire regime in the boreal forest and the idea of sup-
pression and fuel buildup. Conservation Biology 15: 1554-1557.
Kalies, E.L.; Chambers, C.L.; W.W. Covington. 2010. Wildlife responses to thinning and burning treat-
ments in southwestern conifer forests: a meta-analysis. Forest Ecology and Management 259: 333-342.
Keeley, J.E.; Aplet, G.H.; Christensen, N.L.; Conard, S.C.; Johnson, E.A.; Omi, P.N.; Peterson, D.L.; Swet-
nam, T.W. 2009. Ecological foundations for fire management in North American forest and shrublandecosystems. USDA Forest Service, General Technical Report PNW-GTR-779: 1-92.
Keeley, J.E.; Fotheringham, C.J. 2001. History and management of crown-fire ecosystems: a summary and
response. Conservation Biology 15: 1561-1567.
Key, C.; Benson, N. 2006. Landscape assessment, ground measure of severity, the composite burn index,
and remote sensing of severity, the normalized burn ratio. In Lutes, D.C.; Keane, R.E.; Caratti, J.F.; Key,
C.H.; Benson, N.C.; Gangi, L.J. (eds.) FIREMON, fire effects monitoring and inventory system. USDA
Forest Service, General Technical Report RMRS-GTR-164-CD: LA-1-55.
Kopper, K.E. 2002. Meta-analysis design and interpretation: a case study of prescribed fire effects on fuel
loadings in ponderosa pine ecosystems. Thesis. University of Washington, Seattle.
Kopper, K.E.; McKenzie, D.; Peterson, D.L. 2009. The evaluation of meta-analysis techniques for quantify-
ing prescribed fire effects on fuel loadings. USDA Forest Service, Research Paper PNW-RP-582: 1-24.
Lau, J.; Ioannidis, J.P.A.; Terrin, N.; Schmid, C.H.; Olkin, I. 2006. The case of the misleading funnel plot.
BMJ 333: 597-600.
Martinson, E.J. 1998. Fire effects on plant abundance: a meta-analysis. Thesis. Colorado State University,Fort Collins.
Martinson, E.J; Hunter, M.E.; Freeman, J.P.; Omi, P.N. 2008. Effects of fuel and vegetation management
activities on non-native invasive plants. Chapter 13 inZouhar, K.; Kapler, J.; Sutherland, S.; Brooks, M.L.
(eds.) Wildland fire in ecosystems: fire and nonnative invasive plants. USDA Forest Service, General
Technical Report RMRS-GTR-42-vol. 6: 261-268.
Martinson, E.J.; Omi, P.N. 2003. Performance of fuel treatments subjected to wildfires. In Omi, P.N; Joyce,
L.A. (eds.) Fire, fuel treatments, and ecological restoration: conference proceedings. USDA Forest
Service, Proceedings RMRS-P-29: 7-14.
Martinson, E.J.; Omi, P.N. 2008. Assessing mitigation of wildfire severity by fuel treatments—an example
from the Coastal Plain of Mississippi. International Journal of Wildland Fire 17:415-420.
Neary, D.G.; Klopatek, C.C.; DeBano, L.F.; Ffolliott, P.F. 1999. Fire effects on belowground sustainability:
a review and synthesis. Forest Ecology and Management 122: 51-71.
Omi, P.N.; Martinson, E.J. 2002. Effect of fuels treatment on wildfire severity. Final report submitted to the
Joint Fire Science Program Governing Board. Colorado State University, Fort Collins. 36 p.Omi, P.N.; Martinson, E.J.; Chong, G.W. 2006. Effectiveness of pre-fire fuel treatments. Final report submit-
ted to the Joint Fire Science Program Governing Board. Colorado State University, Fort Collins. 29 p.
Peterson, D.L.; Johnson, M.C.; Agee, J.K.; Jain, T.B.; McKenzie, D.; Reinhardt, E.D. 2005. Forest structure
and fire hazard in dry forests of the western United States. USDA Forest Service, General Technical
Report PNW-GTR-628: 1-30.
Pyne, S.J. 1982. Fire in America—a cultural history of wildland and rural fire. Princeton University Press,
Princeton, NJ. 654 p.
Rosenberg, M.S.; Adams, D.C.; Gurevitch, J. 2000. MetaWin: statistical software for meta-analysis, version
2.0. Sinauer Associates, Sunderland, MA. 128 p.

7/28/2019 Fuel Treatments and Fire Severity: A Meta-Analysis
http://slidepdf.com/reader/full/fuel-treatments-and-fire-severity-a-meta-analysis 27/40
25USDA Forest Service Res. Pap. RMRS-RP-103WWW. 2013
Rothstein, H.; Sutton, A.; Borenstein, M. (eds.). 2005. Publication bias and meta‐analysis: prevention,
assessment and adjustments. John Wiley & Sons, Sussex. 356 p.
Ryan, K.C.; Noste, N.V. 1985. Evaluating prescribed fires. InLotan, J.E. (ed.) Proceedings of the symposium
and workshop on wilderness fire. USDA Forest Service, General Technical Report INT-GTR-182: 230-238.
Schmidt, K.M.; Menakis, J.P.; Hardy, C.C.; Hann, W.J.; Bunnell, D.L. 2002. Development of coarse-scale
spatial data for wildland fire and fuel management. USDA Forest Service, General Technical Report
RMRS-GTR-87: 1-41.
Schoennagel, T.; Veblen, T.T.; Romme, W. 2004. The interaction of fire, fuels, and climate across Rocky
Mountain landscapes. BioScience 54: 661-676.
Scott, J.H.; Reinhardt, E.D. 2001. Assessing crown fire potential by linking models of surface and crownfire behavior. USDA Forest Service, Research Paper RMRS-RP-29: 1-59.
Stephens, S.L; Ruth, L.W. 2005. Federal forest-fire policy in the United States. Ecological Applications
15: 532-542.
Stroup, D.F.; Berlin, J.A.; Morton, S.C.; and others. 2000. Meta-analysis of observational studies in
epidemiology: a proposal for reporting. Journal of the American Medical Association 283: 2008-2012.
Van Mantgem, P.; Schwartz, M.; Keifer, M. 2001. Monitoring fire effects for managed burns and wildfires:
coming to terms with pseudoreplication. Natural Areas Journal 21: 266-273.
Van Wagner, C.E. 1973. Height of crown scorch in forest fires. Canadian Journal of Forest Research 3:
373-378.
Wan, S.; Hui, D.; Luo, Y. 2001. Fire effects on nitrogen pools and dynamics in terrestrial ecosystems: a
meta-analysis. Ecological Applications 11: 1349-1365.
Wells, C.G.; Campbell, R.E.; DeBano, L.F.; Lewis, C.E.; Fredricksen, R.L.; Franklin, E.C; Froelich, R.C.;
Dunn, P.H. 1979. Effects of fire on soil: a state-of-the-knowledge review. USDA Forest Service, General
Technical Report WO-GTR-7: 1-37.Wimberly, M.C.; Cochrane, M.A.; Baer, A.D.; Pabst, K. 2009. Assessing fuel treatment effectiveness using
satellite imagery and spatial statistics. Ecological Applications 19: 1377-1384.
Youngblood, A. 2010. Thinning and burning in dry coniferous forests of the western United States: ef-
fectiveness in altering diameter distributions. Forest Science 56:46-59.

7/28/2019 Fuel Treatments and Fire Severity: A Meta-Analysis
http://slidepdf.com/reader/full/fuel-treatments-and-fire-severity-a-meta-analysis 28/40
26 USDA Forest Service Res. Pap. RMRS-RP-103WWW. 2013
A p p e n d i x A —
T h e 6 0 p u b l i c a t i o n s t h r o u g
h M a y 2 0 1 0 t h a t c o n t a i n e m
p i r i c a l e v i d e n c e o f f u e l t r e
a t m e n t
e f f e c t i v e n e s s
, i n d i c a t i n g s t u d y l o c a t i o n ( s ) , d o m i n a n t v e g e t a t i o n t y p
e ( s ) , t r e a t m e n t t y p e ( s ) , w h e t h e r f u e l
c o n d i t i o n s w e r e m e a s u r e d , w h e t h e r t r e a
t m e n t a g e w a s r e p o r t e d , t h
e r e s p o n s e v a r i a b l e ( s ) m e a
s u r e d , a n d
w h e t h e r c o n t r o l f o r w e a t h e r a n d t o p o g r a
p h y w a s d e m o n s t r a t e d . T h
e 1 9 p u b l i c a t i o n s t h a t m e t a l l c r i t e r i a f o r
i n c l u s i o n i n t h e m e t a - a n a l y s i s a r e e m b o l d e n e d .
T r e a t m e n t t y p e a
R e s p o n s e v a r i a b l e c
P u b l i c a t i o n
L o c a t i o n
V e g e t a t i o n
1
2
3
4
5
6
F u e l b
A g e
1
2
3
4
5
6
7
8
9
1 0
1 1
1 2
C o n t r o l
M o o r e
N J
F o r e s t / m i x e d /
a n d o t h e r s 1 9 5 5
p i n e - o a k
X
X
X
X
W e a v e r
W A
F o r e s t / c o n i f e r /
1 9 5 7
m i x e d
X
X
X
D a v i s
G A
F o r e s t / c o n i f e r /
a n d o t h e r s 1 9 6 3
p i n e
X
X
X
X
C u m m i n g
N J
F o r e s t / m i x e d /
1 9 6 4
p i n e - o a k
X
X
X
X
V a n W a g n e r
C A
F o r e s t / c o n i f e r /
1 9 6 8
p i n e
X
X
X
X
X
K a l l a n d e r
A Z
F o r e s t / c o n i f e r /
1 9 6 9
p i n e
X
X
X
O m i
C A
F o r e s t & c h a p a r r a l X
X
1 9 7 7
W a g l e
A Z
F o r e s t / c o n i f e r /
a n d o t h e r s 1 9 7 9
p i n e
X
X
X
X
X
M i n n i c h
C A /
1 9 8 3
M e x i c o
C h a p a r r a l & s c r u b
X
X
M a r t i n
S E U S
U n s p e c i f i e d
X
X
X
1 9 8 8
W i l s o n
A u s t r a l i a
G r a s s l a n d
X
X
X
1 9 8 8
D u n n
C A
C h a p a r r a l
X
X
X
1 9 8 9
O m i
I D
F o r e s t / c o n i f e r /
a n d o t h e r s 1 9 9 1
s p r u c e - f i r
X
X
B u c k l e y
A u s t r a l i a
F o r e s t / d e c i d u o u s /
1 9 9 2
e u c a l y p t
X
X
X
K o e h l e r
F L
U n s p e c i f i e d
X
X
X
1 9 9 2 / 9 3
C h e n e y
A u s t r a l i a
G r a s s l a n d
X
X
X
X
X
a n d o t h e r s 1 9 9 3
V i h a n e k
O R
F o r e s t / c o n i f e r
X
X
X
a n d o t h e r s 1 9 9 3
W e a t h e r s p o o n
C A
F o r e s t / c o n i f e r /
a n d o t h e r s 1 9 9 5
m i x e d
X
X
X
X
X
X
( c o n t i n u e d )

7/28/2019 Fuel Treatments and Fire Severity: A Meta-Analysis
http://slidepdf.com/reader/full/fuel-treatments-and-fire-severity-a-meta-analysis 29/40
27USDA Forest Service Res. Pap. RMRS-RP-103WWW. 2013
A g e e
W A
F o r e s t / c o n i f e r /
1 9 9 6
f i r
X
X
X
X
M i n n i c h
C A / M e x i c o
C h a p a r r a l
X
X
a n d o t h e r s 1 9 9 7
H a l l
M T
F o r e s t / c o n i f e r /
a n d o t h e r s 1 9 9 9
s p r u c e - f i r
X
X
X
X
K e e l e y
C A
C h a p a r r a l
X
X
X
a n d o t h e r s 1 9 9 9
M c C a r t h y
A u s t r a l i a
F o r e s t
X
X
X
a n d o t h e r s 2 0 0 1
O m i
N M / C A / C O
F o r e s t / c o n i f e r /
a n d o t h e r s 2 0 0 2
m i x e d
X
X
X
X
X
X
X
X
X
X
X
X
P o l l e t
M T / W A /
a n d o t h e r s 2 0 0 2
C A / A Z
F o r e s t / c o n i f e r /
p i n e
X
X
X
X
X
X
X
X
P r e s t e m o n
F L
F o r e s t
X
X
X
X
a n d o t h e r s 2 0 0 2
W i l m e s
A Z
F o r e s t / c o n i f e r /
a n d o t h e r s 2 0 0 2
p i n e
X
X
X
X
H a r m a
O R
U n d e s c r i b e d
X
X
X
a n d o t h e r s 2 0 0 3
M a r t i n s o n
C O
F o r e s t / c o n i f e r /
a n d o t h e r s 2 0 0 3
p i n e
X
X
X
X
X
M o r i t z
C A
C h a p a r r a l
X
X
2 0 0 3
F e r n a n d e s
P o r t u g a l
F o r e s t / c o n i f e r /
a n d o t h e r s 2 0 0 4
p i n e
X
X
X
X
X
X
X
X
X
K o l a k s
M O
F o r e s t / m i x e d /
2 0 0 4
p i n e - o a k
X
X
X
X
X
O u c a l t
F L / G A
F o r e s t / c o n i f e r /
a n d o t h e r s 2 0 0 4
p i n e
X
X
X
X
R i c h b u r g
M A / N Y
F o r e s t / d e c i d u o u s
a n d o t h e r s 2 0 0 4
& s h r u b
X
X
X
X
X
X
S t o n e
M T
F o r e s t / c o n i f e r
X
X
a n d o t h e r s 2 0 0 4
F i n n e y
A Z
F o r e s t / c o n i f e r /
a n d o t h e r s 2 0 0 5
p i n e
X
X
X
K e e l e y
C A
C h a p a r r a l & s c r u b
X
X
X
a n d o t h e r s 2 0 0 5
R a y m o n d
O R
F o r e s t / c o n i f e r /
A p p e n d i x A — ( C o
n t i n u e d )
T r e a t m e n t t y p e a
R e s p o n s e v a r i a b l e c
P u b l i c a t i o n
L o c a t i o n
V e g e t a t i o n
1
2
3
4
5
6
F u e l b
A g e
1
2
3
4
5
6
7
8
9
1 0
1 1
1 2
C o n t r o l
( c o n t i n u e d )
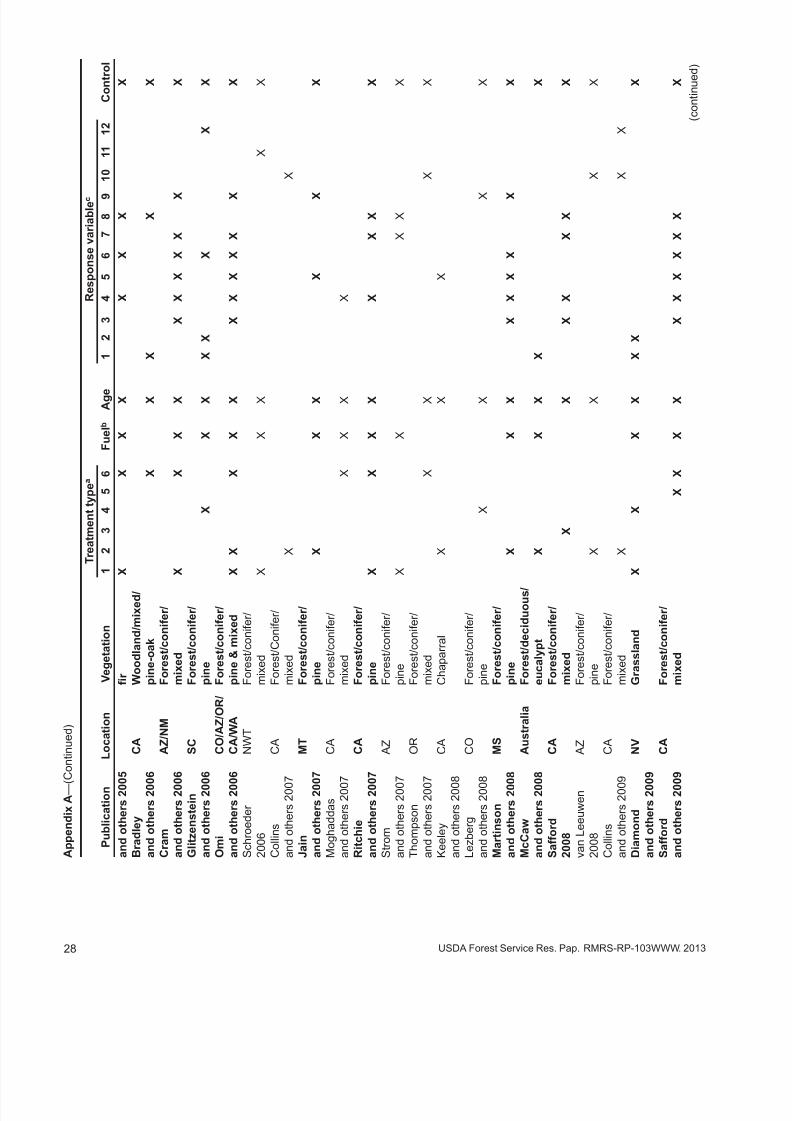
7/28/2019 Fuel Treatments and Fire Severity: A Meta-Analysis
http://slidepdf.com/reader/full/fuel-treatments-and-fire-severity-a-meta-analysis 30/40
28 USDA Forest Service Res. Pap. RMRS-RP-103WWW. 2013
A p p e n d i x A — ( C o
n t i n u e d )
T r e a t m e n t t y p e a
R e s p o n s e v a r i a b l e c
P u b l i c a t i o n
L o c a t i o n
V e g e t a t i o n
1
2
3
4
5
6
F u e l b
A g e
1
2
3
4
5
6
7
8
9
1 0
1 1
1 2
C o n t r o l
a n d o t h e r s 2 0 0 5
f i r
X
X
X
X
X
X
X
X
B r a d l e y
C A
W o o d l a n d / m i x e d /
a n d o t h e r s 2 0 0 6
p i n e - o a k
X
X
X
X
X
C r a m
A Z / N M
F o r e s t / c o n i f e r /
a n d o t h e r s 2 0 0 6
m i x e d
X
X
X
X
X
X
X
X
X
X
X
G l i t z e n s t e i n
S C
F o r e s t / c o n i f e r /
a n d o t h e r s 2 0 0 6
p i n e
X
X
X
X
X
X
X
X
O m i
C O / A Z / O R / F o r e s t / c o n i f e r /
a n d o t h e r s 2 0 0 6
C A / W A
p i n e & m i x e d
X
X
X
X
X
X
X
X
X
X
X
X
S c h r o e d e r
N W T
F o r e s t / c o n i f e r /
2 0 0 6
m i x e d
X
X
X
X
X
C o l l i n s
C A
F o r e s t / C o n i f e r /
a n d o t h e r s 2 0 0 7
m i x e d
X
X
J a i n
M T
F o r e s t / c o n i f e r /
a n d o t h e r s 2 0 0 7
p i n e
X
X
X
X
X
X
M o g h a d d a s
C A
F o r e s t / c o n i f e r /
a n d o t h e r s 2 0 0 7
m i x e d
X
X
X
X
R i t c h i e
C A
F o r e s t / c o n i f e r /
a n d o t h e r s 2 0 0 7
p i n e
X
X
X
X
X
X
X
X
S t r o m
A Z
F o r e s t / c o n i f e r /
a n d o t h e r s 2 0 0 7
p i n e
X
X
X
X
X
T h o m p s o n
O R
F o r e s t / c o n i f e r /
a n d o t h e r s 2 0 0 7
m i x e d
X
X
X
X
K e e l e y
C A
C h a p a r r a l
X
X
X
a n d o t h e r s 2 0 0 8
L e z b e r g
C O
F o r e s t / c o n i f e r /
a n d o t h e r s 2 0 0 8
p i n e
X
X
X
X
M a r t i n s o n
M S
F o r e s t / c o n i f e r /
a n d o t h e r s 2 0 0 8
p i n e
X
X
X
X
X
X
X
X
X
M c C a w
A u s t r a l i a
F o r e s t / d e c i d u o u s /
a n d o t h e r s 2 0 0 8
e u c a l y p t
X
X
X
X
X
S a f f o r d
C A
F o r e s t / c o n i f e r /
2 0 0 8
m i x e d
X
X
X
X
X
X
X
v a n L e e u w e n
A Z
F o r e s t / c o n i f e r /
2 0 0 8
p i n e
X
X
X
X
C o l l i n s
C A
F o r e s t / c o n i f e r /
a n d o t h e r s 2 0 0 9
m i x e d
X
X
X
D i a m o n d
N V
G r a s s l a n d
X
X
X
X
X
X
X
a n d o t h e r s 2 0 0 9
S a f f o r d
C A
F o r e s t / c o n i f e r /
a n d o t h e r s 2 0 0 9
m i x e d
X
X
X
X
X
X
X
X
X
X
X
( c o n t i n u e d )

7/28/2019 Fuel Treatments and Fire Severity: A Meta-Analysis
http://slidepdf.com/reader/full/fuel-treatments-and-fire-severity-a-meta-analysis 31/40
29USDA Forest Service Res. Pap. RMRS-RP-103WWW. 2013
A p p e n d i x A — ( C o
n t i n u e d )
T r e a t m e n t t y p e a
R e s p o n s e v a r i a b l e c
P u b l i c a t i o n
L o c a t i o n
V e g e t a t i o n
1
2
3
4
5
6
F u e l b
A g e
1
2
3
4
5
6
7
8
9
1 0
1 1
1 2
C o n t r o l
W i m b e r l y
A Z / M T / W A
F o r e s t / c o n i f e r /
a n d o t h e r s 2 0 0 9
p i n e
X
X
X
X
X
P r i c h a r d
W A
F o r e s t / c o n i f e r /
a n d o t h e r s 2 0 1 0
m i x e d
X
X
X
X
X
X
a S e e t a b l e 2 f o r d
e f i n i t i o n s o f t r e a t m e n t t y p e s .
b I n d i c a t o r o f w h e t h e r a n y f u e l c o n d i t i o n s i n b o t h t r e a t e d a n d u n t r e a t e d a r e a s w e r e m e a s u r e d p r e - f i r e o r r e c o n s t r u c t e d p o s t - f i r e , s u c h a s s u r f a c e f u e l l o a d a n d d e p t h , t r e e d e n s i t y ,
b a s a l a r e a , t r e e
d i a m e t e r s , h e i g h t t o c a n o p y , a n d / o r c a n o p y
b u l k d e n s i t y .
c F u e l t r e a t m e n t r e s p o n s e v a r i a b l e s a r e :
1 . F l a m e l e n g
t h
2 . S p r e a d r a t e
3 . P e r c e n t c r o w n v o l u m e c o n s u m e d
4 . P e r c e n t c r o w n v o l u m e s c o r c h e d
5 . C a n o p y d a
m a g e r a t i n g b a s e d o n s c o r c h a n d / o r c o n s u m p t i o n
6 . H e i g h t o f n
e e d l e s c o r c h
7 . H e i g h t o f b
o l e c h a r
8 . P e r c e n t t r e
e m o r t a l i t y
9 . D e p t h o f g r o u n d c h a r r a t i n g
1 0 . R e m o t e l y s e n s e d f i r e s e v e r i t y r a t i n g
1 1 . B i n a r y c r o w n f i r e i n d i c a t o r
1 2 . A r e a b u r n e
d

7/28/2019 Fuel Treatments and Fire Severity: A Meta-Analysis
http://slidepdf.com/reader/full/fuel-treatments-and-fire-severity-a-meta-analysis 32/40
30 USDA Forest Service Res. Pap. RMRS-RP-103WWW. 2013
Appendix B—Summary of the datasets from the 19 publications included in the meta-analysis.
Treatment Response Effect
Source Location Vegetation typea age variableb Uc Td sizee
Moore NJ Forest/conifer/
and others 1955 pine 2 2 5 2.6 2.2 -0.3
Omi CA Forest/conifer/
and others 2002 mixed 2 2 4 71.4 16.9 -1.4
CO Forest/conifer/
mixed 2 3 4 57.7 50.1 -0.1
CO Forest/conifer/
mixed 6 8 4 88.4 72.3 -0.2
NM Forest/conifer/
pine 1 5 4 89.8 53.8 -0.5
NM Forest/conifer/
pine 6 2 4 99.6 75.7 -0.3
Pollet
and others 2002 WA Forest/conifer/
pine 1 11 4 100.0 74.0 -0.3
AZ Forest/conifer/
pine 2 1 4 99.0 29.0 -1.2
MT Forest/conifer/
pine 2 5 4 67.0 26.0 -0.9 CA Forest/conifer/
pine 3 4 4 78.0 26.0 -1.1
Fernandes
and others 2004 Portugal Forest/conifer/
pine 2 2 4 100.0 88.0 -0.1
Portugal Forest/conifer/
pine 2 3 4 100.0 94.0 -0.1
Portugal Forest/conifer/
pine 2 13 4 100.0 100.0 0.0
Kolaks
2004 MO Forest/mixed/
oak-pine 6 0 6 (1) 12.9 22.7 0.8
Richburg
and others 2004 MA Grassland 2 2 6 (1) 64.0 0.0 -6.1 MA Grassland 4 0 6 (1) 64.0 4.8 -3.7
MA Grassland 4 0 6 (1) 64.0 27.3 -1.2
MA Forest/deciduous 4 0 6 (1) 1.0 1.0 0.0
Raymond
and others 2005 OR Forest/conifer/
mixed 1 1 4 83.0 0.1 -6.7
OR Forest/conifer/
mixed 6 6 4 71.0 97.3 0.3
Bradley
and others 2006 CA Woodland/mixed/
oak-pine 4 0 6 (1) 0.3 2.7 2.9
Cram
and others 2006 AZ Forest/conifer/
pine 1 3 4 100.0 45.9 -0.8 AZ Forest/conifer/
pine 6 3 4 100.0 90.8 -0.1
NM Forest/conifer/
mixed 1 7 4 97.2 15.9 -1.8
NM Forest/conifer/
mixed 1 8 4 100.0 3.7 -3.3
NM Forest/conifer/
mixed 6 10 4 99.2 71.5 -0.3
NM Forest/conifer/
(continued)

7/28/2019 Fuel Treatments and Fire Severity: A Meta-Analysis
http://slidepdf.com/reader/full/fuel-treatments-and-fire-severity-a-meta-analysis 33/40
31USDA Forest Service Res. Pap. RMRS-RP-103WWW. 2013
mixed 6 10 4 94.8 53.6 -0.6
NM Forest/conifer/
mixed 6 14 4 100.0 59.4 -0.5
Glitzenstein
and others 2006 SC Forest/conifer/
pine 4 0 6 2.5 1.3 -0.9Omi
and others 2006 AZ Forest/conifer/
pine 2 2 4 70.7 42.2 -0.5
AZ Forest/conifer/
pine 2 7 4 52.8 21.0 -0.9
AZ Forest/conifer/
mixed 6 2 4 75.0 59.7 -0.2
AZ Forest/conifer/
mixed 6 7 4 61.3 77.2 0.2
CA Forest/conifer/
mixed 2 9 4 82.5 25.9 -1.2
CA Forest/conifer/
mixed 2 20 4 77.7 96.7 0.2
CA Forest/conifer/mixed 6 1 4 56.2 5.9 -2.3
CA Forest/conifer/
mixed 6 5 4 88.1 49.0 -0.6
CO Forest/conifer/
mixed 1 1 4 100.0 47.9 -0.7
CO Forest/conifer/
mixed 1 10 4 75.6 79.4 0.0
CO Forest/conifer/
mixed 2 1 4 81.0 20.1 -1.4
CO Forest/conifer/
mixed 2 10 4 100.0 100.0 0.0
CO Forest/conifer/
mixed 6 2 4 85.2 96.5 0.1
OR Forest/conifer/mixed 1 2 4 100.0 76.2 -0.3
OR Forest/conifer/
mixed 6 0 4 99.7 97.7 0.0
OR Forest/conifer/
mixed 6 2 4 88.9 84.1 -0.1
WA Forest/conifer/
pine 1 2 4 55.5 44.4 -0.2
Jain
and others 2007 MT Forest/conifer/
pine 2 0 5 3.1 3.2 0.0
MT Forest/conifer/
pine 2 2 5 2.5 2.1 -0.3
MT Forest/conifer/
pine 2 5 5 2.9 2.3 -0.4Ritchie
and others 2007 CA Forest/conifer/
pine 1 4 4 86.0 1.0 -4.5
CA Forest/conifer/
pine 1 5 4 99.3 10.0 -2.3
CA Forest/conifer/
pine 6 6 4 66.7 22.0 -1.1
Appendix B—(Continued).
Treatment Response Effect
Source Location Vegetation typea age variableb Uc Td sizee
(continued)
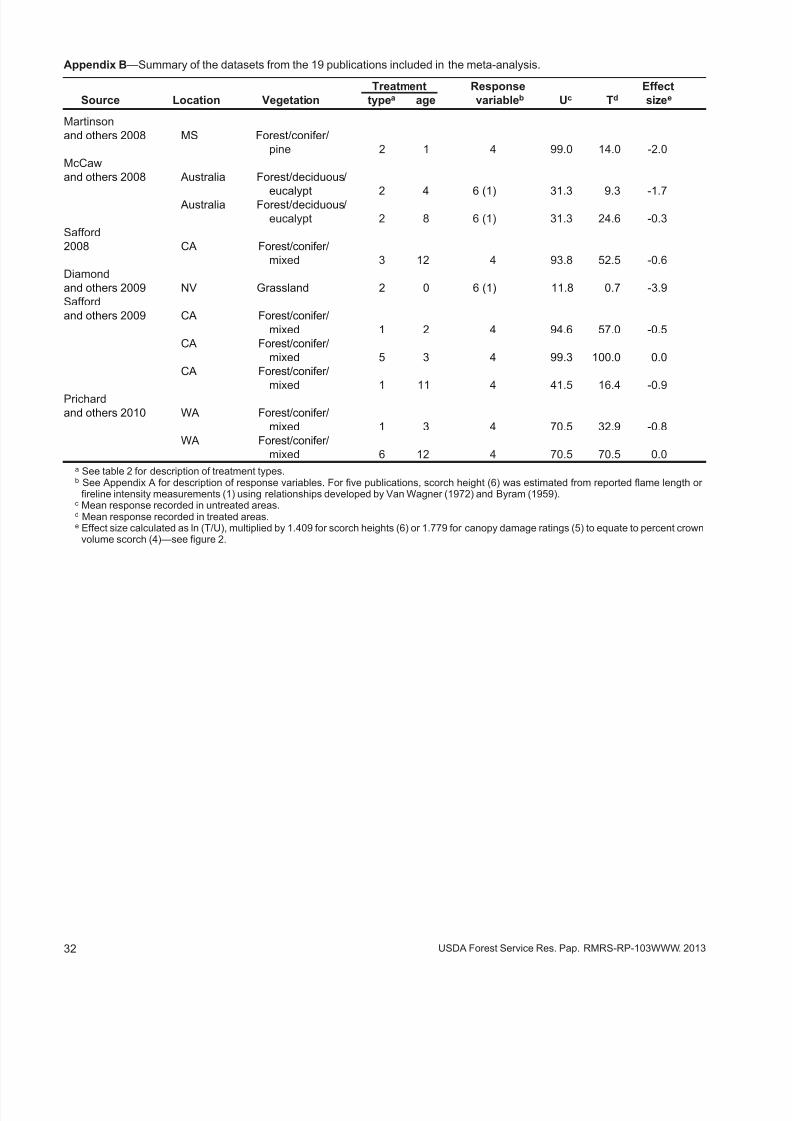
7/28/2019 Fuel Treatments and Fire Severity: A Meta-Analysis
http://slidepdf.com/reader/full/fuel-treatments-and-fire-severity-a-meta-analysis 34/40
32 USDA Forest Service Res. Pap. RMRS-RP-103WWW. 2013
Martinson
and others 2008 MS Forest/conifer/
pine 2 1 4 99.0 14.0 -2.0
McCaw
and others 2008 Australia Forest/deciduous/
eucalypt 2 4 6 (1) 31.3 9.3 -1.7 Australia Forest/deciduous/
eucalypt 2 8 6 (1) 31.3 24.6 -0.3
Safford
2008 CA Forest/conifer/
mixed 3 12 4 93.8 52.5 -0.6
Diamond
and others 2009 NV Grassland 2 0 6 (1) 11.8 0.7 -3.9
Safford
and others 2009 CA Forest/conifer/
mixed 1 2 4 94.6 57.0 -0.5
CA Forest/conifer/
mixed 5 3 4 99.3 100.0 0.0
CA Forest/conifer/
mixed 1 11 4 41.5 16.4 -0.9Prichard
and others 2010 WA Forest/conifer/
mixed 1 3 4 70.5 32.9 -0.8
WA Forest/conifer/
mixed 6 12 4 70.5 70.5 0.0
a See table 2 for description of treatment types.b See Appendix A for description of response variables. For five publications, scorch height (6) was estimated from reported flame length or
fireline intensity measurements (1) using relationships developed by Van Wagner (1972) and Byram (1959).c Mean response recorded in untreated areas.d Mean response recorded in treated areas.e Effect size calculated as ln (T/U), multiplied by 1.409 for scorch heights (6) or 1.779 for canopy damage ratings (5) to equate to percent crown
volume scorch (4)—see figure 2.
Appendix B—Summary of the datasets from the 19 publications included in the meta-analysis.
Treatment Response Effect
Source Location Vegetation typea age variableb Uc Td sizee
7/28/2019 Fuel Treatments and Fire Severity: A Meta-Analysis
http://slidepdf.com/reader/full/fuel-treatments-and-fire-severity-a-meta-analysis 35/40
33USDA Forest Service Res. Pap. RMRS-RP-103WWW. 2013
Appendix C—Literature Cited in Appendices
Agee, J.K. 1996. The influence of forest structure on fire behavior. Proceedings—annual forest vegetation
management conference 17: 52-68.
Bradley, T.; Gibson, J.; Bunn, W. 2006. Fire severity and intensity during spring burning in natural and
masticated mixed shrub woodlands. USDA Forest Service, Proceedings RMRS-P-41: 419-428.
Buckley, A.J. 1992. Fire behavior and fuel reduction burning: Bemm River wildfire, October, 1988. Aus-
tralian Forestry 55: 135-147.
Cheney, N.P., Gould, J.S., Catchpole, W.R. 1993. The influence of fuel, weather and fire shape variables
on fire-spread in grasslands. International Journal of Wildland Fire 3: 31-44.Collins, B.M.; Kelly, M.; van Wagtendonk, J.W.; Stephens, S.L. 2007. Spatial patterns of large natural fires
in Sierra Nevada wilderness areas. Landscape Ecology 22: 545-557.
Collins, B.M.; Miller, J.D.; Thode, A.E.; Kelly, M.; van Wagtendonk, J.W.; Stephens, S.L. 2009. Interactions
among wildland fires in a long-established Sierra Nevada natural fire area. Ecosystems 12: 114-128.
Cram, D.S.; Baker, T.T.; Boren, J.C. 2006. Wildland fire effects in silviculturally treated vs. untreated
forested stands of New Mexico and Arizona. USDA Forest Service, Research Paper RMRS-RP-55: 1-28.
Cumming, J.A. 1964. Effectiveness of prescribed burning in reducing wildfire damage during periods of
abnormally high fire danger. Journal of Forestry 62: 535-537.
Davis, L.S.; Cooper, R.W. 1963. How prescribed burning affects wildfire occurrence. Journal of Forestry
61: 915-917.
Diamond, J.M.; Call, C.A.; Devoe, N. 2009. Effects of targeted cattle grazing on fire behavior of cheatgrass-
dominated rangeland in the northern Great Basin, USA. International Journal of Wildland Fire 18: 944-950.
Dunn, A.T. 1989. The effects of prescribed burning on fire hazard in the chaparral: toward a new conceptual
synthesis. USDA Forest Service, General Technical Report PSW-109: 23-29.Fernandes, P.A.M.; Loureiro, C.A.; Botelho, H.S. 2004. Fire behaviour and severity in a maritime pine
stand under differing fuel conditions. Annals of Forest Science 61: 537-544.
Finney, M.A.; McHugh, C.W.; Grenfell, I.C. 2005. Stand- and landscape-level effects of prescribed burning
on two Arizona wildfires. Canadian Journal of Forest Research 35: 1714-1722.
Glitzenstein, J.S.; Streng, D.R.; Achtemeier, G.L.; Naeher, L.P.; Wade, D.D. 2006. Fuels and fire behavior
in chipped and unchipped plots: implications for land management near the wildland/urban interface.
Forest Ecology and Management 236: 18-29.
Hall, W.L.; Wakimoto, R.H.; Zuuring, H.R. 1999. Using fuel treatment and site characteristics to model stand
replacement fire in regeneration stands following the 1994 wildfires on the Kootenai National Forest.
Pages 151-161 inNeuenschwander, L.F.; Ryan, K.C.; Gollberg, G.E.; Greer, J.D. (eds.) Proceedings of the
Joint Fire Science conference and workshop on crossing the millennium: integrating spatial technologies
and ecological principals for a new age in fire management, volume II. University of Idaho, Moscow.
Harma, K.; Morrison, P. 2003. Analysis of vegetation mortality and prior landscape condition, 2002 Biscuit
Fire Complex. Unpublished report. Pacific Biodiversity Institute, Winthrop, WA. 23 p.Jain, T.; Juillerat, M.; Sandquist, J.; Ford, M.; Sauer, B.; Mitchell, R.; McAvoy, S.; Hanley, J.; David, J.
2007. Vegetation and soil effects from prescribed, wild, and combined fire events along a ponderosa pine
and grassland mosaic. USDA Forest Service, General Technical Report RMRS-RP-67: 1-39.
Kallander, H.R. 1969. Controlled burning on the Fort Apache Indian Reservation, Arizona. Proceedings of
the Tall Timbers Fire Ecology Conference 9: 241-249.
Keeley, J.E.; Brennan, T.; Pfaff, A.H. 2008. Fire severity and ecosystem responses following crown fires
in California shrublands. Ecological Applications 18: 1530-1546.
Keeley, J.E.; Fotheringham, C.J.; Keeley, M.B. 2005. Determinants of postfire recovery and succession in
Mediterranean-climate shrublands of California. Ecological Applications 15: 1515-1534.
Keeley, J.E.; Fotheringham, C.J.; Morais, M. 1999. Reexamining fire suppression impacts on brushland
fire regimes. Science 284:1829-1832.
Koehler, J.T. 1992-93. Prescribed burning: a wildfire prevention tool? Fire Management Notes 53-54(4): 9-13.
Kolaks, J.J. 2004. Fuel loading and fire behavior in the Missouri Ozarks of the central hardwood region.
Thesis. University of Missouri, Columbia. 115 p.Lezberg A.L.; Battaglia, M.A.; Shepperd, W.D; Schoettle, A.W. 2008. Decades-old silvicultural treatments
influence surface wildfire severity and post-fire nitrogen availability in a ponderosa pine forest. Forest
Ecology and Management 255: 49-61.
Martin, G.G. 1988. Fuels treatment assessment—1985 fire season in Region 8. Fire Management Notes
49(4): 21-24.
Martinson, E.J.; Omi, P.N. 2008. Assessing mitigation of wildfire severity by fuel treatments—an example
from the Coastal Plain of Mississippi. International Journal of Wildland Fire 17: 415-420.
Martinson, E.J.; Omi, P.N.; Shepperd, W.D. 2003. Fire behavior, fuel treatments, and fire suppression
on the Hayman fire. Part 3: Effect of fuel treatments. USDA Forest Service, General Technical Report
RMRS-GTR-114: 96-126.

7/28/2019 Fuel Treatments and Fire Severity: A Meta-Analysis
http://slidepdf.com/reader/full/fuel-treatments-and-fire-severity-a-meta-analysis 36/40
34 USDA Forest Service Res. Pap. RMRS-RP-103WWW. 2013
McCarthy, G.J.; Tolhurst, K.G. 2001. Effectiveness of broadscale fuel reduction burning in assisting with
wildfire control in parks and forests in Victoria. Victoria Department of Conservation and Environment
Research Report 51: 1-27.
McCaw, W.L.; Gould, J.S.; Cheney, N.P. 2008. Quantifying the effectiveness of fuel management in modi-
fying wildfire behavior. Pages 2-9 in Proceedings of the international bushfire research conference on
“fire, environment and society”. Bushfire Cooperative Research Centre and Australasian Fire Emergency
Service Authorities Council, Adelaide, Australia.
Minnich, R.A. 1983. Fire mosaics in southern California and northern Baja California. Science 219: 1287-1294.
Minnich, R.A.; Chou, Y.H. 1997. Wildland fire patch dynamics in the chaparral of southern California and
northern Baja California. International Journal of Wildland Fire 7: 221-248.Moghaddas, J.J.; Craggs, L. 2007. A fuel treatment reduces fire severity and increases suppression efficiency
in a mixed conifer forest. International Journal of Wildland Fire 16: 673-678.
Moore, E.B.; Smith, G.E.; Little, S. 1955. Wildfire damage reduced on prescribe-burn areas in New Jersey.
Journal of Forestry 53: 339-341.
Moritz, M.A. 2003. Spatiotemporal analysis of controls on shrubland fire regimes: age dependency and
fire hazard. Ecology 84: 351-361.
Omi, P.N. 1977. A case study of fuel management performances, Angeles National Forest, 1960-1975.
USDA Forest Service, General Technical Report WO-GTR-3: 404-411.
Omi, P.N.; Kalabokidis, K.D. 1991. Fire damage on extensively vs. intensively managed forest stands
within the North Fork Fire, 1988. Northwest Science 65: 149-157.
Omi, P.N.; Martinson, E.J. 2002. Effect of fuels treatment on wildfire severity. Final report submitted to
the Joint Fire Science Program Governing Board. Colorado State University, Fort Collins, CO. 36 p.
Omi, P.N.; Martinson, E.J.; Chong, G.W. 2006. Effectiveness of pre-fire fuel treatments. Final report submit-
ted to the Joint Fire Science Program Governing Board. Colorado State University, Fort Collins. 29 p.Outcalt, K.W.; Wade, D.D. 2004. Fuels management reduces tree mortality from wildfires in southeastern
United States. Southern Journal of Applied Forestry 28(1): 28-34.
Pollet, J.; Omi, P.N. 2002. Effect of thinning and prescribed burning on crown fire severity in ponderosa
pine forests. International Journal of Wildland Fire 11: 1-10.
Prestemon, J.P.; Pye, J.M.; Butry, D.T.; Holmes, T.P.; Mercer, D.E. 2002. Understanding broadscale wildfire
risks in a human-dominated landscape. Forest Science 48: 685-693.
Prichard, S.; Peterson, D.L. 2010. Do fuel treatments reduce fire severity? Evaluating treatment effectiveness
in the 2006 Tripod Complex fires. Final report submitted to the Joint Fire Science Program Governing
Board. University of Washington, Seattle. 28 p.
Raymond, C.L.; Peterson, D.L. 2005. Fuel treatments alter the effects of wildfire in a mixed-evergreen
forest, Oregon, USA. Canadian Journal of Forest Research 35: 2981–2995.
Richburg, J.A.; Patterson, W.A., III; Ohman, M. 2004. Fire management options for controlling woody
invasive plants in the northeastern and mid-Atlantic US. Final report submitted to the Joint Fire Science
Program Governing Board. University of Massachusetts, Amherst. 59 p.Ritchie, M.W.; Skinner, C.N.; Hamilton, T.A. 2007. Probability of tree survival after wildfire in an interior
pine forest of northern California: effects of thinning and prescribed fire. Forest Ecology and Manage-
ment 247: 200-208.
Safford, H.D. 2008. Fire severity in fuel treatments—American River Complex fire, Tahoe National For-
est, California. Unpublished report. USDA Forest Service, Pacific Southwest Region, Vallejo, CA. 21 p.
Safford, H.D.; Schmidt, D.A; Carlson, C.H. 2009. Effects of fuel treatments on fire severity in an area of
wildland-urban interface, Angora Fire, Lake Tahoe Basin, California. Forest Ecology and Management
258: 773-787.
Schroeder, D. 2006. Effectiveness of forest fuel management: a crown fire case study in the Northwest
Territories, Canada. Forest Engineering Research Institute of Canada, Vancouver, BC. 6 p.
Stone, C.; Hudak, A.; Morgan, P. 2004. Forest harvest can increase subsequent forest fire severity. USDA
Forest Service, General Technical Report PSW-GTR-208: 525-534.
Strom B.A.; Fule, P.Z. 2007. Pre-wildfire fuel treatments affect long-term ponderosa pine forest dynamics.
International Journal of Wildland Fire 16: 128-138.Thompson, J.R.; Spies, T.A.; Ganio, L.M. 2007. Reburn severity in managed and unmanaged vegetation
in a large wildfire. Proceedings of the National Academy of Sciences 104: 10743-10748.
van Leeuwen, W.J.D. 2008. Monitoring the effects of forest restoration treatments on post-fire vegetation
recovery with MODIS multitemporal data. Sensors 8: 2017-2042.
Van Wagner, R. 1968. Survival of coniferous plantations following fires in Los Angeles County. Journal
of Forestry 66: 622-625.
Vihanek, R.E.; Ottmar, R.D. 1993. When logged units burn in a wildfire, does slash treatment mitigate
effects? Proceedings of the Conference on Forest and Fire Meteorology 12: 709-714.
Wagle, R.F.; Eakle, T.W. 1979. A controlled burn reduces the impact of subsequent wildfire in a ponderosa
pine vegetation type. Forest Science 25: 123-129.

7/28/2019 Fuel Treatments and Fire Severity: A Meta-Analysis
http://slidepdf.com/reader/full/fuel-treatments-and-fire-severity-a-meta-analysis 37/40
35USDA Forest Service Res. Pap. RMRS-RP-103WWW. 2013
Weatherspoon, C.P.; Skinner, C.N. 1995. An assessment of factors associated with damage to tree crowns
from the 1987 wildfires in northern California. Forest Science 41: 430-451.
Weaver, H. 1957. Effects of prescribed burning in ponderosa pine. Journal of Forestry 55: 133-138.
Wilmes, L.; Martinez, D.; Wadleigh, L.; Denton, C.; Geisler, D. 2002. Apache-Sitgreaves National Forests
Rodeo-Chediski fire effects summary report. Unpublished report. USDA Forest Service, Apache-Sitgreaves
National Forests, Springerville, AZ. 68 p.
Wilson, A.A.G. 1988. Width of firebreak that is necessary to stop grass fires: some field experiments.
Canadian Journal of Forest Research 18: 682-687.
Wimberly, M.C.; Cochrane, M.A.; Baer, A.D.; Pabst, K. 2009. Assessing fuel treatment effectiveness using
satellite imagery and spatial statistics. Ecological Applications 19: 1377-1384.

7/28/2019 Fuel Treatments and Fire Severity: A Meta-Analysis
http://slidepdf.com/reader/full/fuel-treatments-and-fire-severity-a-meta-analysis 38/40

7/28/2019 Fuel Treatments and Fire Severity: A Meta-Analysis
http://slidepdf.com/reader/full/fuel-treatments-and-fire-severity-a-meta-analysis 39/40

7/28/2019 Fuel Treatments and Fire Severity: A Meta-Analysis
http://slidepdf.com/reader/full/fuel-treatments-and-fire-severity-a-meta-analysis 40/40
The Rocky Mountain Research Station develops scientific informationand technology to improve management, protection, and use of the
forests and rangelands. Research is designed to meet the needs of
the National Forest managers, Federal and State agencies, public and
private organizations, academic institutions, industry, and individuals.
Studies accelerate solutions to problems involving ecosystems, range,
forests, water, recreation, fire, resource inventory, land reclamation,
community sustainability, forest engineering technology, multiple use
economics, wildlife and fish habitat, and forest insects and diseases.
Studies are conducted cooperatively, and applications may be found
worldwide. For more information, please visit the RMRS web site at:
www.fs.fed.us/rmrs.
Station Headquarters
Rocky Mountain Research Station240 W Prospect Road
Fort Collins, CO 80526
(970) 498-1100
Research Locations
The U.S. Department of Agriculture (USDA) prohibits discrimination against itscustomers, employees, and applicants for employment on the bases of race,color, national origin, age, disability, sex, gender identity, religion, reprisal, andwhere applicable, political beliefs, marital status, familial or parental status,sexual orientation, or all or part of an individual’s income is derived from anypublic assistance program, or protected genetic information in employmentor in any program or activity conducted or funded by the Department. (Not allprohibited bases will apply to all programs and/or employment activities.) For more information, please visit the USDA web site at: www.usda.gov and click onthe Non-Discrimination Statement link at the bottom of the page.
Reno, Nevada
Albuquerque, New Mexico
Rapid City, South Dakota
Logan, Utah
Ogden, Utah
Provo, Utah
Flagstaff, Arizona
Fort Collins, Colorado
Boise, Idaho
Moscow, Idaho
Bozeman, Montana
Missoula, Montana
To learn more about RMRS publications or search our online titles:
www.fs.fed.us/rm/publications
Federal Recycling Program Printed on Recycled Paper