fuel economy and co emissions of light-duty vehicles in...
TRANSCRIPT

Fuel Economy and CO2 Emissions of Light-Duty
Vehicles in Tunisia
Centre for Environment and Development for the Arab Region and Europe
(CEDARE)
February, 2015

1
TABLE OF CONTENTS
1 Introduction ................................................................................................................... 4
1.1 Objectives ............................................................................................................... 4
2 Background .................................................................................................................... 5
2.1 Local air pollution and carbon emissions ................................................................. 5
2.2 Vehicle Stock and car ownership ............................................................................. 5
2.3 Automotive Industry ............................................................................................... 6
3 Regulations and Policy Environment .............................................................................. 7
3.1 Fuel subsidies .......................................................................................................... 7
3.2 Social aspects of fuel price hikes ............................................................................. 7
3.3 Customs and Taxation ............................................................................................. 8
4 Methodology ................................................................................................................. 9
5 Results and discussion .................................................................................................. 10
5.1 Average annual fuel economy in global context .................................................... 11
6 Conclusions .................................................................................................................. 13
6.1 Monitoring, Evaluation and Information Exchange................................................ 13
6.2 Future Studies ....................................................................................................... 14
7 References ................................................................................................................... 15
Annexes
ANNEX-1: GFEI CLASSIFICATION OF LDVS
ANNEX-2: SAMPLE OF LDV DATA

2
List of Tables
Table 1: Average Fuel Economy and emission rates of new gasoline and diesel fueled LDVs
(NEDC driving cycle) ............................................................................................................ 10
Table 2: Top 10 LDV models in 2012 in terms of sales ......................................................... 11
Table 3: Average engine size of new LDVs ........................................................................... 11
Table 4: Annual average fuel economy of new LDVs in context (units: l/100km, based on
NEDC driving cycle) ............................................................................................................. 11
List of Figures
Figure 1: Private cars relative growth in Tunisia, 2005-2013 (MEE, 2013a, edited) ................ 6
Figure 2: Trends of transportation fuel prices in Tunisia in US-cents/liter for diesel and super
gasoline respectively (GIZ, 2014) ........................................................................................... 7
Figure 3: Average Fuel Economy of new LDVs (l/100km, NEDC driving cycle) in Tunisia since
2005 .................................................................................................................................... 10

3
ACRONYM DESCRIPTION
CEDARE Center for Environment and Development for the Arab Region and Europe
CO2 Carbon Dioxide
CAMRE Council of Arab Ministers Responsible for the Environment
GDP Gross Domestic Product
GFEI Global Fuel Economy Initiative
GNI Gross National Income
IMF International Monetary Fund
LAS League of Arab States
LDV Light Duty Vehicle
MEE Ministère de l’Equipement et de l’Environnement
MEWA Middle East and West Asia
NEDC New European Driving Cycle
OECD Organization for Economic Cooperation and Development
OICA Organisation Internationale des Constructeurs d'Automobiles
PCFV Partnership for Cleaner Fuels and Vehicles
SUV Sports Utility Vehicles
UNEP United Nations Environment Programme
WB World Bank

4
1 INTRODUCTION
As part of the Global Fuel Economy Initiative (GFEI) and the strategic partnership between the
Center for Environment and Development for the Arab Region and Europe (CEDARE) and the United
Nations Environment Programme (UNEP) under the program titled Improving Fuel Quality and Fuel
Economy in Middle East & West Asia (MEWA), the present study aims to assess and fuel economy
and carbon emissions of light duty vehicles in Tunisia and to review relevant regulations. This case
study contributes to the global effort to reduce fuel-dependence, improve vehicle fleet
technologies, and mitigate the environmental and economic impact of inefficient vehicles in pursuit
of a more sustainable transport sector.
The scope of this report is limited to new Light Duty Vehicles (LDVs). Future studies may also address
on-road vehicles (i.e. the entire stock) and the rest of vehicle classifications.
The report firstly presents background about the context surrounding the automotive industry in
Tunisia and the associated environmental, economic and social aspects. An overview of the industry
is then presented with a brief summary of the relevant regulations related to the LDVs in Tunisia and
the policy environment. The methodology for data collection, calculations and analysis is then
explained and the results are presented and discussed. Recommendations for regulations and future
studies are presented in the final section of the report.
1.1 OBJECTIVES
The overall aim of this study is to present the case study of Tunisia in terms of the state of the
vehicle fuel economy and carbon emission trends of new LDVs in the past years. It is presented in
the context of the Global Fuel Economy Initiative (GFEI) target to reduce the global average of new
LDVs from 8 L/100 km today to 4 L/100 km (50%) by 2030, and to further achieve this 50% reduction
for the entire LDV stock by 2050; the 50-by-50 target.
The specific objectives of this study are as follows:
1. Report on the average fuel economy for new light duty vehicles in Tunisia and its trend over
time.
2. Present follow-up recommendations for policy-makers and regulators.

5
2 BACKGROUND
Tunisia is a North African and Arab country with a population of 10.9 million in 2013. It is classified
as a low-middle-income economy according to the World Bank classifications based on Gross
National Income (GNI) per capita (WB, 2014). Tunisia had a modest average GDP growth rate of
2.2% over the past three years, 2011-2013 (World databank, 2014). This may be attributed to the
significant economic crisis occurring during the year of the 2011 revolution of Tunisia.
For Tunisia, total number of vehicles on the road has been relatively stable from 2005 until 2012,
showing steady increase to exceed the one million over that period (OICA, 2014; MEE, 2013a). The
vast majority of LDVs are gasoline fueled, being 88% of total LDV sales in 2012.
2.1 LOCAL AIR POLLUTION AND CARBON EMISSIONS
Local air pollution is specifically of concern in the cities of Tunisia as the percentage of population
living in urban agglomerates exceeds 60% (Mraihi et al., 2015). Mobile emissions in Tunisia are
responsible for a large share of both CO2 emissions and local pollutants such Sulphur Oxides (SOx),
Nitrogen Oxides (NOx), and fine Particle Matter (PM), among other pollutants, which are likely to
increase in the future with gradual motorization (MEE, 2013a;Mraihi et al., 2015).
With regards to carbon emissions, according to Tunisia’s second national communications for the
United Nations Framework Convention For Climate Change (UNFCCC), 28% of all carbon emissions
from fossil fuels are attributed to the transport sector alone in year 2000 (MEE, 2013b). In more
upda-ted studies, this share is noted to be 45% (Mraihi et al. 2015). This shows the relative increase
in the contribution of this growing sector.
2.2 VEHICLE STOCK AND CAR OWNERSHIP
It is important to clearly differentiate between indicators of the total vehicle stock and the
indicators of the new vehicles entering the market. In this section, as background, an overview of
the total vehicle stock is presented.
Figure 1 in the following page shows that passenger cars constitute the majority of vehicle types and
they are the fastest growing category. In 2013, 67% of all motorized vehicle types were private cars,
and the total stock crossed one million in that year (MEE, 2013a).
In the period of 2005-2011 alone, passenger car ownership has increased by 36%, from 67 cars/1000
inhabitants in 2005 to 91 in 2011 (WB DataBank, 2014). This lies in a similar range to neighbouring
countries in North Africa, e.g. 76 cars per 1000 inhabitants in Algeria, 65 in Morocco and 45 in Egypt
in 2011 (WB DataBank, 2014; CAPMAS, 2015).

Figure 1: Private cars relative growth in Tunisia
Nevertheless, the ownership rate in Tunisia
to follow the same trajectory with economic development
in the same year of 2011 had ownership rates of
inhabitants respectively (WB DataBank, 2014).
business-as-usual scenario of rapid
as GDP per capita continues to rise
2.3 AUTOMOTIVE INDUSTRY
The automotive industry in Tunisiais a large employer and contributes to 5% of total GDP (IHK,
2011). It produces for both export and local demand. There are several older traditional sectors that
provide for industrial growth in Tunisia
others. However, in the recent years, the most notable evolution of the industrial sector was the
development of the automotive and
18% throughout the period 2000
components manufacturing for export is a priority sector for the government of Tunisia (US
Commercial Service, 2014). Automotive industry players in Tunisia include international groups such
as VALEO, SAGEM, LEONI, YAZAKI, FUBA, and LEAR (IHK, 2011).
European brands dominate the automobile market in Tunisia; Renault, Volkswagen, Peugeot, Fiat,
and Citroen. The American brands
12%), while Toyota and other Far East manufacturers remain with
(US Commercial Service, 2014).
Private cars relative growth in Tunisia, 2005-2013 (MEE, 2013a, edited)
in Tunisia is several times lower than most EU countries
to follow the same trajectory with economic development. For example, Italy, France and Germany
had ownership rates of 605, 482, and 530 passenger cars per 1000
inhabitants respectively (WB DataBank, 2014).It is expected for a growing developing country
vehicle ownership will occur throughout the economic transition
rise (IMF, 2008).
The automotive industry in Tunisiais a large employer and contributes to 5% of total GDP (IHK,
t produces for both export and local demand. There are several older traditional sectors that
al growth in Tunisia, such as textiles and clothingand agro-industry, among
the recent years, the most notable evolution of the industrial sector was the
development of the automotive and aeronautics components of which exports have inc
18% throughout the period 2000-2012 (Trape et al., 2014). Today, investment in
components manufacturing for export is a priority sector for the government of Tunisia (US
utomotive industry players in Tunisia include international groups such
as VALEO, SAGEM, LEONI, YAZAKI, FUBA, and LEAR (IHK, 2011).
European brands dominate the automobile market in Tunisia; Renault, Volkswagen, Peugeot, Fiat,
ands GM and Ford are both present but with a minor share (below
12%), while Toyota and other Far East manufacturers remain with no significant presence in Tunisia
6
most EU countries but likely
Italy, France and Germany
passenger cars per 1000
for a growing developing country that a
will occur throughout the economic transition
The automotive industry in Tunisiais a large employer and contributes to 5% of total GDP (IHK,
t produces for both export and local demand. There are several older traditional sectors that
industry, among
the recent years, the most notable evolution of the industrial sector was the
of which exports have increased by
investment in automotive
components manufacturing for export is a priority sector for the government of Tunisia (US
utomotive industry players in Tunisia include international groups such
European brands dominate the automobile market in Tunisia; Renault, Volkswagen, Peugeot, Fiat,
Ford are both present but with a minor share (below
presence in Tunisia
7
3 REGULATIONS AND POLICY ENVIRONMENT
The Tunisian market is unique in the sense that the vast majority, with the exception of a niche of
luxury cars, is determined by the government. A strict quota system is enforced to cap the number
of vehicles allowed into the country annually. The quotas are determined by several factors: the
country’s trade deficit, local demand, and investment arrangements among foreign car makers and
domestic parts manufacturers (US Commercial Service, 2014). Cars in the market are predominantly
small and economic cars of European brands.
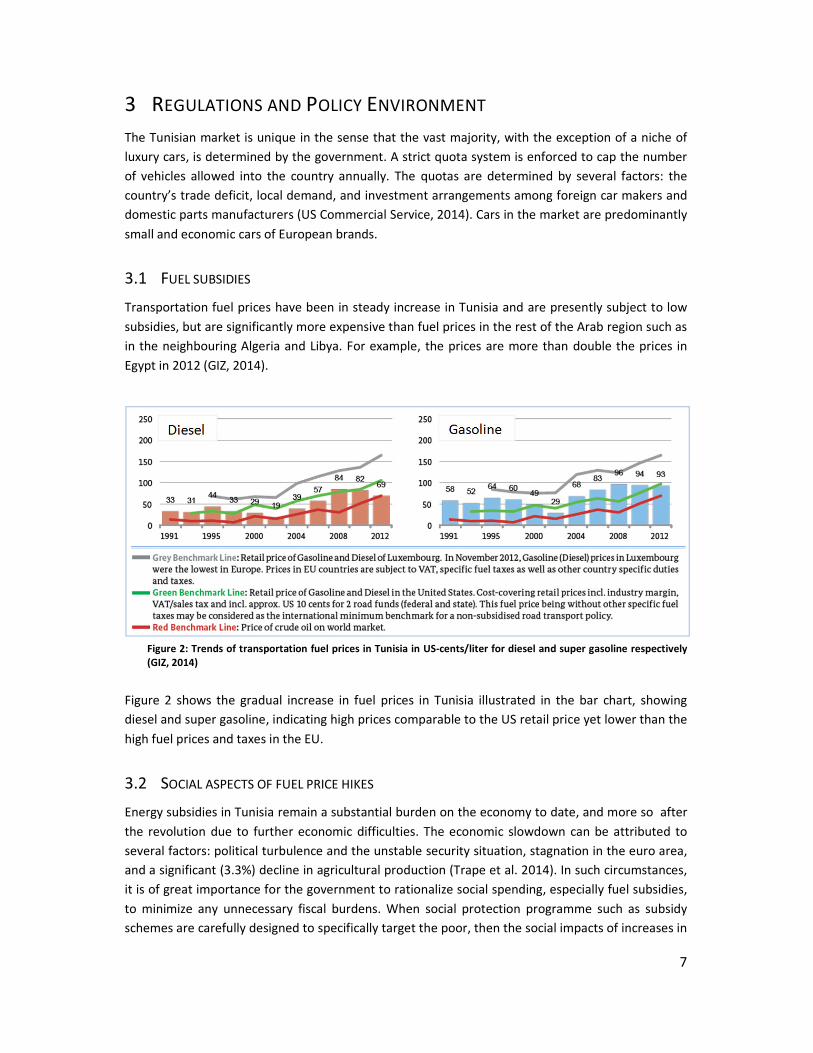
3.1 FUEL SUBSIDIES
Transportation fuel prices have been in steady increase in Tunisia and are presently subject to low
subsidies, but are significantly more expensive than fuel prices in the rest of the Arab region such as
in the neighbouring Algeria and Libya. For example, the prices are more than double the prices in
Egypt in 2012 (GIZ, 2014).
Figure 2: Trends of transportation fuel prices in Tunisia in US-cents/liter for diesel and super gasoline respectively
(GIZ, 2014)
Figure 2 shows the gradual increase in fuel prices in Tunisia illustrated in the bar chart, showing
diesel and super gasoline, indicating high prices comparable to the US retail price yet lower than the
high fuel prices and taxes in the EU.
3.2 SOCIAL ASPECTS OF FUEL PRICE HIKES
Energy subsidies in Tunisia remain a substantial burden on the economy to date, and more so after
the revolution due to further economic difficulties. The economic slowdown can be attributed to
several factors: political turbulence and the unstable security situation, stagnation in the euro area,
and a significant (3.3%) decline in agricultural production (Trape et al. 2014). In such circumstances,
it is of great importance for the government to rationalize social spending, especially fuel subsidies,
to minimize any unnecessary fiscal burdens. When social protection programme such as subsidy
schemes are carefully designed to specifically target the poor, then the social impacts of increases in

8
fuel prices can be largely mitigated. International experience has also consistently shown that the
fossil fuel subsidies are often disproportionately benefiting the richer strata of society and should
rather be phased out and transferred to targeted support schemes (WB, 2012). Social protection
progress however remains relatively untargeted in Tunisia (Trape et al. 2014). There is therefore an
opportunity to further improve the measures taken to mitigate the social impact of subsidy phase-
outs in advance.
3.3 CUSTOMS AND TAXATION
The key features of the customs and taxation environment for vehicles in Tunisia are as follows (US
Commercial Service, 2014):
• A progressive tax on all vehicle imports is imposed, rising with vehicle age up to the limit of
five years.
• A high consumption tax is imposed on automobiles with large capacity engines purchased
through authorized distributers; 67% for gasoline engines and 88% for diesel engines. The
rate is deliberately controlled to allow automobiles to be competitive with vehicles
purchased privately in Europe and elsewhere that are shipped back to Tunisia.
• A higher consumption tax is imposed on automobiles with large capacity engines that are
not purchased through authorized distributers; up to 277% for gasoline engines and 360%
for diesel-fueled engines.
The five years limit also applies to Tunisians abroad who ship their vehicles to Tunisia, in order to
avoid influx of older inefficient vehicles from abroad.

9
4 METHODOLOGY
The methodology used was in principle based on the Global Fuel Economy Initiative (GFEI)
methodology provided through the online GFEI toolbox1. It is used to harmonize global efforts in
constructing baselines and identifying trends of national fuel economy and CO2 emissions of light-
duty vehicles (LDVs). LDVs include mini, small, compact, family and big cars in addition to light vans
and sport utility vehicles (SUVs) (Annex 1).
The new LDVs data are compiled from sales data from automotive markets consultant Matthias
Gasnier and is based on compiled manufacturers’ data and expert estimation to include all car sales
through authorized dealers. A sample of the data set is presented in Annex 2 with notes on the
assumptions. The data set includes the following vehicle characteristics:
• Vehicle make
• Vehicle model and type
• Model production year
• Engine size (in cubic meters; cc)
• Vehicle origin
• Fuel type
• Sales per vehicle model and fuel type
Based on the available data, the fuel economy figures were obtained for each vehicle as available
from manufacturers and normalized to the New European Driving Cycle (NEDC) where needed using
the online tool of the International Council for Clean Transport (ICCT)2. Manufacturers’ specifications
manuals and compilations of the French Environment and Energy Management Agency (ADEME)
have also been used to assign the best available fuel economy and CO2 emissions figures for each
LDV model3. Models for which emission factors were not attainable were less than 1 % of all models
covered in the study years.
Information on total vehicle stock was also researched and provided in the background section in
order to put results into perspective and facilitate the analysis.
1 GFEI toolbox: http://www.unep.org/transport/gfei/autotool/about.asp
2 ICCT conversion tool: http://www.theicct.org/info/data/GlobalStdReview_Conversionfactor.xlsx
3 ADEME’s online resource for data on fuel economy and energy emissions of new cars:
http://carlabelling.ademe.fr/

5 RESULTS AND DISCUSSION
Figure 3 shows average annual fuel economy (l/100km) trends for new LDVs in Tunisia for the year
2005, 2008, 2010 and 2012.Figures are for both gasoline and diesel LDVs combined, noting that
gasoline fueled LDVs are about 90% of sales
economy for diesel and gasoline vehicles are shown in
Figure 3: Average Fuel Economy of new LDVs (l/100km
The FE trends show very minor fluctuation (within 2%)
observed reaching 5.37 l/100km in 2012. Furthermore, e
similar overall improvement. Table
new LDVs over the same years. Although the new LDVs are predominantly gasoline fueled,
shows the average FE for new diesel LDV
range.
Table 1: Average Fuel Economy and emission rates
FE of Gasoline fueled LDVs (l/100km)
FE of diesel fueled LDVs (l/100km)
Average FE of all new LDVs (l/100km)
Average CO2 emission rate, all new LDVs(gCO
It was notable that although sales
models increased to further diversify the choices becoming
shows the top 10 LDV models in 2012 in terms of sales.
represent 67% of all sales in the same year and most of them are of relatively small engine sizes,
most commonly 1200 cc.
AND DISCUSSION
fuel economy (l/100km) trends for new LDVs in Tunisia for the year
2005, 2008, 2010 and 2012.Figures are for both gasoline and diesel LDVs combined, noting that
90% of sales in all years. The separate figures for average fuel
economy for diesel and gasoline vehicles are shown in Table 1.
: Average Fuel Economy of new LDVs (l/100km, NEDC driving cycle) in Tunisia since 2005
very minor fluctuation (within 2%) but a general overall improvement
reaching 5.37 l/100km in 2012. Furthermore, emission rates, shown in Table
Table 1 also shows a steady level of annual average fuel economy of
new LDVs over the same years. Although the new LDVs are predominantly gasoline fueled,
shows the average FE for new diesel LDVs separately to note that they also fall within the similar
and emission rates of new gasoline and diesel fueled LDVs (NEDC driving
2005 2008 2010
LDVs (l/100km) 5.44 5.43 5.46
5.66 5.09 5.17
FE of all new LDVs (l/100km) 5.46 5.40 5.43
all new LDVs(gCO2/km) 135 136 136
It was notable that although sales have slightly decreased between 2010 and 2012, the number of
o further diversify the choices becoming 77 models in the market in
shows the top 10 LDV models in 2012 in terms of sales. Together, the top 10 (of
of all sales in the same year and most of them are of relatively small engine sizes,
10
fuel economy (l/100km) trends for new LDVs in Tunisia for the years
2005, 2008, 2010 and 2012.Figures are for both gasoline and diesel LDVs combined, noting that
he separate figures for average fuel
improvement is
Table 1, show
fuel economy of
new LDVs over the same years. Although the new LDVs are predominantly gasoline fueled, Table 1
separately to note that they also fall within the similar
(NEDC driving cycle)
2010 2012
5.46 5.37
5.17 5.37
5.43 5.37
136 134
have slightly decreased between 2010 and 2012, the number of
the market in 2012. Table 2
Together, the top 10 (of 77 models)
of all sales in the same year and most of them are of relatively small engine sizes,

11
Table 2: Top 10 LDV models in 2012 in terms of sales
Model Fuel Type Engine size
(Liter) Total sales
Fuel Economy
(l/100km)
Renault Symbol Gasoline 1.2 4774 5.8
VW Polo Gasoline 1 3273 3.99
Kia Rio Gasoline 1.2 2636 4.13
Ford Fiesta Gasoline 1.2 2326 5.8
Fiat Punto Gasoline 1.2 1906 5.7
Peugeot 206 Gasoline 1.4 1869 6
VW Golf Gasoline 1.2 1213 4.61
Chevrolet Aveo Gasoline 1.2 1183 3.92
Citroen C3 Gasoline 1.6 1161 6.1
Seat Ibiza Gasoline 1.2 1122 5.5
The two factors of the limited purchasing power in Tunisia, together with the regulatory
environment favouring smaller LDVs (in terms of engine size) are both likely to be the key
influencing factors creating this distribution of low-consumption small-engine vehicles dominating
the market. Furthermore, the operating cost is relatively high if comparing the fuel prices with prices
of neighbouring countries Algeria and Libya.
Table 3 below shoes the annual average engine size of all the new LDVs in Tunisia throughout the
period 2005-2012.
Table 3: Average engine size of new LDVs
Year Average Engine Size
2005 1.2
2008 1.3
2010 1.3
2012 1.3
The table above gives a more representative indication of average engine sizes showing that the
average new LDV engine has been consistently small.
5.1 AVERAGE ANNUAL FUEL ECONOMY IN GLOBAL CONTEXT
To put the study results into perspective, Table 4 compares the figures of Tunisia with OECD and
non-OECD country averages as well as the global average.
Table 4: Annual average fuel economy of new LDVs in context (units: l/100km, based on NEDC driving cycle)
2005 2008 2010 2012 2030
GFEI a 8.07
4.03 (global target)
Globala 8.07 7.67
OECDa 8.21 7.66
Non-OECDa 7.49 7.68
Tunisia 5.46 5.40 5.43 5.37
a: Source: GFEI (2013)

12
Table 4 shows that the average fuel economy for new LDVs in Tunisia approx. 5.4 l/100km
throughout the years, which is already 33% less than the global baseline of 8 l/100km in 2005. If the
global trend follows the trajectories suggested by GFEI (2.7% annual decrease), then the global
average will reach 5.4 l/100km by 2020. Tunisia is therefore among the countries in a very good
position to achieve and even exceed the GFEI targets of 2030.
Furthermore, with regards to the average emission rates shown in Table 1(p.10), the low rate
reflects a relatively high standard in the global context. It is already very close to the EU targets of
phasing-in average emissions rates of new cars of 130 g/km (5.6 l/km) by 2015 (GFEI, 2013).
However, further studies on the total stock of vehicles in Tunisia must be conducted to see if the
2050 global target of GFEI for all cars is also easily achievable in Tunisia. Furthermore, monitoring of
the total fuel consumption of vehicles must also be put into considerations, noting that more having
efficient vehicles does not guarantee less consumption and emissions in absolute terms, especially if
holistic approaches to sustainable mobility are not taken.

13
6 CONCLUSIONS
Fuel economy in Tunisia and emissions rates of new LDVs are in a relatively good position, at a
significantly lower level than that of the global average and even lower than the trajectory of the
GFEI global targets (2.7% annual decrease from 8 l/100km in 2005). This may be attributed to
several factors, including the regulatory environment favouring small cars, the relatively high
gasoline and diesel prices (compared to neighbouring countries), and the low GDP-per-capita.
However, restrained demand due to socio-economic constraints might mean that there is significant
latent demand that would rise later once the economy improves, especially that the total stock is
increasing significantly as illustrated in Figure 1(p.6), as well as car ownership rates.
As an emerging economy at an early stage of motorization, Tunisia has a very good opportunity to
adopt a sustainable approach to transportation planning to avoid going through the same business-
as-usual trajectory of high motorization experienced in many developed countries in the past. A
sustainable approach would require holistic planning of the transport sector and city planning to
favour public transport and non-motorized transport as well as improved land-use planning,
increased awareness about sustainable mobility, among other similar measures in order to
compliment the steps taken to improve the vehicle technologies. It is important that decision
makers, planners, and citizens are made aware of the advantages of being at an early stage of
motorization in order to plan in advance for more sustainable cities.
Furthermore, despite being in a good position in terms of new LDVs, it is important to ensure careful
monitoring of the vehicle stocks and flows and their impact on energy resources and emissions in
order to monitor, evaluate, and improve the development trends of the sector.
6.1 MONITORING, EVALUATION AND INFORMATION EXCHANGE
Formal monitoring and evaluation mechanisms are necessary to ensure an annual assessment of
both the vehicle stock and the new LDVs (and other categories of vehicles eventually), including
assessment of fuel consumption, in order to have a better understanding of the improvement in the
vehicle stock and its impact on energy resources and the environment. This also facilitates
comparison with other countries.
It has been a challenge throughout the study period to obtain official data about vehicles,
specifications, regulations, and plans, etc. However, as a constructive step for further engagement in
the cleaner vehicles debate, public authorities have been informed of the study through the League
of Arab States (LAS), and formal written communication through LAS was conducted to inform
relevant authorities in Tunisia about the study, as well as the presentation of interim results of the
case study of Tunisia in the League of Arab States at the regional forum of the Council of Arab States
Responsible for the Environment (CAMRE) titled 'Promoting Better Vehicular Fuel Quality and Fuel
Economy Policies for the Arab Region' held in Cairo in November 2014. One of the key issues
discussed during the forum was indeed the lack of information and disaggregate data and efficient
means for information exchange.

14
Part of the monitoring, evaluation and information exchange can be the encouragement of industry
reporting (whether compulsory or voluntary), such as already conducted in numerous developing
countries including India, Brazil, Philippines, and Turkey4.
This will also help showcase the results of the existing policies in Tunisia and the quota system so
that it may offer lessons learnt for other countries with similar conditions.
6.2 FUTURE STUDIES
The scope of this study has been limited to new LDVs. A gap of information still exists with regards
to the entire vehicle stock and the consumption trends, as well as the end-of-life vehicles. In order
to have a better understanding of the impact of LDVs on carbon emissions and energy resources, it
is recommended to proceed to the next step of this study and investigate the state of the entire
vehicles stock and identify the opportunities to effectively manage stocks and flows of vehicles and
fuels and to ensure sustainability of the sector based on reliable information about it and
stakeholder involvement. With this future study, a stronger argument can be made with regards to
the importance of improving availability and exchange of sector-specific information to facilitate
international cooperation in achieving the global and national targets of cleaner fuels and vehicles.
4 For case studies on various regulations,
see:http://www.unep.org/transport/gfei/autotool/nextsteps/case_study_at_a_glance.asp

15
7 REFERENCES
1. Center for Climate and Energy Solutions (C2ES). (2014). Federal Vehicles Standards.
Available at: http://www.c2es.org/federal/executive/vehicle-standards. Accessed:
September 10th
, 2014.
2. Central Agency for Public Mobilization and Statistics (2015). Central Agency for Public
Mobilization and Statistics (CAPMAS), Arabic Republic of Egypt. Online database. Retrieved
from: http://www.capmas.gov.eg
3. Federal Ministry for Economic Cooperation and Development [GIZ] (2014), International
Fuel Prices, 2012/2013, 8th
edition. Available at:
http://www.giz.de/expertise/downloads/giz2014-en-international-fuel-prices-2013.pdf
4. Global Fuel Economy Initiative (2014): Developing a baseline. Available at:
http://www.unep.org/transport/gfei/autotool/nextsteps/developing_a_baseline.asp.
Accessed: August 19th
, 2014 30.
5. Global Fuel Economy Initiative (2013): Global Fuel Economy Initiative: Plan of Action 2012-
2015. Retrieved
from:http://www.globalfueleconomy.org/Documents/Publications/workplan.pdf
6. Industrie und Handelskammer (2011): Tunisia: An attractive destination for Automotive
Industry. Industrie und Handelskammer (IHK) Nürnberg für Mittelfranken. Retrieved from:
https://www.ihk-nuernberg.de/de/media/PDF/veranstaltungs-pdfs/International/tunisia-as-
automotive-industry.pdf
7. International Monetary Fund (2008). Chapter 4: Climate Change and the Global Fuel
Economy, World Economic Outlook 2008. Retrieved from:
http://www.imf.org/external/pubs/ft/weo/2008/01/pdf/c4.pdf
8. Ministère de l’Equipementet de l’Environnement (2013a): National Report on the State of
Environment for years 2012-2013 (in Arabic). Retrieved from:
http://www.environnement.gov.tn/fileadmin/medias/pdfs/etat_env/rnee_2012_ar.pdf
9. Ministère de l’Equipement et de l’Environnement (2013) : National Report on the State of
Environment for years 2012-2013 (in Arabic). Retrieved from:
http://www.environnement.gov.tn/fileadmin/medias/pdfs/etat_env/rnee_2012_ar.pdf
10. The globaleconomy.com (2014). Tunisia Gasoline Consumption. Available at:
http://www.theglobaleconomy.com/Tunisia/gasoline_consumption/. Accessed: September
25th
, 2014.
11. The International Organization of Motor Vehicle Manufacturers (OICA). Total in Use 2012.
Available at: http://www.oica.net/category/about-us/. Accessed: September 4th
, 2014.

16
12. The Organization for Economic Cooperation and Development (OECD) (2007). African
Economic Outlook: Tunisia. Available at:
http://www.oecd.org/dev/emea/africaneconomicoutlook2007.htm. Accessed: September
17th
, 2014.
13. The World Bank (2014): Country and Lending Groups, available at:
http://data.worldbank.org/about/country-and-lending-groups#Lower_middle_income,
accessed: December 16, 2014.
14. United States of America. Government Accountability office (2008). Vehicle Fuel Economy.
New York: Novinka books.
15. United Stated Commercial Service (2014): Doing Business in Tunisia: 2014 Country
Commercial Guide for U.S. Companies. Retrieved from:
http://photos.state.gov/libraries/tunisia/231771/PDFs/2014%20ccg.pdf
16. World Bank dataBank (2014): World Development Indicators, 2013 data, retrieved from:
http://databank.worldbank.org , accessed: December 16 , 2014.
17. World Bank (2012): The Real Costs of Fossil Fuel Subsidies. Retrieved from:
http://www.worldbank.org/en/news/feature/2012/05/09/real-costs-fossil-fuel-subsidies
18. World Bank (2014): Country and Lending Groups. Retreived from:
http://data.worldbank.org/about/country-and-lending-groups
19. Trape, P., Chauvin, M., Salah, H. (2014): African Economic Outlook: Tunisia 2014. Retrieved
from:
http://www.africaneconomicoutlook.org/fileadmin/uploads/aeo/2014/PDF/CN_Long_EN/T
unisie_EN.pdf

ANNEX-1: GFEI DEFINITION OF LDVS
Vehicle Segment Examples
A: Mini / Micro / Small town car
Smallest cars, with a length between 2.50m to 3.60m.
Citroën C1
Fiat Panda
Smart Fortwo
B: Small compact
Slightly more powerful than the Minis; still primarily for urban
use; length between 3.60m and 4.05m
Mitsubishi Colt
Opel Corsa
Suzuki Swift
C: Compact
Length between 4.05m – 4.50m
Mazda 3
SubaruImpreza
Volvo S40
D: Family cars
Designed for longer distance; fits 5- 6 people; length is 4.50m to
4.80m
BMW 3 series
Chrysler Sebring
Lexus IS
Light vans
Size is similar to D, but interior volume is maximized to
accommodate larger families
Chevrolet Uplander
Ford Galaxy
Volkswagen Sharan
Big / Full size cars
Have generous leg room; can comfortably transport 5 - 6
people; generally have
V8 engines and are 5m or longer in length
Cadillac DTS
Jaguar XJ
Mercedes-Benz E Class
SUV / All terrain
The original cars were utility cross-country vehicles with integral
transmissions like the Jeep
Dodge Durango
Jeep Grand Cherokee
Nissan Patrol
Toyota Land Cruiser

ANNEX-2: SAMPLE LDV DATA
Make Model Fuel Type Engine size (liter) Total sales Fuel economy
(l/100km)
Co2 emissions
(g/Km)
Renault Symbol Gasoline 1.2 4774 5.8 135
VW Polo Gasoline 1 3273 3.99 108
Kia Rio Gasoline 1.2 2636 4.13 114
Ford Fiesta Gasoline 1.2 2326 5.8 139
Fiat Punto Gasoline 1.2 1906 5.7 136
Peugeot 206 Gasoline 1.4 1869 6 139
VW Golf Gasoline 1.2 1213 4.61 129
Chevrolet Aveo Gasoline 1.2 1183 3.92 111
Citroen C3 Gasoline 1.6 1161 6.1 145
Seat Ibiza Gasoline 1.2 1122 5.5 125
Peugeot 207 Gasoline 1.4 834 6.3 145
Renault Symbol Diesel 1.5 777 4.4 115
Peugeot Partner Diesel 1.6 656 6.19 175
Citroen C4 Diesel 1.6 636 4.5 120
Citroen Berlingo Diesel 1.9 389 5.7 181
Peugeot Bipper Diesel 1.3 356 4.5 119
Citroen C4 Gasoline 1.6 328 6.4 153
Dacia Logan Gasoline 1.4 320 6.8 157
Peugeot 508 Gasoline 1.6 308 7.1 164
Chevrolet cruze Gasoline 1.6 301 6.5 153
Kia Picanto Gasoline 1 266 5.9 139
Renault Fluence Gasoline 1.6 261 6.5 149
Audi A4 Gasoline 1.8 256 5.8 139
Fiat Linea Gasoline 1.4 218 6.3 156.1
BMW 1 Series Gasoline 1.6 194 6.3 150
Mazda 3 Gasoline 1.6 193 6.4 147