fuel conversions mechanical engineering 694c seminar in energy resources, technology and policy...
Post on 20-Dec-2015
215 views
TRANSCRIPT
Fuel ConversionsFuel Conversions
Mechanical Engineering 694CSeminar in Energy Resources,
Technology and Policy
Larry Caretto
November 6, 2002
2
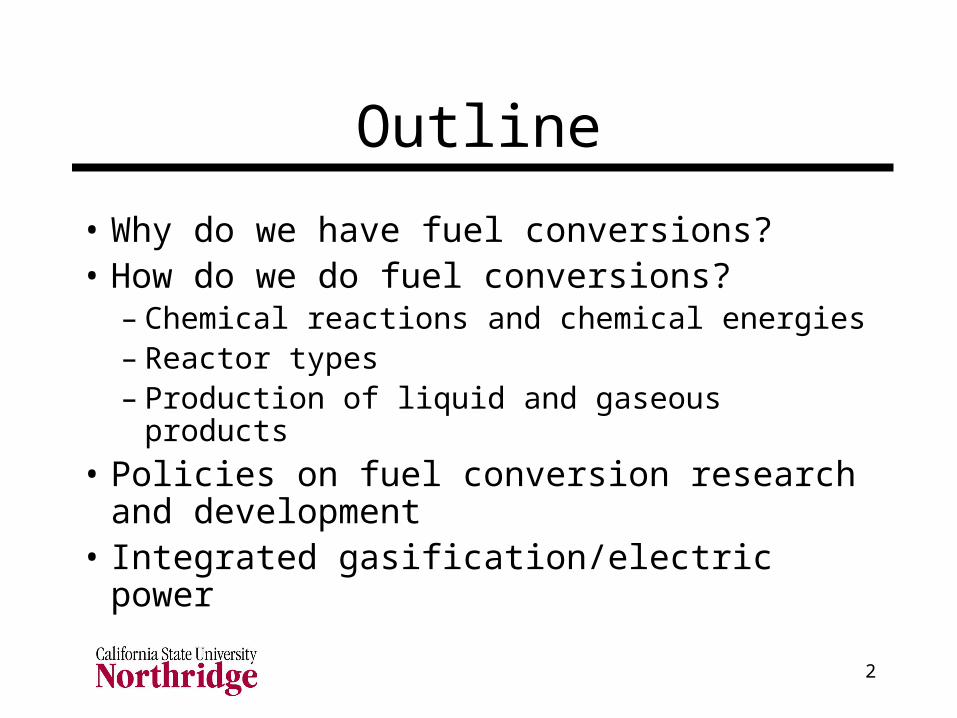
Outline
• Why do we have fuel conversions? • How do we do fuel conversions?
– Chemical reactions and chemical energies– Reactor types– Production of liquid and gaseous products
• Policies on fuel conversion research and development
• Integrated gasification/electric power
3
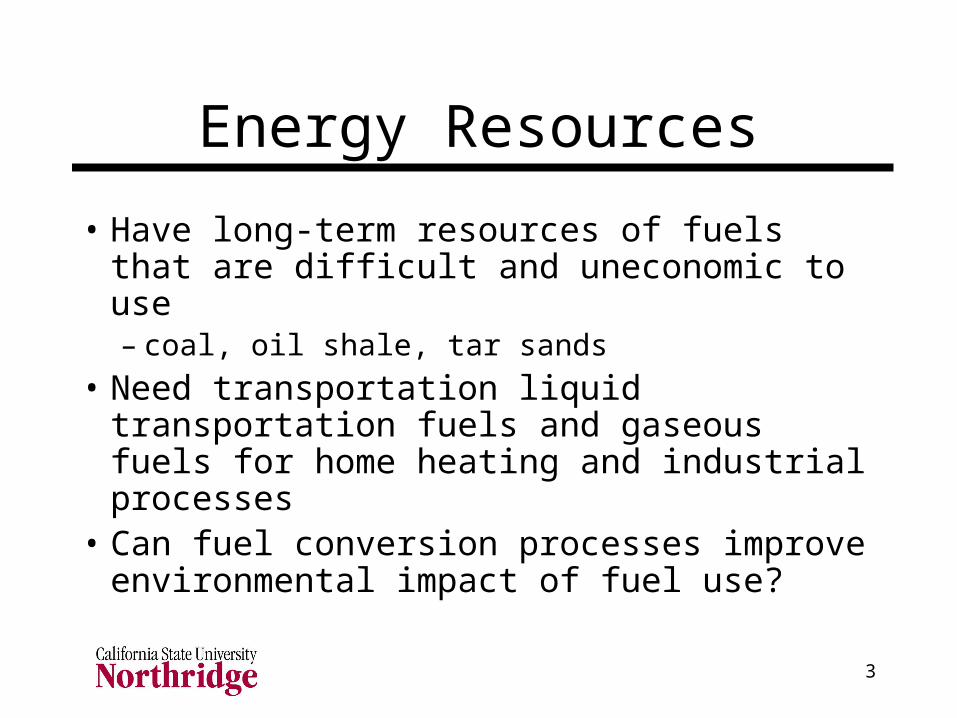
Energy Resources
• Have long-term resources of fuels that are difficult and uneconomic to use– coal, oil shale, tar sands
• Need transportation liquid transportation fuels and gaseous fuels for home heating and industrial processes
• Can fuel conversion processes improve environmental impact of fuel use?
4
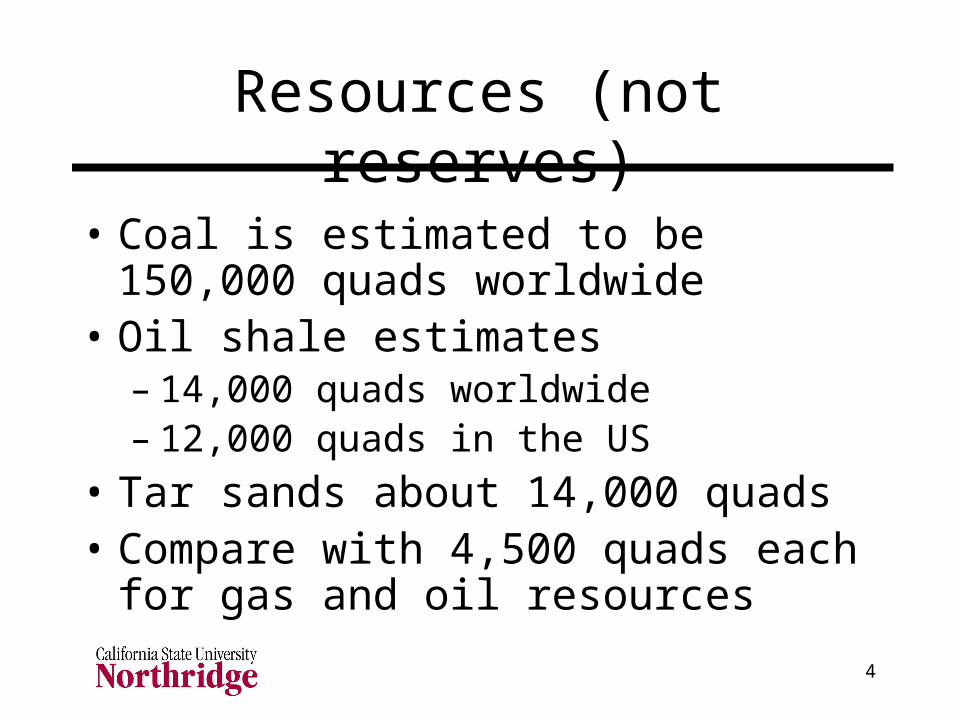
Resources (not reserves)
• Coal is estimated to be 150,000 quads worldwide
• Oil shale estimates– 14,000 quads worldwide– 12,000 quads in the US
• Tar sands about 14,000 quads• Compare with 4,500 quads each for gas
and oil resources
5
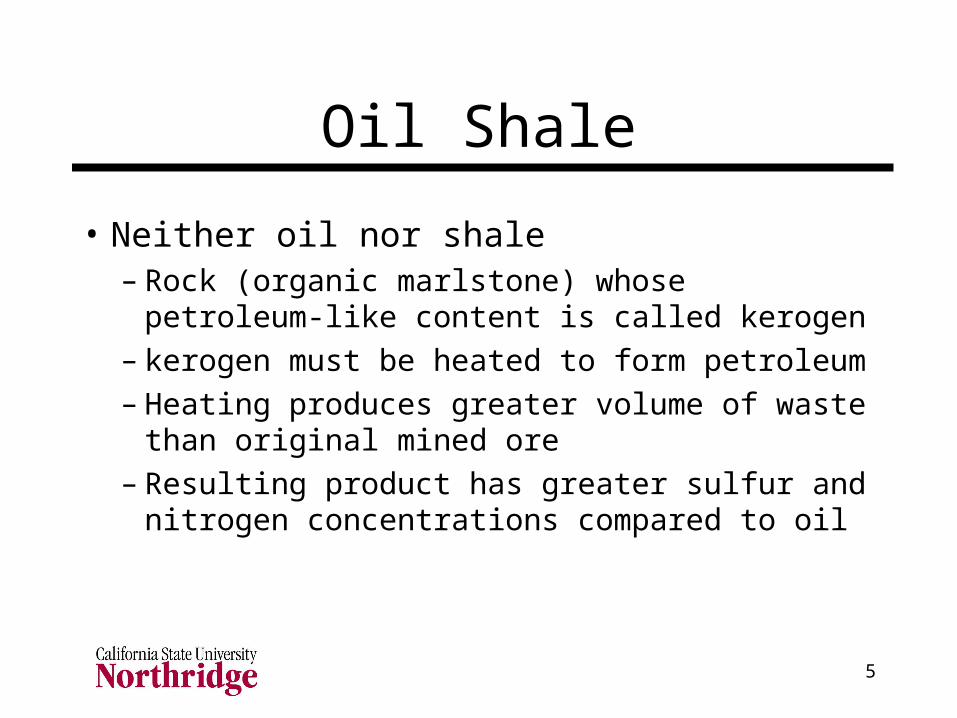
Oil Shale
• Neither oil nor shale– Rock (organic marlstone) whose
petroleum-like content is called kerogen– kerogen must be heated to form petroleum– Heating produces greater volume of waste
than original mined ore– Resulting product has greater sulfur and
nitrogen concentrations compared to oil
6
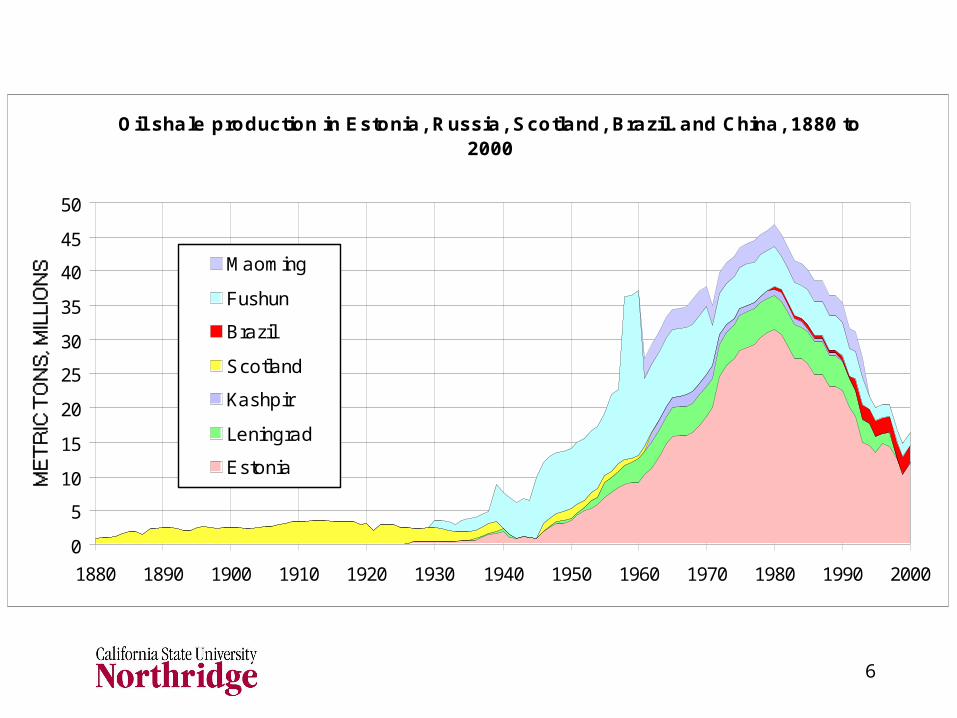
Oil shale production in Estonia, Russia, Scotland, Brazil. and China, 1880 to 2000
0
5
10
15
20
25
30
35
40
45
50
1880 1890 1900 1910 1920 1930 1940 1950 1960 1970 1980 1990 2000
Maoming
Fushun
Brazil
Scotland
Kashpir
Leningrad
Estonia
7
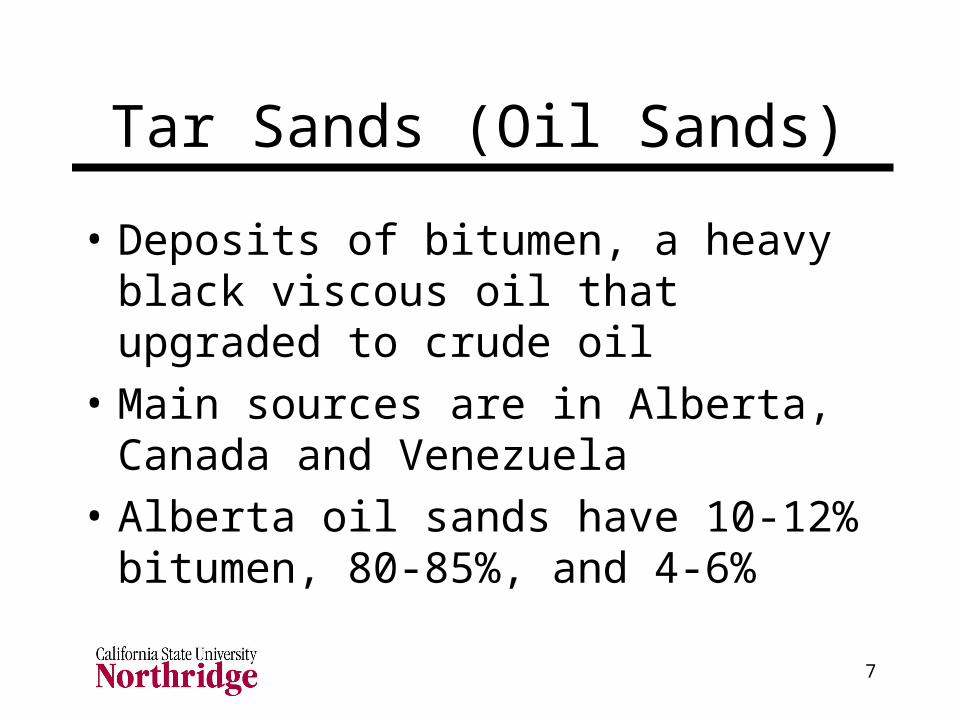
Tar Sands (Oil Sands)
• Deposits of bitumen, a heavy black viscous oil that upgraded to crude oil
• Main sources are in Alberta, Canada and Venezuela
• Alberta oil sands have 10-12% bitumen, 80-85%, and 4-6%
8
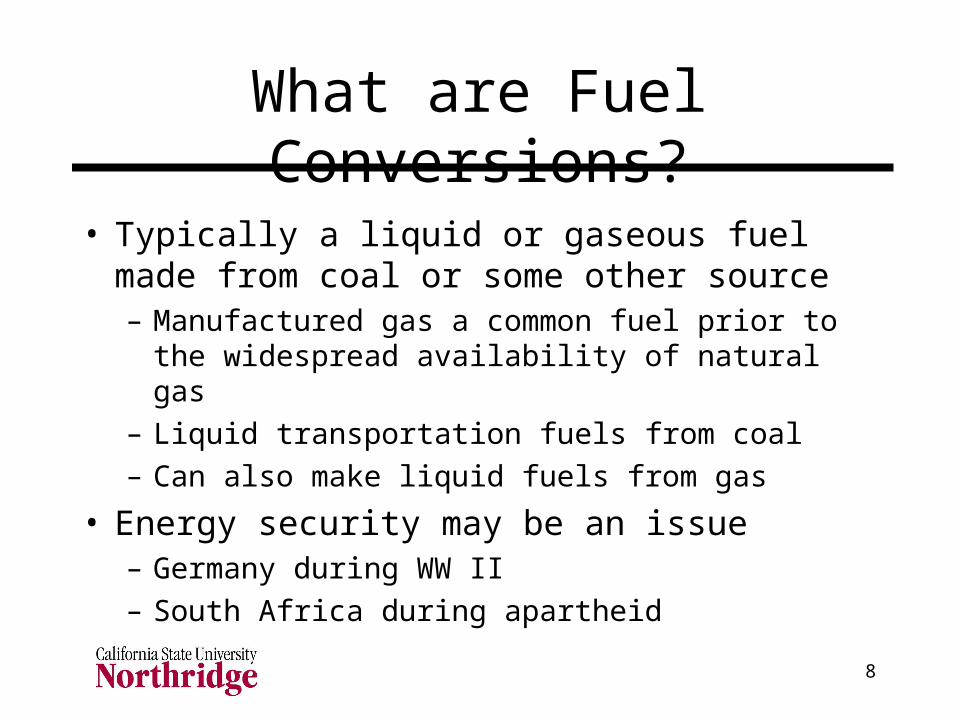
What are Fuel Conversions?
• Typically a liquid or gaseous fuel made from coal or some other source– Manufactured gas a common fuel prior to the
widespread availability of natural gas– Liquid transportation fuels from coal– Can also make liquid fuels from gas
• Energy security may be an issue– Germany during WW II– South Africa during apartheid
9
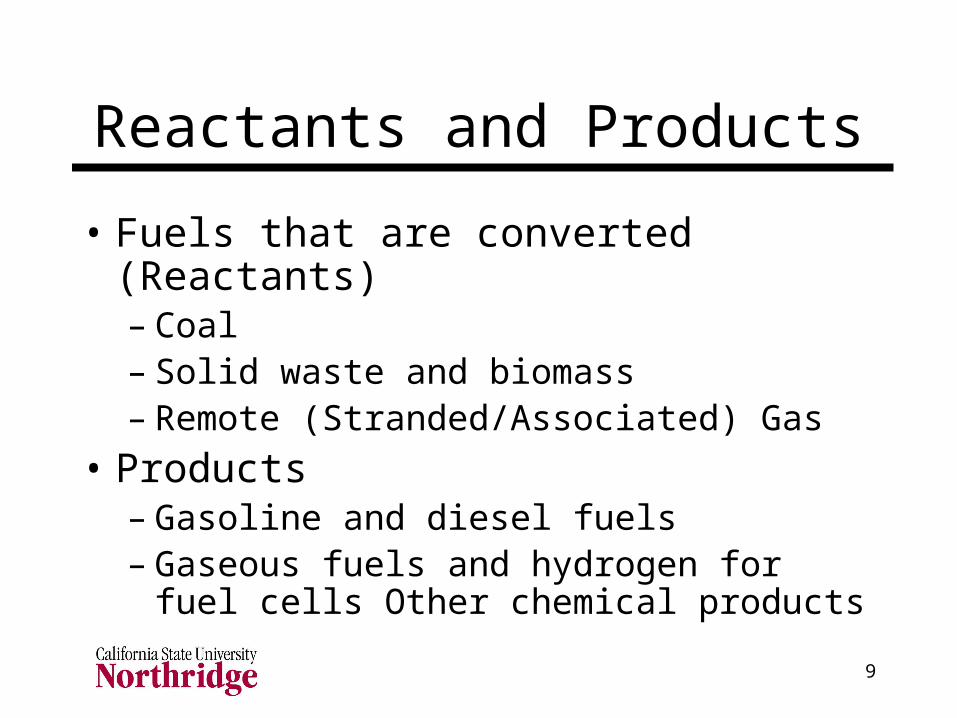
Reactants and Products
• Fuels that are converted (Reactants)– Coal– Solid waste and biomass– Remote (Stranded/Associated) Gas
• Products– Gasoline and diesel fuels– Gaseous fuels and hydrogen for fuel cells
Other chemical products
10
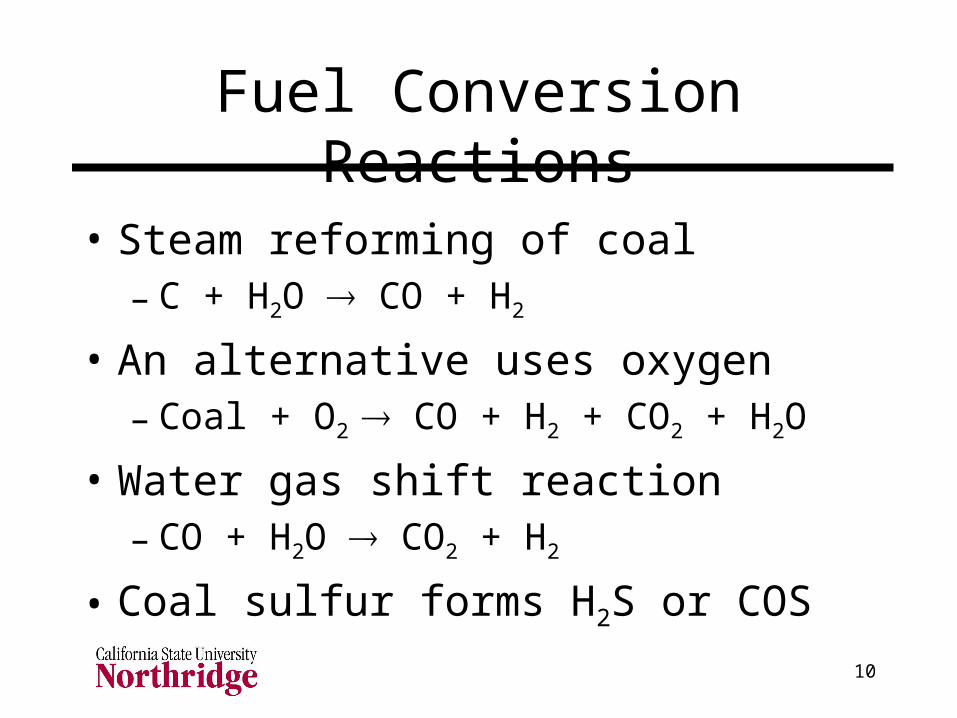
Fuel Conversion Reactions
• Steam reforming of coal– C + H2O CO + H2
• An alternative uses oxygen– Coal + O2 CO + H2 + CO2 + H2O
• Water gas shift reaction– CO + H2O CO2 + H2
• Coal sulfur forms H2S or COS
11
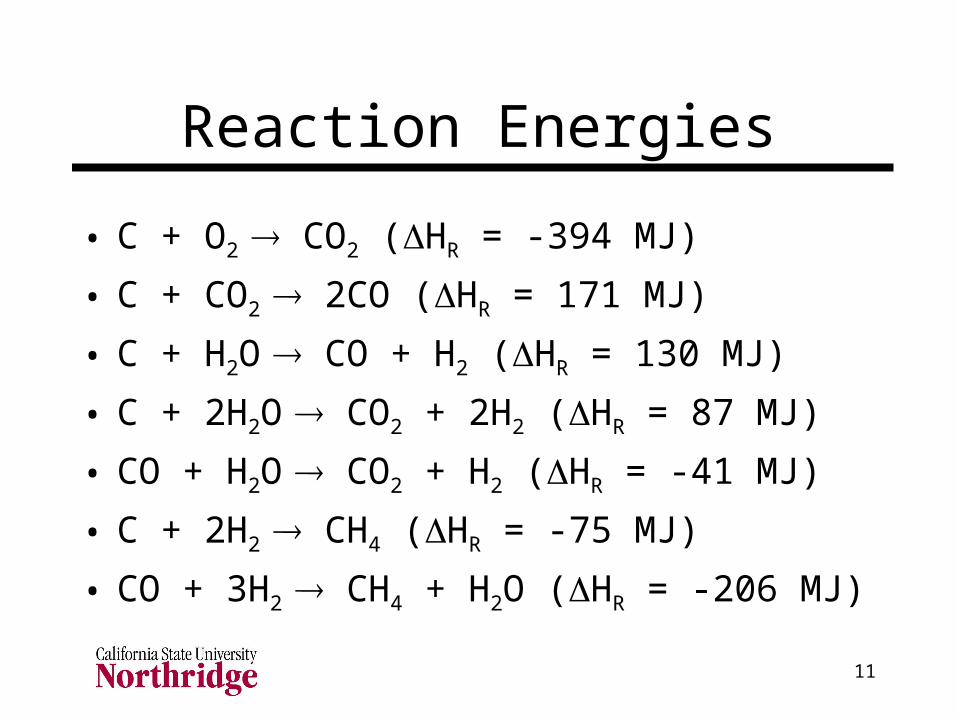
Reaction Energies
• C + O2 CO2 (HR = -394 MJ)
• C + CO2 2CO (HR = 171 MJ)
• C + H2O CO + H2 (HR = 130 MJ)
• C + 2H2O CO2 + 2H2 (HR = 87 MJ)
• CO + H2O CO2 + H2 (HR = -41 MJ)
• C + 2H2 CH4 (HR = -75 MJ)
• CO + 3H2 CH4 + H2O (HR = -206 MJ)
12
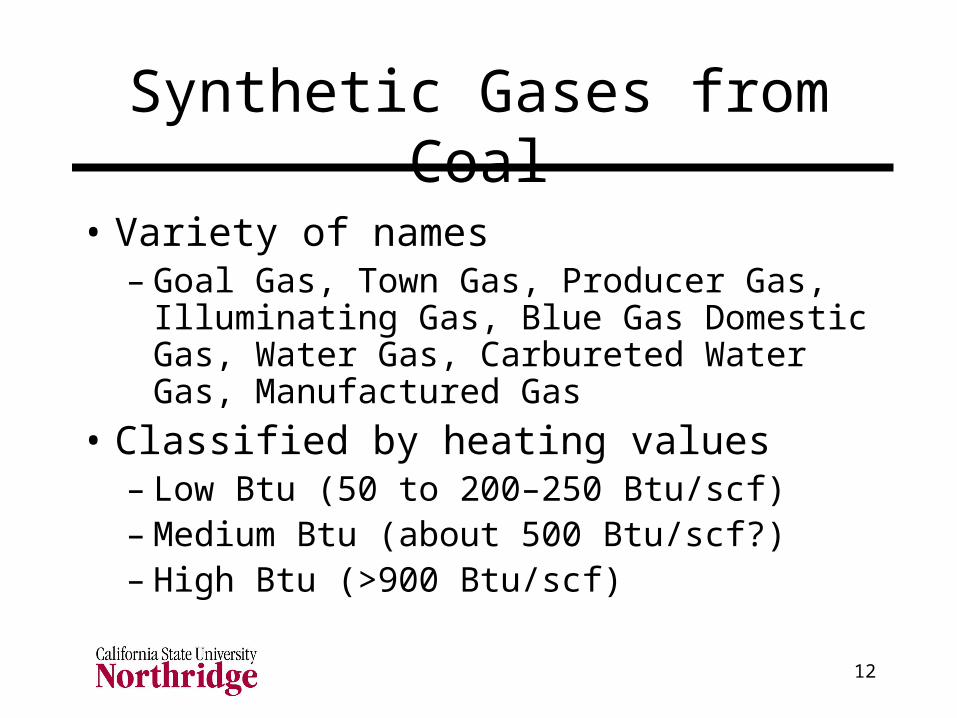
Synthetic Gases from Coal
• Variety of names – Goal Gas, Town Gas, Producer Gas,
Illuminating Gas, Blue Gas Domestic Gas, Water Gas, Carbureted Water Gas, Manufactured Gas
• Classified by heating values– Low Btu (50 to 200–250 Btu/scf)– Medium Btu (about 500 Btu/scf?)– High Btu (>900 Btu/scf)

13
Classification of Heating Gas
• Low Btu gas: heating value between 90 and 200-250 Btu per (standard) cubic foot – general agreement
• Medium Btu gas – no agreement on definition
• High Btu gas above 900 Btu per stan-dard cubic foot – general agreement
14
Hydrogen Production
• Possible uses– Ammonia manufacture– Petroleum refining– Fuel for fuel cells
• Produced by water-gas shift reaction– C + H2O CO + H2 (HR = 130 MJ)
• Temperature behavior– H2 production favored by low temperatures– Need 300 C < T < 700 C for reaction rate
15
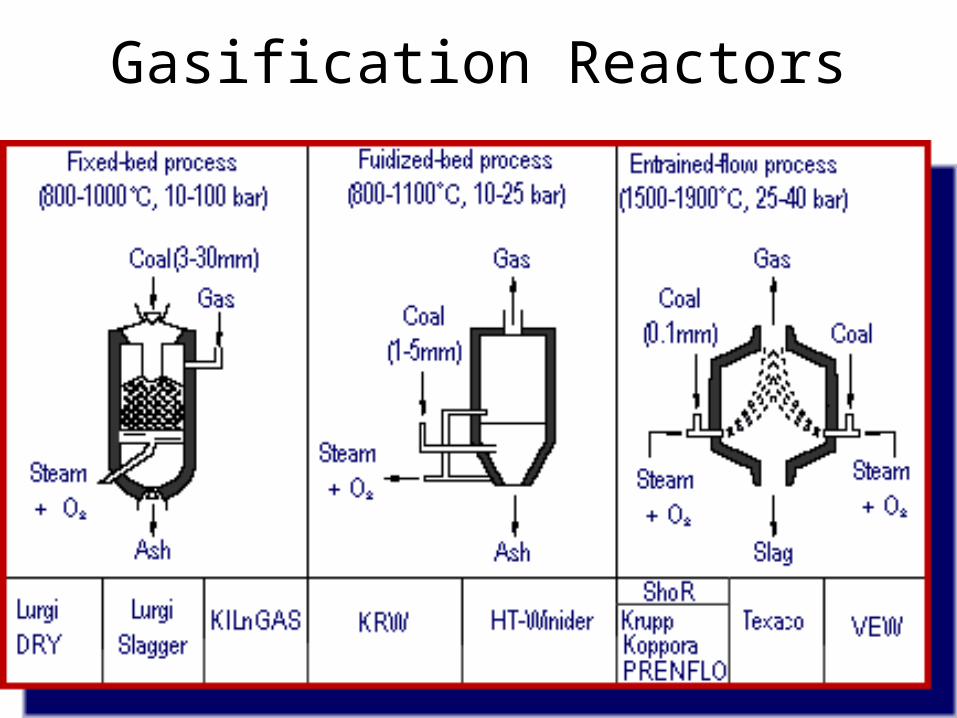
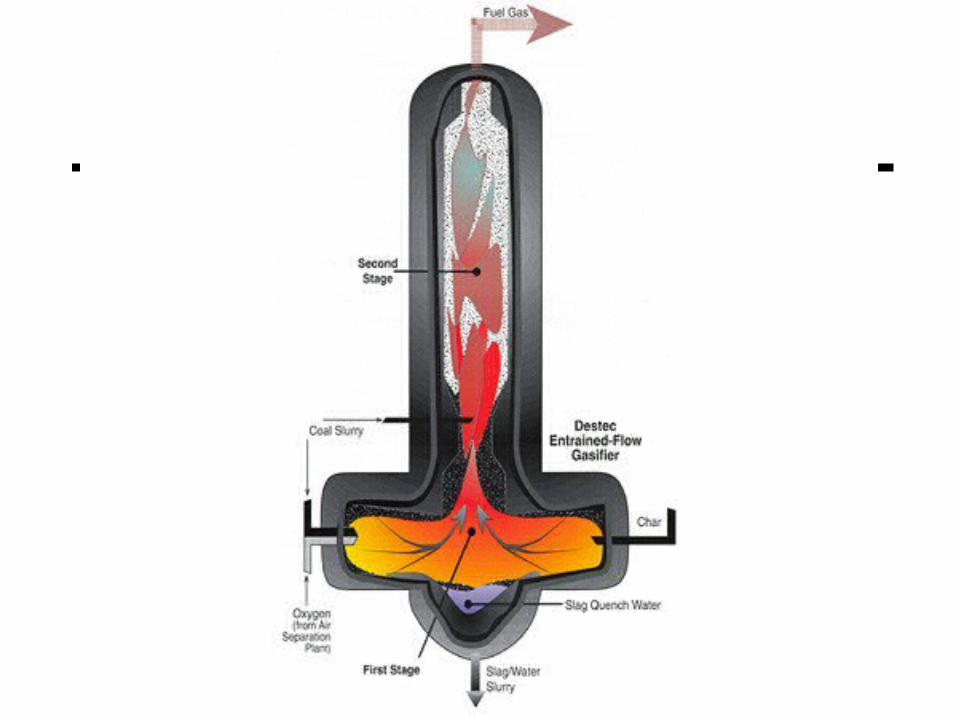
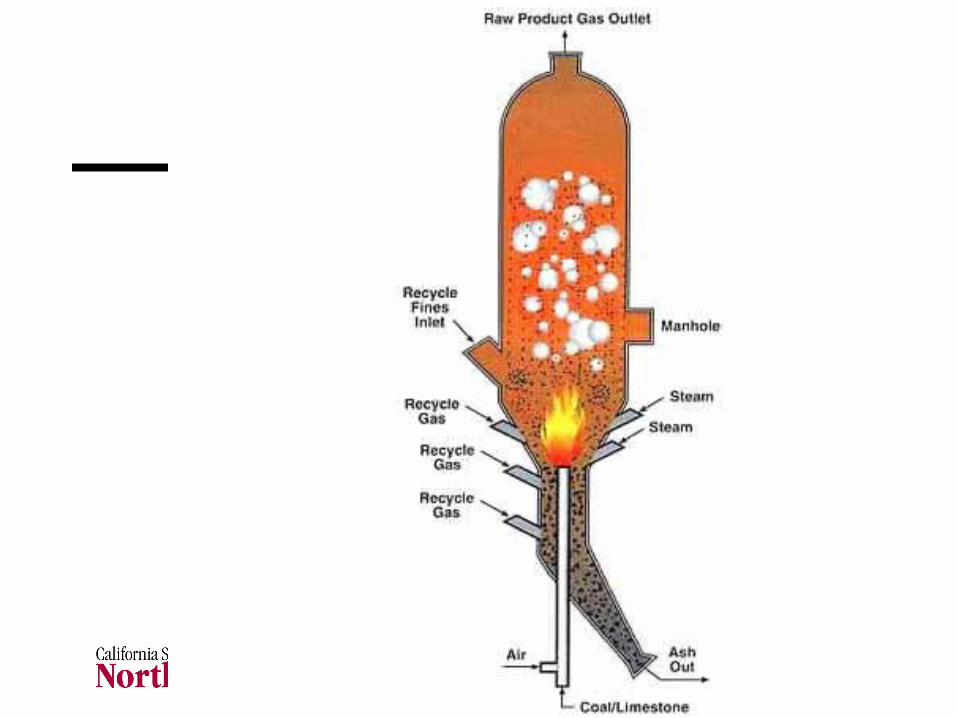
Gasification Reactors
• Entrained flow process – commercial and development
• Fluidized bed process – development and demonstration
• Moving fixed bed process – one commercial, others development
16
Gasification Reactors
17
Entrained Flow Reactors
• Powdered coal gasified with a mixture of steam and oxygen (or air)
• Reaction zone is where main part of molten slag is collected
• High temperature products require cooling prior to cleanup
• Little methane, compact, short reaction times, insensitive to coal properties

18
19
20
Fluidized-bed Reactors
• Operate at 760 C to 1,050 C, depending on coal properties
• Have potential for greater efficiencies due to lower temperatures
• Higher coal throughput rates compared to moving fixed bed
• Less inert ash due to low temperatures may cause more disposal problems
21
22
Moving Fixed-bed Reactors
• Coal moves downward countercurrent to upward flowing gas
• Provides greater efficiency
• More complex and costly than stationary bed systems
• Historically most widely used– Over 100 Lurgi units in commercial use
23
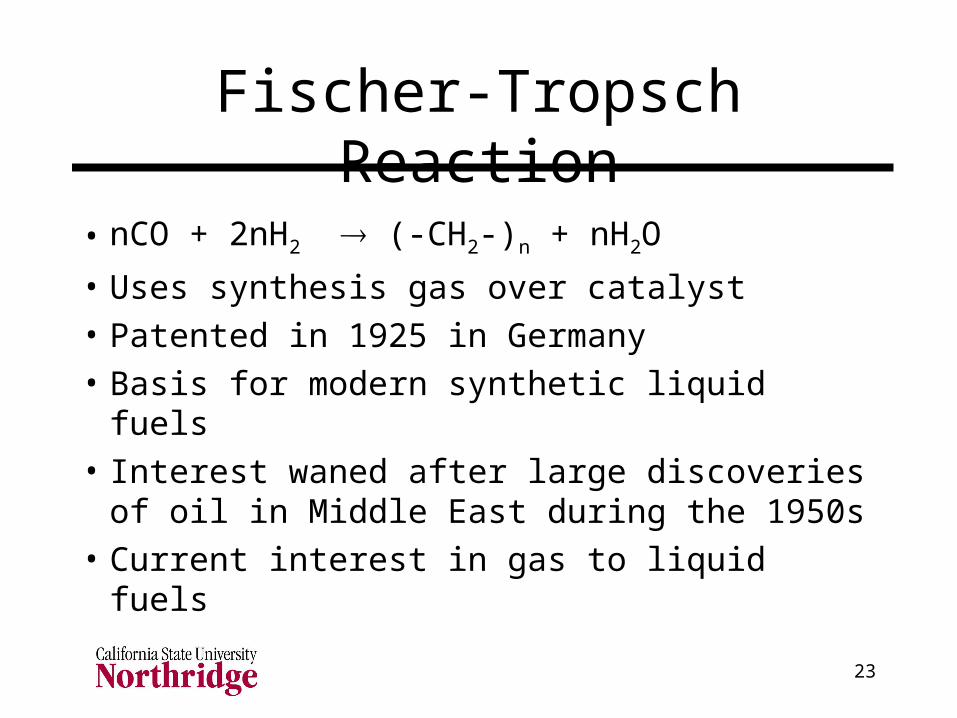
Fischer-Tropsch Reaction
• nCO + 2nH2 (-CH2-)n + nH2O
• Uses synthesis gas over catalyst
• Patented in 1925 in Germany
• Basis for modern synthetic liquid fuels
• Interest waned after large discoveries of oil in Middle East during the 1950s
• Current interest in gas to liquid fuels
24
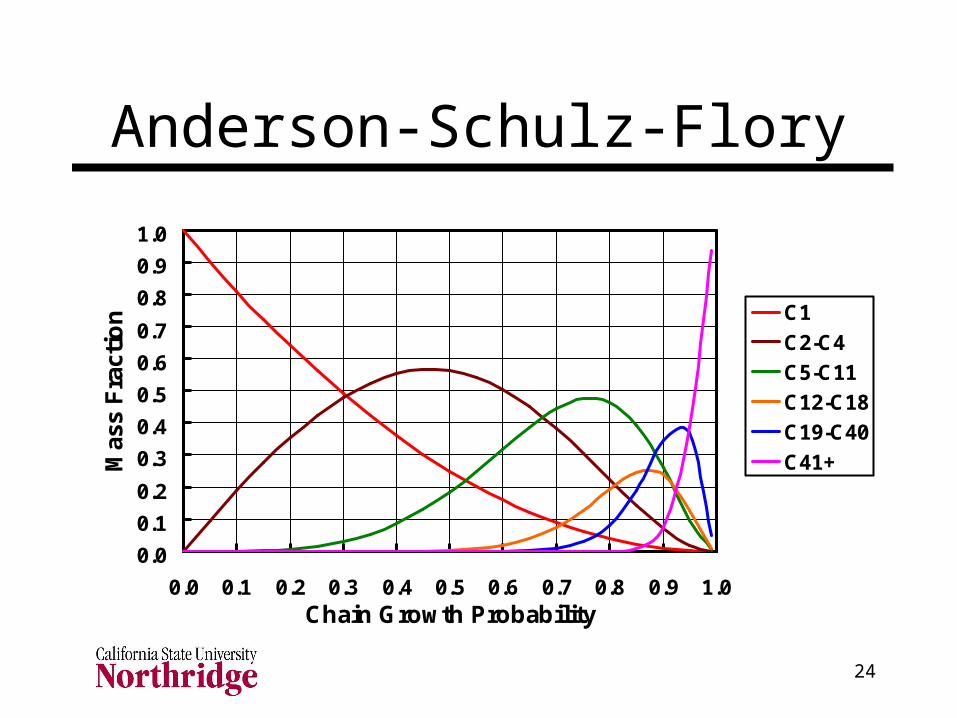
Anderson-Schulz-Flory
0.0
0.1
0.2
0.3
0.4
0.5
0.6
0.7
0.8
0.9
1.0
0.0 0.1 0.2 0.3 0.4 0.5 0.6 0.7 0.8 0.9 1.0Chain Growth Probability
Mas
s F
ract
ion C1
C2-C4
C5-C11
C12-C18
C19-C40
C41+
25
26
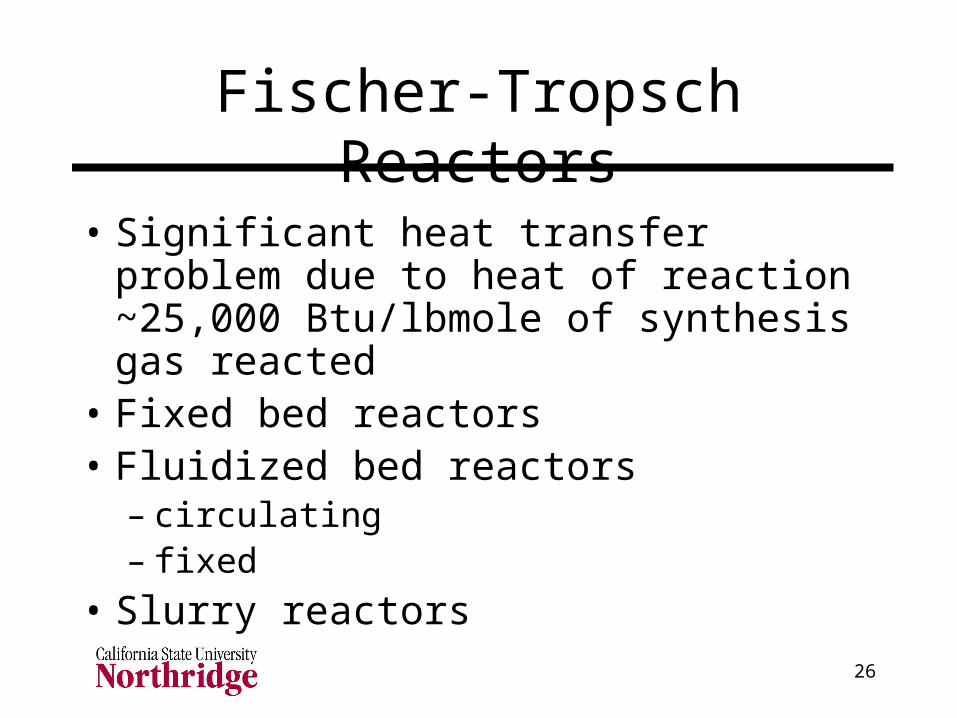
Fischer-Tropsch Reactors
• Significant heat transfer problem due to heat of reaction ~25,000 Btu/lbmole of synthesis gas reacted
• Fixed bed reactors• Fluidized bed reactors
– circulating– fixed
• Slurry reactors

27
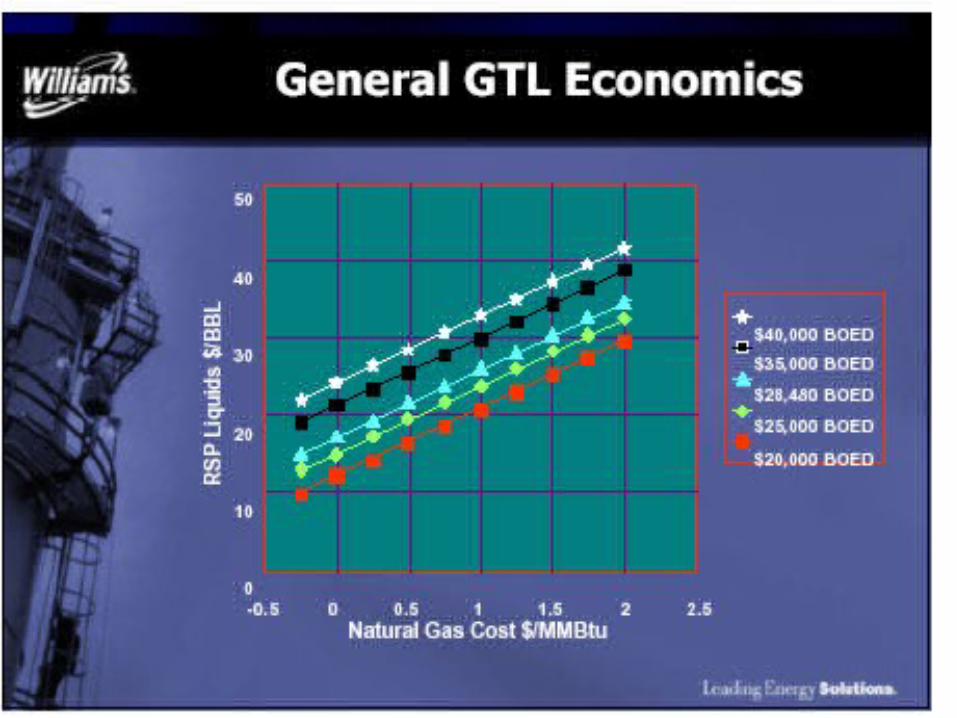
Gas to Liquid Conversions
• Considered when gas is produced as a byproduct of oil production with no available markets for the gas
• Usual procedures when no market is available– Flaring – burn gas found in crude oil
production– Reinject gas – store gas underground for
future market development
28
Handling Unmarketable Gas
• Liquefy and transport LNG to market
• Other “transportable gas” alternatives– Compressed natural gas (CNG)– Natural gas hydrates
• Conversion to a liquid fuel– Methanol– Synthetic crude oil
29
30
1992 EPAct Title XIII – Coal
• Sets up R&D program for coal– R&D and commercial application programs– Clean coal waste-to-energy– Coal in diesel engines– Nonfuel use of coal– Clean Coal Technology (CCT) program– Underground coal gasification– and many more
31
May 2001 NEPD
• National Energy Policy Group headed by Vice-President Cheney
• Recommendations include– increased research funding for clean coal
use– retention of tax credits for research and
development– Improved regulatory certainty for coal-fired
electricity
32
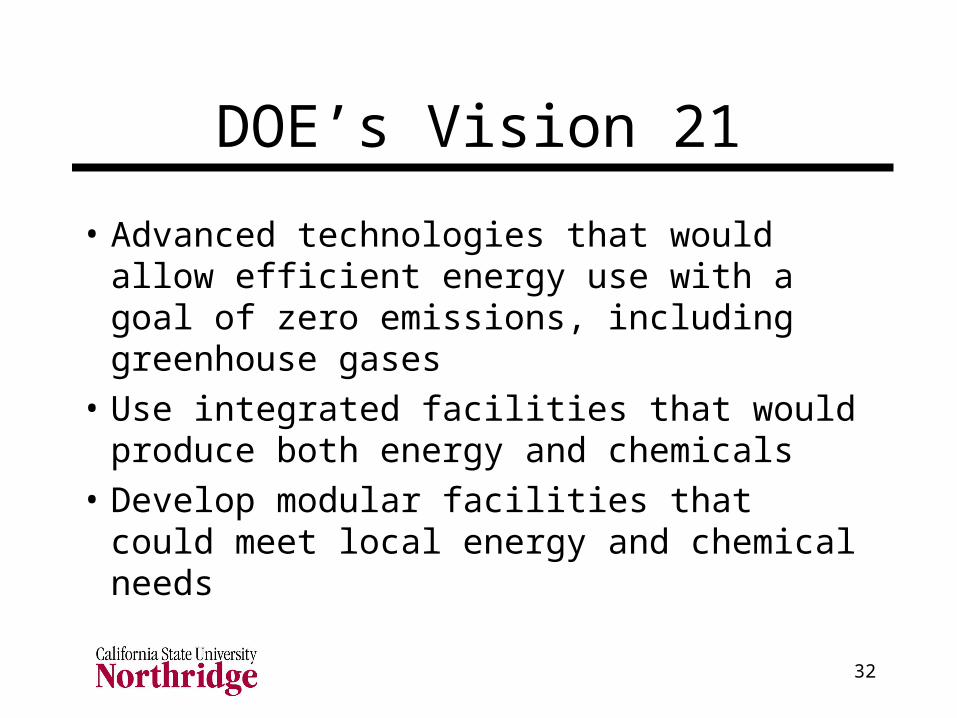
DOE’s Vision 21
• Advanced technologies that would allow efficient energy use with a goal of zero emissions, including greenhouse gases
• Use integrated facilities that would produce both energy and chemicals
• Develop modular facilities that could meet local energy and chemical needs
33
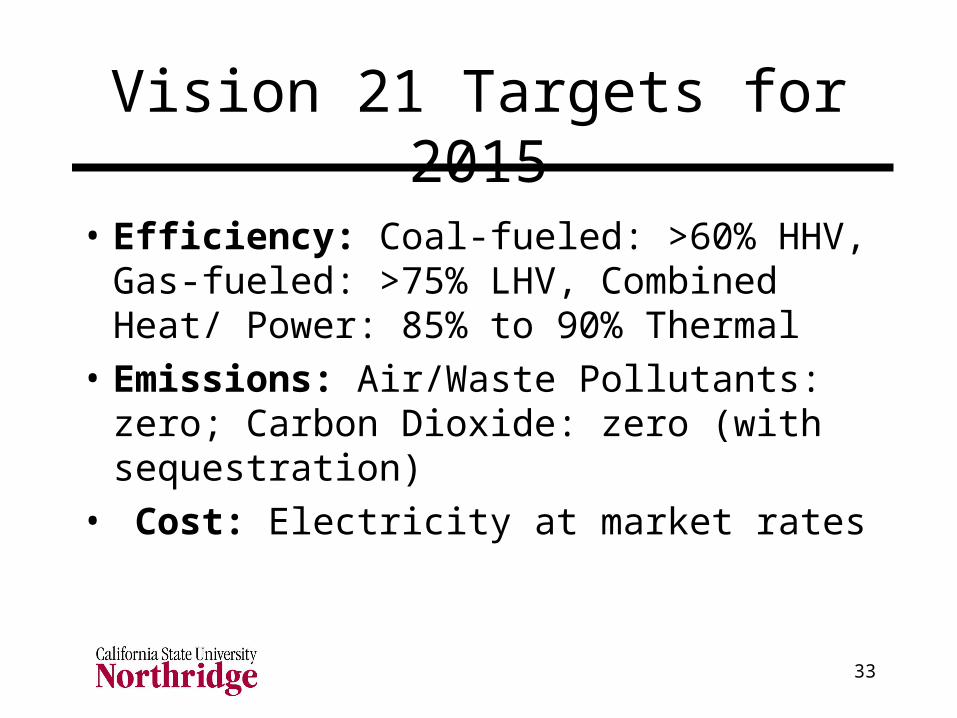
Vision 21 Targets for 2015
• Efficiency: Coal-fueled: >60% HHV, Gas-fueled: >75% LHV, Combined Heat/ Power: 85% to 90% Thermal
• Emissions: Air/Waste Pollutants: zero; Carbon Dioxide: zero (with sequestration)
• Cost: Electricity at market rates
34
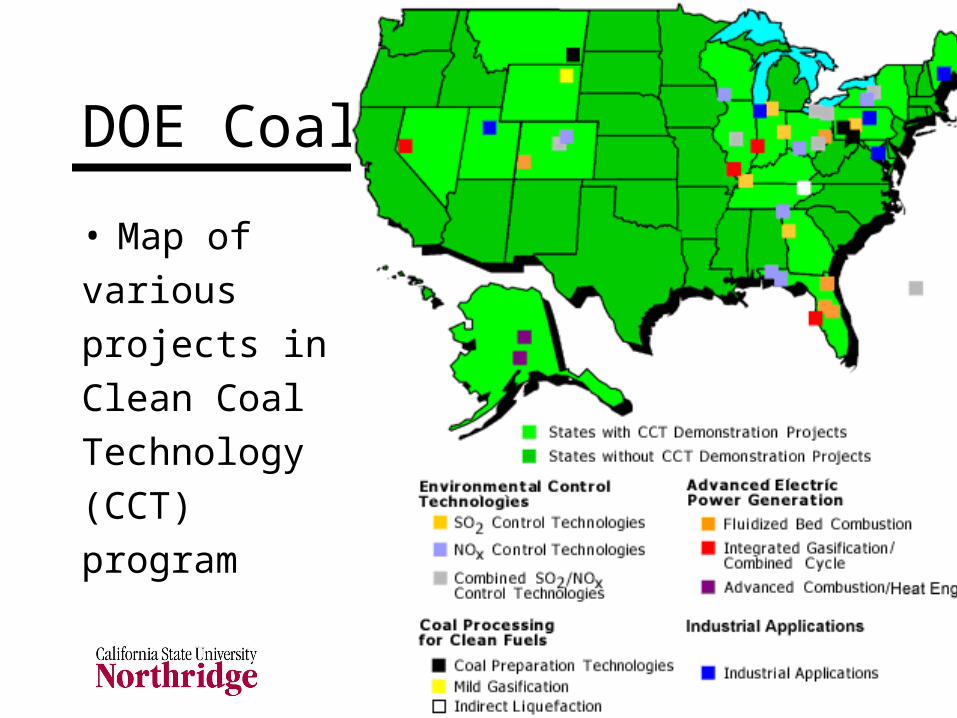
DOE Coal
• Map of
various
projects in
Clean Coal
Technology
(CCT)
program
35
36
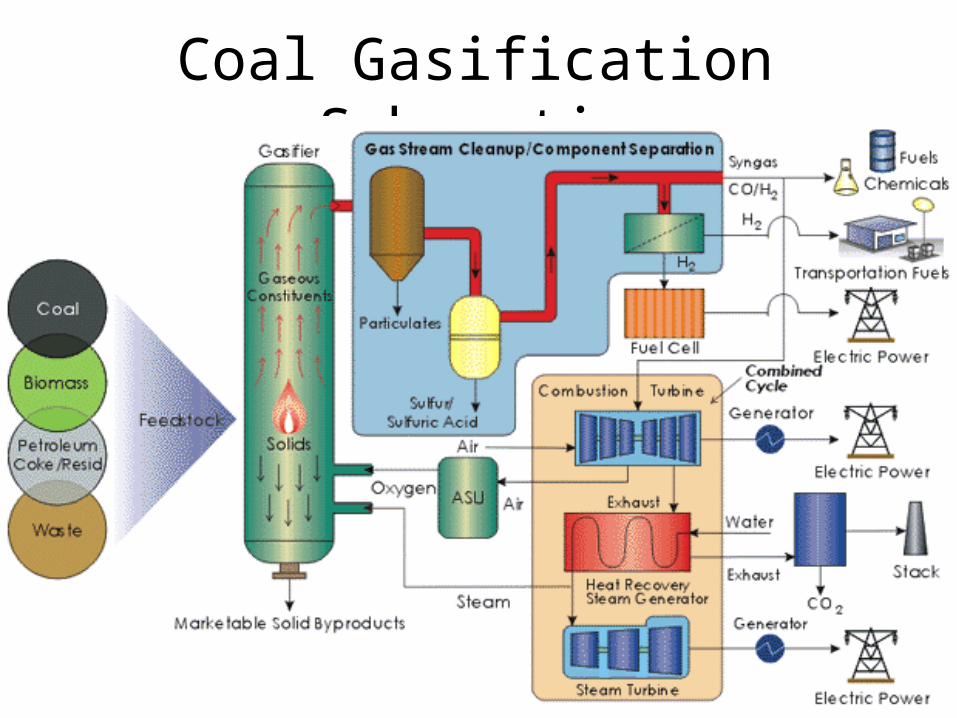
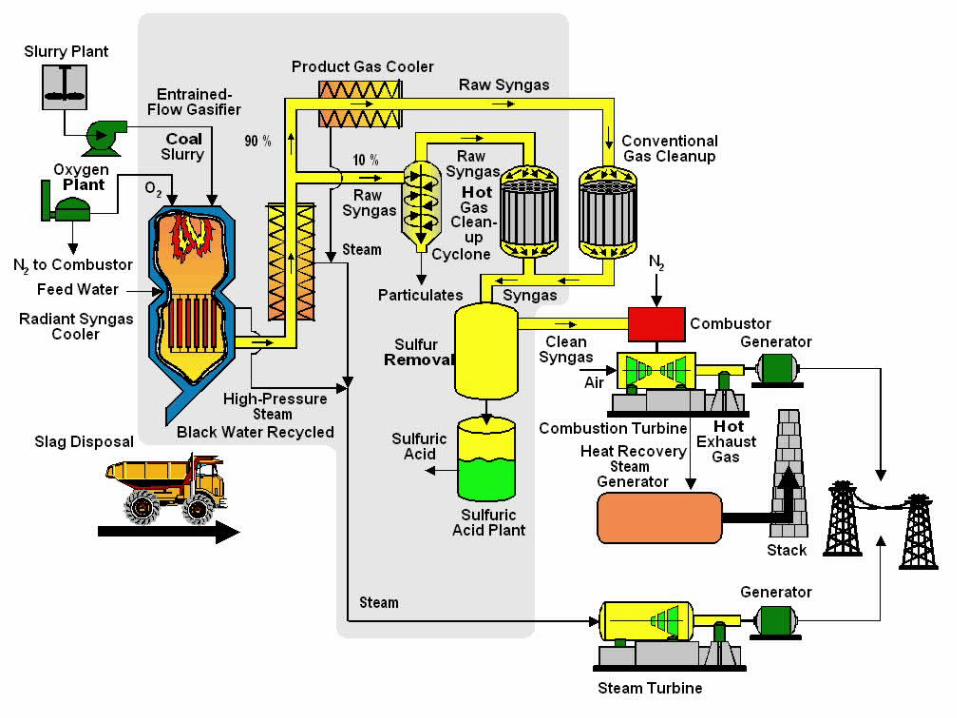
Integrated Coal Gasification
• Integrated, combined-cycle, coal gasification (IGCC) integrates– coal gasification to produce syngas– syngas cleaning to reduce emissions– solids conversion to useful byproducts– syngas used as gas turbine fuel– waste heat from gas turbine used to drive
steam turbine
37
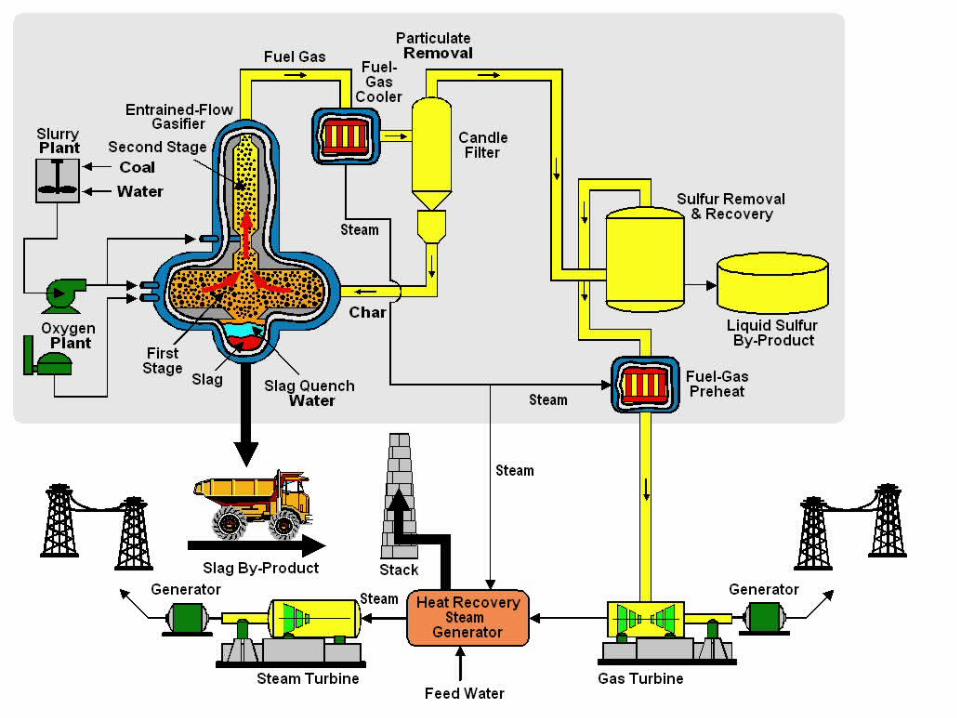
Coal Gasification Schematic
38
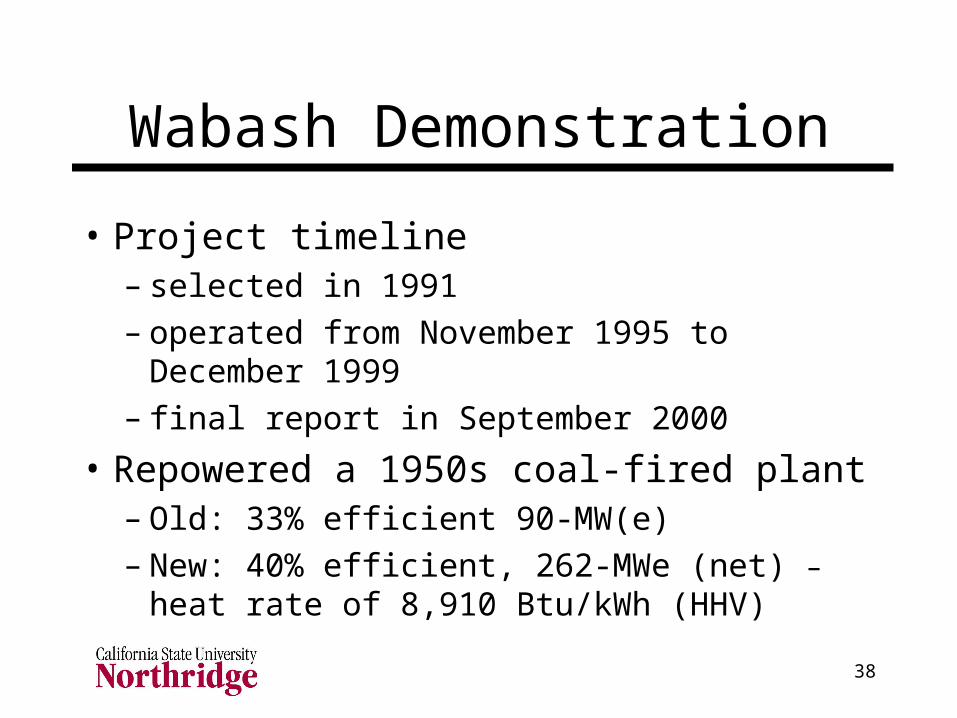
Wabash Demonstration
• Project timeline– selected in 1991– operated from November 1995 to December
1999– final report in September 2000
• Repowered a 1950s coal-fired plant– Old: 33% efficient 90-MW(e) – New: 40% efficient, 262-MWe (net) – heat rate
of 8,910 Btu/kWh (HHV)
39
40
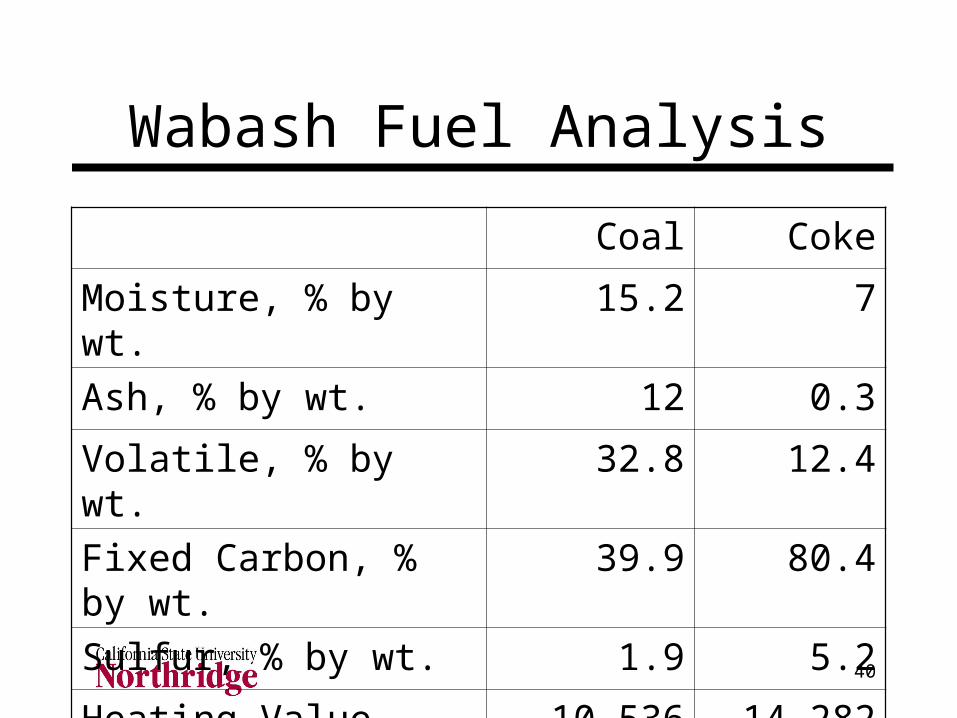
Wabash Fuel Analysis
Coal Coke
Moisture, % by wt. 15.2 7
Ash, % by wt. 12 0.3
Volatile, % by wt. 32.8 12.4
Fixed Carbon, % by wt. 39.9 80.4
Sulfur, % by wt. 1.9 5.2
Heating Value, Btu/lb 10,536 14,282
41
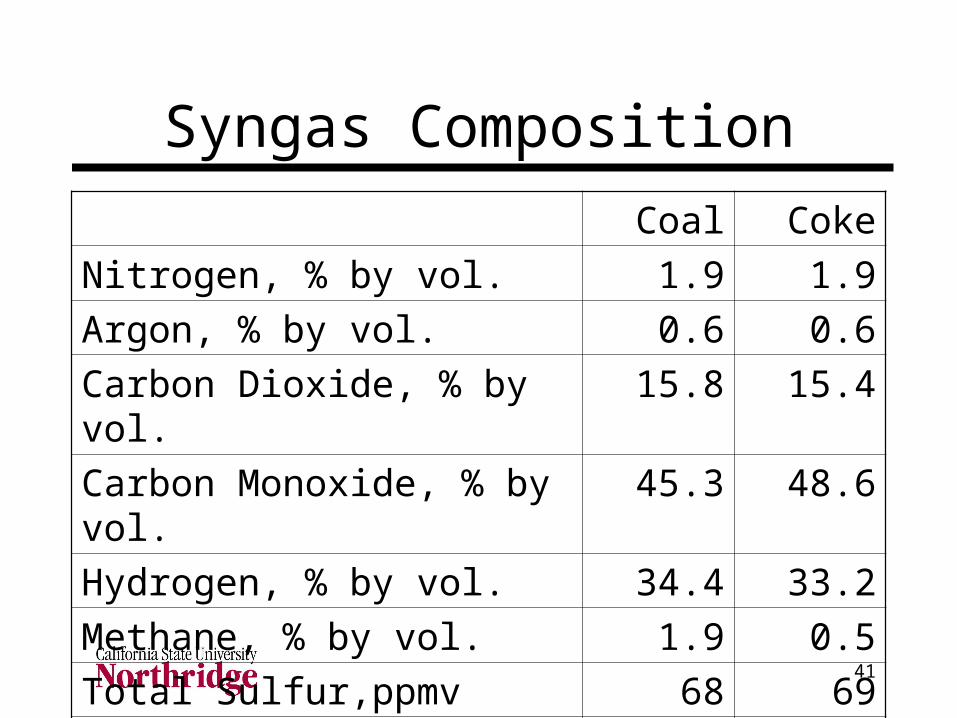
Syngas Composition
Coal Coke
Nitrogen, % by vol. 1.9 1.9
Argon, % by vol. 0.6 0.6
Carbon Dioxide, % by vol. 15.8 15.4
Carbon Monoxide, % by vol. 45.3 48.6
Hydrogen, % by vol. 34.4 33.2
Methane, % by vol. 1.9 0.5
Total Sulfur,ppmv 68 69
Higher Heating Value, Btu/scf 277 268
42
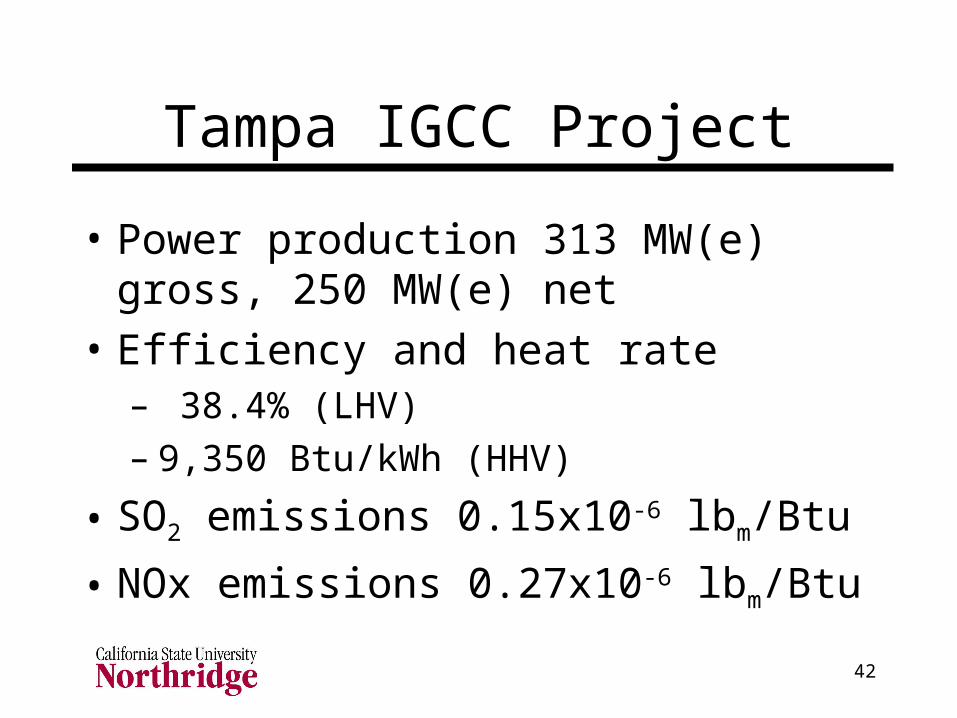
Tampa IGCC Project
• Power production 313 MW(e) gross, 250 MW(e) net
• Efficiency and heat rate– 38.4% (LHV)– 9,350 Btu/kWh (HHV)
• SO2 emissions 0.15x10⁻⁶ lbm/Btu
• NOx emissions 0.27x10⁻⁶ lbm/Btu
43
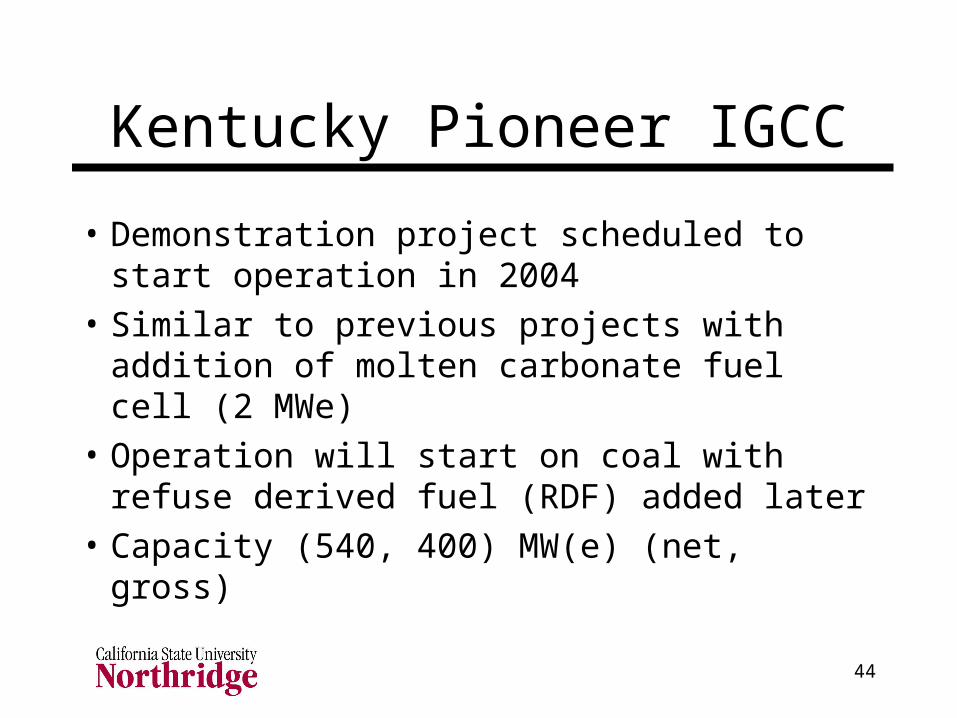
44
Kentucky Pioneer IGCC
• Demonstration project scheduled to start operation in 2004
• Similar to previous projects with addition of molten carbonate fuel cell (2 MWe)
• Operation will start on coal with refuse derived fuel (RDF) added later
• Capacity (540, 400) MW(e) (net, gross)
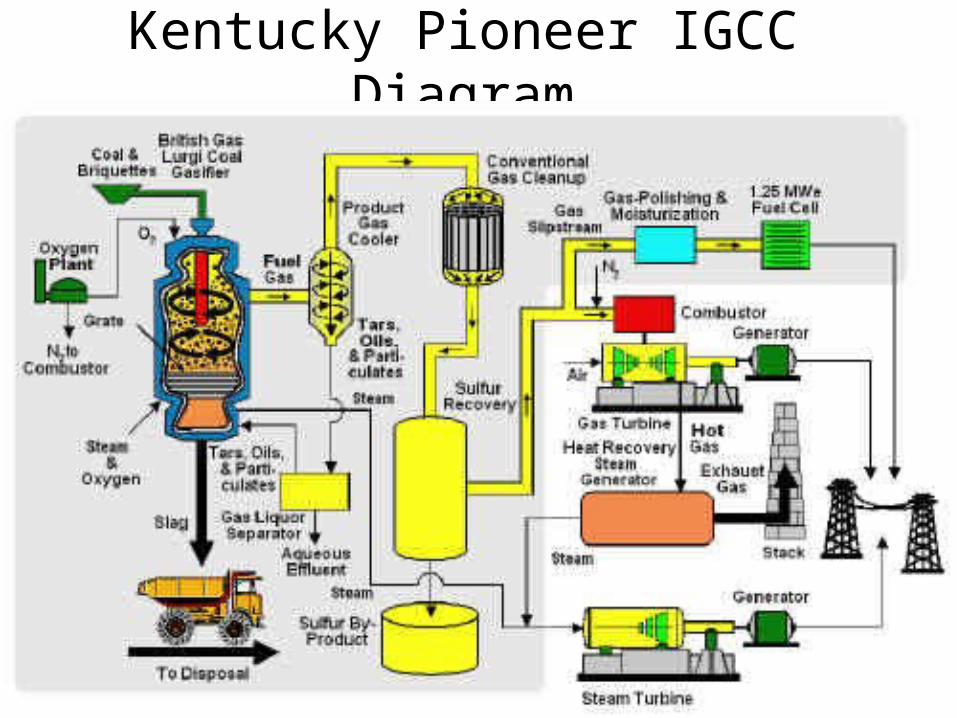
45
Kentucky Pioneer IGCC Diagram
46
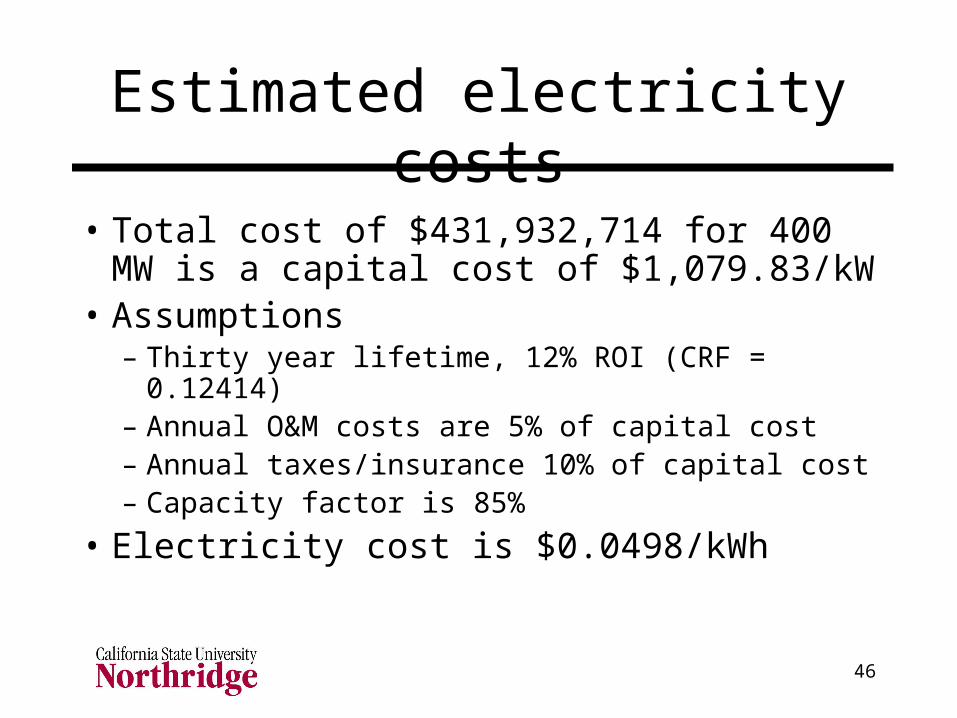
Estimated electricity costs
• Total cost of $431,932,714 for 400 MW is a capital cost of $1,079.83/kW
• Assumptions– Thirty year lifetime, 12% ROI (CRF = 0.12414)– Annual O&M costs are 5% of capital cost– Annual taxes/insurance 10% of capital cost– Capacity factor is 85%
• Electricity cost is $0.0498/kWh
47
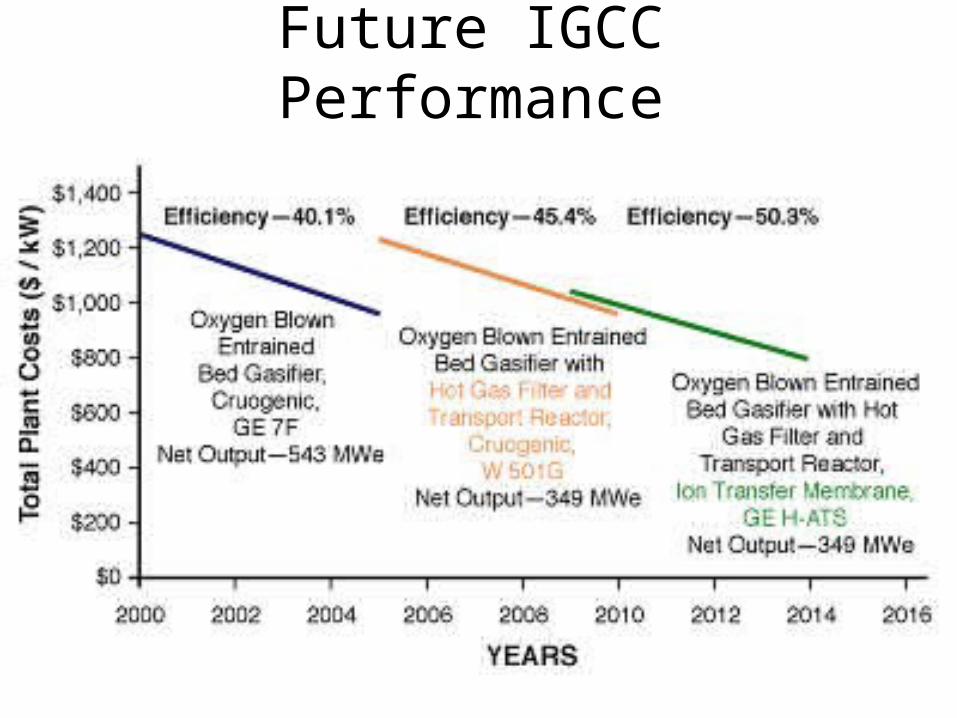
Future IGCC Performance