fuel characterisation and test methods for …...october 2003 ecn-c--03-057 fuel characterisation...
TRANSCRIPT

October 2003
ECN-C--03-057
Fuel Characterisation and Test Methods for Biomass Co-firing
ECN contribution to EU project ENK5-1999-00004 Combustion Behaviour of “Clean” Fuels in Power Generation
(BioFlam)
R. Korbee A.R. Boersma M.K. Cieplik P.G.Th. Heere
D.J. Slort J.H.A. Kiel
Revisions A B Made by: R. Korbee
Checked by: J.H.A. Kiel
Approved/Issued by: H.J. Veringa
ECN Biomass

Colofon Projectnummer Novem: 355200/3526 Dit onderzoek is uitgevoerd met medewerking van het programma Energiewinning uit Afval en Biomassa (EWAB). Beheer en coördinatie van het EWAB-programma berusten bij: NOVEM B.V. Nederlandse onderneming voor energie en milieu B.V. Catharijnesingel 59 3511 GG UTRECHT Postbus 8242 3503 RE UTRECHT Telefoon: (030) 239 34 88 (Secretariaat EWAB) Contactpersoon: ir. M.H.M. Raats, MTD E-mail: [email protected] Het programma Energiewinning uit Afval en Biomassa wordt uitgevoerd door Novem in opdracht van het ministerie van Economische Zaken. Novem geeft geen garantie voor de juistheid en/of volledigheid van gegevens, ontwerpen, constructies, producten of productiemethoden voorkomende of beschreven in dit rapport, noch voor de geschiktheid daarvan voor enige bijzondere toepassing. Aan deze publicatie kunnen geen rechten worden ontleend. Nadere informatie over de uitgevoerde studie is verkrijgbaar bij: Energieonderzoek Centrum Nederland Westerduinweg 3 Postbus 1 1755 ZG Petten Telefoon: 0224-564949 Contactpersoon: dr.ir. R. Korbee Datum rapportage: juli 2003 Keywords Biomass Burnout CCSEM Coal
Co-firing Fly ash quality Lab-scale Particle size
Particle shape Reactivity Secondary fuel Test method
2 ECN-C--03-057

Abstract This report describes the work and results of the ECN contribution to the European project BioFlam. In total sixteen participants, consisting of Electricity Producers and R&D organisations from Germany, United Kingdom, Netherlands, Italy, Poland, Greece and Portugal participated in the BioFlam project. The BioFlam project includes full-scale and lab-scale experiments, and extended dissemination as well as direct industrial application. The project can be seen as a service platform to all other EU projects on (alternative) fuels. Within the overall project, ECN developed a number of fuel characterisation and test methods to evaluate specific properties and behaviour of secondary fuels for co-firing with coal. Methods were developed or improved to characterise fuel particle size and shape distribution, fuel mineral size distribution, fuel reactivity and burnout, fly ash quality with regard to utilisation and ash deposition. The tests can be applied at relatively low cost to screen potential fuels, to improve their performance by fuel blending and to support full-scale operation by trouble shooting.
ECN-C--03-057 3

CONTENTS
LIST OF TABLES 5 LIST OF FIGURES 5 1. EU PROJECT SUMMARY – FRAMEWORK, SCOPE AND WORK PACKAGES 7 1.1 European Project ENK5-1999-00004 (Fifth Framework EESD programme) – excerpt
from original Technical Work Description 7 1.2 ECN contribution 8 1.3 Report outline 8 2. SYNOPSIS AND EVALUATION OF RESULTS 9 2.1 Fuel characterisation 9 2.2 Fuel test methods 11 3. CONCLUSIONS AND RECOMMENDATIONS 17 3.1 Fuel characterisation 17 3.2 Fuel test methods 17 APPENDIX A DELIVERABLE D1.9.1 19 1. INTRODUCTION 20 2. EXPERIMENTAL RESULTS 20 2.1 MALVERN Mastersizer 20 2.2 Dry sieving 21 2.3 Optical Microscopy 22 3. DISCUSSION AND CONCLUSION 26 APPENDIX B DELIVERABLE D1.9.2 27 1. INTRODUCTION 28 2. CCSEM PROCEDURE 28 3. RESULTS 29 4. DISCUSSION AND CONCLUSIONS 33 ANNEX B – OVERVIEW OF EXPERIMENTAL DATA 34 APPENDIX C DELIVERABLE D2.9.1 37 1. INTRODUCTION 38 1.1 General 38 1.2 Objectives 38 1.3 Methodological approach 38 2. EQUIPMENT 41 3. SAMPLES 44 4. EXPERIMENTAL PROGRAMME 46 5. EXPERIMENTAL RESULTS 49 5.1 Burnout tests 49 5.2 Fly ash quality tests 49 5.3 Ash deposition tests 51 6. DISCUSSION 52 6.1 Burnout tests 52 6.2 Fly ash quality tests 53 6.3 Ash deposition tests 54
4 ECN-C--03-057

CONCLUSIONS 55 ANNEX C – OVERVIEW OF EXPERIMENTAL DATA 56
LIST OF TABLES
Table A 1 Results Malvern PSD analysis.................................................................................. 21 Table A 2 Summary results optical microscopy........................................................................ 25 Table A 3 Overview measuring methods .................................................................................. 26 Table B 1 Fuel total ash content ................................................................................................ 30 Table B 2 Fuel overall mineral content ..................................................................................... 30 Table B 3 Mineral mass distribution of PO58........................................................................... 34 Table B 4 Mineral mass distribution of PO58 + 10% wood ..................................................... 35 Table B 5 Mineral mass distribution of PO58 +10% cocoa ...................................................... 36 Table B 6 Mineral mass distribution of brown coal .................................................................. 36 Table C 1 Overview of samples and performed analyses/tests ................................................. 44 Table C 2 Summary of ultimate and proximate analyses.......................................................... 45 Table C 3 Summary of LCS gas settings .................................................................................. 46 Table C 4 Overview of LCS experiments ................................................................................. 48 Table C 5 Overview of burnout test results............................................................................... 49 Table C 6 Ash quality compliance tests – fineness ................................................................... 51 Table C 7 Elemental volatilisation factors as used for theoretical ash composition
calculations ............................................................................................................. 56 Table C 8 Overview of SEM-EDX analyses............................................................................. 57 Table C 9 Summary of CCSEM data on mineral matter distribution in fuels. ......................... 65 Table C 10 Mineral matter distribution of PO58 (ID1) in the function of particle size............ 66 Table C 11 Mineral matter distribution of PO58+10% wood (ID6) in the function of particle
size.......................................................................................................................... 67 Table C 12 Mineral matter distribution of PO58+10% cocoa (ID11) in the function of
particle size ............................................................................................................. 68 Table C 13 Mineral matter distribution of RWE brown coal (ID18) in the function of
particle size ............................................................................................................. 69 Table C 14 Mineral matter distribution of full-scale PO58 (ID1) fly ash ................................. 70 Table C 15 Mineral matter distribution of lab-scale PO58 (ID1) ash ....................................... 71 Table C 16 Mineral matter distribution of pilot-scale PO58 (ID1) fly ash ............................... 72 Table C 17 Mineral matter distribution of lab-scale PO58/10% cocoa (ID11) ash .................. 73
LIST OF FIGURES
Figure A 1 Particle size distribution full-scale KEMA samples ............................................... 20 Figure A 2 Particle size mass distributions ............................................................................... 21 Figure A 3 Sieve fractions > 180 microns of wood and cocoa mixtures .................................. 22 Figure A 4 Primary and tertiary image from PO58................................................................... 22 Figure A 5 Fuel particle size volume distributions ................................................................... 23 Figure A 6 Cumulative volume fractions .................................................................................. 24 Figure A 7 Averaged shape factors per bin............................................................................... 24 Figure A 8 Unbinned shape factor results ................................................................................. 25
ECN-C--03-057 5
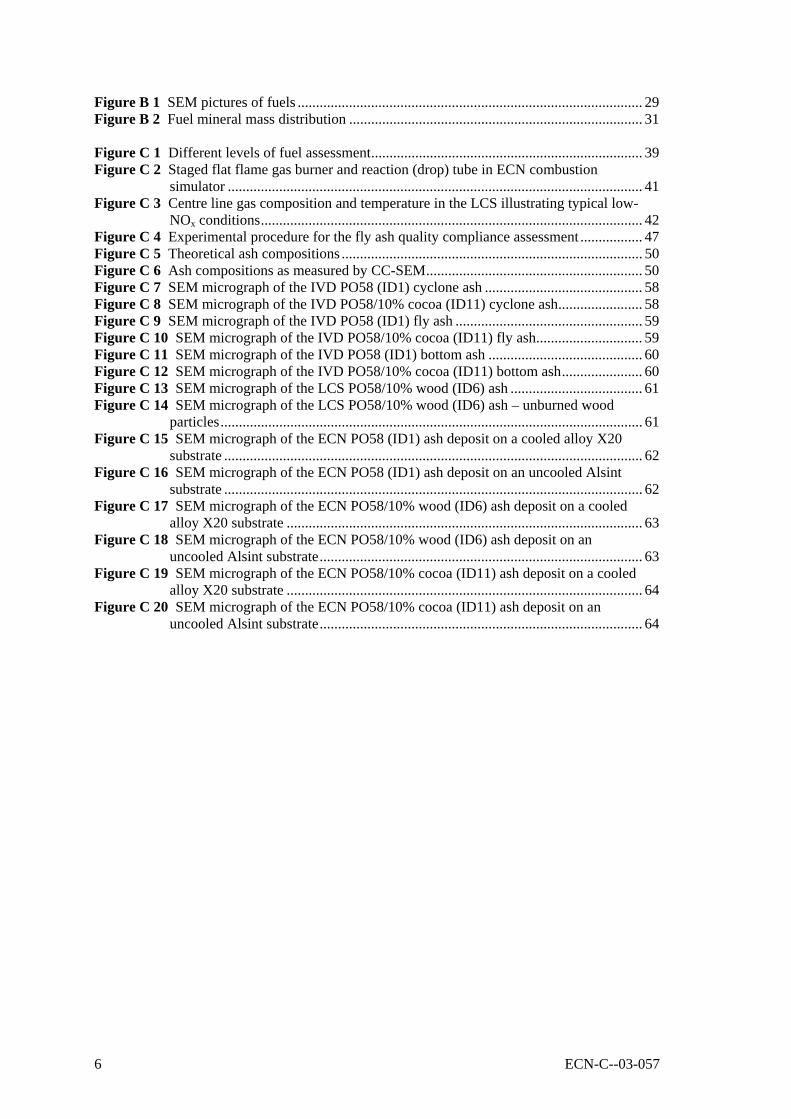
Figure B 1 SEM pictures of fuels .............................................................................................. 29 Figure B 2 Fuel mineral mass distribution ................................................................................ 31 Figure C 1 Different levels of fuel assessment.......................................................................... 39 Figure C 2 Staged flat flame gas burner and reaction (drop) tube in ECN combustion
simulator ................................................................................................................. 41 Figure C 3 Centre line gas composition and temperature in the LCS illustrating typical low-
NOx conditions........................................................................................................ 42 Figure C 4 Experimental procedure for the fly ash quality compliance assessment ................. 47 Figure C 5 Theoretical ash compositions .................................................................................. 50 Figure C 6 Ash compositions as measured by CC-SEM........................................................... 50 Figure C 7 SEM micrograph of the IVD PO58 (ID1) cyclone ash ........................................... 58 Figure C 8 SEM micrograph of the IVD PO58/10% cocoa (ID11) cyclone ash....................... 58 Figure C 9 SEM micrograph of the IVD PO58 (ID1) fly ash ................................................... 59 Figure C 10 SEM micrograph of the IVD PO58/10% cocoa (ID11) fly ash............................. 59 Figure C 11 SEM micrograph of the IVD PO58 (ID1) bottom ash .......................................... 60 Figure C 12 SEM micrograph of the IVD PO58/10% cocoa (ID11) bottom ash...................... 60 Figure C 13 SEM micrograph of the LCS PO58/10% wood (ID6) ash .................................... 61 Figure C 14 SEM micrograph of the LCS PO58/10% wood (ID6) ash – unburned wood
particles................................................................................................................... 61 Figure C 15 SEM micrograph of the ECN PO58 (ID1) ash deposit on a cooled alloy X20
substrate .................................................................................................................. 62 Figure C 16 SEM micrograph of the ECN PO58 (ID1) ash deposit on an uncooled Alsint
substrate .................................................................................................................. 62 Figure C 17 SEM micrograph of the ECN PO58/10% wood (ID6) ash deposit on a cooled
alloy X20 substrate ................................................................................................. 63 Figure C 18 SEM micrograph of the ECN PO58/10% wood (ID6) ash deposit on an
uncooled Alsint substrate........................................................................................ 63 Figure C 19 SEM micrograph of the ECN PO58/10% cocoa (ID11) ash deposit on a cooled
alloy X20 substrate ................................................................................................. 64 Figure C 20 SEM micrograph of the ECN PO58/10% cocoa (ID11) ash deposit on an
uncooled Alsint substrate........................................................................................ 64
6 ECN-C--03-057

1. EU PROJECT SUMMARY – FRAMEWORK, SCOPE AND WORK PACKAGES
1.1 European Project ENK5-1999-00004 (Fifth Framework EESD programme) – excerpt from original Technical Work Description
A promising route to achieve CO2 reduction is the use of short cycle carbon containing fuels, which can be generally classified as secondary fuels. These fuels have the thermodynamic potential to replace fossil fuels but operational and environmental problems may dramatically affect the combustion system. To focus on the industrial problems of secondary fuel application, one requires, in advance, detailed knowledge of the typical combustion behaviour of these fuels. The objective of this project was to provide simple, capable test methods, which give more insight in the fate of secondary fuels in a power plant. The results are publically available and can be used by any power plant operator or manufacturer in Europe. The sixteen participants from seven European countries in the BioFlam project consisted of electricity producers and R&D organisations from Germany, United Kingdom, Netherlands, Italy, Poland, Greece and Portugal. The BioFlam project included full-scale and lab-scale experiments, and extended dissemination via web-sites and direct industrial application. The project was envisaged to be a service platform to all other EU projects on (alternative) fuels. The project was structured as a “bio-cell” and interacted with related EU projects in the body of the Fifth Framework Programme. It comprised four work packages, each of them coordinated by an industrial partner. The problem areas were split up into fuel preparation (WP1), fuel conversion (WP2) and full-scale experiments (WP3). WP4 was set up for dissemination and assessment of results. Work Package 1 - Assessment of grinding behaviour of secondary fuel/coal mixtures Preparation of secondary fuel in conventional pulverised coal preparation systems with 5-10% secondary fuel, including experimental studies of the preparation of secondary fuels on both full-scale and lab-scale. Work Package 2 - Development of test methods for characterisation of secondary fuels Modification of lab-scale test methods for the use with secondary fuels (key input of research partners). Work Package 3 - Power plant experience This package included full-scale tests to let power generators and boiler manufacturers from Germany, United Kingdom, Netherlands, Italy, Poland and Greece cooperate and share knowledge on a European level. Work Package 4 - Dissemination and evaluation of results Assessment of the developed characterisation methods and techno-economic evaluation of the resulting EU benefits. Dissemination of the results by all participants.
ECN-C--03-057 7

1.2 ECN contribution Previous European programmes (e.g. APAS, OPTEB) have addressed many issues related to secondary fuel co-firing. These programmes have resulted in a significantly advanced awareness of certain problem areas. Generally, however, this knowledge is not suitable for the technical assessment of specific secondary fuels in specific boilers. By their economic potential, residues are used for fuel from an increasing number of agricultural, forestry and industrial sources, thereby introducing a large variety of technical questions. Even with constant quality secondary fuels, site-specific boundary conditions may well lead to very different ways of implementation of the fuel and thus different questions need to be addressed. Economic incentives justify the development of methods to be used for the technical fuel assessment. In this context, ECN contributed the following developments: Fuel Characterisation A new method has been developed to determine the particle size and shape distribution of ground mixtures of coal and biomass, to enable assessment of mill performance for such binary mixtures. Microscopy and particle recognition software have been applied to determine the particle size distribution and particle morphology (shape factor). Computer Controlled Scanning Electron Microscopy (CCSEM) has been used to determine the mineral speciation of binary fuel mixtures, which gives a relevant basis for predicting slagging and fouling processes. Existing fuel preparation procedures have been adapted for fuel mixtures including biomass materials. Fuel Test Methods Lab-scale fuel screening methods have been developed at ECN over the past years, each covering different aspects of solid fuel (pf) combustion. For each aspect, the aim is to deliver a “fingerprint” which represents the fuel’s behaviour in a full-scale furnace. In this project, methods have been developed to assess potential burnout and fly ash utilisation problems. Also ash deposition test methods have been further developed. ECN’s Lab-scale Combustion Simulator (LCS) has been used in this work. The simulator is an entrained-flow reactor with an integrated, premixed and multi-stage flat flame gas burner. By feeding different gas mixtures to the different stages, the staged gas burner is used to mimic the high initial heating rates, temperatures and gas composition found in a full-scale pf furnace. The fuel particle residence time has been extended up to three seconds specifically for the development of fuel test methods relating to burnout and fly ash issues.
1.3 Report outline A detailed description of the work carried out for each of the work packages can be found, per deliverable, in the Appendices A, B and C. The described results are summarised and discussed in Chapter 2. Final conclusions and recommendations are made in Chapter 3. Together, Chapters 1-3 should be read as an executive summary.
8 ECN-C--03-057
2. SYNOPSIS AND EVALUATION OF RESULTS
2.1 Fuel characterisation A new method has been developed to determine the particle size and shape distribution of ground mixtures of coal and biomass, to enable assessment of mill performance for such binary mixtures. Microscopy and particle recognition software have been applied to determine the particle size distribution and particle morphology (shape factor). Computer Controlled Scanning Electron Microscopy (CCSEM) has been used to determine the mineral speciation of binary fuel mixtures, which gives a relevant basis for predicting slagging and fouling processes. Existing fuel preparation procedures have been adapted for fuel mixtures including biomass materials. Particle Size and Shape Distribution (PSSD) Many secondary fuels are difficult to grind and produce irregularly shaped, up to millimetre size particles. Obviously, the trajectories, heating and conversion of these particles will be different compared to the fairly uniformly shaped, pulverised coal particles. Measurement of their PSSD is important to appreciate these differences and to be able to predict their different behaviour. Optical microscopy with digital image processing software was applied to obtain size resolved information on the shape of particles in a ground fuel sample. As this application had never been tried before, several problems had to be overcome. A representative sample of fuel particles was obtained by creating an emulsion which is held between two standard microscope glass plates. This procedure effectively eliminates problems of sample inhomogeneity caused by density induced particle segregation (a drawback of most other techniques). Moreover, the pressure applied to the glass plates gives control of the dispersion of the particles and thereby avoides particle contact resulting in erroneous particle size and shape data. Visible light passes the sample to create a projection the particles which can be analysed and translated into size and shape information by dedicated software. About 40,000 particles can be analysed per sample. The optimal depth of field was found to be at 2.5 magnification, giving a lower detection limit of ~14 µm. A typical example is shown below.
0.1 1 10 100 1 .103
0.013
0.025
0.038
0.05
0.063
0.075
0.088
0.1
Particle diameter [microns]
Volum
e fra
ction
[-]
0.079
0
Res0⟨ ⟩
10000.1 Res5⟨ ⟩
Sieve fraction >180 µm taken from a blend of Polish pulverised coal with 10% wood particles; the large wood particles result in a bimodal size distribution of the whole blend ( right figure).
5 mm5 mm
ECN-C--03-057 9

The technique has not been developed as an alternative to more common techniques for particle size distribution measurement as the ones based on light diffraction (e.g. Malvern Mastersizer). It should rather be used as a method to obtain data on the size and shape properties of especially the larger size fractions, which is where biomass fuel particles are expected to differ mostly from pulverised coal particles. Several samples of coal and coal-biomass mixtures have been analysed. For all samples it was found that the average shape factor (a measure for particle sphericity) decreased as a function of particle size. Shape factors were found to range from close to 1 for very small particles down to 0.2 for large particles. From photographs of sieve fractions of coal/wood and coal/cocoa mixtures it was concluded that the largest sieve fraction (>180 µm) nearly completely consisted of the biomass component. The photographs explained that the low particle shape factors were associated with an either elongated (fibrous, esp. woody materials) or flattened (flaky, e.g. this specific cocoa residue) shape. A more detailed description of this work can be found in Appendix A. Mineral Size Distribution (MSD) Coal typically contains 5-20% ash forming inorganic matter, of which more than 90% usually is mineral. The chemical type and bonding to the carbon matrix determine how the inorganic matter is released to the gas phase and which ash particles will form during combustion. The size and composition of individual ash droplets/particles is determinative for the behaviour of the ash. Therefore, a detailed analysis of a fuel’s inorganic matter yields important information for predicting potential ash related problems such as slagging, fouling, DeNOx catalyst poisoning, particulate emissions or ash quality. Computer Controlled Scanning Electron Microscopy (CCSEM) can be used to determine the Mineral Size Distribution (MSD) of coals. The output of such an analysis is the normalised mass distribution of some 25 mineral types, divided over particle size bins of 2-4, 4-8, 8-16, 16-32, 32-64 and 64-128 µm. Clean biomass materials may contain specific – typically calcium or silicon-based – biominerals, but the major part of other elements is usually found as dispersed salts or organically bound compounds. Harvested or waste biomass materials may also be contaminated with sand and clay particles. Since the biominerals and the external contamination may both significantly contribute to the total inorganic matter, the CCSEM procedure was adapted to accommodate the analysis of biomass materials. In order to perform a CCSEM analysis, a sample (preferably ‘as fired’) of ground fuel is dispersed and embedded into resin. After hardening the resin block is cut, polished and carbon-coated for microscope analysis. The specifc problem of particle segregation as a result of the different densities of coal and biomass was overcome by rotating the resin holder with the particle/resin emulsion. Applying a low speed to avoid segregation by centrifugal forces resulted in workable samples with no visual segregation of biomass particles. An example of a sample prepared according to this procedure, and the major CCSEM results are shown below.
10 ECN-C--03-057

Illite (K+Al+Si+O) Kaolinite (Al+Si+O) Dolomite (Ca+Mg+C+O) Quartz (Si+O) Fe-Al Silicate (Fe+Al+Si+O) Pyrrhotite (Fe+S)
35 % [m/m] 8 % 8 % 7 % 6 % 4 %
Pulverised sample of Polish coal and 10% cocoa flakes embedded in resin for CCSEM mineral analysis; the right figure shows mineral particles as light coloured areas; the main mineral species analysed are
shown to the left. The procedure was successfully applied to a pulverised Polish coal and blends including 10% wood and cocoa. While the presence of the wood in the coal/wood sample did not significantly change the mineral size distribution of the sample, a disticnt influence was found by the cocoa in the coal/cocoa sample. The mineral size distribution of the coal/cocoa sample showed an increased concentration of potassium rich minerals, which agrees with the relatively high concentration of potassium in cocoa. The results so far demonstrate the feasibility and usefulness of CCSEM analysis applied to fuel blends with biomass. A more detailed description of this work can be found in Appendix B.
2.2 Fuel test methods In comparison to advanced fuel characterisation techniques (as the ones outlined above), fuel testing on a laboratory scale is considered the next level of fuel evaluation, to be facultatively followed by pilot-scale testing and finally full-scale trials (see also the schematic below). The lab-scale testing is specifically useful to evaluate the conversion behaviour of fuel and ash under well-known conditions.
Fuel & ash conversion
Burner & flame assessment
Fuel analysis
Lab-scale(LCS) testing
Pilot-scaletesting
Full-scaletesting
Physical & chemical properties
Overall risk assessment
none
all
fuelknowledge
Levels of fuel characterisation in various phases of procurement.
ECN-C--03-057 11

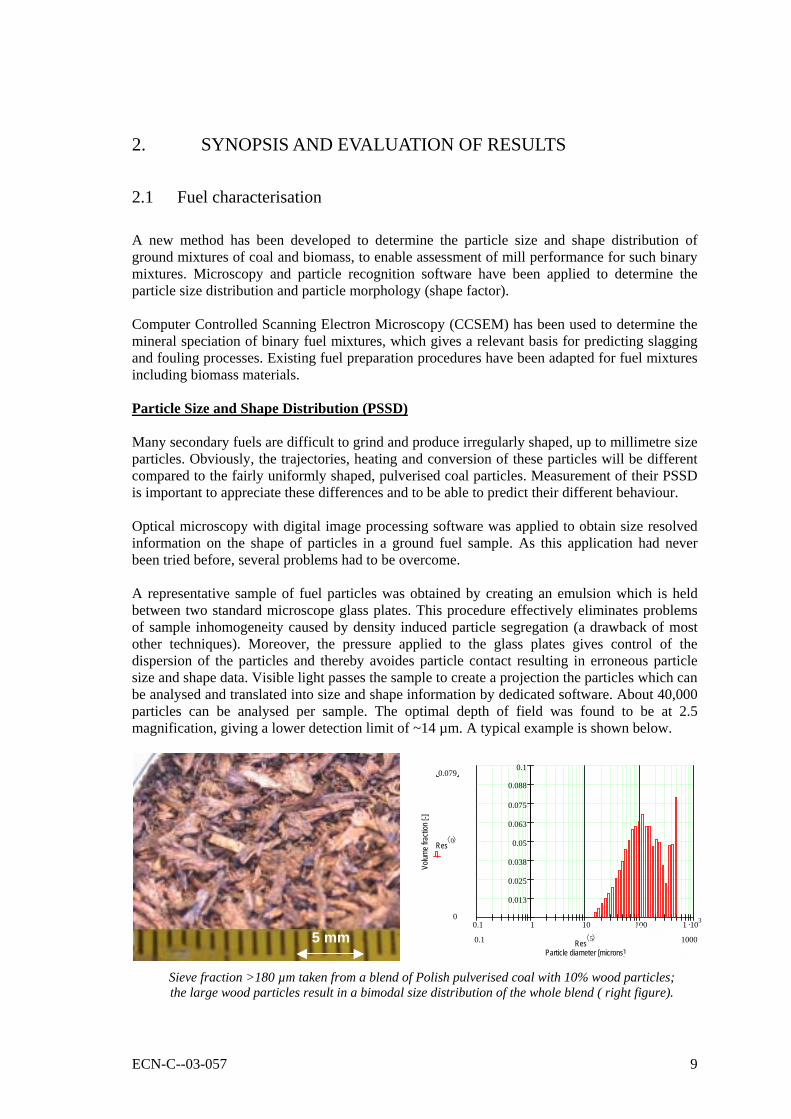
Various lab-scale fuel screening methods have been developed at ECN over the past years, each one covering different aspects of solid fuel (pf) combustion. For each aspect, the aim is to deliver a “fingerprint” which is representative for the fuel’s behaviour in a full-scale furnace. Fuel tests have been carried out using ECN’s Lab-scale Combustion Simulator (LCS). In this project, methods have been developed to assess potential burnout and fly ash utilisation problems. Fuel reactivity and burnout As reported in the section on fuel characterisation, the particle size and shape of biomass fuels may be quite different compared to pulverised coal particles. This affects the fluid dynamic behaviour of fuel particles (particle trajectories) in a furnace, but also the rate of combustion, including the final conversion or burnout. At typical combustion temperatures of 1300-1500°C, chemical kinetics is seldom rate limiting; in practice, a combination of internal and external mass transfer of oxygen to the fuel particle surface determines the overall reaction rate. In turn, these processes greatly depend on properties such as particle size, shape, internal porosity, etc. Fuel reactivity nor burnout can be reliably predicted from first principles. Still, fuel evaluation in these terms is important since they can have a significant impact on the overall plant economy in terms of (fuel) efficiency and the economic value of the ash produced (which relates to the content of unburned carbon). Therefore, a lab-scale test method was developed, based on the following considerations. The reactivity and burnout of a pulverised fuel is largely determined by the temperature and composition of the surrounding gas during combustion. After two to three seconds reaction or residence time, pulverised coal particles typically achieve a burnout of 99.5% or higher. Apart from efficiency considerations this level of burnout is needed to comply with the requirement of maximum 5% carbon in ash for cement production. At the beginning of the project, fuel residence times in the LCS were limited to a maximum of approximately one second, reflecting the typical capability of many drop tube test facilities around the world. Considering the aforementioned requirement of two to three seconds reaction time to achieve practical levels of burnout, the LCS was initially not suited to test fuel burnout. During the first year of the project, the LCS was fundamentally redesigned with the objective to extend the maximum reaction time up to three seconds. A schematic of the new design is shown in the figure below. Essentially, the objective was met by a net reduction of the fuel particle velocity by a factor of three, thus tripling the fuel residence time within the length (1 m) of the existing facility. For pulverised fuel particles with a size of up to approximately 200 µm the gas-particle drag force controls the particle velocity; so, the extended fuel residence time can be realised by a reduction of the volumetric gas flow rate. About two-thirds of the gas flow is vented from the system and the remaining one-third (which also holds the fuel particles) continues to flow down, into the main combustion area of the facility. Both the shape of the ceramic cone as well as it’s vertical placement have been carefully chosen in order not to disturb the gas flow in the system. The volumetric flow rate of the gas holding the fuel particles – and thereby the fuel residence time – is carefully controlled with a gas pump. A special electric furnace was designed to allow for the venting of hot flue gas past the heating elements and through the furnace roof. A more detailed description of the LCS can be found in Appendix C, Section 2.
12 ECN-C--03-057
Legend 2 I Devolatilisation zone
5
II Combustion zone I
1 Solid fuel feed 2 Multi-stage flat flame gas burner 3 Inner burner 4 Outer burner 5 Shield gas ring 6 Reactor tube 7 Optical access
Schematic of new Lab-scale Combustion Simulator (LCS) temhi
oxygen
gas+
particles
gas
peraturegh
high
II
134
6
7
4
Samples of partly combusted fuel particles are obtained using a vertically adjustable probe. With this procedure the conversion of various fuels could be measured over a wide range of reaction times, up to complete burnout. While in the previous set-up the combustion of coal particles was limited to typically 70%, in the new design, conversions of up to 99.8% were obtained for the same coal at a residence time of three seconds. A more detailed description of this work can be found in Appendix C, Section 5.1. The described methods for reactivity study are now being further developed in the framework of a project funded by the European Committee for Coal and Steel (ECSC), aiming to promote and standardise the use of drop tube and similar lab-scale test facilities for the determination of fuel reactivity under furnace specific conditions. Fly ash quality In The Netherlands, fly ash produced in pulverised coal fired power stations generally meets the requirements as laid down in the European standard EN-450 and the Dutch recommendation CUR-70 for the use of fly ash in concrete and for testing fly ash from pulverised coal with a maximum of 10% secondary fuel. Economic considerations with respect to the potential of a secondary fuel should include, in addition to fuel price, the impact it may have on the economic value of any residues produced. Since the quality of a fly ash can only be evaluated once it has been produced, reliable economic considerations can be made only after a large-scale conformity test. A lab-scale test would allow for a much wider screening of potential fuel candidates against very low cost. And, in addition, various fuel blends can be tested easily in an attempt to identify the ‘better’ fuel combinations. For certification of fly ash produced from secondary (non-coal) fuels, Dutch regulations prescribe conformity testing. Although some of the criteria actually require testing of the applied fly ash (e.g., leaching characteristics of concrete), others can be tested directly on the fly ash. The objective of developing a lab-scale test method is to identify fly ash parameters which can actually be tested using the LCS.
ECN-C--03-057 13

CUR-70 describes procedures which are to be used to assess a fly ash produced when cofiring a secondary fuel (called fly ash “A”). Practically, fly ash “A” should at least be equivalent to certified fly ash which complies with EN-450 and CUR-70. The tested properties (CUR-70) are:
1. EN-450 compliance Chemical requirements Value Purpose a carbon content / LOI* (815°C) < 5% water requirement b chloride content ≤ 0.1% corrosion steel reinforcement c sulphate content ≤ 3% thaw-frost resistivity d free CaO,
reactive SiO2 ≤ 2% ≥ 25%
cementitious properties
Physical requirements a fineness ≤ 45 µm
activity index shape stability density
≥ 60% ± 150 kg/m3
2. Application in prestressed concrete 3. Binding agent factor 4. Conformity investigation fly ash “A” with certified fly ash a durability (thaw-frost cycle, Cl-permeability) b impact on additives (flowability, bubble agent, binding time retardant)
*Loss On Ignition Properties of applied fly ash (2., 3., 4.) can be tested provided that a few to tens of kilograms of fly ash are available. This would require at least pilot scale tests. Many of the properties described in EN-450 (1.), however, could be assessed on a smaller scale such as the LCS. As an efficient lab-scale method, the following experimental procedure is suggested:
Fuel sample
Conversion into fly ash (relevant T, C,τ)
2.
0.
1.
Calculated ash composition critical?
3.
Sample 1a. (CC)SEM - size/morphologyb. LOI (550 °C)c. salts, Cl-, SO4
2-
Sample 2a. (CC)SEM - size/morphologyb. LOI (815 °C)c. SiO2, CaO, MgO
4. Compliance NEN-EN 450?
n
y
yFurther testing
(pilot-scale or larger)
0. Fuel sample procurement and standard analysis. 1. Lab-scale combustion test with fly ash sampling for further analysis and testing . 2. Identification of fly ash properties which are potentially critical and require
additional analysis. 3. Execution of various analyses on one or two fly ash samples. 4. Evaluation of fly ash properties for compliance with NEN-EN450.
14 ECN-C--03-057
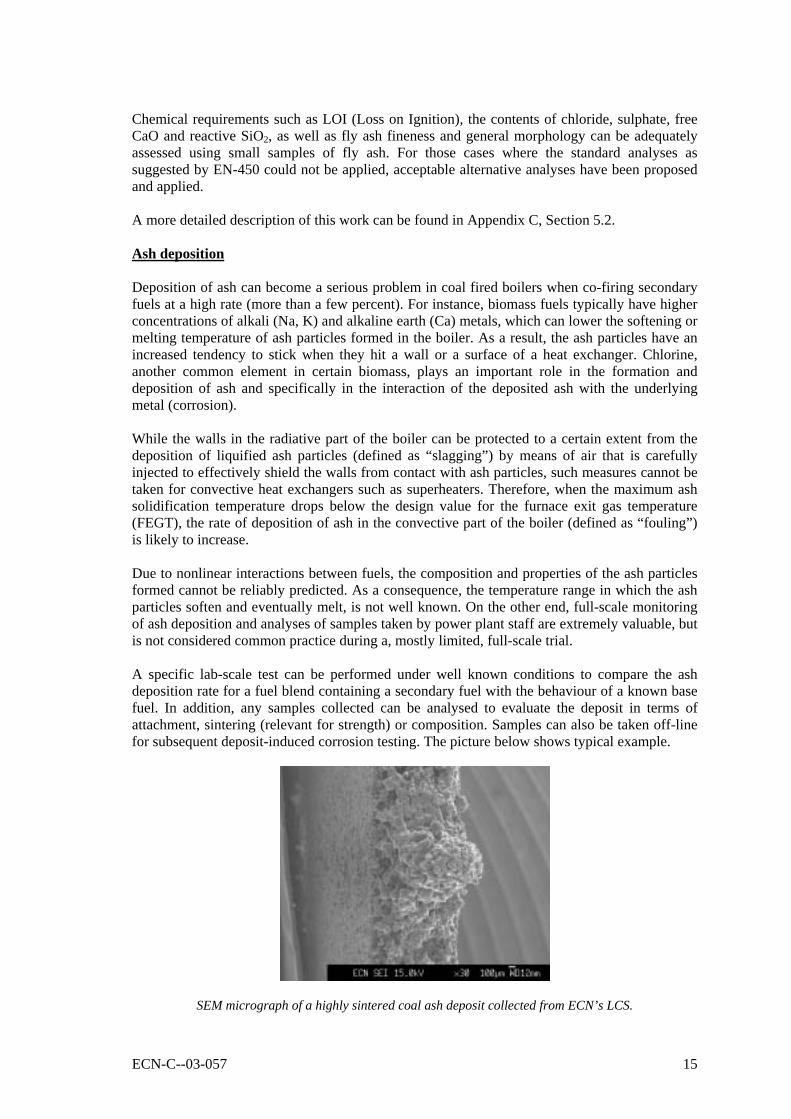
Chemical requirements such as LOI (Loss on Ignition), the contents of chloride, sulphate, free CaO and reactive SiO2, as well as fly ash fineness and general morphology can be adequately assessed using small samples of fly ash. For those cases where the standard analyses as suggested by EN-450 could not be applied, acceptable alternative analyses have been proposed and applied. A more detailed description of this work can be found in Appendix C, Section 5.2. Ash deposition Deposition of ash can become a serious problem in coal fired boilers when co-firing secondary fuels at a high rate (more than a few percent). For instance, biomass fuels typically have higher concentrations of alkali (Na, K) and alkaline earth (Ca) metals, which can lower the softening or melting temperature of ash particles formed in the boiler. As a result, the ash particles have an increased tendency to stick when they hit a wall or a surface of a heat exchanger. Chlorine, another common element in certain biomass, plays an important role in the formation and deposition of ash and specifically in the interaction of the deposited ash with the underlying metal (corrosion). While the walls in the radiative part of the boiler can be protected to a certain extent from the deposition of liquified ash particles (defined as “slagging”) by means of air that is carefully injected to effectively shield the walls from contact with ash particles, such measures cannot be taken for convective heat exchangers such as superheaters. Therefore, when the maximum ash solidification temperature drops below the design value for the furnace exit gas temperature (FEGT), the rate of deposition of ash in the convective part of the boiler (defined as “fouling”) is likely to increase. Due to nonlinear interactions between fuels, the composition and properties of the ash particles formed cannot be reliably predicted. As a consequence, the temperature range in which the ash particles soften and eventually melt, is not well known. On the other end, full-scale monitoring of ash deposition and analyses of samples taken by power plant staff are extremely valuable, but is not considered common practice during a, mostly limited, full-scale trial. A specific lab-scale test can be performed under well known conditions to compare the ash deposition rate for a fuel blend containing a secondary fuel with the behaviour of a known base fuel. In addition, any samples collected can be analysed to evaluate the deposit in terms of attachment, sintering (relevant for strength) or composition. Samples can also be taken off-line for subsequent deposit-induced corrosion testing. The picture below shows typical example.
SEM micrograph of a highly sintered coal ash deposit collected from ECN’s LCS.
ECN-C--03-057 15

In this project only a limited amount of lab-scale deposition tests has been carried out in the LCS, because no specific attention was given to deposit formation or the collection of samples during the full-scale trial at Borssele power station. Tests were carried out in the LCS to simulate typical slagging (uncooled refractory surface) as well as fouling (cooled metal alloy) conditions. Fuels tested included a Polish coal (PO58) and two blends of 90% PO58 with 10% wood and cocoa residue. Both secondary fuels increased the amount of ash deposited. SEM-EDX analyses revealed an increased potassium concentration, most pronounced in the cocoa case. The uncooled deposits showed significant, yet incomplete melting. Again, an increased concentration of potassium was measured. These observations confirm the general notion of potentially increased ash deposition with biomass co-firing, but full-scale validation was not possible due to the absence of observations and samples. In line with this (comparative) deposition test, the method was extended to combine deposit sampling with the on-line quantitative measurement of the ash layer’s thermal conductivity. The principle of on-line measurement of the heat flux through the ash deposit has been successfully tested in the LCS. Based on this principle a new deposition probe will be designed. A more detailed description of the work can be found in Appendix C, Section 5.3.
16 ECN-C--03-057

3. CONCLUSIONS AND RECOMMENDATIONS
3.1 Fuel characterisation The newly developed procedure of sample preparation in combination with optical microscopy and particle recognition software offers a useful method for determining the particle size resolved shape distribution (PSSD) of samples with an extremely wide size range, such as ground mixtures of secondary fuel with coal (typically 1-2000 µm). The measured size distribution is not very accurate at both extremes of the size range, but it does offer the rather unique possibility to establish a correlation between particle diameter and shape. For biomass materials such as wood shape factors as low as 0.2 were found for the largest size fractions. The new procedure is best carried out as a supplement to one or more standard sizing analyses to increase the overall reliability. It is also recommended to do a visual inspection of sieve separated size fractions in order to assess any enrichment of either one of the fuel components. The common procedure used to prepare fuel samples for CCSEM analysis was adapted to accommodate the analysis of samples including biomass to overcome segregation problems in the sample. Rotary equipment was successfully applied to prepare homogeneous samples of 90% coal, 10% biomass mixtures. In the case of wood, no significant influence on the mineral size distribution was found due to the low ash content. In the case of cocoa, an increase of potassium containing minerals was measured. In future work, the database which has been used for the mineral classification will be extended to identify typical biominerals.
3.2 Fuel test methods The test facility at ECN was successfully redesigned into the Lab-scale Combustion Simulator (LCS). The main improvement is the extension of fuel reaction time (residence time) to a full 3 seconds, which allows 1) the investigation of fuel reactivity including the last stages of combustion (burnout), 2) the production and investigation of fly ash and 3) the investigation of deposition of fly ash onto simulated superheaters in the convective zones of a boiler (fouling). It was shown for a Polish coal (PO58) that industrial levels of burnout, over 99.5% can be obtained in the LCS, in this case corresponding to 1-2% LOI. The use of the LCS for fuel reactivity (including kinetic) studies is now being further developed in a European project on the promotion and standardisation of drop tube and similar furnaces. One optimisation concerns the fact that in the current procedure the burnout may be slightly underestimated due to higher unburned carbon levels in the bottom ash. In the LCS, small fly ash samples have been produced from coal/biomass blends to be subject in a procedure to test their compliance with requirements from fly ash application standards. Chemical requirements such as LOI, the contents of chloride, sulphate, free CaO and reactive SiO2, as well as fly ash fineness and general morphology can be adequately assessed using small samples of fly ash. Therefore this test offers a cheap possibility to obtain a first screening of potentially attractive secondary fuels with respect to fly ash utilisation options. Based on the outcome, decision makers can either take a biomass material to the next scale of testing or disregard it as a potential fuel, and thus select secondary fuels in a more cost-effective way. A limited number of lab-scale ash deposition tests has been performed for a qualitative evaluation of the influence of a 10% share of wood or cocoa residue on the formation of an ash
ECN-C--03-057 17

deposit on uncooled boiler walls or cooled superheater surfaces. Unfortunately no full-scale data were available for validation of the results. The lab-scale test method was useful in observing an increased net ash deposition rate with the biomass/coal blends as well as some differences in the composition of the deposits. The development of a more advanced test method has been initiated to deliver also quantitative data on heat transfer properties as a function of deposit growth. Once operational, the integral test is a low-cost and effective tool, not only to rank single fuels but especially to evaluate the impact of different shares of secondary fuels with coal.
18 ECN-C--03-057

APPENDIX A DELIVERABLE D1.9.1
Combustion Behaviour of “Clean” Fuels in Power Generation
- BioFlam -
ECN Research Report D1.9.1 Contract No. ENK5-1999-00004
Particle Size and Shape Investigations on Secondary Fuel/Coal Mixtures
ECN-C--03-057 19

1. INTRODUCTION
Objectives The objective of the ECN contribution is to determine the particle size and shape distribution of milled, pure coal and secondary fuel/coal mixtures as a basis for understanding aerodynamic behaviour. Description of Work and Deliverables Optical microscopy and particle recognition software will be applied to determine the particle size distribution and particle morphology (a.o. shape factor) of especially the secondary fuel particles in mixtures of secondary fuel / coal A sub report containing particle size distribution data and particle morphology analyses has to be delivered. Particle Size Distributions and Shape Factor Measurements The measurements for particle size distributions and shape factor are performed with three different techniques: the Malvern Mastersizer, dry sieving and optical microscopy. The techniques and results are described in the following sections.
2. EXPERIMENTAL RESULTS
2.1 MALVERN Mastersizer The full-scale milled fuels (KEMA samples 100w% PO58, 90/10w% PO58/wood and 90/10w% PO58/cocoa) have been characterised by using a Malvern Mastersizer to obtain an insight in the volumetric particle size distribution. Figure A 1 Particle size distribution full-scale KEMA samples
0
0.5
1
1.5
2
2.5
3
3.5
4
4.5
5
5.5
0.1 1 10 100 1000Particle size [micrometer]
Volu
me
[%]
CoalCoal + 10% WoodCoal + 10% Cacao
No shape factors can be obtained by applying this method, which assumes spherical particles. Each fuel shows a maximum at 70-80 microns. Two effects of the addition of biomass on the particle distribution can be observed 1) a shift of the distribution towards larger particle sizes,
20 ECN-C--03-057
and 2) the appearance of shoulders with local maximums around 300 microns. The shift is most likely related to different classifier settings (see KEMA report). The shoulders however imply different grinding behaviour between coal and secondary fuel due to its different structure. The numerical results are given in Table A1. Table A 1 Results Malvern PSD analysis
Fuel Volume Weighted Mean Diameter
[µm]
d(0.1)
[µm]
d(0.5)
[µm]
d(0.9)
[µm]
PO58 + paper 93.5 6.5 57.5 239.0
PO58 + 10% wood 136.2 8.0 73.4 372.4
PO58 + 10% cocoa
101.0 7.3 54.6 286.0
The coal/wood mixture has the largest mean particle size, probably due to the fibrous structure of the wood. These fibres can also be observed in the fuel.
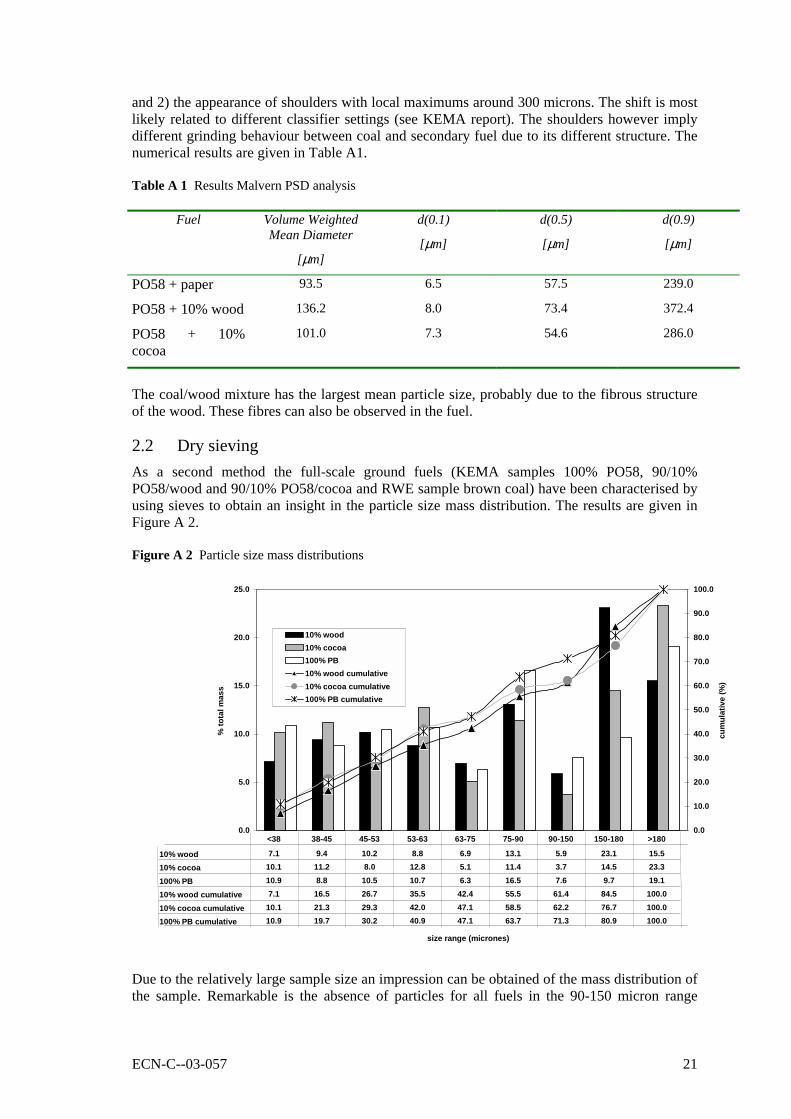
2.2 Dry sieving As a second method the full-scale ground fuels (KEMA samples 100% PO58, 90/10% PO58/wood and 90/10% PO58/cocoa and RWE sample brown coal) have been characterised by using sieves to obtain an insight in the particle size mass distribution. The results are given in Figure A 2. Figure A 2 Particle size mass distributions
0.0
5.0
10.0
15.0
20.0
25.0
size range (micrones)
% to
tal m
ass
0.0
10.0
20.0
30.0
40.0
50.0
60.0
70.0
80.0
90.0
100.0
cum
ulat
ive
(%)
10% wood10% cocoa100% PB10% wood cumulative10% cocoa cumulative100% PB cumulative
10% wood 7.1 9.4 10.2 8.8 6.9 13.1 5.9 23.1 15.510% cocoa 10.1 11.2 8.0 12.8 5.1 11.4 3.7 14.5 23.3
100% PB 10.9 8.8 10.5 10.7 6.3 16.5 7.6 9.7 19.110% wood cumulative 7.1 16.5 26.7 35.5 42.4 55.5 61.4 84.5 100.0
10% cocoa cumulative 10.1 21.3 29.3 42.0 47.1 58.5 62.2 76.7 100.0100% PB cumulative 10.9 19.7 30.2 40.9 47.1 63.7 71.3 80.9 100.0
<38 38-45 45-53 53-63 63-75 75-90 90-150 150-180 >180
Due to the relatively large sample size an impression can be obtained of the mass distribution of the sample. Remarkable is the absence of particles for all fuels in the 90-150 micron range
ECN-C--03-057 21
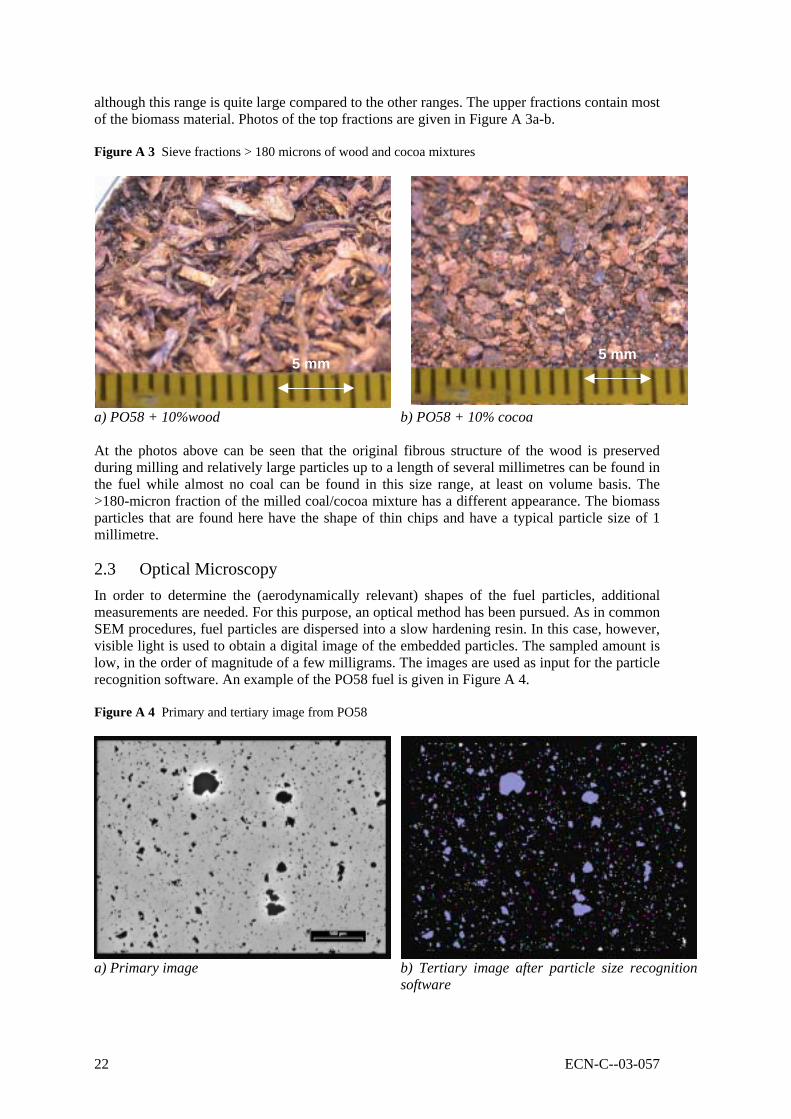
although this range is quite large compared to the other ranges. The upper fractions contain most of the biomass material. Photos of the top fractions are given in Figure A 3a-b. Figure A 3 Sieve fractions > 180 microns of wood and cocoa mixtures
a) PO58 + 10%wood b) PO58 + 10% cocoa
5 mm 5 mm
At the photos above can be seen that the original fibrous structure of the wood is preserved during milling and relatively large particles up to a length of several millimetres can be found in the fuel while almost no coal can be found in this size range, at least on volume basis. The >180-micron fraction of the milled coal/cocoa mixture has a different appearance. The biomass particles that are found here have the shape of thin chips and have a typical particle size of 1 millimetre.
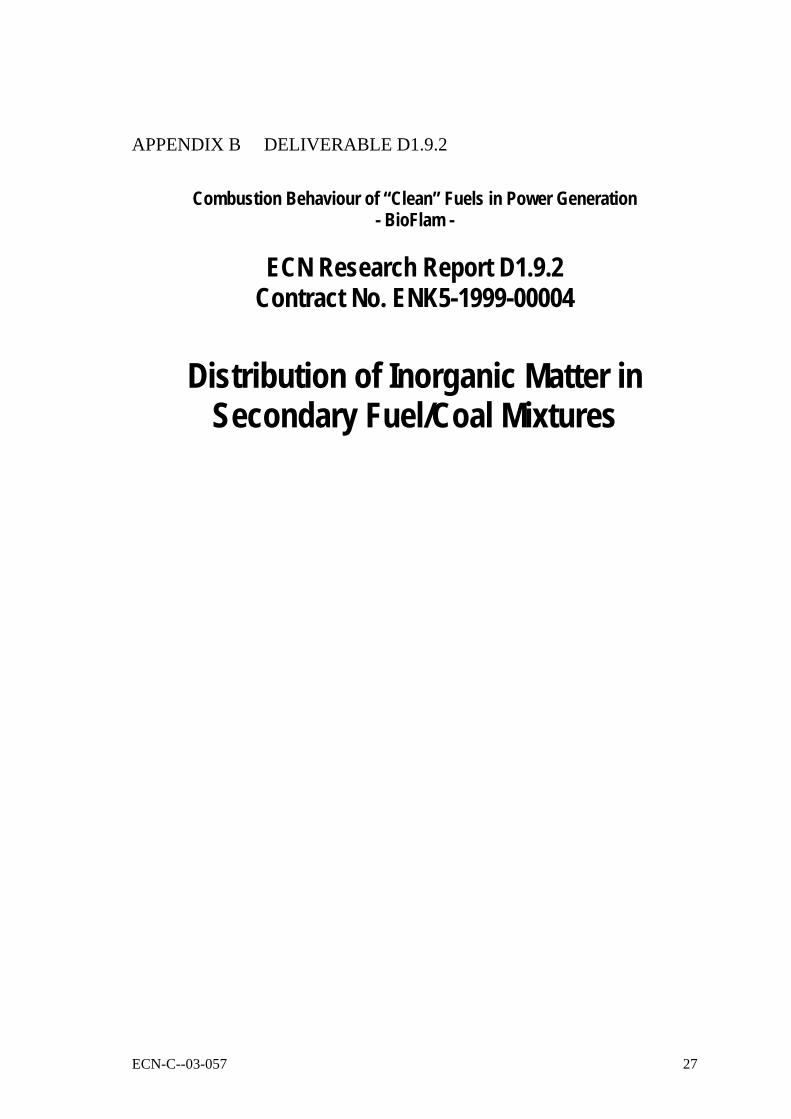
2.3 Optical Microscopy In order to determine the (aerodynamically relevant) shapes of the fuel particles, additional measurements are needed. For this purpose, an optical method has been pursued. As in common SEM procedures, fuel particles are dispersed into a slow hardening resin. In this case, however, visible light is used to obtain a digital image of the embedded particles. The sampled amount is low, in the order of magnitude of a few milligrams. The images are used as input for the particle recognition software. An example of the PO58 fuel is given in Figure A 4. Figure A 4 Primary and tertiary image from PO58
a) Primary image b) Tertiary image after particle size recognition software
22 ECN-C--03-057

The maximum number of particles that can be analysed is approx. 40,000 and the lower detection limit is 14 microns at the recommended magnification of 2.5x. A rather low magnification is used due to the small depth of field at higher magnifications e.g. 10x or 20x. This method is applicable for particles up to approx. 2 millimetres. Particles exceeding this size are too large to fit into one frame at the lowest magnification. From the mean diameters the particle size volume distribution is calculated, under the assumption that all particles are represented by a spherical particle with the size of the measured mean particle diameter1. The particles are classified on diameter basis into bins. The measured volumetric particle size distributions are given in Figure A 5a-d. Figure A 5 Fuel particle size volume distributions
0.1 1 10 100 1 .103
0.013
0.025
0.038
0.05
0.063
0.075
0.088
0.1
Particle diameter [microns]
Volum
e fra
ction
[-]
0.08
0
Res0⟨ ⟩
10000.1 Res5⟨ ⟩
0.1 1 10 100 1 .103
0.013
0.025
0.038
0.05
0.063
0.075
0.088
0.1
Particle diameter [microns]
Volum
e fra
ction
[-]
0.079
0
Res0⟨ ⟩
10000.1 Res5⟨ ⟩
a) PO58 b) PO58 + 10% wood
0.1 1 10 100 1 .103
0.013
0.025
0.038
0.05
0.063
0.075
0.088
0.1
Particle diameter [microns]
Volum
e fra
ction
[-]
0.079
0
Res0⟨ ⟩
10000.1 Res5⟨ ⟩
0.1 1 10 100 1 .103
0.025
0.05
0.075
0.1
0.13
0.15
0.18
0.2
Particle diameter [microns]
Volum
e fra
ction
[-]
0.156
0
Res0⟨ ⟩
10000.1 Res5⟨ ⟩
c) PO58 + 10% cocoa d) brown coal Clearly bimodal distributions can be observed although the formation of ‘shoulders’ - as can be seen with the Malvern analysis – is not very clear probably due to the fact that the number of analysed particles is relatively low (28,000-40,000 particles). Furthermore a shift of the modes is observed towards larger particle sizes. The cumulative volume fractions are given in Figure A 6. Brown coal has a significantly larger particle size (volume weighted) than the PO58-fuels. Small differences are observed in the sub 100-micron range between the PO58 and PO58-biomass samples. Remarkable is that the PO58 + 10% cocoa has the largest mean particle size while this is not expected from the Malvern Mastersizer results. Almost no difference is measured between the PO58 en PO58 + 10% wood. This is due to the small sample size, resulting in a low probability of capturing large particles (1-2 millimetres). 1 The mean particle diameter is determined by averaging the (measured) diameter of the particle at angles of 0°, 15°, 30°.. 165°.
ECN-C--03-057 23

This method is applied to the various coal-biomass mixtures and will result in particle shape information as a function of particle diameter. The (two dimensional) particle shape factor2 is defined as:
( )2particle theofperimeter particle theof surface
4π=SF
Figure A 6 Cumulative volume fractions
0
0.1
0.2
0.3
0.4
0.5
0.6
0.7
0.8
0.9
1
1 10 100 1000Particle size [microns]
Cum
ulat
ive
Volu
me
Frac
tion
[-]
BrowncoalPO58PO58+10%cacaoPO58+10%wood
The shape factor equals one for a spherical particle. The results of the milled fuels are depicted in Figure A 7, where the shape factor is averaged for each bin. Figure A 7 Averaged shape factors per bin
0
0.1
0.2
0.3
0.4
0.5
0.6
0.7
0.8
0.9
1
1 10 100 1000
Particle size [microns]
Part
icle
Sha
pe F
acto
r [-]
BrowncoalPO58PO58+10%cacaoPO58+10%wood
2 The shape factor is a two dimensional factor. For hydrodynamic behaviour often a sphericity factor is used which is determined experimentally.
24 ECN-C--03-057

There is a negative correlation between the average particle diameter (per bin) and the averaged shape factor (per bin) although the variation is quite high and reliability at the lower size range is lower due to resolution limitations of the CCD of the video camera and at the higher size range due to the limited number of large particles. The variation in shape factor is illustrated for the Polish blend in Figure A 8. The trend of decreasing shape factors with particle size is clearly demonstrated. Figure A 8 Unbinned shape factor results
0.1 1 10 100 1 .103
0.1
0.2
0.3
0.4
0.5
0.6
0.7
0.8
0.9
1
Particle Diameter [microns]
Shap
e fac
tor [-
]
1
0
Dsort3⟨ ⟩
10000.1 Dsort2⟨ ⟩
The results of the optical measurement method are summarised in Table A 2. Table A 2 Summary results optical microscopy
Fuel Volume averaged diameter
[µm]
Volume averaged shape
factor
[-]
Number of particles analysed
[-]
Minimum measured diameter
[µm]
Maximum measured diameter
[µm]
PO58 + paper 150 0.50 28,000 14 430*)
PO58 + 10% wood 174 0.57 33,000 14 514*)
PO58 + 10% cocoa 140 0.53 33,000 14 412*)
Brown coal 247 0.45 38,000 14 647*)
*) The maximum measured diameter is low compared to the results of the Malver Mastersizer due to the low sample size. The measured shape factors are between 0.50 and 0.57. The volume averaged shape factor for the PO58 +10% wood is higher than for the PO58 only, which is not expected for the large wood fibres present in this mixture (see sieving pictures). This is most probably due to the low number of large particles that has been measured which is not enough to ensure a profound statistical basis. Furthermore it is questionable if the average shape factor – even per bin – is
ECN-C--03-057 25

useful because particles behave like ‘single’ particles and not like an ‘average’ particle. Therefore a probability distribution would me more useful to describe the behaviour of particles in a furnace.
3. DISCUSSION AND CONCLUSION
Several methods for measuring particle size distributions are available. The advantages and disadvantages of the used measurement methods are given in Table A 3. Only the optical method has the possibility of measuring the shape factor but has the disadvantage that only a limited number of particles can be scanned and particles larger than approx. 2 millimetres are out of range of the microscope thus reducing the probability of detecting larger particles. If the results of the optical method are compared with the Malvern and sieving methods, it appears that some pre-treatment will be necessary to optimise the procedure. None of the methods is perfect in describing the properties of milled fuels due the limitations that are inherent to these methods. Table A 3 Overview measuring methods Method Distribution Assumption Shape factor Number of
particles Resolution Range of
particle sizes
Malvern Volume Spherical particles
No Middle High 1-1,000 micron
Sieving Mass - No High Low 0-…
Optical microscopy
Volume Spherical particles
Yes Low High 15-2,000 micron*)
*) @ 2.5x magnification
26 ECN-C--03-057
APPENDIX B DELIVERABLE D1.9.2
Combustion Behaviour of “Clean” Fuels in Power Generation
- BioFlam -
ECN Research Report D1.9.2 Contract No. ENK5-1999-00004
Distribution of Inorganic Matter in Secondary Fuel/Coal Mixtures
ECN-C--03-057 27

1. INTRODUCTION
Objective The objective of the ECN contribution is to determine the particle size and shape distribution of milled, pure coal and secondary fuel / coal mixtures as a basis for understanding aerodynamic behaviour. In addition to the standard fuel analyses, characterisation is needed of the fuels’ inorganic matter, in terms of compounds (speciation) and particle size. Work Description and Deliverables Computer Controlled Scanning Electron Microscopy (CCSEM) will be used as a tool to determine the inorganic (mainly mineral) matter specification of secondary fuels as a function of particle size. These data will be used to identify secondary fuel inorganic matter that is problematic with respect to fuel mixture grindability. A subreport containing CCSEM (and complementary) measurements of inorganic/mineral matter in secondary fuels, and a discussion on the influence thereof on the grinding behaviour of secondary fuel / coal mixtures has to be delivered
2. CCSEM PROCEDURE
To perform a CCSEM analysis the fuel is embedded in resin and the surface of the sample is scanned at different magnifications to obtain information about different mineral particle size classes. To obtain reliable particle size distribution measurements from SEM several conditions have to be met: • Good distribution of the fuel particles of the sample. Especially no agglomeration and no
sedimentation of the particles. • Sufficient number of particles in one (scanning) frame to minimise scanning time. • Sufficient contrast between fuel and resin to make identification of particles by SEM
possible. • Reproducibility/standardisation. A procedure has been developed to obtain a good distribution of the fuel, which, in the case of coal/biomass mixtures contains particles of two different densities. The particles are dispersed by mixing the fuel with a slow-hardening resin and subsequently stirring in the sample holder. The holder is covered with a lid and is rotated in a special developed device with a low frequency for 24 hours at room temperature. After removal of the sample holder, the sample is dry polished and sputtered with platinum before examination in the SEM. The fuel sample is examined at three magnifications 50x, 250x and 500x. Pictures at 50x magnification of the different fuels are given in Figure 1. It is observed that the concentration of minerals in the brown coal is significantly lower compared to the other fuels although approximately the same concentration in terms of grams per volume of resin has been used. The output of the CCSEM are result files containing information about the composition and size of the elements present. The result files are subsequently processed in a MSAccess/MSVisualBasic routine developed at ECN to classify the particles into known mineral types and particle size bins to obtain the mineral distribution.
28 ECN-C--03-057

Figure B 1 SEM pictures of fuels
a) PO58 b) PO58 + 10%wood
c) PO58 + 10%cocoa d) brown coal
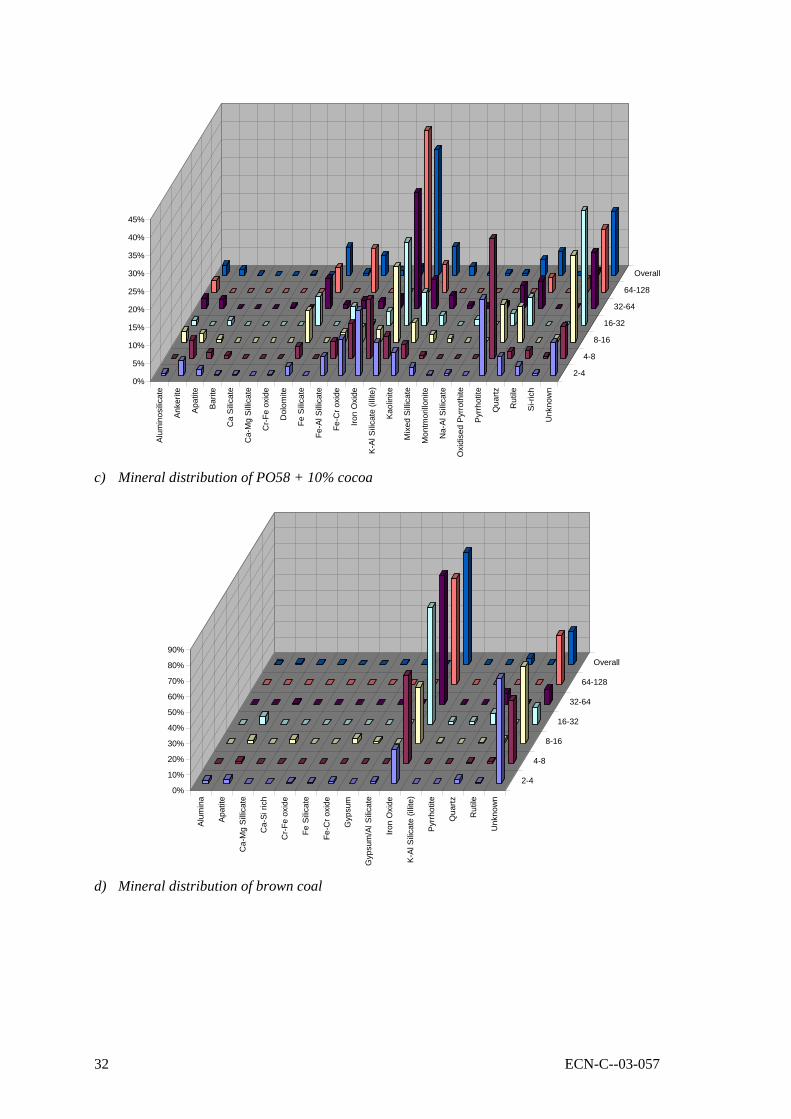
3. RESULTS
The measured overall mineral compositions of the fuels are given in Table B 2. The class ‘unknown’ contains particles that can not be classified because the measured ratio between the elements deviates from a known mineral composition. If the low ash content of wood is taken into consideration, namely approx. 1.8 wt% (see Table B 1) combined with a relatively low mass percentage of 10 wt% of wood in the mixture, the influence of the added wood on the overall mineral distribution is low. This is also observed. All predominantly present mineral types in coal, like e,.g. illite, kaolinite and quartz, are also present in de fuel blends. The high K-Al silicate content of the PO58 +10% cocoa fuel is explained by the high potassium content in cocoa shells. The brown coal shows large differences from the Polish blends while it contains large amounts of iron oxide. The mineral distributions of the fuels - in mass percentages per size bin - are given in Figure B 2 a-d. All numerical values are given in the Annex B, Tables B 3-6. Generally small differences are observed between the PO58 and the PO58 + 10% wood fuels due to the low mineral content of the latter. In general can be said that the trends are the same. Taking into consideration only the larger mineral fractions, the concentrations of ankerite, pyrrhotite and quartz tend to increase if the particle size increases for all Polish blend fuels. Iron oxide shows the same behaviour for PO58 and PO58 +10%wood but not for the PO58 + 10%
ECN-C--03-057 29

cocoa fuel, where a high concentration is found for smaller particle sizes. The opposite is observed for Fe-Al silicate and kaolinite with exception of the PO58 + 10% cocoa fuel. K-Al silicate can be found in all PO58 fuels and is reasonable constant for PO58 and PO58 + 10% wood fuels, but tends to increase if the particle size increases for PO58 + 10% cocoa. This is probably due to large potassium containing cocoa pellet fragments in the fuel. The brown coal sample contains predominantly iron oxide while almost no other minerals are classified. It should be noted though that the amount of ‘unknown’ is high, reaching 67% for the smallest particle sizes. Table B 1 Fuel total ash content Fuel Ash content @ 815°C
[wt%]
PO58 + paper 14.7
wood 1.8
cocoa pellets 10.4
Table B 2 Fuel overall mineral content (in mass fraction)
Fuel Mineral PO58 PO58 + 10% wood PO58 + 10% cocoa Brown Coal
Alumina 1.05% - - 0.02%
Aluminosilicate 6.02% 2.18% 2.92% -
Ankerite 0.11% 10.25% 1.63% 0.95%
Apatite - 0.09% 0.14% -
Barite - - - -
Ca-Al Silicate 0.01% 0.26% - 0.34%
Ca-Mg Silicate - - 0.29% 0.16%
Ca-Al-P - - - -
Cr-Fe oxide - - - 0.01%
Ca-rich - - - -
Dolomite 6.23% 7.41% 7.91% -
Fe Silicate 0.03% - 0.70% 0.01%
Fe-Al Silicate 3.36% 1.38% 5.57% -
Fe-Cr oxide 2.30% 2.30% 1.34% 0.24%
Gypsum - - - 0.09%
Gypsum/Al Silicate - - - 0.01%
Iron Oxide 9.50% 2.35% 2.29% 72.13%
K-Al Silicate (illite) 18.46% 23.86% 35.08% 0.29%
Kaolinite 4.86% 4.05% 7.98% -
KCl - - - -
Mixed Silicate 1.76% 4.25% 2.47% -
Montmorillonite 3.91% 1.00% 0.49% -
Na-Al Silicate 1.13% 2.27% 0.51% -
Oxidised Pyrrothite - - 0.67% -
Pyrrhotite 15.10% 15.23% 4.37% 0.24%
Quartz 14.52% 11.82% 6.61% 4.02%
Rutile - - 0.01% 0.16%
Si-rich 0.33% 0.42% 1.22% -
Unknown 11.32% 10.88% 17.80% 21.34%
30 ECN-C--03-057

Figure B 2 Fuel mineral mass distribution
0%
5%
10%
15%
20%
25%
Alum
inos
ilicat
e
Anke
rite
Apat
ite
Ca-
Al S
illica
te
Dol
omite
Fe S
ilicat
e
Fe-A
l Silli
cate
Fe-C
r oxi
de
Gyp
sum
/Al S
ilicat
e
Iron
Oxi
de
K-Al
Silic
ate
(illit
e)
Kaol
inite
Mix
ed S
illica
te
Mon
tmor
illoni
te
Na-
Al S
illica
te
Pyrrh
otite
Qua
rtz
Si-ri
ch
Unk
now
n
2-4
4-8
8-16
16-32
32-64
64-128
Overall
a) Mineral distribution of PO58
0%
5%
10%
15%
20%
25%
30%
Alum
ina
Alum
inos
ilicat
e
Anke
rite
Apat
ite
Ca-
Al S
illica
te
Ca-
Al-P
Ca-
rich
Dol
omite
Fe S
ilicat
e
Fe-A
l Silli
cate
Fe-C
r oxi
de
Gyp
sum
Gyp
sum
/Al S
ilicat
e
Iron
Oxi
de
K-Al
Silic
ate
(illit
e)
Kaol
inite KC
l
Mix
ed S
illica
te
Mon
tmor
illoni
te
Na-
Al S
illica
te
Oxi
dise
d Py
rroth
ite
Pyrrh
otite
Qua
rtz
Rut
ile
Si-ri
ch
Unk
now
n
2-4
4-8
8-16
16-32
32-64
64-128
Overall
b) Mineral distribution of PO58 + 10% wood
ECN-C--03-057 31
0%
5%
10%
15%
20%
25%
30%
35%
40%
45%
Alum
inos
ilicat
e
Anke
rite
Apat
ite
Barit
e
Ca
Silic
ate
Ca-
Mg
Sillic
ate
Cr-F
e ox
ide
Dol
omite
Fe S
ilicat
e
Fe-A
l Silli
cate
Fe-C
r oxi
de
Iron
Oxi
de
K-Al
Silic
ate
(illit
e)
Kaol
inite
Mix
ed S
illica
te
Mon
tmor
illoni
te
Na-
Al S
illica
te
Oxi
dise
d Py
rroth
ite
Pyrrh
otite
Qua
rtz
Rut
ile
Si-ri
ch
Unk
now
n
2-4
4-8
8-16
16-32
32-64
64-128
Overall
c) Mineral distribution of PO58 + 10% cocoa
0%
10%
20%
30%
40%
50%
60%
70%
80%
90%
Alum
ina
Apat
ite
Ca-
Mg
Sillic
ate
Ca-
Si ri
ch
Cr-F
e ox
ide
Fe S
ilicat
e
Fe-C
r oxi
de
Gyp
sum
Gyp
sum
/Al S
ilicat
e
Iron
Oxi
de
K-Al
Silic
ate
(illit
e)
Pyrrh
otite
Qua
rtz
Rut
ile
Unk
now
n
2-4
4-8
8-16
16-32
32-64
64-128
Overall
d) Mineral distribution of brown coal
32 ECN-C--03-057

4. DISCUSSION AND CONCLUSIONS
Mineral distributions of the different fuels have been successfully determined. It is difficult to draw conclusions from the available results due to fact that the mineral distribution of the original unmilled material is not available, making it not possible to determine if a change in mineral distribution originates from the added biofuel or from the changed grinding behaviour of the coal. From the comparison of the PO58 and PO58 + 10% wood is concluded that the addition of wood does not have a large influence on the distribution of minerals in the milled fuel. More information about the rheology and unmilled fuel is needed to give a sound prediction of the behaviour of minerals on grinding fuels.
ECN-C--03-057 33

ANNEX B – OVERVIEW OF EXPERIMENTAL DATA
Table B 3 Mineral mass distribution of PO58
Size bin [micron] Mineral 2-4 4-8 8-16 16-32 32-64 64-128
Overall
Aluminosilicate 0.7% 2.5% 1.2% 0.0% 2.7% 0.0% 1.05%
Ankerite 1.8% 1.9% 3.1% 3.5% 1.6% 10.9% 6.02%
Apatite 0.9% 0.9% 0.2% 0.0% 0.0% 0.0% 0.11%
Ca-Al Silicate 0.2% 0.0% 0.0% 0.0% 0.0% 0.0% 0.01%
Dolomite 3.4% 4.6% 3.1% 1.4% 11.9% 4.7% 6.23%
Fe Silicate 0.0% 0.0% 0.3% 0.0% 0.0% 0.0% 0.03%
Fe-Al Silicate 11.9% 6.4% 2.0% 3.2% 0.0% 4.7% 3.36%
Fe-Cr oxide 0.7% 1.6% 4.5% 5.4% 4.5% 0.0% 2.30%
Gypsum/Al Silicate 0.1% 0.0% 0.0% 0.0% 0.0% 0.0% 0.00%
Iron Oxide 1.0% 0.8% 9.6% 11.3% 13.6% 8.4% 9.50%
K-Al Silicate (illite) 21.3% 21.1% 22.1% 23.1% 19.7% 15.4% 18.46%
Kaolinite 16.4% 21.5% 17.5% 5.0% 3.2% 0.0% 4.86%
Mixed Silicate 6.9% 8.1% 5.2% 0.0% 1.9% 0.0% 1.76%
Montmorillonite 3.9% 3.7% 4.5% 0.0% 4.3% 4.4% 3.91%
Na-Al Silicate 1.0% 1.4% 1.1% 0.5% 3.1% 0.0% 1.13%
Pyrrhotite 1.4% 1.9% 8.2% 22.4% 7.2% 22.9% 15.10%
Quartz 7.0% 9.9% 6.4% 11.3% 18.7% 15.5% 14.52%
Si-rich 0.8% 0.2% 0.0% 0.0% 1.0% 0.0% 0.33%
Unknown 20.5% 13.3% 10.9% 12.9% 6.5% 13.1% 11.32%
34 ECN-C--03-057

Table B 4 Mineral mass distribution of PO58 + 10% wood
Size bin [micron] Mineral 2-4 4-8 8-16 16-32 32-64 64-128
Overall
Alumina 0.1% 0.2% 0.0% 0.0% 0.0% 0.0% 0.00%
Aluminosilicate 1.1% 0.3% 0.8% 1.3% 0.0% 4.6% 2.18%
Ankerite 2.1% 2.2% 4.9% 6.4% 4.9% 18.0% 10.25%
Apatite 1.2% 1.0% 1.2% 0.0% 0.0% 0.0% 0.09%
Ca-Al Silicate 0.3% 0.3% 0.0% 0.8% 0.0% 0.0% 0.26%
Ca-Al-P 0.0% 0.0% 0.0% 0.0% 0.0% 0.0% 0.00%
Ca-rich 0.1% 0.0% 0.0% 0.0% 0.0% 0.0% 0.00%
Dolomite 3.2% 7.1% 7.2% 8.4% 14.0% 2.5% 7.41%
Fe Silicate 0.1% 0.0% 0.0% 0.0% 0.0% 0.0% 0.00%
Fe-Al Silicate 5.5% 4.3% 4.1% 3.3% 0.0% 0.0% 1.38%
Fe-Cr oxide 1.5% 1.5% 3.1% 1.6% 0.6% 3.8% 2.30%
Gypsum 0.1% 0.0% 0.0% 0.0% 0.0% 0.0% 0.00%
Gypsum/Al Silicate 0.0% 0.0% 0.0% 0.0% 0.0% 0.0% 0.00%
Iron Oxide 1.2% 2.1% 6.6% 4.1% 2.3% 0.0% 2.35%
K-Al Silicate (illite) 26.5% 22.9% 21.6% 19.2% 26.4% 26.9% 23.86%
Kaolinite 17.0% 17.4% 9.3% 7.8% 3.5% 0.0% 4.05%
KCl 2.2% 0.7% 0.0% 0.0% 0.0% 0.0% 0.00%
Mixed Silicate 4.3% 3.8% 3.8% 2.1% 2.8% 7.2% 4.25%
Montmorillonite 1.8% 1.8% 1.1% 2.5% 0.5% 0.0% 1.00%
Na-Al Silicate 2.1% 1.7% 3.1% 6.2% 0.0% 0.0% 2.27%
Oxidised Pyrrothite 0.0% 0.4% 0.0% 0.0% 0.0% 0.0% 0.00%
Pyrrhotite 3.4% 5.0% 8.8% 14.9% 11.2% 19.3% 15.23%
Quartz 7.8% 10.3% 10.4% 8.2% 19.7% 10.5% 11.82%
Rutile 0.6% 0.0% 0.0% 0.0% 0.0% 0.0% 0.00%
Si-rich 0.7% 0.7% 0.5% 0.5% 0.9% 0.0% 0.42%
Unknown 17.0% 16.1% 13.5% 12.8% 13.2% 7.2% 10.88%
ECN-C--03-057 35

Table B 5 Mineral mass distribution of PO58 +10% cocoa
Size bin [micron] Mineral 2-4 4-8 8-16 16-32 32-64 64-128
Overall
Aluminosilicate 0.7% 0.0% 3.0% 1.4% 3.0% 3.3% 2.92%
Ankerite 4.2% 5.2% 2.4% 0.0% 2.7% 0.0% 1.63%
Apatite 1.6% 1.7% 0.8% 1.3% 0.0% 0.0% 0.14%
Barite 0.3% 0.8% 0.0% 0.0% 0.0% 0.0% 0.00%
Ca Silicate 0.3% 0.0% 0.0% 0.0% 0.0% 0.0% 0.00%
Ca-Mg Silicate 0.0% 0.0% 0.0% 0.0% 0.5% 0.0% 0.29%
Cr-Fe oxide 0.2% 0.0% 0.0% 0.0% 0.0% 0.0% 0.00%
Dolomite 2.4% 3.3% 8.7% 8.0% 8.4% 6.9% 7.91%
Fe Silicate 0.0% 0.0% 0.0% 0.0% 1.2% 0.0% 0.70%
Fe-Al Silicate 5.3% 4.8% 2.5% 5.2% 2.4% 12.0% 5.57%
Fe-Cr oxide 10.1% 9.7% 4.0% 0.5% 2.0% 0.0% 1.34%
Iron Oxide 18.1% 16.5% 3.4% 3.8% 3.1% 0.0% 2.29%
K-Al Silicate (illite) 9.0% 6.3% 21.1% 23.2% 32.3% 45.0% 35.08%
Kaolinite 6.5% 3.9% 5.3% 9.2% 8.1% 7.7% 7.98%
Mixed Silicate 2.3% 0.8% 2.1% 2.7% 3.7% 0.0% 2.47%
Montmorillonite 0.1% 0.0% 0.9% 0.0% 0.8% 0.0% 0.49%
Na-Al Silicate 0.4% 0.0% 0.0% 1.6% 0.6% 0.0% 0.51%
Oxidised Pyrrothite 0.0% 0.0% 0.0% 0.0% 1.1% 0.0% 0.67%
Pyrrhotite 21.2% 33.4% 10.5% 3.3% 6.4% 0.0% 4.37%
Quartz 5.2% 1.9% 9.9% 7.9% 7.7% 4.0% 6.61%
Rutile 2.6% 2.1% 0.0% 0.0% 0.0% 0.0% 0.01%
Si-rich 0.4% 0.6% 0.9% 0.0% 0.2% 3.5% 1.22%
Unknown 9.1% 9.0% 24.2% 32.0% 15.7% 17.6% 17.80%
Table B 6 Mineral mass distribution of brown coal
Size bin [micron] Mineral 2-4 4-8 8-16 16-32 32-64 64-128
Overall
Alumina 2.1% 0.0% 0.0% 0.0% 0.0% 0.0% 0.02%
Apatite 2.6% 1.3% 2.5% 4.7% 0.0% 0.0% 0.95%
Ca-Mg Silicate 0.0% 0.0% 0.0% 0.0% 0.8% 0.0% 0.34%
Ca-Si rich 0.0% 0.0% 2.5% 0.0% 0.0% 0.0% 0.16%
Cr-Fe oxide 0.6% 0.0% 0.0% 0.0% 0.0% 0.0% 0.01%
Fe Silicate 0.8% 0.0% 0.0% 0.0% 0.0% 0.0% 0.01%
Fe-Cr oxide 1.1% 0.0% 3.6% 0.0% 0.0% 0.0% 0.24%
Gypsum 0.0% 0.0% 1.4% 0.0% 0.0% 0.0% 0.09%
Gypsum/Al Silicate 1.3% 0.0% 0.0% 0.0% 0.0% 0.0% 0.01%
Iron Oxide 21.6% 56.5% 36.4% 74.9% 82.5% 68.2% 72.13%
K-Al Silicate (illite) 0.0% 0.0% 0.8% 1.5% 0.0% 0.0% 0.29%
Pyrrhotite 0.0% 0.0% 0.0% 1.6% 0.0% 0.0% 0.24%
Quartz 2.2% 0.6% 1.1% 6.8% 7.2% 0.0% 4.02%
Rutile 0.8% 1.1% 2.0% 0.0% 0.0% 0.0% 0.16%
Unknown 66.9% 40.6% 49.6% 10.5% 9.5% 31.8% 21.34%
36 ECN-C--03-057

APPENDIX C DELIVERABLE D2.9.1
Combustion Behaviour of “Clean” Fuels in Power Generation
- BioFlam -
ECN Research Report D2.9.1 Contract No. ENK5-1999-00004
Lab-Scale Characterisation Techniques for Secondary Fuels
ECN-C--03-057 37

1. INTRODUCTION
1.1 General Previous European programmes (e.g. APAS, OPTEB) have addressed many issues related to secondary fuel co-firing. These programmes have resulted in a significantly advanced awareness of certain problem areas. Generally, however, this knowledge is not suitable for the technical evaluation of the application of specific secondary fuels in specific boilers. From an economic point of view, there will be an increasing incentive to utilise especially cheap, local waste products for secondary fuel, thereby introducing a large variability of technical questions. Even with constant quality secondary fuels such as e.g. energy crops, site-specific conditions may well lead to very different ways of implementation of the fuel (e.g. direct or indirect co-firing, or fuel pretreatment such as pelletisation or pyrolysis) and thus different questions may need to be addressed. Economic incentives will therefore justify the development of methods, which can be used for the technical assessment of fuel- and site-specific issues.
1.2 Objectives The main objective of ECN’s contribution was to develop analysis and lab-scale test methods for a cost-effective assessment of secondary fuel combustion and ash behaviour. The initial issues of interest included fuel devolatilisation rate/yield, fuel-nitrogen partitioning, the formation and deposition of ash, burnout and fly ash quality. In the project the activities were focused on the latter three items. The objective therefore was to reduce the necessity to perform extensive full-scale tests by means of reliable lab-scale fuel fingerprinting methods, specifically for the assessment of:
reactivity, covering very short to very long residence times; • •
•
burnout and, more precisely, fly ash quality parameters including LOI (Loss on Ignition) / C-in-ash and other characteristics that can be determined from lab-scale fly ash samples; effects on slagging and fouling, in relation to the speciation of fuel inorganics.
1.3 Methodological approach ECN is developing test and analytical methods for the aforementioned aspects of fuel and ash behaviour. For this work, ECN’s Lab-scale Combustion Simulator (LCS) is used. The LCS is a dedicated tool, the unique features of which are specifically useful for the investigation of fuel and ash behaviour under well-controlled and industrially relevant combustion conditions. As shown in Figure C 1, LCS tests take a logical position between fuel analyses and pilot-scale testing.
38 ECN-C--03-057

Fuel & ash conversion
Burner & flame assessment
Fuel analysis
Lab-scale(LCS) testing
Pilot-scaletesting
Full-scaletesting
Physical & chemical properties
Overall risk assessment
none
all
fuelknowledge
Figure C 1 Different levels of fuel assessment On a lab-scale, principally, all aspects of fuel conversion behaviour can be tested and evaluated up to but excluding the performance of a particular fuel/burner combination. Provided that the conversion of the fuel is studied under conditions reproduced from a full-scale furnace, a detailed analysis of intermediate solid phase and, to some extent, gas phase products, results in a furnace-specific fuel fingerprint that can be used as a second level of fuel assessment. Because inherently lab-scale tests are relatively cheap, maximising the scope of lab-scale fuel fingerprinting is expected to become a cost-effective way for supporting the introduction of CO2-friendly, secondary fuels for power production. In this perspective, ECN’s Lab-scale Combustion Simulator has been modified in the start of the project in such a way that fuel behaviour could be studied from low to very high (2-3s) residence times. After this modification it was envisaged to extend the fuel fingerprint including the following (high-residence) aspects: • • •
burnout (final conversion phase), to assess combustion efficiency and carbon-in-ash, fly ash properties, to assess its quality for utilisation, fly ash fouling (general: deposition) potential.
Specifically, the following approaches have been applied: Burnout According to Dutch regulation, fly ash can be certified for application in cement making if the carbon-in-ash mass fraction is under 5%. For a fuel with an ash mass fraction of 10% (d.b.) this corresponds to a conversion (burnout) of 99.4 %. This precondition is generally tested by determination of the loss on ignition (LOI), which is measured as the fractional mass decrease of a fly ash sample when heated for 10 minutes at 815 °C in air (NEN 2476). The development of the lab-scale test method involves combustion of test fuels under relevant (high-temperature) conditions and fly ash sampling at a residence time between 2 and 3 seconds. The LOI determined from these samples are evaluated by comparison with fly ash samples from pilot- and full-scale furnaces. Finally, the test method is discussed and evaluated. Fly ash quality For certification of fly ash from secondary (non-coal) fuels, according to Dutch regulations additional testing is required. Although some of the preconditions actually require the testing of fly ash in the application (e.g., testing of leaching characteristics of concrete), certain preconditions can be tested by means of chemical/physical analysis directly on the fly ash.
ECN-C--03-057 39
The development of the lab-scale test method is aimed at identifying those preconditions that can be tested in association with the Lab-scale Combustion Simulator, i.e. can be applied to small fly ash samples from a combustion run using this facility. Then the specific tests (analyses) will be performed and the results will be compared with pilot- and full-scale fly ash samples. Finally, the test method is discussed and evaluated. Ash deposition Although ash deposition phenomena such as (near-burner) slagging can be simulated in certain short residence time drop tube furnaces and similar devices, the more important problem with secondary fuels concerns the deposition of fly ash at high residence times onto the heat exchanging surfaces in the upper convective part of a furnace. The development of the lab-scale test method is predominantly focused on the assessment and the improvement of the understanding of fouling phenomena associated with the co-firing of biomass with coal. The approach combines advanced fuel analyses such as CCSEM and chemical fractionation to identify the ash forming species with detailed analysis of ash deposits from the Lab-scale Combustion Simulator as well as (if available) from pilot-scale facilities.
40 ECN-C--03-057

2. EQUIPMENT
General description LCS The ECN Lab-scale Combustion Simulator (LCS) is a flexible facility for the characterisation of solid fuel behaviour under typical pulverised fuel fired boiler conditions. The facility comprises a drop tube furnace and is equipped with a primary/secondary gas burner to provide a reaction pathway along which the time-dependent conversion behaviour of fuel particles can be studied. An accurate simulation of reaction conditions in terms of heating rate, temperature and gas composition is considered essential for a relevant characterisation of fuel behaviour. As the reaction conditions can be set independent of the fuel-of-interest, the behaviour and impact of secondary fuels under primary fuel-dominated conditions can be studied specifically well. Fuels may be characterised in terms of: organic behaviour - time & particle size dependent conversion, including burnout in terms of LOI - volatile matter yield under high heating rates - fate of nitrogen during devolatilisation - char reactivity (in combination with thermogravimetric analysis) inorganic behaviour - slagging of near-burner zones or waterwalls - fouling of heat exchanging surfaces in boiler convective areas - fly ash formation and quality for applications - fine particle formation and emission, including related trace elements
An impression of the LCS rig is presented in Figure C 2. Legend 2 I Devolatilisation zone II Combustion zone I
1 Solid fuel feed 2 Multi-stage flat flame gas burner 3 Inner burner 4 Outer burner 5 Shield gas ring 6 Reactor tube 7 Optical access
oxygen
gas+
particles
gas
temperaturehigh
high
II
1344 5
6
7
Figure C 2 Staged flat flame gas burner and reaction (drop) tube in ECN combustion simulator
ECN-C--03-057 41

Detailed description LCS The flat flame gas burner (part 1 in Figure C 2) consists of two sub-burners viz. a primary, inner burner (10.9 mm ID) and a secondary, outer burner (60.7 mm ID). A tertiary nitrogen flow is applied to create suitable mixing profiles and for thermal protection of the reactor tube. Fuel particles are fed through the inner burner and undergo rapid heating (>105 °C/s) up to the high temperature level of e.g. a coal flame (1400-1600 °C). The fuel particles are fed by means of a commercial rotating brush feeder. The fuel is brought into a cylinder and a piston presses the powder against a rapidly rotating brush. The particles are dispersed by the brush and transported into the reactor pneumatically. Typically, low particle feed rates of 1-5 g/h are used in order to control the gaseous environment of each particle by means of the imposed gas flame conditions. For low-NOx operation, this implies that heating and devolatilisation of the fuel particles takes place in an oxygen-lean zone (indicated as I in Figure C 2) provided by the primary, inner burner, whereas char combustion takes place in a zone with excess oxygen (indicated as II in Figure C 1). The transition from oxygen-lean to oxygen-rich is completed in zone I by diffusion from the outer burner gas flow to the inner burner gas/particle flow. The gas/particle flow is then isokinetically sucked into a 76 mm ID alumina reactor tube, which is heated by two, 3.4 kW, furnace sections equipped with Kanthal Super 1800 elements (maximum element temperature 1700 °C). The temperatures of both sections are independently controlled by Eurotherm controllers and two S-type thermocouples. Applying typical low-NOx settings the following axial profiles were measured:
0
400
800
1200
1600
2000
0 200 400 600 800
Distance from burner [mm]
Gas
tem
pera
ture
[°C]
0
10
20
30
40
50G
as c
ompo
sitio
n [%
vol] T [°C]
SO2N2 (bal)COO2CO2H2O
Figure C 3 Centre line gas composition and temperature in the LCS illustrating typical low-NOx
conditions Particle samples can be obtained at residence times between 10 and 3000 ms with a vertically adjustable, oil-cooled probe. The particles can be cooled by means of a nitrogen/helium quench at the tip of the probe, and are subsequently collected by a cyclone (d50=3 µm) and a 1.2 µm cellulose filter. Alternatively, a deposition probe may be used for slagging or fouling tests. Different coupons with a deposit surface area of 20x2.5 mm2 can be attached to the probe head to simulate different deposition surfaces in terms of material and surface structure. The coupons may be either uncooled (ceramics) or cooled (metal surfaces). The surface temperature of the cooled metal coupon can be set independent of the gas temperature and is continuously monitored
42 ECN-C--03-057

during the deposition test. Sampling at different gas temperatures or residence times can be accommodated by means of a vertical probe transport mechanism. The coupons are easily removed for further testing (e.g. corrosion) or analysis of the deposit, especially by means of SEM-EDX.
ECN-C--03-057 43

3. SAMPLES
Table C 1 Overview of samples and performed analyses/tests
1 all KEMA PO58-based samples may contain up to 5% proportion of paper sludge 2 separate samples collected at various points in the pilot scale installation separate samples collected on cooled/uncooled surfaces at various points in the pilot scale
installation
ID
sample
name
sr
upplie(date)
Description
amount
pretreatment
(CC
)SEM
PSD
(Malvern)/
dry sieving
LCS
(burnout)
LOI
815°C (550)
deposition (cooled)/
1 PO 58 coal 1 Kema (20.07.01) Coal blend 3 kg pulverised (X)/X X X X/(X) (X)/X
2 Borssele fly ash
In Table C 1, an overview of materials received by ECN, as well as a brief description of the performed analyses and tests is given. Results of ultimate and proximate analyses are summarised in Table C 2, whereas a detailed overview of SEM-EDX and CCSEM analyses are presented in Tables C 8 through A 17 in the Annex.
3
chemical
analysis
uncooled
X
(fuel ID1) Kema (17.08.01) full scale fly ash 0.5 kg none X (X)
3 wood Kema (20.07.01) pellets X
4 Kema (20.07.01) 5/95 mix 3 kg pulverised X (X)
5 Borssele fly ash (fuel ID4/9) Kema (17.08.01) full scale fly ash 0.5 kg X
6 Kema (20.07.01) 10/90 mix 3 kg pulverised X (X)/X (X)/X X (X)/X
7 Borssele fly ash (fuel ID6/11) Kema (17.08.01) full scale fly ash 0.5 kg X X
8 Kema (20.07.01) pellets 1 kg none X
9 cocoa shells+PO58 Kema (20.07.01) 5/95 mix 3 kg pulverised
10 Borssele fly ash Kema (17.08.01) full scale fly ash 0.5 kg none
11 cocoa shells+PO58 Kema (20.07.01) 10/90 mix 3 kg pulverised (X)/X (X)/X X X/(X) (X)/X
12 Borssele fly ash Kema (17.08.01) full scale fly ash 0.5 kg none
13 wood+cocoa+paper sludge+PO58 Kema (20.07.01) 1.25/1.25/
10/87.5 mix 3 kg
X
1 kg none
wood+PO58 X
none
wood+PO58 X/(X)
none
cocoa shells
X
(duplicate ID5)
X
(duplicate ID7)
pulverised X
wood+cocoa+paper sludge+PO58 Kema (20.07.01) 2.5/2.5/10/85 mix 3kg pulverised X
15 PO58 (IFRF milled) IFRF RS (20.10.02) 130 g pulverised
16 wood+PO58 (IFRF milled) IFRF RS (20.10.02) 10/90 mix 110 g pulverised
17 cocoa shells+PO58 (IFRF milled) 10/90 mix 110 g pulverised
18 brown coal RWE P. (22.06.01) brown coal 2 kg pulverised X X
19 paper sludge RWE P. (02.01.01) 2 kg none X
20 paper sludge RWE P (22.06.01) dry sludge 1 kg pulverised
21 sewage sludge RWE P. (02.01.01) sludge none X
paper sludge+coal RWE P. (22.06.01) 5/95 mix 2 kg pulverised
23 paper sludge+coal RWE P. (22.06.01) 10/90 mix 2 kg
24 RWE P. (22.06.01) 10/90 mix 2 kg pulverised
25 IVD fly ash 2
(ID 15) IVD (08.08.02) pilot scale fly ash
14
Coal blend
IFRF RS (20.10.02)
(X)/X
sludge
2 kg
22
pulverised
sewage sludge+coal
10 g none X(X) X
26 IVD fly ash (ID15/cocoa shells) IVD(08.08.02) pilot scale fly ash 10 g none X(X) X
27 IVD fly ash (ID15/wood) IVD (08.08.02) pilot scale fly ash 10 g none X
28 IVD deposits3 (ID15/cocoa shells) IVD (15.09.02) pilot scale
deposits - embedded X
29 IVD deposits (ID15/wood) IVD (15.09.02) pilot scale
deposits - embedded X
X
44 ECN-C--03-057

Table C 2 Summary of ultimate and proximate analyses
ECN-C--03-057 45

4. EXPERIMENTAL PROGRAMME
Modification of the LCS test rig In the beginning of the BioFlam project the maximum residence time for a fuel particle in the LCS test rig was limited to approximately 1 second. This was shown to be insufficient for obtaining high degrees of fuel conversion. Therefore it was decided to redesign the reactor in order to enable reaching residence times comparable with those in large-scale installations (2-3 s). Modifications have been applied to the reactor and the sampling train. In the upper part of the ceramic reactor tube an opening was created to ventilate a part of the flue gas. The gas from the centre of the tube, which includes the fuel particles, is sucked into the second part of the reactor tube as can be seen in Figure C 2. By controlling the gas flow into the second part and by using a vertically adjustable sampling probe, residence times with a maximum of ca 3 s can be obtained. Gas conditions In total, 16 runs have been performed in the ECN LCS test rig. In all experiments the same gas burner settings (summarised in Table C 3) were used to simulate air staging Table C 3 Summary of LCS gas settings
CH4 [L/min] 0.13 O2 [L/min] 0.26 N2 [L/min] 1.32 H2S (optional) [mL/min] 17.0 In
ner
Bur
ner
λinner [-] 1.0 CH4 [L/min] 2.33 O2 [L/min] 5.60 N2 [L/min] 23.7 O
uter
bu
rner
λouter [-] 1.2 Ring N2 (shield gas) [L/min] 1.67
Total (after combustion) [L/min] 35.0
Burnout tests In all burnout tests sampling of fly ash were performed at the same distance to the burner, maintaining the same flame and furnace temperatures (1650 and 1550 °C respectively) as well as the sampling rate. This resulted in a particle residence time of approximately 2.3 s. Additionally, three experiments with PO58 have been performed, sampling at three different positions in the system (at 250, 500 and 750 mm distance from the burner) in order to cover the whole burnout trajectory of this base fuel. The latter experiments were performed with a decreased sampling rate, which resulted in particle residence time of ca 3 s at the longest distance to the burner. Fly ash quality tests Materials obtained from the combustion tests were inspected by means of SEM-EDX and subsequently ashed (together with the certified ash-free filters), at the desired temperature (550 or 815 °C) in quartz crucibles. Also materials obtained from IVD pilot-scale installation and full-scale tests at Borssele power plant were treated in this way. Finally conversions of the materials - burnout in relation to the full-scale fuels - have been calculated utilising the ash-tracer method. Results are summarised in Table C 5 in the next paragraph. Also a number of CC-SEM analyses have been performed. These are summarised in Tables C 14-16 in the Annex. The procedures for testing the quality of fly ash from pulverised coal firing are described in the European standard EN-450 “Fly ash for concrete. Definitions, requirements and quality
46 ECN-C--03-057

control.” In addition to this, a Dutch recommendation (CUR-70) has been drafted which includes testing fly ash from pulverised coal with a maximum mass fraction of 10% secondary fuel. The recommendation gives procedures which can be used to assess the conformity of such fly ashes (called fly ash “A”) with common (coal-derived) fly ash. In concrete terms, fly ash “A” should at least be equivalent to common fly ash which complies with EN-450 and CUR-70. The tested properties according to CUR-70 are: 1. Compliance EN-450:
1.1. chemical requirements: 1.1.1. carbon content (LOI) - water requirement (LOI 815, as fractional mass loss ≤ 5%) 1.1.2. chloride - corrosion steel reinforcement (mass fraction ≤ 0.1%) 1.1.3. sulphate - thaw-frost resistivity (mass fraction ≤ 3%) 1.1.4. free CaO (mass fraction ≤ 2%), reactive SiO2 (mass fraction ≥ 25%)- cementitious
properties 1.2. physical requirements:
1.2.1. fineness (mass fraction 60% ≤ 45 µm), activity index, shape stability, density (± 150 kg/m3)
2. Application in prestressed concrete 3. Binding agent factor 4. Conformity investigation fly ash “A” with certified fly ash:
4.1. durability (thaw-frost cycle, Cl-permeability) 4.2. impact on additives (flowability, bubble agent, binding time retardant)
Applied properties such as 2, 3 and 4 can be tested provided that sufficient amounts (few to tens of kilograms) are available. Because this would require at least pilot scale tests here, these properties are not further considered. Many of the properties described in EN-450, however, can presumably be assessed by the analysis of fly ash samples produced on a lab-scale. In order to develop such a relatively fast and cheap method, the following experimental procedure was set up.
Fuel sample
Conversion into fly ash (relevant T, C,τ)
2.
0.
1.
Calculated ash composition critical?
3.
Sample 1a. (CC)SEM - size/morphologyb. LOI (550 °C)c. salts, Cl-, SO4
2-
Sample 2a. (CC)SEM - size/morphologyb. LOI (815 °C)c. SiO2, CaO, MgO
4. Compliance NEN-EN 450?
n
y
yFurther testing
(pilot-scale or larger)
Figure C 4 Experimental procedure for the fly ash quality compliance assessment As can be seen in the above block scheme, prior to performing the analyses, potentially critical elements are identified by calculating a theoretical fly ash composition, based on the chemical analysis of the fuel. The concentrations of the elements in the ash were calculated using the following formulae:
ECN-C--03-057 47

100**)(*
**)(
**)(
)( ,
=
∑
∑∑
f
fi
f
XffXaconv
iCFeiXffiXe
CFeXffXe
eC
C(e) element e conc. in resulting fly ash Xe(f) mass fraction of element e in fuel f Xf mass fraction fuel f in blend CFe volatilisation factor e in fly ash Xa(f) ash content fuel f conv overall fuel conversion
The results are presented for the three fuels in Figure C 5 (presented where appropriate as oxides). In Table C 7 (in Annex), the assumptions for the calculations, such as overall conversion and volatilisation factors of the elements, are presented. The latter were derived from data on full-scale installations elemental balance; presented in ECN report ECN-C-00-103. The theoretical results are followed by an overview of ash compositions (Figure C 6) as analysed by means of CC-SEM in the materials from the lab- bench- and full-scale installations of partners involved in the project. Ash deposition tests Under the same conditions as in the burnout tests, a number of deposition tests has been performed. As deposition surfaces, coupons of Alsint (Al2O3) were utilised to simulate near-burner slagging and Alloy X20(CrMoV121) substrates to mimic superheater fouling. The temperature of the furnace has been lowered in these tests by a 100°C in order to maintain the desired temperature of the deposition substrate (1450°C for uncooled- and ~750°C for the cooled surface). The obtained samples have been examined by means of SEM-EDX. Results of these analyses are reported in Table C 8 in the Annex, whereas SEM micrographs are presented in Figures C IX-XIV therein. In Table C 4, a detailed overview of the performed lab-scale tests is given. Table C 4 Overview of LCS experiments
ECN code fuel (ID) experiment
type
furnace temperature
[°C]
distance to burner
[mm] analysis remarks
A0145 PO58 (ID1) 1450 915 LOI550 A0146 PO58 (ID1) 1550 915 LOI815
A0148 PO58 (ID1) 1550 915 LOI550/ CCSEM
A0149 PO58 (ID1) 1550 915 LOI815 no H2S A0150 PO58+10%wood (ID6) 1550 915 LOI815
A0151 PO58+10%cocoa (ID11) 1550 915 LOI550/ CCSEM
A0152 PO58+10%cocoa (ID11) 1550 915 LOI815
A0153 PO58+10%wood (ID6) 1550 915 LOI550/ CCSEM
A0154 PO58+10%wood (ID6) 1550 915 LOI815 no H2S A0155 PO58+10%wood (ID6) 1550 915 LOI550 A0156 PO58+10%wood (ID6)
com
bust
ion
/ ash
gen
erat
ion
1550 915 LOI815 A0157 PO58 (ID1) cooled 1450 550 SEM-EDX A0190 PO58+10%cocoa (ID11) cooled 1450 825 SEM-EDX A0191 PO58+10%cocoa (ID11) uncooled 1450 550 SEM-EDX A0192 PO58+10%wood (ID6) uncooled 1450 550 SEM-EDX A0193 PO58+10%wood (ID6) de
posi
tion
cooled 1450 825 SEM-EDX A0195 PO58 (ID1) 1450 750 LOI815 A0198 PO58 (ID1) 1450 500 LOI815 A0202 PO58 (ID1)
combustion / coal reactivity 1450 250 LOI815
48 ECN-C--03-057

5. EXPERIMENTAL RESULTS
5.1 Burnout tests In Table C 5 an overview of experimental results from the burnout tests is given. Table C 5 Overview of burnout test results
ID material scale sample remarks LOI 550°C LOI 815°C Burnout
[%] ID25 bottom ash <75 µm 10.1 98.46 ID25 bottom ash <250>75 µm 23.1 95.90 ID25 bottom ash > 250 µm 27.0 94.95 ID26 bottom ash <75 µm 9.4 98.63 ID26 bottom ash <250>75 µm 18.9 96.91 ID26 bottom ash > 250 µm 34.0 98.63 ID25 cyclone ash 3.1 99.56 ID25 filter ash 3.5 99.50 ID25 fly ash collected @ 550°C 3.7 99.47 ID26 cyclone ash 4.4 99.39 ID26 filter ash 5.9 99.17 ID26 preheater ash 3.3 99.55 ID26
pilo
t-sc
ale
fly ash collected @ 550°C 4.8 99.33 fuel - ID1 exp. A0146 27.0 94.95 fuel - ID1 exp. A0148 11.4 fuel - ID6 exp. A0155 26.4 95.46 fuel - ID6 exp. A0156 24.3 fuel - ID11 exp. A0151 24.7 fuel - ID11
composite ash, τ~2.3 s
exp. A0152 37.6 92.02 fuel - ID1 comp. ash, τ~3.0 s exp. A0195 1.4 99.81 fuel - ID1 comp. ash, τ~1.7 s exp. A0198 21.4 96.28 fuel - ID1
lab-
scal
e
comp. ash, τ~0.6 s exp. A0202 70.1 68.01 fuel - ID1 1.1 99.84 ID5 50/50% mix ID 4
and 9 ash 1.3 99.82
ID7 full-
scal
e
fly ash 50/50% mix ID 6 and 11 ash
1.9 99.75
5.2 Fly ash quality tests The theoretical ash compositions, calculated as described in the previous paragraph, are presented in Figure C 5. This is followed by CCSEM-based ash analyses (Figure C 6) of samples obtained from various small- and large-scale installations in the project.
ECN-C--03-057 49

0.001
0.01
0.1
1
10
100
SO3 F ClSiO
2Al2O
3
Fe2O3
K2O CaO MgONa2
OP2O
5
Mn3O4
TiO2
CuOZnO
BaO Cd Co Mo Ni Pb Sb Se Sn V Hg
[% d
m]
PO58 (ID1)
PO58 + 10% cacao (ID11)
PO 58 +10% wood (ID6)
Figure C 5 Theoretical ash compositions
0.1
1
10
100
SO3 Cl SiO2 Al2O3 Fe2O3 K2O CaO MgO Na2O P2O5 TiO2 BaO Cr2O3
[% w
/w]
Borssele PO58 (ID1) fly ashLCS PO58 (ID1) ashLCS PO58+10% cacao (ID11) ashIVD PO58 (ID1) fly ashIVD PO58 (ID1) bottom ash
Figure C 6 Ash compositions as measured by CC-SEM In Table C 6, the fineness of the earlier-mentioned materials is reported – another one of the EN-450 test criteria. This was measured by dry (small samples) or wet sieving (full-scale samples; ethyl alcohol as a medium). Data for dry-sieved materials should be considered as minimum values; the actual result may be a few per cent points higher.
50 ECN-C--03-057

Table C 6 Ash quality compliance tests – fineness
fuel (ID) installation ash type fineness (<45µm dry) [m%]
lab-scale composite ash >38 full-scale fly ash 61
fly ash >59 PO58 (ID1) pilot scale bottom ash >28 lab-scale composite ash >33 PO58 + 10% cocoa (ID11) pilot-scale fly ash >58
PO58 + 10% wood (ID6) lab-scale composite ash >32
5.3 Ash deposition tests Results of the lab-scale ash deposition tests are presented in the Table C 8 and Figures C 15 through 20 in the Annex.
ECN-C--03-057 51

6. DISCUSSION
6.1 Burnout tests Effect of the installation scale As can be seen in Table C 5, the carbon conversion as based on the ash sample analysis, was high in all installations, provided that temperature and residence time were sufficient. Lab-scale tests yielded ash samples with a conversion levels up to near 100% burnout. In the LCS, ash is collected as a composite sample - i.e. contains also would-be bottom ash - which slightly biases the result. This can best be visualised by comparing data regarding samples from the IVD pilot-scale installation. Here, burnout of the ashes collected at different points vary significantly. For example coarse fraction of the bottom ash contains approximately 30 % of combustible carbon, while fly ash from the same run shows a tenfold lower level. Assuming that ECN composite samples consist of 10% bottom ash (with ~30% unburned C) and 90% fly ash (with approx. 4% combustibles), values which are common for the full-scale combustion installations, the resulting ash should show an LOI of 6.6%. Depending on the required accuracy, a correction may be desired to compensate for the underestimated burnout, although in many cases the prediction of a minimum burnout will suffice. Should a correction be necessary, two options are envisaged. Removing the coarse fraction (would-be bottom ash) from the ash sample, based on knowledge about the aerodynamic split between fly and bottom ash, is the first one. The required knowledge could be obtained from e.g. full-scale CFD calculations. The physical separation of the coarse fraction can be achieved by e.g. a cascade impactor. The second approach is to separate coarsely-ground biomass particles from the starting blend. As leaving them out would change the chemical composition of the fuel, these should be returned after grinding to a (much) smaller average size – well comparable with the mean particle size of the original coal-based mixture. This aproach, however, is not to be preferred when specific information on the burnout of relatively large biomass particles is required. Effect of the secondary fuel The results shown in Table C 5 for all the three installations show a decrease in the combustion efficiency when co-firing secondary fuel(s). This can be associated with the earlier reported worse grindability of the biomass, resulting in a larger average particle size. This results in incomplete conversion, as can be seen for example in Figure C 14 (Annex). Similar conclusions can be drawn by comparing full-scale ash with increasing secondary fuel shares in the feed. Although not alarmingly, the conversion is lower when co-firing 10%, when compared to 5% share, or without biomass at all. Effect of the residence time The lab-scale combustion tests have been performed as a function of fuel reaction (residence) time. As can be seen from the results in Table C 5 the levels of conversion which could be attained before the LCS was reconstructed are useful to evaluate the initial reactivity of a fuel (for burner studies). However they are much lower than for the samples collected at a residence times of 2-3 s, where the conversion is almost complete. This underlines the capabilities of the redesigned LCS, allowing for investigation of the overall combustion kinetics.
52 ECN-C--03-057
6.2 Fly ash quality tests LOI As described in the previous paragraph, the samples from the LCS show industrial levels of conversion, provided that sufficient reaction time is allowed. If necessary for improved accuracy, a correction can be made for the influence of bottom ash. The corrected result can then be used to evaluate a fuel against the criterion of less than 5% of unburned carbon in ash. Besides using the absolute LOI value for testing fly ash quality compliance, one may also use the LOI values for a relative comparison of fuels or fuel blends. From Table C 5 a distinct increase in the LOI is seen, when co-firing higher percentage of the secondary fuel(s). Chloride content The calculated, theoretical chloride contents for all the reported ashes were well below the allowed level of 1% (Figure C 5). Therefore no chlorine analyses were initially performed on the ashes. Nevertheless, as can be seen in Figure C 6, the highest chloride concentration measured by CCSEM in the case of the LCS-produced ash from the experiment with pure PO58 coal as the fuel approaches the 1% criterion. In addition to the semi-quantitative nature of the CCSEM analyses, the large difference in the theoretical and experimental data may be caused by different mechanics of the LCS system when compared with a full-scale installation. An even slight change in the gas/solid-phase partitioning of chlorine may result in a large increase of the chloride concentration. One of the factors influencing the said partitioning is the temperature at which the ash sample is collected. Although in the present round of tests this issue has not been given much attention it is recommended that in future experiments for this parameter to be in line with the ESP temperature of the full-scale installation of concern. Comparing the other reported data in Figure C 6, and the theoretical results presented in Figure C 5, one can conclude the secondary fuels applied in this study had no significant effect on the chloride contents of the resulting ashes mainly due to marginal Cl concentration in the used biomass. Sulphate content The levels of sulphates observed in the analysed samples were all below the maximum allowed value of 3 % and did not vary much within the set of the binary mixtures. This may be again simply ascribed to the limited sulphur contents of the biomass fuels when compared to the coal self. Cementitious properties NEN 450 standard also reports requirements as to the contents of free calcium oxide and reactive SiO2. Both analyses require fairly large volumes of materials (some 100 g per analysis) and therefore can not be performed on the lab- and pilot-scale samples. Nevertheless from the earlier studies and the theoretical calculations presented in Figure C 4 as well as the CCSEM results of Figure C 5, one can conclude that the contents of the reactive SiO2 is sufficient in the ashes and not significantly changed by the addition of the secondary fuel. In the case of calcium, one can speculate that the increased input of this element, by addition of wood, especially if at high levels, may cause the concentration of free CaO to exceed the allowed level of 2.5%. When looking at Figure C 6, a significant difference in the concentrations of CaO and SiO2 between the full-scale PO58 ash and those obtained from the tests on lab- and pilot-scale can be noticed. Especially the almost 10% concentration of CaO may rise concerns. Nevertheless, when analysing data presented in Table C 14 (Annex), it can be seen that most of the calcium in this particular sample, has been classified as Ca-Al-silicate and thus not as free lime. It can be concluded that the observed increase in the CaO concentration is simply an artefact of the chosen data presentation. Besides, the final Ca content of the fly ash is very sensitive to even slight changes in calcium concentration in the fuel, due to the enrichment. Further downstream the process the fly ash can by fractionated (for example in the ESP), leading again to an offset in the results, which underlines the importance of sampling technique, the exact location of the sampling point and
ECN-C--03-057 53

conditions. As yet the latter details have not been discussed in the project, thus making the evaluation of the obtained data rather speculative. The more so, taking into consideration the uncertainty as to the composition of the fuel used in Borssele test, and more precisely the presence and levels of paper sludge – a component very relevant for calcium content. Fineness and particle morphology As can be seen in Table C 6, fly ashes obtained from the pilot- and the full-scale operations consist for ca. 60% of particles smaller than 45 µm. The fineness of the IVD fly ashes from test with coal and coal/cocoa mixture do not show significant difference in fineness when compared to the coal-only ash from the full-scale power plant. However, keeping in mind the inaccuracy of sieving analyses performed on small samples, a careful conclusion can be drawn that the ashes resulting from fuels with the biomass admixture shown higher proportions of large particles. This trend was observed both in the pilot- and lab-scale experiments. In turn this means that the higher levels of secondary fuels may decrease the fineness to a point where the minimum value will not be achieved The addition of a secondary fuel also results in an altered morphology of the ashes. As can be seen in Figures C 9 and 10 in the Annex, the pilot-scale fly ash obtained from the experiment with coal/cocoa mixture contains relatively large particles, supposedly unburned biomass, which differ greatly in appearance and thus probably also in mechanical properties from the typical spherical particles of fly ash. Also cyclone and bottom ashes from the same test reveal an increased presence of large, spongy particles, similar as in the samples of the ash from lab-scale experiments. Upon close examination (compare Figures C 13 and 14), the particles were confirmed to be unburned biomass.
6.3 Ash deposition tests When looking at the SEM-micrographs of the deposits obtained in the ECN LCS installation, the obvious difference between the runs with and without biomass, keeping in mind that all the runs were performed at exactly the same conditions, is the varying degree of coating of the metal/ceramic substrate. Generally the latter increases when a biomass is added. Moreover, upon a closer inspection (Table C 8), also the deposit compositions seem to be changed. For example in the case of the coal/cocoa mixture the amount of potassium, as measured by scanning the surface of the deposit, increases sixfold in the case of the uncooled deposits, while the cooled ones show a doubling of the metals concentration. These changes in the potassium concentration can be traced back to the mineral particles characterised as illite (and other potassium-rich minerals) contents in the fuels, as has been presented in Table C 9. Moreover when analysing the CCSEM results summarised in Tables C 10 through 11 (fuels) and Table C 17 (ash), it can be concluded that especially the larger particles contain the increased levels of potassium. This is very relevant for near-burner slagging, as these bulky entities will easily get ‘trapped’ as soon as small proportions of slag are present, thus promoting the deposit growth, and this process could also be realistically mimicked in the LCS facility (compare Figures C 16 and 18). However, the LCS design does not allow for realistic demonstration of the fouling phenomena, at least with the applied fuels, containing large particles. Unlike in the full-scale superheater, bulky biomass particles get impacted on the surface of the substrate, while in the real-life situation they would most probably end up in the bottom ash. Otherwise, in an unlikely event of being entrained in the gas stream, they would not adhere to the superheater tubes surface, unless given the chance to fully react and become sticky. Such a scenario could possibly be simulated using fuels modified as described in previous section 6.1. A smaller average particle size should result in a higher burnout, thus exposing the ash contained in biomass. Also the quantification of the degree of coating should receive attention. At present this can only be assessed from the SEM micrograph. In future a new probe design, incorporating a sensitive surface/subsurface temperature measurement system, should enable quantification of
54 ECN-C--03-057
the refractory properties of the deposit, which in combination with a detailed SEM analysis could allow for a deep-going fouling risk assessment of fuels to be tested.
CONCLUSIONS
The addition of a binary biomass fuel to the original coal mixture has an important impact on chemical as well as physical (mechanical, aerodynamic etc) properties of both the fuel mixture and the resulting residues – ashes. The carbon conversion is adversely influenced, which can be explained by the presence of large, insufficiently pulverised biomass particles in the feed and which are incompletely combusted during the process. However, at the tested concentrations, which are still rather low, the secondary fuel had no significant effect on the LOI of the (full-scale) fly ash, which remained below the NEN-EN450 criterion of 5%. Upon modification of the LCS facility, leading to extended residence time in the range of approximately 3 second, even composite ash samples showed acceptable LOI values. Also chemical properties such as sulphates, chlorides and presumably CaO and SiO2 concentrations remained within the levels safe for the application of the fly ash in the cement industry. Nevertheless the presence of the said, large particles may have an influence on the mechanical properties of the ash, as these entities differ in morphology from the regular (molten, spherical) ash particles. Unfortunately these kind of applied parameters could not be tested with ashes from small-scale installations, simply because of the insufficient amounts of the materials. The biomass presence seems to result in an increased degree of deposit formation, especially on hot surfaces, simulating near-burner slagging. This could be generally traced back to the increased alkaline metals concentrations and that of potassium in particular, both in the feed as well as in the resulting ash. Also, the deposits showed increase in the size of the impacted particles, again suggesting the importance of the biomass poor grindability. Although the physical appearance of lab-scale ashes was different from those obtained from the pilot- and full-scale operations, the observed trends in combustion behaviour as well as crucial ash properties in all three installations were very consistent. This in turn means that the behaviour of pulverised coal/biomass fuel mixtures can be successfully tested on small scale and allows for identification and in part sensitivity assessment of the crucial process parameters.
ECN-C--03-057 55
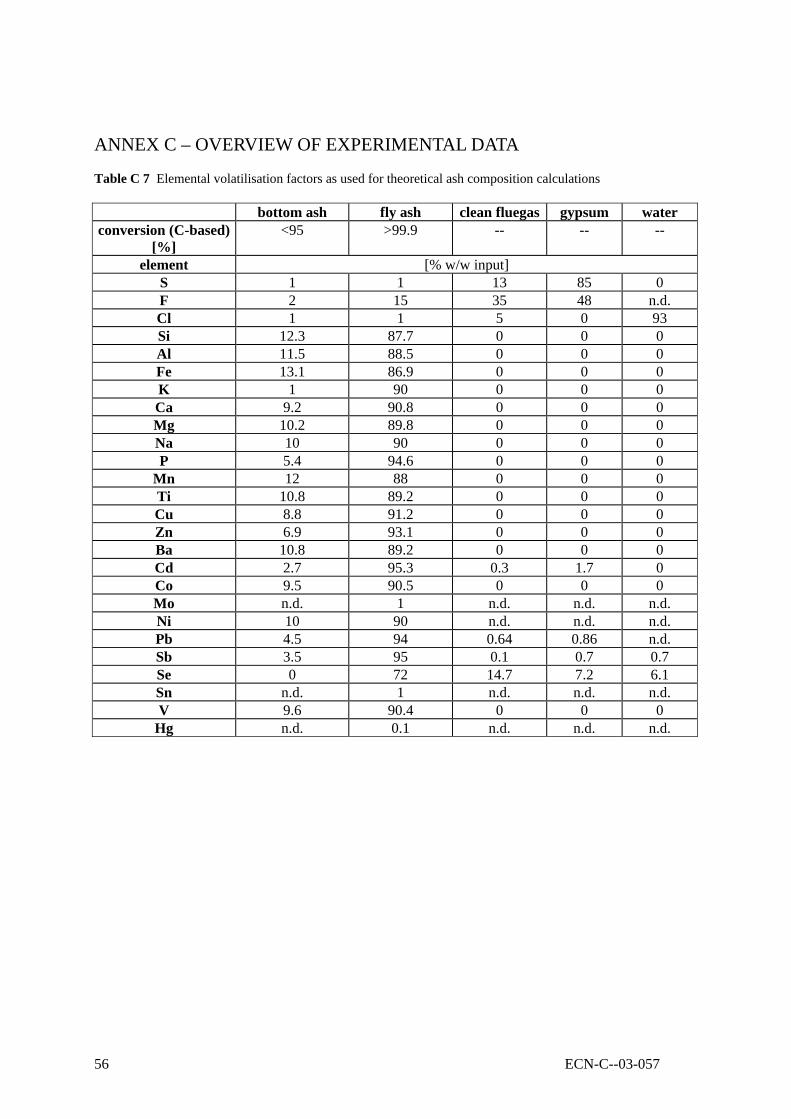
ANNEX C – OVERVIEW OF EXPERIMENTAL DATA
Table C 7 Elemental volatilisation factors as used for theoretical ash composition calculations
bottom ash fly ash clean fluegas gypsum water conversion (C-based)
[%] <95 >99.9 -- -- --
element [% w/w input] S 1 1 13 85 0 F 2 15 35 48 n.d. Cl 1 1 5 0 93 Si 12.3 87.7 0 0 0 Al 11.5 88.5 0 0 0 Fe 13.1 86.9 0 0 0 K 1 90 0 0 0 Ca 9.2 90.8 0 0 0 Mg 10.2 89.8 0 0 0 Na 10 90 0 0 0 P 5.4 94.6 0 0 0
Mn 12 88 0 0 0 Ti 10.8 89.2 0 0 0 Cu 8.8 91.2 0 0 0 Zn 6.9 93.1 0 0 0 Ba 10.8 89.2 0 0 0 Cd 2.7 95.3 0.3 1.7 0 Co 9.5 90.5 0 0 0 Mo n.d. 1 n.d. n.d. n.d. Ni 10 90 n.d. n.d. n.d. Pb 4.5 94 0.64 0.86 n.d. Sb 3.5 95 0.1 0.7 0.7 Se 0 72 14.7 7.2 6.1 Sn n.d. 1 n.d. n.d. n.d. V 9.6 90.4 0 0 0
Hg n.d. 0.1 n.d. n.d. n.d.
56 ECN-C--03-057

Table C 8 Overview of SEM-EDX analyses A normalised upon subtraction of Fe, Cu and Cr B normalised upon subtraction of Al and O
fuel
Sam
ple
desc
ript
ion
Ana
lysi
s de
scri
ptio
n
Figu
re n
o.
O Na Mg Al Si K Fe Ca S Ti P Cr Cu
scan 1 47.5 1.18 1.52 13.7 21.3 1.80 5.00 3.28 0.79 0.58 0.06 0.07 3.20scan 2 44.6 0.80 1.62 13.8 21.4 2.19 6.05 3.58 0.57 0.72 0.30 0.19 4.25PO58 average
7
46.0 0.99 1.57 13.7 21.3 1.99 5.52 3.43 0.68 0.65 0.18 0.13 3.72scan 1 51.7 0.56 1.34 12.1 17.5 3.75 4.99 3.91 0.91 0.79 0 0 2.53scan 2 48.7 0.99 1.39 12.4 18.8 3.41 5.75 2.91 0.89 0.77 0.29 0.15 3.59
PO58/10% cocoa IV
D c
yclo
ne
ash
average
8
50.2 0.77 1.36 12.2 18.1 3.58 5.37 3.41 0.90 0.78 0.14 0.07 3.06scan 1 48.5 1.05 1.21 13.7 20.7 1.89 6.54 3.59 0.51 0.33 0.18 0 1.75scan 2 46.8 0.88 1.35 13.2 20.4 2.13 6.20 3.25 0.60 0.95 0.23 0 3.77PO58 average
9
47.6 0.96 1.28 13.4 20.5 2.01 5.87 3.42 0.55 0.64 0.20 0 2.76scan 1 46.0 0.71 1.67 13.1 19.6 4.36 5.07 3.52 1.00 0.91 0.55 0.40 3.07scan 2 50.1 0.43 1.58 12.1 18.1 3.95 5.39 3.20 1.08 0.68 0.39 0.18 2.79
PO58/10% cocoa
IVD
flya
sh
average
10
48.0 0.57 1.62 12.6 18.8 4.15 5.23 3.36 1.04 0.79 0.47 0.29 2.93scan 1 47.2 0.51 0.72 10.5 18.0 1.83 5.72 3.67 0.86 5.37 0.08 0.25 4.29scan 2 46.0 0.48 1.03 11.3 18.4 2.24 7.17 2.57 1.17 4.83 0 0.13 4.61PO58 average
11
46.6 0.49 0.87 10.9 18.2 2.03 6.44 3.12 1.01 5.1 0.04 0.19 4.45scan 1 46.6 0.62 2.61 9.64 16.6 6.74 7.22 2.71 1.58 1.43 0.97 0 3.20scan 2 47.4 0 1.64 9.35 17.6 6.33 7.05 2.70 1.45 1.42 0.87 0 4.26
PO58/10% cocoa
IVD
bot
tom
as
h
average
12
47.0 0.31 2.12 9.49 17.1 6.53 7.13 2.70 1.15 1.42 0.92 0 3.73SS scan A 15 46.3 1.52 1.45 16.3 20.7 1.79 - 2.05 2.03 n.d. n.d. n.d. n.d.
PO58 Al2O3 scan B 16 - 0.11 1.26 - 13.5 0.77 14.6 1.26 0.44 0.23 1.81 0 n.d.
SS scan A 17 47.5 0 1.93 15.9 22.3 2.39 - 5.18 n.d. 0.96 0 - - PO58/10% wood Al2O3 scan B 18 - 2.95 2.32 - 42.0 n.d 32.1 2.27 0.45 1.55 1.45 n.d 4.9
SS scan A 19 18.7 0 1.25 27.9 36.9 4.18 - 5.42 3.97 n.d. 0.46 - - PO58/10% cocoa
depo
sits
Al2O3 scan B 20 4.54 4.92 - 58.1 9.94 6.54 8.31 0.83 2.77 1.56 n.d. 0.42
ECN-C--03-057 57
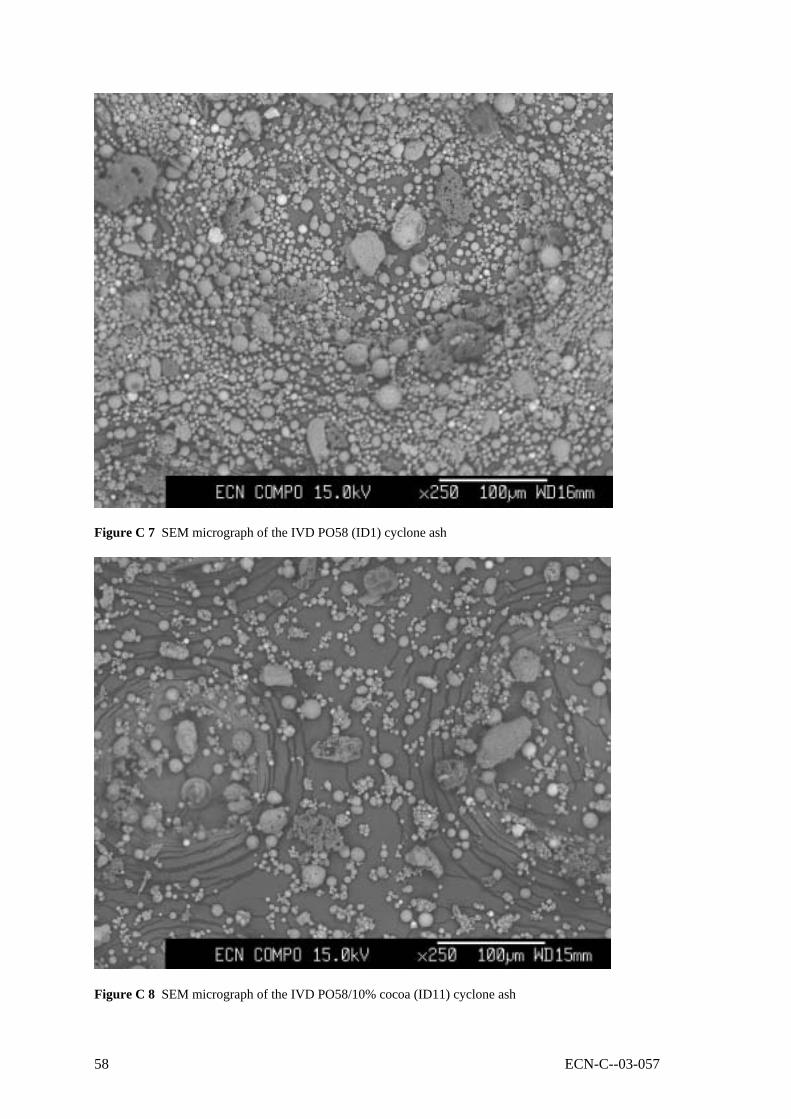
Figure C 7 SEM micrograph of the IVD PO58 (ID1) cyclone ash
Figure C 8 SEM micrograph of the IVD PO58/10% cocoa (ID11) cyclone ash
58 ECN-C--03-057

Figure C 9 SEM micrograph of the IVD PO58 (ID1) fly ash
Figure C 10 SEM micrograph of the IVD PO58/10% cocoa (ID11) fly ash
ECN-C--03-057 59
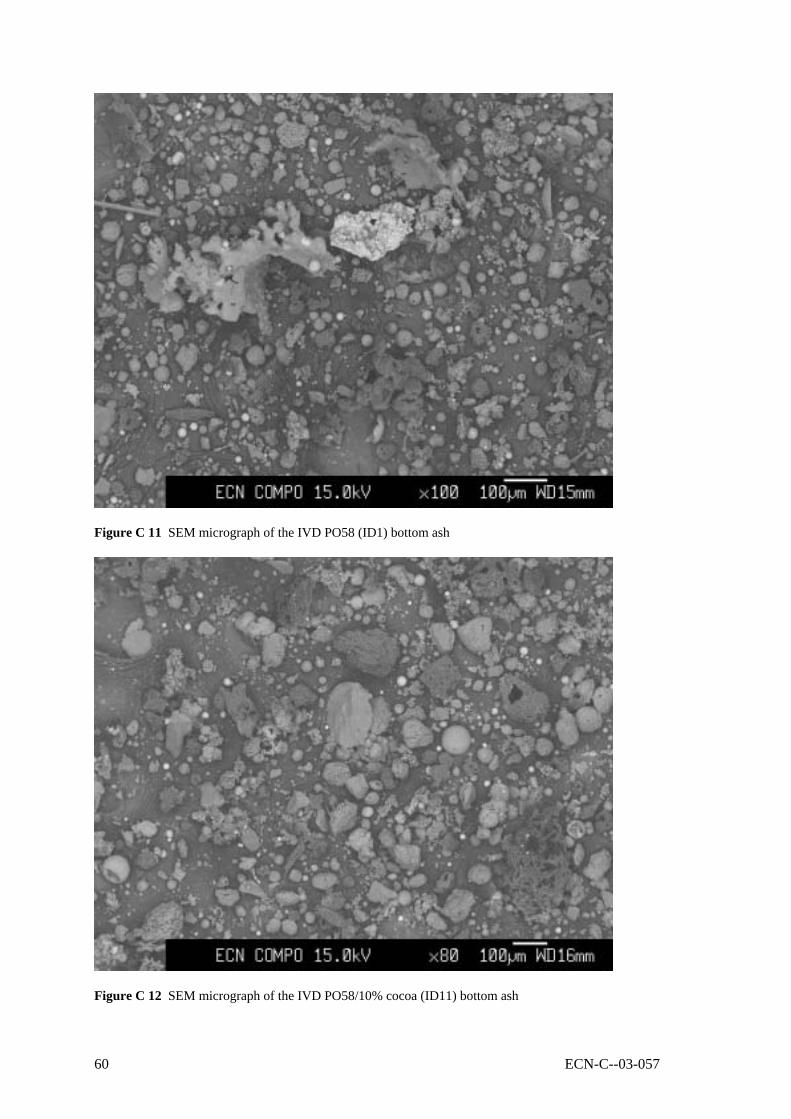
Figure C 11 SEM micrograph of the IVD PO58 (ID1) bottom ash
Figure C 12 SEM micrograph of the IVD PO58/10% cocoa (ID11) bottom ash
60 ECN-C--03-057

Figure C 13 SEM micrograph of the LCS PO58/10% wood (ID6) ash
Figure C 14 SEM micrograph of the LCS PO58/10% wood (ID6) ash – unburned wood particles
ECN-C--03-057 61

Figure C 15 SEM micrograph of the ECN PO58 (ID1) ash deposit on a cooled alloy X20 substrate
Figure C 16 SEM micrograph of the ECN PO58 (ID1) ash deposit on an uncooled Alsint substrate
62 ECN-C--03-057

Figure C 17 SEM micrograph of the ECN PO58/10% wood (ID6) ash deposit on a cooled alloy X20
substrate
Figure C 18 SEM micrograph of the ECN PO58/10% wood (ID6) ash deposit on an uncooled Alsint
substrate
ECN-C--03-057 63

Figure C 19 SEM micrograph of the ECN PO58/10% cocoa (ID11) ash deposit on a cooled alloy X20
substrate
Figure C 20 SEM micrograph of the ECN PO58/10% cocoa (ID11) ash deposit on an uncooled Alsint
substrate
64 ECN-C--03-057

Table C 9 Summary of CCSEM data on mineral matter distribution in fuels.
Material Mineral ID1 ID6 ID11 ID18
Alumina 1.05% - - 0.02%
Aluminosilicate 6.02% 2.18% 2.92% -
Ankerite 0.11% 10.25% 1.63% 0.95%
Apatite - 0.09% 0.14% -
Barite - - - -
Ca-Al Silicate 0.01% 0.26% - 0.34%
Ca-Mg Silicate - - 0.29% 0.16%
Ca-Al-P - - - -
Cr-Fe oxide - - - 0.01%
Ca-rich - - - -
Dolomite 6.23% 7.41% 7.91% -
Fe Silicate 0.03% - 0.70% 0.01%
Fe-Al Silicate 3.36% 1.38% 5.57% -
Fe-Cr oxide 2.30% 2.30% 1.34% 0.24%
Gypsum - - - 0.09%
Gypsum/Al Silicate - - - 0.01%
Iron Oxide 9.50% 2.35% 2.29% 72.13%
K-Al Silicate (illite) 18.46% 23.86% 35.08% 0.29%
Kaolinite 4.86% 4.05% 7.98% -
KCl - - - -
Mixed Silicate 1.76% 4.25% 2.47% -
Montmorillonite 3.91% 1.00% 0.49% -
Na-Al Silicate 1.13% 2.27% 0.51% -
Oxidised Pyrrothite - - 0.67% -
Pyrrhotite 15.10% 15.23% 4.37% 0.24%
Quartz 14.52% 11.82% 6.61% 4.02%
Rutile - - 0.01% 0.16%
Si-rich 0.33% 0.42% 1.22% -
Unknown 11.32% 10.88% 17.80% 21.34%
ECN-C--03-057 65

Table C 10 Mineral matter distribution of PO58 (ID1) in the function of particle size
Size bin [micron] Mineral 2-4 4-8 8-16 16-32 32-64 64-128
Overall
Aluminosilicate 0.7% 2.5% 1.2% - 2.7% - 1.05%
Ankerite 1.8% 1.9% 3.1% 3.5% 1.6% 10.9% 6.02%
Apatite 0.9% 0.9% 0.2% - - - 0.11%
Ca-Al Silicate 0.2% - - - - - 0.01%
Dolomite 3.4% 4.6% 3.1% 1.4% 11.9% 4.7% 6.23%
Fe Silicate - - 0.3% - - - 0.03%
Fe-Al Silicate 11.9% 6.4% 2.0% 3.2% - 4.7% 3.36%
Fe-Cr oxide 0.7% 1.6% 4.5% 5.4% 4.5% - 2.30%
Iron Oxide 1.0% 0.8% 9.6% 11.3% 13.6% 8.4% 9.50%
K-Al Silicate
(illite) 21.3% 21.1% 22.1% 23.1% 19.7% 15.4% 18.46%
Kaolinite 16.4% 21.5% 17.5% 5.0% 3.2% - 4.86%
Mixed Silicate 6.9% 8.1% 5.2% - 1.9% - 1.76%
Montmorillonite 3.9% 3.7% 4.5% - 4.3% 4.4% 3.91%
Na-Al Silicate 1.0% 1.4% 1.1% 0.5% 3.1% - 1.13%
Pyrrhotite 1.4% 1.9% 8.2% 22.4% 7.2% 22.9% 15.10%
Quartz 7.0% 9.9% 6.4% 11.3% 18.7% 15.5% 14.52%
Si-rich 0.8% 0.2% - - 1.0% - 0.33%
Unknown 20.5% 13.3% 10.9% 12.9% 6.5% 13.1% 11.32%
66 ECN-C--03-057
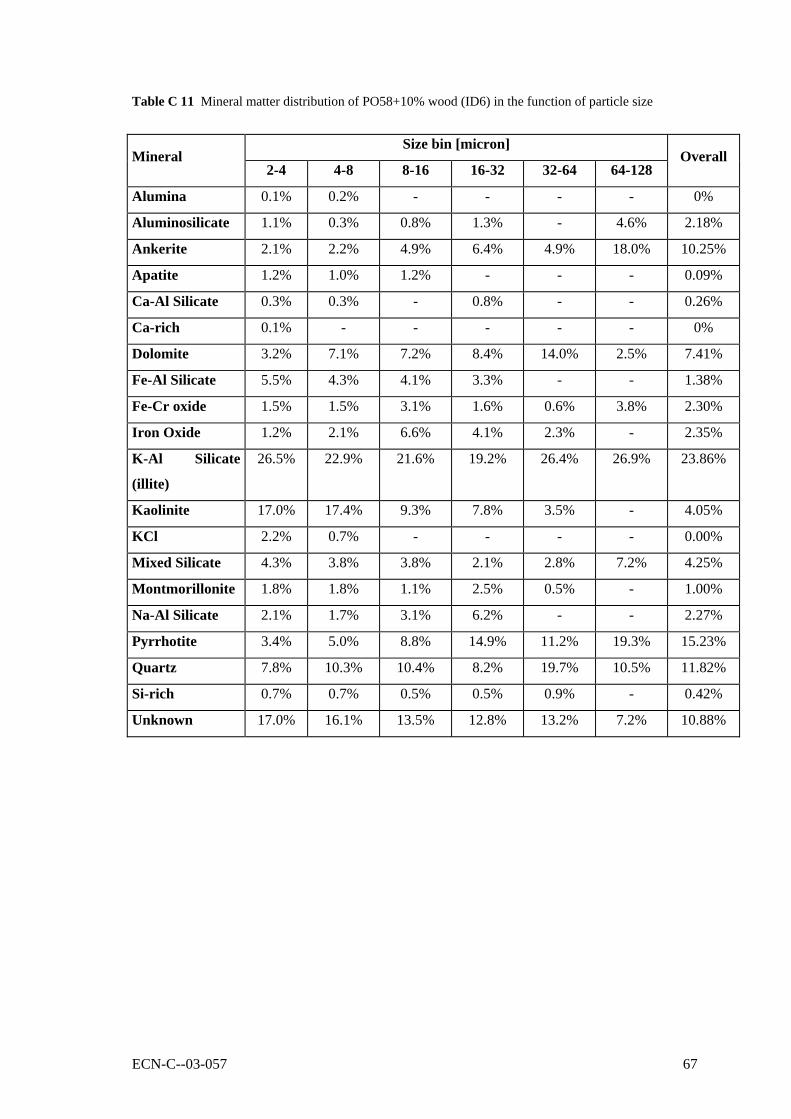
Table C 11 Mineral matter distribution of PO58+10% wood (ID6) in the function of particle size
Size bin [micron] Mineral
2-4 4-8 8-16 16-32 32-64 64-128 Overall
Alumina 0.1% 0.2% - - - - 0%
Aluminosilicate 1.1% 0.3% 0.8% 1.3% - 4.6% 2.18%
Ankerite 2.1% 2.2% 4.9% 6.4% 4.9% 18.0% 10.25%
Apatite 1.2% 1.0% 1.2% - - - 0.09%
Ca-Al Silicate 0.3% 0.3% - 0.8% - - 0.26%
Ca-rich 0.1% - - - - - 0%
Dolomite 3.2% 7.1% 7.2% 8.4% 14.0% 2.5% 7.41%
Fe-Al Silicate 5.5% 4.3% 4.1% 3.3% - - 1.38%
Fe-Cr oxide 1.5% 1.5% 3.1% 1.6% 0.6% 3.8% 2.30%
Iron Oxide 1.2% 2.1% 6.6% 4.1% 2.3% - 2.35%
K-Al Silicate
(illite)
26.5% 22.9% 21.6% 19.2% 26.4% 26.9% 23.86%
Kaolinite 17.0% 17.4% 9.3% 7.8% 3.5% - 4.05%
KCl 2.2% 0.7% - - - - 0.00%
Mixed Silicate 4.3% 3.8% 3.8% 2.1% 2.8% 7.2% 4.25%
Montmorillonite 1.8% 1.8% 1.1% 2.5% 0.5% - 1.00%
Na-Al Silicate 2.1% 1.7% 3.1% 6.2% - - 2.27%
Pyrrhotite 3.4% 5.0% 8.8% 14.9% 11.2% 19.3% 15.23%
Quartz 7.8% 10.3% 10.4% 8.2% 19.7% 10.5% 11.82%
Si-rich 0.7% 0.7% 0.5% 0.5% 0.9% - 0.42%
Unknown 17.0% 16.1% 13.5% 12.8% 13.2% 7.2% 10.88%
ECN-C--03-057 67

Table C 12 Mineral matter distribution of PO58+10% cocoa (ID11) in the function of particle size
Size bin [micron] Mineral
2-4 4-8 8-16 16-32 32-64 64-128 Overall
Aluminosilicate 0.7% - 3.0% 1.4% 3.0% 3.3% 2.92%
Ankerite 4.2% 5.2% 2.4% - 2.7% - 1.63%
Apatite 1.6% 1.7% 0.8% 1.3% - - 0.14%
Ca-Mg Silicate - - - - 0.5% - 0.29%
Dolomite 2.4% 3.3% 8.7% 8.0% 8.4% 6.9% 7.91%
Fe Silicate - - - - 1.2% - 0.70%
Fe-Al Silicate 5.3% 4.8% 2.5% 5.2% 2.4% 12.0% 5.57%
Fe-Cr oxide 10.1% 9.7% 4.0% 0.5% 2.0% - 1.34%
Iron Oxide 18.1% 16.5% 3.4% 3.8% 3.1% - 2.29%
K-Al Silicate
(illite)
9.0% 6.3% 21.1% 23.2% 32.3% 45.0% 35.08%
Kaolinite 6.5% 3.9% 5.3% 9.2% 8.1% 7.7% 7.98%
Mixed Silicate 2.3% 0.8% 2.1% 2.7% 3.7% - 2.47%
Montmorillonite 0.1% - 0.9% - 0.8% - 0.49%
Na-Al Silicate 0.4% - - 1.6% 0.6% - 0.51%
Oxidised
Pyrrothite
- - - - 1.1% - 0.67%
Pyrrhotite 21.2% 33.4% 10.5% 3.3% 6.4% - 4.37%
Quartz 5.2% 1.9% 9.9% 7.9% 7.7% 4.0% 6.61%
Rutile 2.6% 2.1% - - - - 0.01%
Si-rich 0.4% 0.6% 0.9% - 0.2% 3.5% 1.22%
Unknown 9.1% 9.0% 24.2% 32.0% 15.7% 17.6% 17.80%
68 ECN-C--03-057

Table C 13 Mineral matter distribution of RWE brown coal (ID18) in the function of particle size
Size bin [micron] Mineral
2-4 4-8 8-16 16-32 32-64 64-128 Overall
Alumina 2.1% - - - - - 0.02%
Apatite 2.6% 1.3% 2.5% 4.7% - - 0.95%
Ca-Mg Silicate - - - - 0.8% - 0.34%
Ca-Si rich - - 2.5% - - - 0.16%
Cr-Fe oxide 0.6% - - - - - 0.01%
Fe Silicate 0.8% - - - - - 0.01%
Fe-Cr oxide 1.1% - 3.6% - - - 0.24%
Gypsum - - 1.4% - - - 0.09%
Gypsum/Al
Silicate
1.3% - - - - - 0.01%
Iron Oxide 21.6% 56.5% 36.4% 74.9% 82.5% 68.2% 72.13%
K-Al Silicate
(illite)
- - 0.8% 1.5% - - 0.29%
Pyrrhotite - - - 1.6% - - 0.24%
Quartz 2.2% 0.6% 1.1% 6.8% 7.2% - 4.02%
Rutile 0.8% 1.1% 2.0% - - - 0.16%
Unknown 66.9% 40.6% 49.6% 10.5% 9.5% 31.8% 21.34%
ECN-C--03-057 69

Table C 14 Mineral matter distribution of full-scale PO58 (ID1) fly ash
Size bin [micron] Mineral
2-4 4-8 8-16 16-32 32-64 64-125 Overall
Quartz 0.03% 0.02% 0.13% 0.21% - - 0.39%
Iron Oxide 0.03% - 0.61% 2.20% 4.36% 6.09% 13.30%
Alumina 0.02% 0.06% - - 1.88% 3.76% 5.72%
Dolomite - - 0.04% 0.02% 0.17% - 0.22%
Ankerite - - 0.01% 0.08% 0.17% - 0.26%
Kaolinite 0.12% 0.07% 0.70% 2.16% 0.13% - 3.17%
Montmorillonite - - 0.38% 1.10% 0.83% - 2.31%
Illite 0.01% - 0.65% 1.69% 0.93% - 3.28%
Fe-Al Silicate 0.02% 0.08% 0.18% 0.94% 4.72% 4.06% 10.00%
Ca-Al Silicate 0.01% 0.06% 0.61% 2.42% 11.38% 10.84% 25.32%
Aluminosilicate 0.02% 0.01% 0.05% 0.20% - - 0.27%
Mixed Silicate - - 0.26% 1.10% 0.86% 1.36% 3.58%
Fe Silicate - - - - - 0.76% 0.76%
Fe-Cr Oxide 0.01% - 0.14% 0.39% 1.42% 0.51% 2.47%
Apatite - - 0.03% - 0.20% - 0.24%
Unknown 0.02% 0.06% 0.76% 2.38% 14.09% 10.94% 28.25%
70 ECN-C--03-057

Table C 15 Mineral matter distribution of lab-scale PO58 (ID1) ash
Size bin [micron] Mineral
16-32 32-64 64-125 Overall
Quartz 0.03% 4.20% 22.79% 27.03%
Iron Oxide 0.02% 2.52% 5.77% 8.32%
Alumina - 0.15% - 0.15%
Dolomite 0.11% 2.98% 1.58% 4.67%
Ankerite - 0.16% 0.17% 0.33%
Kaolinite 0.09% 8.00% 7.99% 16.07%
Montmorillonite 0.01% 4.76% 4.96% 9.74%
Illite 0.04% 6.16% 3.28% 9.48%
Fe-Al Silicate 0.01% 2.08% 6.06% 8.15%
Ca-Al Silicate 0.02% 0.84% 0.11% 0.97%
Na-Al Silicate - 0.24% 0.26% 0.50%
Aluminosilicate 0.01% 0.40% 1.97% 2.38%
Mixed Silicate - 0.76% 0.35% 1.11%
Pyrite - 0.15% - 0.15%
Fe-Cr Oxide - 0.08% 0.29% 0.37%
Si-rich 0.01% 0.17% 0.23% 0.42%
Unknown 0.08% 3.81% 6.17% 10.06%
ECN-C--03-057 71

Table C 16 Mineral matter distribution of pilot-scale PO58 (ID1) fly ash
Size bin [micron] Mineral
2-4 4-8 8-16 16-32 Overall
Quartz 0.43% 1.37% 0.85% 0.53% 3.18%
Iron Oxide 0.05% 0.14% - - 0.19%
Alumina 0.37% 0.06% 0.18% - 0.61%
Dolomite 0.05% 0.98% 1.16% 0.23% 2.42%
Kaolinite 6.24% 8.22% 16.60% 4.58% 35.64%
Montmorillonite 1.09% 2.39% 6.66% 3.27% 13.41%
Illite 1.61% 3.57% 5.32% 5.56% 16.06%
Fe-Al Silicate 0.93% 2.50% 1.52% 0.12% 5.07%
Ca-Al Silicate 0.91% 0.96% 1.72% 0.35% 3.94%
Na-Al Silicate 0.40% 1.26% 0.51% 0.28% 2.45%
Aluminosilicate 0.41% 0.41% 0.67% - 1.49%
Mixed Silicate 0.67% 0.87% 0.54% 0.70% 2.78%
Apatite 0.06% 0.37% 0.09% 0.10% 0.62%
Si-rich 0.07% 0.03% 0.07% - 0.17%
Unknown 2.56% 6.20% 2.39% 0.39% 11.54%
72 ECN-C--03-057

Table C 17 Mineral matter distribution of lab-scale PO58/10% cocoa (ID11) ash
Size bin [micron] Mineral
8-16 16-32 32-64 64-125 Overall
Quartz 0.05% 0.16% 0.68% 0.85% 1.74%
Iron Oxide 0.03% 0.35% 0.17% - 0.54%
Dolomite 0.01% 0.11% 0.21% - 0.33%
Kaolinite 0.54% 2.67% 9.81% 10.36% 23.39%
Montmorillonite 0.25% 2.05% 6.88% 17.38% 26.55%
Illite 0.39% 2.66% 7.05% 15.02% 25.13%
Fe-Al Silicate 0.07% 0.69% 2.24% 4.06% 7.07%
Ca-Al Silicate 0.04% 0.22% 0.45% 0.12% 0.83%
Na-Al Silicate 0.07% 0.26% 0.33% 0.25% 0.91%
Aluminosilicate 0.05% 0.34% 0.61% 1.16% 2.15%
Mixed Silicate 0.08% 0.34% 1.19% 0.40% 2.00%
Fe-Cr Oxide 0.02% 0.12% 0.02% 0.22% 0.38%
Gypsum 0.01% 0.03% 0.14% - 0.18%
Si-rich 0.00% 0.01% 0.11% - 0.12%
Unknown 0.20% 1.37% 3.51% 3.35% 8.43%
ECN-C--03-057 73