ftsz from escherichia coli, azotobacter vinelandii, and ...s/ftsz tm az ec.pdf · ftsz from...
TRANSCRIPT

FtsZ From Escherichia coli, Azotobactervinelandii, and Thermotoga
maritima—Quantitation,GTP Hydrolysis, and Assembly
Chunlin Lu, Jesse Stricker, and Harold P. Erickson*
Department of Cell Biology, Duke University Medical Center,Durham, North Carolina
We have cloned theftsZ genes fromThermotoga maritimaand Azotobactervinelandii and expressed the proteins (TmFtsZ and AzFtsZ) inEscherichia coli.We compared these proteins toE. coli FtsZ (EcFtsZ), and found that severalremarkable features of their GTPase activities were similar for all three species,implying that these characteristics may be universal among FtsZs. Using acalibrated protein assay, we found that all three FtsZs bound 1 mole guaninenucleotide per mole FtsZ and hydrolyzed GTP at high rates (.2 GTP per FtsZ permin). All three required magnesium and a monovalent cation for GTP hydrolysis.Previous reports showed that EcFtsZ (and some other species) required potassium.We confirmed this specificity for EcFtsZ but found that potassium and sodium bothworked for Az- and TmFtsZ. Specific GTPase activity had a striking dependenceon FtsZ concentration: activity (per FtsZ molecule) was absent or low below 50µg/ml, rose steeply from 50 to 300 µg/ml and plateaued at a constant high valueabove 300 µg/ml. This finding suggests that the active state requires a polymer thatis assembled cooperatively at 50–300 µg/ml. A good candidate for the activepolymer was visualized by negative stain electron microscopy—straight protofila-ments and protofilament pairs were seen under all conditions with active GTPase.We suggest that the GTP hydrolysis of FtsZ may be coupled to assembly, as it is fortubulin, with hydrolysis occurring shortly after an FtsZ monomer associates onto aprotofilament end. As a part of this study, we determined the concentration ofEcFtsZ and TmFtsZ by quantitative amino acid analysis and used this tostandardize the bicinchonic acid colorimetric assay. This is the first accuratedetermination of FtsZ concentration. Using this standard and quantitative Westernblotting, we determined that the averageE. coli cell has 15,000 molecules of FtsZ,at a concentration of 400 µg/ml. This is just above the plateau for full GTPaseactivity in vitro. CellMotil. Cytoskeleton 40:71-86, 1998.r 1998 Wiley-Liss, Inc.
Key words: tubulin; dynamic instability; nucleation; cell division; bicinchonic acid; quantitative Westernblotting
INTRODUCTION
The bacterial cell division protein FtsZ has beenfound in more than three dozen prokaryotic species,including archaebacteria, and in chloroplasts [Erickson,1997]. It is a major cytoskeletal protein of bacteria,forming a ring that constricts at the site of septation[Addinall et al., 1996; Ma et al., 1996]. FtsZ is ahomologue of tubulin, as demonstrated first by sequence
Contract grant sponsor: National Institutes of Health; Contract grantnumber: GM28553
*Correspondence to: Harold P. Erickson, Department of Cell Biology,Duke University Medical Center, Durham, NC 27710;E-mail: [email protected]
Received 26 November 1997; accepted 21 January 1998
Cell Motility and the Cytoskeleton 40:71–86 (1998)
r 1998 Wiley-Liss, Inc.

alignment [Mukherjee and Lutkenhaus, 1994], and re-cently confirmed by the close similarity of the atomicstructures [Lo¨we and Amos, 1998; Nogales et al., 1998].The homology is functional as well, asEscherichia coliFtsZ (EcFtsZ) can assemble in vitro into protofilamentsheets with a lattice similar to that of the microtubulewall [Erickson et al., 1996]. FtsZ protofilaments can alsoadopt a sharply curved conformation, forming miniringsvery similar to tubulin rings [Erickson et al., 1996;Erickson and Stoffler, 1996]. The structural homology ofFtsZ and tubulin polymers suggests that the cytoskeletalfunction of these proteins has been conserved frombacterial FtsZ to eukaryotic tubulins [Erickson et al.,1996; Erickson, 1997].
Both tubulin and FtsZ bind and hydrolyze GTP. TheGTPase activity of tubulin is tightly coupled to assembly.In the absence of assembly the rate of hydrolysis is verylow, but after a subunit enters the microtubule lattice itsbound GTP is rapidly hydrolyzed [O’Brien et al., 1987].EcFtsZ purified from overexpression in bacteria hasdemonstrated a very high level of GTPase [RayChaud-huri and Park, 1992; de Boer et al., 1992; Mukherjee etal., 1993].
In the present study we have reinvestigated andextended the characterization of the GTPase of EcFtsZ.As a part of this study, we have calibrated the assay forFtsZ protein concentration and determined the concentra-tion in E. coli. In addition, we have cloned theftsZgenesfrom Azotobacter vinelandiiand Thermotoga maritima,expressed these proteins inE. coli (AzFtsZ and TmFtsZ),and compared the GTPase and polymer state of the FtsZfrom the three species.
METHODS
Cloning AzFtsZ and TmFtsZ
Two degenerate oligonucleotide primers were de-signed based on the most highly conserved regions,NTDNQA and GGGTGTG of the N-terminal portion ofFtsZ (forward primer, 58-AA(A/T)AC(G/A/T/C)GA(C/T)-GC(G/A/T/C)CA(A/G)GC-38 reverse primer, 58-GT(G/A/T/C)CC(G/A/T/C)GT(G/A/T/C)CC(G/A/T/C)CC(G/A/T/C)CC-38). Genomic DNAfromThermotoga maritimawasgenerously provided by Dr. Michael Adams (Universityof Georgia, Athens, GA). Polymerase chain reaction(PCR) products were separated on an agarose gel, andfragments in the range of 200–500 base pairs (bp) wereisolated and cloned. A 350-bp fragment was identifiedthat showed significant homology toftsZof other species.
Thermotogagenomic DNA was cut withEcoRI andcircularized, and inverse PCR was performed as de-scribed by Ochman and Hartl [1988] with erratic buteventually successful results. Each attempt at inversePCR gave many clones with unrelated sequence, but
some showed homology toftsZof other species, extend-ing the sequence in the 58 and 38 directions. New primerswere designed near the limits of these extended se-quences, and the inverse PCR was repeated. Sequenceswere eventually found that extended past the initiationand stop codons, as judged by homology withftsZsequences of other species. The final sequence wasobtained from the pET-FtsZ plasmid (described below),which was produced with a single PCR reaction fromgenomic DNA using the error-correcting Pfu polymerase.
The same PCR primers were used to amplifygenomic DNA of Azotobacter vinelandii(strain CA,provided by Dr. Paul E. Bishop, North Carolina StateUniversity, Raleigh). A 350-bp PCR product was thenused to screen a cosmid library, provided by Dr. LiminZhang (Virginia Polytechnic Institute, Blacksburg, VA).A positive cosmid was identified and digested byEcoRI.A ,7-kbp fragment that hybridized with the PCR probewas gel-purified and subcloned into the SuperCos 1cosmid vector (Stratagene, LaJolla, CA). TheftsZgene wassequenced in both directions starting from the region identi-fied by PCR, and the full-lengthftsZwas obtained as judgedby comparison to theftsZsequences of other species.
Construction of Recombinant Expression Vectorfor TmFtsZ and AzFtsZ
Once we had identified the initiation and stopsequences ofThermotoga ftsZ, we designed primers toamplify the full-length coding sequence, adding anNdeIsite at the 58 end and aBamHI sequence at the 38 end.PCR amplification used 2.5 units of Pfu DNA polymerase(Stratagene, LaJolla, CA) in a 50-µl reaction mixturecontaining 0.2 mM dNTP, 1 µM primers, 0.5 µgThermo-toga genomic DNA and the buffer recommended byStratagene. The predicted 1,070-bp fragment was isolatedfrom an agarose gel, digested withNdeI and BamHI at37°C for 24 h, gel purified again, and then ligated intoNdeI and BamHI sites of expression vector pET-11b(Novagen, Madison, WI). Both strands of the resultingrecombinant vector pET-TmFtsZ were sequenced fromthe syntheticNdeI site through theBamHI site to determinethe final version of theThermotoga ftsZsequence.
The same procedure was used to produce a pET-11expression vector for AzFtsZ. The pET expression plas-mid for EcFtsZ was provided by Dr. David Bramhill,Merck [Bramhill and Thompson, 1994] and was alsoduplicated in our laboratory.
Expression and Purification of Ec-, Az-,and TmFtsZ
EcFtsZ, AzFtsZ, and TmFtsZ were successfullyoverproduced inE. coli strain BL21(DE3) transformedwith pET-11 expression vectors containing the codingregion of the three genes. Cultures for all three were
72 Lu et al.

grown in LB medium at 37°C to A600 ,1.2 and inducedby adding 0.25–0.5 mM IPTG. We also induced somecultures at A600 ,0.7 and found a slightly lower yield ofFtsZ. The protein appeared identical at the two levels ofexpression; in particular the ratio of protein precipitatedat 20% and 25% ammonium sulfate (see below). After a3-h induction, bacteria from a 1-L culture were centri-fuged and suspended in 20 ml resuspension buffer (0.05M Tris, 0.1 M NaCl, 1 mM EDTA, 1 mM PMSF, pH 8.0).Lysozyme was added to 0.4 mg/ml, and the mix wasincubated on ice for 2 h; MgCl2 was added to 5 mM andthe sample was frozen overnight at220°C. The bacteriawere thawed and sonicated twice for 30 s on ice. DNase Iwas added to 10 µg/ml and incubated 60 min at 4°C. Cellwalls and insoluble debris was removed by centrifuga-tion. All three FtsZ proteins were soluble inE. colicytoplasm, and represented more than one-half of thetotal soluble protein.
In earlier preparations of FtsZ, we added TritonX-100 to 1% after 30 min with lysozyme, continuedagitation for 5 min and froze the mixture. However, thetriton caused the ammonium sulfate precipitate to par-tially float when centrifuged, instead of forming a com-pact pellet. This was a problem especially for TmFtsZwhose precipitation required higher ammonium sulfate.We have subsequently eliminated Triton from the lysisbuffer and have found that freezing and sonicationefficiently lyses the bacteria.
After centrifuging the lysed bacteria, EcFtsZ wasprecipitated from the bacterial supernatant with ammo-nium sulfate. Initially we used 20% saturated ammoniumsulfate, which precipitated virtually all the FtsZ andalmost no bacterial proteins in the presence of 1% Triton.After eliminating Triton we found that less than one-halfof the EcFtsZ was precipitated at 20% saturated ammo-nium sulfate, and it had a substantially lower GTPaseactivity than protein precipitated at 25%. We then modi-fied our purification protocol. We first did a cut at 20%saturated ammonium sulfate, discarding the pellet (about30–40% of the FtsZ). We then precipitated the remainingEcFtsZ by raising the ammonium sulfate to 25% satura-tion. The pellet was resuspended in one-half the originalvolume of resuspension buffer supplemented with 10 mMMg and re-precipitated with 25% saturated ammoniumsulfate. At this stage, EcFtsZ appeared pure on sodiumdodecyl sulfate-polyacrylamide gel electrophoresis (SDS-PAGE), and we found that ion-exchange chromatographyon DEAE Sephacel or mono-Q did not result in anyapparent increase in purity. For the experiments reportedin this paper, EcFtsZ was prepared by the 20–25%ammonium sulfate precipitation, with no additional steps.
TmFtsZ required 38% saturated ammonium sulfatefor precipitation, and many host proteins were pelleted
with it. To separate contaminating proteins from TmFtsZ,a heating step was introduced to denature and precipitatetheE. coli proteins. We found that TmFtsZ was substan-tially stabilized when 1 mM GTP and 5 mM Mg wereadded before heating. With GTP and Mg, TmFtsZremained soluble after 20 min at 70°C or 10 min at 80°C,while most contaminating proteins precipitated. For puri-fication, a 2- to 3-ml sample of TmFtsZ in a centrifugetube was heated to 80°C for 2 min, cooled on ice for 20min, and then centrifuged. As a final purification step, theTmFtsZ was chromatographed on a mono-Q column,where it eluted at 0.37 M NaCl.
AzFtsZ was purified by two cycles of precipitationat 20% saturated ammonium sulfate. Eventually, all FtsZproteins were resuspended in the resuspension buffer with10 mM Mg, aliquoted, and stored at280°C.
Calibration of Protein Concentration
Quantitative amino acid analysis of bovine serumalbumin (BSA), EcFtsZ, and TmFtsZ was performed byDr. Ida Thorgersen (Macromolecular Structure Facility,Duke University Medical Center). BSA concentrationwas also checked by ultraviolet (UV) spectroscopy. Thesecalibrated standards were used to calibrate the bicin-chonic acid (BCA) colorimetric assay (Pierce Biochemi-cals, Rockford, IL) [Smith et al., 1986].
Antibody Production
Rabbits were inoculated with 200 µg of GST-FtsZfusion protein in 2 ml saline mixed with 2 ml completeFreund’s adjuvant. One rabbit (FtsZd-5434) was immu-nized with a protein band that was cut out from an SDSgel (,2 ml gel was equilibrated in saline and emulsifiedwith Freund’s adjuvant). Another rabbit (FtsZn-5435)was injected with soluble, native protein that had beenpurified by ammonium sulfate precipitation and affinitychromatography on a glutathione column. Four boosts of50 µg protein in 2 ml saline plus 2 ml incompleteFreund’s adjuvant were given over 10 weeks. All bleedsfor both antisera stained a single band, of varyingintensities, at,40 kDa, in Western blots of wholeE. coli.Bleed 4 of the FtsZn-5435 antiserum was further purifiedby affinity binding to EcFtsZ coupled to CNBr-Sepha-rose. A total of 1.44 mg of antibody was purified from5 ml antiserum.
Quantitative Western Blotting
Escherichia coliBL21 cells were used for determi-nation of normal FtsZ levels. Cells were grown in LB at37°C, shaken at 250 rpm, to an OD600 of 0.5–0.7. Cellswere then killed with 0.02% sodium azide and put on icefor 30 min. They were then counted with a hemocytom-eter under 4003 magnification using phase contrastoptics. Several cultures were also diluted and plated onLB-agar plates before fixing so as to carry out viable
GTPase and Assembly of FtsZ 73

counts. In each case, viable counts agreed with hemocy-tometer counts within 10%.
Samples containing a known number of cells werelysed in SDS buffer and separated on 12% SDS-polyacrylamide reducing gels, transferred to Immobilonmembrane (Millipore, Bedford, MA), and blocked with5% skim milk/TTBS (100 mM Tris pH 7.4, 150 mMNaCl, 0.1% Tween) overnight. Primary incubation waswith 0.23 µg/ml FtsZn-5435 affinity purified polyclonalantibody in 0.25% gelatin/TTBS for 120min. Secondaryincubation was with 2 µCi/blot125I-labeled protein A(ICN, Costa Mesa, CA) in 0.25% gelatin/TTBS for45min. Blots were washed and placed on phosphoimagerscreens (Hypercassette, Amersham, Arlington Heights,IL) for periods ranging from 3 h to 16 h,then scanned anddigitized with a phosphoimager (Fujix Bas1000). Theintensity of lanes on these blots was determined with thesoftware program MacBas 1.0 (Fuji).
For quantitative Western blotting, blots were run insets to ensure consistent results. Three identical blotscontaining a set of standards and a set of unknowns and ablot containing two sets of standards were run concur-rently. The dual standards blot allowed confirmation ofconsistency within blots, showing that all areas on theblot were equally sensitive. The multiple blots containingunknowns allowed confirmation of consistency betweenblots. Any set of blots where identical lanes on the dualstandards blot had intensities differing by more than 10%was discarded. Similarly, in the case in which theunknowns blots gave intensities differing by more than10%, they would be discarded. If two of the threeunknowns blots agreed with each other, only the third wasdiscarded. If all three blots disagreed, all three werediscarded.
GTP Hydrolysis
FtsZ was desalted, and its buffer was exchangedusing prepacked Econo-Pac 10DG columns (Bio-Rad,Hercules, CA) in 50 mM Tris-HCl, pH 7.5. Three reactionbuffers were used. Most assays were done in TKM7.5 (50mM Tris-HCl, pH 7.5, 50 mM KCl, 5 mM Mg acetate).The second buffer was PB7.7 (physiological buffer: 35mM MOPS, pH 7.7, 80 mM Glutamate, 350 mMpotassium acetate, 2.5 mM Mg acetate, 50 mM trehalose,2 mM putrescine), which mimics the ionic composition oftheE. coli cytoplasm [Cayley et al., 1991]. We found thatglutamate, trehalose and putrescine had no effect onGTPase or assembly, so this buffer is very similar toTKM7.5, except for the higher potassium concentration.MEMK6.5 (100 mM MES, pH 6.5, adjusted with KOH, 1mM EGTA, 5 mM Mg acetate) was a lower pH bufferused for some assembly and GTPase assays. Buffersnormally contained 0.5 mM GTP (except as noted), and0.5 µCi (a-32P) GTP (3,000 Ci/mmol). GTP from Amer-
sham was uniformly of high quality when analyzed bythin layer chromatography, and was used for all assays;several lots obtained from ICN contained only GDP.Additives or alterations in the buffer are indicated in thetext. Reaction buffer for TmFtsZ was prewarmed to thereaction temperature and the reaction was initiated byadding prewarmed FtsZ to give the indicated concentra-tion. At indicated intervals, 1 µl was withdrawn andapplied to polyethyleneimine cellulose thin layer chroma-tography plates (103 10 cm, Polygramt CEL 300PEI/UV254, Macherey-Nagel, Germany). The spots driedwithin 1–2 min, which we assumed arrested the GTPase.Plates were developed in 0.75 M KH2PO4, pH 3.4, dried,and exposed to a phosphoimager plate (IP, FUJIX) for10–30 min. The imager plate was screened and data wereanalyzed using MacBAS1000 v 1.01 software (FUJIX,BAS 1000Mac, Fuji Photo Film). To avoid errors due toevaporation of sample during the reaction or imprecisionin the amount of sample loaded, the data were alwaysread as the ratio of GDP/GTP; this ratio, multiplied by theknown amount of GTP in the starting solution, gave theamount of GDP produced, which was eventually ex-pressed as moles GDP produced per mole FtsZ.
Because we do not understand the mechanism forthe GTPase reaction, and because variable results havebeen reported by different labs, we need to specify theconditions of our assay precisely. The FtsZ was trans-ferred by gel filtration to 50 mM Tris-HCl, pH 7.5(containing no GTP, Mg, or K), and frozen at a concentra-tion of 1–3 mg/ml. FtsZ was thawed and kept on icebefore the experiment. A reaction mixture was preparedcontaining Tris, KCl, Mg, and GTP to give the desiredfinal concentrations when mixed with FtsZ in a 20-µlreaction mixture. FtsZ was added to the reaction mixtureon ice, and the Eppendorf tube was transferred immedi-ately to a 37°C water bath (for Ec- and AzFtsZ). ForTmFtsZ, the concentrated FtsZ and the reaction buffercontaining GTP were separately prewarmed to 70°C andmixed at the initial time point. Attempts to prewarmEcFtsZ gave erratic results, perhaps because of denatur-ation of the protein at 37°C in the absence of GTP.
Assembly of FtsZ
Three buffers were used for assembly studies:TKM7.5, PB7.7, and MEMK6.5 . FtsZ was transferred toassembly buffer using 10-ml prepacked Econo-Pac 10DGcolumns (Bio-Rad) before assembly.Assembly of TmFtsZin MEMK6.5 was started by adding GTP to 2 mM andincubating at 70°C. At 5 min after incubation at 70°C,glutaraldehyde (ultrapure TEM grade, Tousimis ResearchCorporation, Rockville, MD) was added to 1% to fix thepolymers. The reaction was kept at 70°C for another 2 min,then cooled to room temperature, and negatively stainedspecimens were prepared. EcFtsZ (1 mg/ml) was assembled
74 Lu et al.

in both MEMK6.5 and PB7.7, while AzFtsZ was polymer-ized in PB7.7. These reactions were started by adding DEAEdextran (approximate MW 2,000,000, D-5876, Sigma, St.Louis, MO) to 0.6 mg/ml and GTPto 2 mM, and incubated onice for 10 min, followed by incubation at 37°C for 5 min.EcFtsZ polymers in the absence of DEAE dextran werevisualized by negative staining at 0°C and 37°C.
Electron Microscopy
Before rotary shadowing, FtsZ was sedimentedthrough a 5-ml linear gradient of 15–40% glycerol in 0.1mM GTP, 0.2 M ammonium bicarbonate. Peak fractionsidentified by SDS-PAGE were diluted in 40% glycerol,0.2 M ammonium bicarbonate, sprayed onto freshlycleaved mica, and rotary shadowed with platinum [Fowlerand Erickson, 1979].
Assembly of FtsZ in vitro was analyzed primarilyby negative stain electron microscopy. Grids coated witha thin carbon film were subjected to glow discharge torender the surface hydrophilic and wettable. A total of 10µl of the assembled FtsZ was applied to the grid,removed, and drained with filter paper, and 3 drops ofuranyl acetate (a 2% aqueous solution, unadjusted pH,filtered through 0.2 µm) were washed over the grid whileit was held at a 45° angle. The grid was finally drainedwith filter paper and stored. Grids were examined with aPhilips 301 electron microscope and photographed at50,0003.
RESULTS
Sequences of AzFtsZ and TmFtsZand Expression in E. coli
The DNA and deduced amino acid sequences ofAzFtsZ and TmFtsZ have been submitted to the GenBankdatabase, accession numbers U65939 and U65944. Theamino acid sequence of AzFtsZ is 85% and 83% identicalto FtsZ from the closely relatedPseudomonas aeruginosaandPseudomonas putida, and 57% identical to EcFtsZ.TmFtsZ is 45% identical to FtsZ from the gram-positivebacteria Bacillus subtilis, Staphylococcus aureus, andAnabaenasp. It is about 40–42% identical to FtsZ frommost gram-negative bacteria (41% to EcFtsZ) and 33–41% identical to FtsZ from archaebacteria. On a phyloge-netic tree the TmFtsZ sequence branches close to theseparation of gram-positive, gram-negative, and archae-bacteria [Erickson, 1997]. The 351-amino acid sequenceof TmFtsZ is one of the shortest of 35 known completesequences; the only shorter are FtsZ fromHaloferaxvolcanii [Wang and Lutkenhaus, 1996], and the second,probably nonessential FtsZ ofRhizobium meliloti[Margo-lin and Long, 1994].
All three FtsZ proteins were abundantly expressedas soluble proteins inE. coli. Overexpression of TmFtsZ
did not cause filamentation or otherwise alter cell growthor viability either before or after induction by IPTG,suggesting that this protein is inactive inE. coli at 37°C.However, overexpression of EcFtsZ or AzFtsZ causedfilamentation. Even without induction by IPTG, primarytransformants carrying the EcFtsZ or AzFtsZ recombi-nant expression plasmid frequently produced smoothfilamentous bacteria, apparently due to the small amountof expression from the pET vector. Cell filamentationdisappeared after several passages for EcFtsZ-trans-formed cells, consistent with previous observations [Daiand Lutkenhaus, 1992]. However, the AzFtsZ-trans-formed cells remained filamentous, suggesting that evena small amount of AzFtsZ inhibits theE. coli divisionsystem. This toxicity has been observed for expression ofalmost all foreign FtsZ inE. coli [Beall et al., 1988;Margolin et al., 1991].
Two Fractions of EcFtsZ With DifferentGTPase Activities
In our earlier experiments, EcFtsZ was purified bytwo cycles of precipitation with 20% saturated ammo-nium sulfate. However, further experiments suggestedthat this EcFtsZ was a mixture of inactive protein and afully active form. This preparation represented only30–40% of the total expressed EcFtsZ; it bound only 0.25moles of guanine nucleotide per mole of EcFtsZ; and ithad a lower GTPase activity than any other FtsZ prepara-tion. By contrast, the fraction of EcFtsZ precipitated by25% ammonium sulfate, following a 20% ammoniumsulfate cut, bound 1 mole guanine nucleotide per moleFtsZ and had a much higher rate of GTP hydrolysis. The20% cut hydrolyzed 0.31 moles of GTP per mole ofprotein per min, compared with 2.4 moles/min for the25% cut under the same conditions (see below). Weassume that the 25% fraction contained fully activeEcFtsZ and used this for all subsequent experiments.
To check for possible covalent differences in thetwo protein preparations, EcFtsZ fractions precipitated at20% and 25% ammonium sulfate were analyzed byelectrospray mass spectrometry. The measured mass was40,326.9 Da and 40,327.4 Da, for the two preparations,identical to the mass of 40327.4 calculated from theamino acid sequence by the DNAstar (Madison, WI)program. We conclude that neither preparation of EcFtsZhas any post-translational modification. Both fractionsalso gave identical results upon gradient sedimentationand electron microscopy (see Fig. 5 for micrographs ofthe 25% fraction), suggesting no difference in polymeriza-tion state.
Before dismissing the 20% cut as completely unin-teresting, we should point out that this sample wouldassemble into protofilament sheets in MEMK6.5 andPB7.7 buffer; remarkably, this assembly occurred without
GTPase and Assembly of FtsZ 75

addition of DEAE dextran. A maximum of 25–30% of theprotein in the 20% ammonium sulfate fraction could bepelleted after assembly, compared to 95% of the proteinin the 25% ammonium sulfate fraction, but assembly ofthis later fraction was completely dependent on addedDEAE dextran (see below). It is possible that somethingin the 20% cut is substituting for DEAE dextran.
Concentration of FtsZ In Vitro and In Vivo
Determining the concentration of FtsZ is not straight-forward. UV absorption is usually the simplest and mostaccurate method [Brennan and Hardeman, 1993; Gill andVon Hippel, 1989], but FtsZ has no tryptophan and almostno tyrosine, and therefore has negligible absorption at278 nm. Colorimetric assays can give widely differentcolor intensity for different proteins and need to bestandardized. We therefore used quantitative amino acidanalysis to determine the concentration of samples ofEcFtsZ, TmFtsZ, and BSA. (As an incidental result, weindependently determined the concentration of BSA byUV absorption and confirmed that the classic extinctioncoefficient, 0.667 [Foster and Sterman, 1956], is correct,rather than the 7% lower value calculated from the aminoacid sequence [Brennan and Hardeman, 1993; Gill andVon Hippel, 1989].) We then compared the three proteinsin the BCA assay and found that the ratio of color was0.75 for EcFtsZ/BSA, and 0.67 for TmFtsZ/BSA. There-fore a substantial correction factor of 1.33 or 1.5 needs tobe applied when these proteins are measured in the BCAassay, using BSA as a secondary standard. We alsocalibrated the Bradford assay, in which the ratio of colorwas 0.82 for EcFtsZ/BSA, and 0.70 for TmFtsZ/BSA. Inour experience, the BCA assay gives much more consis-tent results.
Two previous studies have reported the concentra-tion of FtsZ inE. coli to be 20,000 or 5,000 molecules percell [Dai and Lutkenhaus, 1992; Pla et al., 1991], but themethodologies were not well described. We thereforedetermined the concentration of FtsZ in log phase BL21E. coli by quantitative Western blotting, using the cali-brated FtsZ sample described above. We averaged 12quantitative blots over two separate experiments and twodifferent concentrations of cell lysate. The average valuewas 14,800 molecules of FtsZ per cell, with a standarddeviation of 1,450. We conclude that there are approxi-mately 15,000 molecules of FtsZ in the average log phaseE. coli cell, plus or minus 10%.
To compare our in vitro assays with conditions inthe cell, it is important to know the concentration of FtsZin the bacterial cytoplasm. The averageE. coli cell (strainB/r A, doubling time of 25min) has a length of 3.6 µm[Donachie et al., 1976] and a diameter of approximately0.94 µm [Trueba and Woldringh, 1980]. These dimensionscorrespond well with our light microscopy observations
(data not shown). Assuming that the bacterial cell is acylinder capped by two hemispheres, the average cell vol-ume is calculated to be 2.28 µm3. Kubitschek et al [1986]gives the volume of a newborn cell under similar condi-tions as 1.566 µm3.An average cell under log phase growthwould have a volume of (1.566 µm3)/ln2, or 2.26 µm3,which corresponds to our calculated volume. If there are15,000 molecules of FtsZ in this volume, the intracellularconcentration of FtsZ is 10.9 µM, or 440 µg/ml.
We noted that the pET expression system forEcFtsZ gives one of the highest expression levels of anyprotein we have seen, so we determined the concentrationof the expressed protein. After 120 min induction wefound 3.13 106 molecules of FtsZ per cell, and notedalso that the cells were 2.4 times as long as normal logphase cells. This gives an intracellular concentration of36 mg/ml, or,80 times the average normal concentra-tion of FtsZ.
Stoichiometric GTP Bindingand Temperature-Dependent Hydrolysis
We used our calibrated protein concentration toobtain an accurate measurement of the stoichiometry ofGTP binding to the three FtsZs. Starting with a sample ofFtsZ in 1 mM GTP, we removed free nucleotide by gelfiltration, determined the protein concentration as de-scribed, and precipitated the protein with 4.2% perchloricacid. We then determined the concentration of guaninenucleotide by UV spectrophotometry. We obtained avalue of 0.99 moles of guanine nucleotide per mol ofEcFtsZ. We did not determine whether the nucleotide wasGTP or GDP. The measured stoichiometry near 1:1demonstrates that the affinity of guanine nucleotide issufficiently high to remain bound during gel filtration.Similar measurements showed 1.03 mol guanine nucleo-tide per mol AzFtsZ and 1.13 mole guanine nucleotideper mol TmFtsZ. This is the first study to use calibratedprotein concentration to demonstrate a 1:1 stoichiometryof guanine nucleotide binding to FtsZ and confirms thatthe FtsZ proteins purified by our protocols are,100%active in nucleotide binding.
We then assayed the GTPase activity in differentbuffer conditions. We found that the GTPase activity ofboth TmFtsZ andAzFtsZ required Mg21 (data not shown),as shown previously for EcFtsZ [RayChaudhuri and Park,1992; de Boer et al., 1992; Mukherjee et al., 1993] andB. subtilis FtsZ [Wang and Lutkenhaus, 1993]. Wemeasured the GTPase activity of EcFtsZ in two assemblybuffers, MEMK6.5 and PB7.7. EcFtsZ showed measur-able hydrolysis at 0°C, and a substantial increase at 37°C(Fig. 1a). The activity in PB7.7 was higher than that inMEMK6.5, probably because of the higher potassiumconcentration, which enhanced activity significantly (seebelow for details). The GTPase of TmFtsZ showed a
76 Lu et al.

strong dependence on temperature (Fig. 1b). There wasvery little activity at 37°C and a modest activity at 50°C.At both 37°C and 50°C, there was a small lag in GTPase,indicated by the acceleration of activity at later times.GTPase was markedly increased and the lag was notdetectable at 65°C or higher.
Throughout this paper, we express GTP hydrolysisas (1) specific activity, in moles GDP produced per mole
FtsZ, or (2) GTP turnover, in moles GDP produced permole FtsZ per min.
Requirement for Sodium or Potassiumfor GTPase Activity
Mukherjee et al. [1993] reported that 100 mMpotassium was required for the GTPase activity ofEcFtsZ, and 2.0 M KCl was required for GTPase of thehalophilic archaebacteriumHaloferax volcanii [Wangand Lutkenhaus, 1996]. We investigated how the GTPaseof EcFtsZ varied with the concentration of KCl (Fig. 2a).Minimal activation was obtained at 25 mM KCl, andmaximal stimulation required 100 mM KCl. Increasingthe KCl to 200–400 mM gave no additional enhancement.400 mM KCl actually produced a several min lag beforehydrolysis began. 50 mM KCl gave about half-maximalstimulation of GTPase, and this was used for most subse-quent experiments. The enhancement was specific for po-tassium, since the GTPase in 50 mM NaCl was the sameas in Tris alone (Fig. 2b). This finding is consistent withthe previous study of EcFtsZ [Mukherjee et al., 1993].
However, we found that FtsZ fromAzotobacterandThermotogado not have a specific requirement forpotassium. As shown in Figure 2c,d, a monovalent cationis required, but sodium is almost as effective as potassiumfor AzFtsZ and is slightly more effective for TmFtsZ.LiCl was also able to stimulate TmFtsZ GTPase activity(data not shown).
GTPase Activity Depends on Concentrationof Protein and GTP
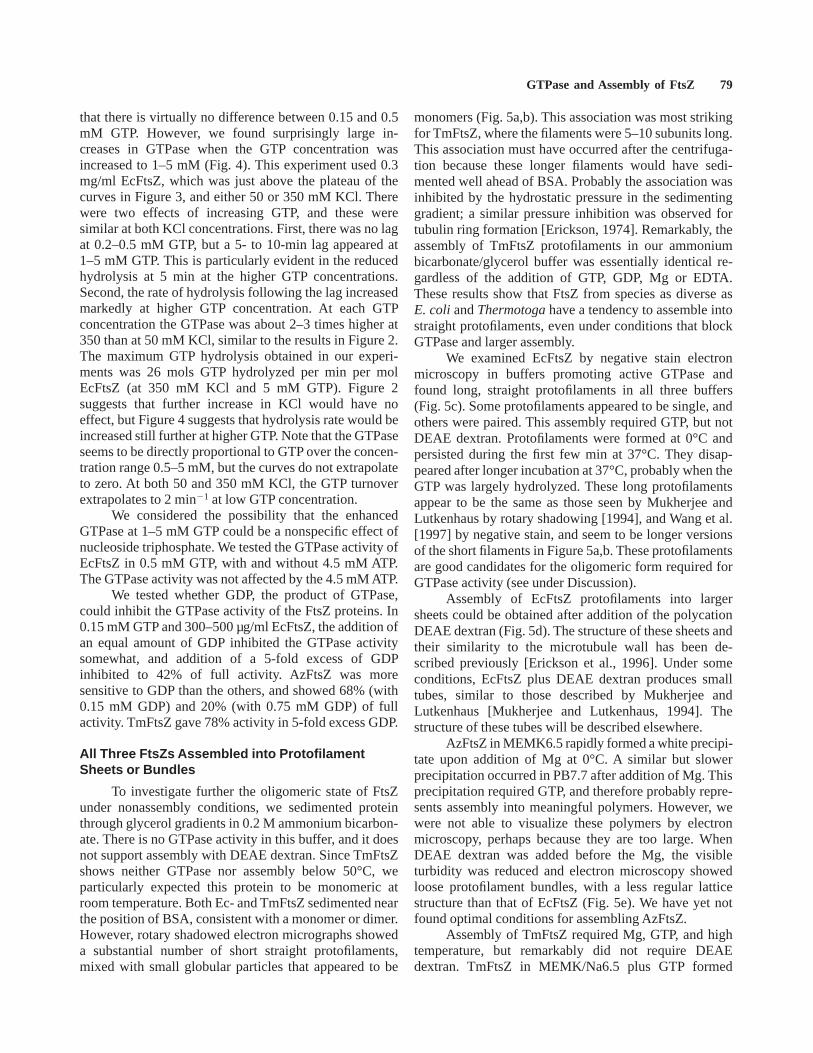
Our initial studies showed that the GTPase activitywas constant over a 5-fold concentration range, from 200µg/ml to.1 mg/ml, for each of the three FtsZs. However,previous studies have found that the GTPase activity ofFtsZ depends on the protein concentration, implying thatself-association may play a role in the hydrolysis reaction[de Boer et al., 1992; Mukherjee et al., 1993; Wang andLutkenhaus, 1993]. In most cases, the major effect ofconcentration was a steep loss of GTPase activity at FtsZconcentrations of,200 µg/ml, so we investigated thisrange in detail.
Time courses of GTP hydrolysis at different FtsZconcentrations are shown in Figure 3a, and the turnoverof GTP per FtsZ molecule per min in Figure 3b. Turnoverwas independent of protein concentration above 300µg/ml for Ec-, Az-, and TmFtsZ, and for all three proteinsthe GTP turnover dropped below 200 µg/ml. This issimilar to BsFtsZ, which showed a similar plateau above200 µg/ml, and a steep drop to zero activity at 100 µg/ml[Wang and Lutkenhaus, 1993]. There were two differentbehaviors at lower concentrations. For Ec- and AzFtsZthere was a lag of 5–20 min before GTP hydrolysis began,confirming two previous reports for EcFtsZ [de Boer et
Fig. 1. GTPase activity of EcFtsZ and TmFtsZ at different tempera-tures. a: EcFtsZ (1.9 mg/ml) was tested at 0°C for 15 min; thetemperature was then shifted to 37°C. GTPase was tested in twobuffers.b: TmFtsZ was 0.8 mg/ml in TKM7.5. The plateau is reachedwhen all the GTP is hydrolyzed. Specific activity was expressed asmols GTP hydrolyzed per mol FtsZ at each time point.
GTPase and Assembly of FtsZ 77

al., 1992; Mukherjee et al., 1993]. For TmFtsZ there wasno lag, similar to reports for BsFtsZ [Wang and Lutken-haus, 1993] andH. volcaniiFtsZ [Wang and Lutkenhaus,1996]. The lag suggests a nucleation phenomenon togenerate the active polymers, but it is curious that it isobserved in FtsZ from some species but not from others.Our observation in a single experiment of a lag in twospecies, and not in another, supports the interpretationthat these are real species differences and not due todifferent protocols in different laboratories. We also
extend to three new species the observation that GTPturnover per FtsZ is constant above 300 µg/ml, and dropsat lower concentrations, suggesting that this is a consis-tent feature of FtsZ from all bacteria.
The experiments depicted in Figure 3 were done atGTP concentrations of 0.15–0.5 mM GTP, the lowerconcentrations being used for increased accuracy at thelower protein concentrations. Several points were done induplicate at both 0.15 and 0.5 mM GTP, and there was nosignificant difference in the GTPase. Figure 4 confirms
Fig. 2. Effect of monovalent cations on the GTPase activity of Ec-,Az-, and TmFtsZ. Buffers all contained 70 mM Tris-HCl, pH 7.5,5 mM magnesium acetate, 0.5 mM GTP, and either no additional salt,or KCl or NaCl as indicated.a: Reaction containing 300 µg/ml EcFtsZand increasing amounts of KCl as indicated.b–d: The reactionscontained 50 mM KCl or NaCl as indicated (Tris indicates noadditional monovalent cation), plus(b) 650 µg/ml EcFtsZ;(c) 380
µg/ml AzFtsZ; (d) 800 µg/ml TmFtsZ. EcFtsZ and AzFtsZ were atassayed 37°C, while TmFtsZ was at 65°C. The y-axis plots mols GTPhydrolyzed per mol FtsZ at each time point. Each reaction reached aplateau when all the GTP had been hydrolyzed. GTPase activity isindicated by the initial slope, not the height of the curve at plateau.Note that the time scale varies in the different panels.
78 Lu et al.
that there is virtually no difference between 0.15 and 0.5mM GTP. However, we found surprisingly large in-creases in GTPase when the GTP concentration wasincreased to 1–5 mM (Fig. 4). This experiment used 0.3mg/ml EcFtsZ, which was just above the plateau of thecurves in Figure 3, and either 50 or 350 mM KCl. Therewere two effects of increasing GTP, and these weresimilar at both KCl concentrations. First, there was no lagat 0.2–0.5 mM GTP, but a 5- to 10-min lag appeared at1–5 mM GTP. This is particularly evident in the reducedhydrolysis at 5 min at the higher GTP concentrations.Second, the rate of hydrolysis following the lag increasedmarkedly at higher GTP concentration. At each GTPconcentration the GTPase was about 2–3 times higher at350 than at 50 mM KCl, similar to the results in Figure 2.The maximum GTP hydrolysis obtained in our experi-ments was 26 mols GTP hydrolyzed per min per molEcFtsZ (at 350 mM KCl and 5 mM GTP). Figure 2suggests that further increase in KCl would have noeffect, but Figure 4 suggests that hydrolysis rate would beincreased still further at higher GTP. Note that the GTPaseseems to be directly proportional to GTP over the concen-tration range 0.5–5 mM, but the curves do not extrapolateto zero. At both 50 and 350 mM KCl, the GTP turnoverextrapolates to 2 min21 at low GTP concentration.
We considered the possibility that the enhancedGTPase at 1–5 mM GTP could be a nonspecific effect ofnucleoside triphosphate. We tested the GTPase activity ofEcFtsZ in 0.5 mM GTP, with and without 4.5 mM ATP.The GTPase activity was not affected by the 4.5 mM ATP.
We tested whether GDP, the product of GTPase,could inhibit the GTPase activity of the FtsZ proteins. In0.15 mM GTP and 300–500 µg/ml EcFtsZ, the addition ofan equal amount of GDP inhibited the GTPase activitysomewhat, and addition of a 5-fold excess of GDPinhibited to 42% of full activity. AzFtsZ was moresensitive to GDP than the others, and showed 68% (with0.15 mM GDP) and 20% (with 0.75 mM GDP) of fullactivity. TmFtsZ gave 78% activity in 5-fold excess GDP.
All Three FtsZs Assembled into ProtofilamentSheets or Bundles
To investigate further the oligomeric state of FtsZunder nonassembly conditions, we sedimented proteinthrough glycerol gradients in 0.2 M ammonium bicarbon-ate. There is no GTPase activity in this buffer, and it doesnot support assembly with DEAE dextran. Since TmFtsZshows neither GTPase nor assembly below 50°C, weparticularly expected this protein to be monomeric atroom temperature. Both Ec- and TmFtsZ sedimented nearthe position of BSA, consistent with a monomer or dimer.However, rotary shadowed electron micrographs showeda substantial number of short straight protofilaments,mixed with small globular particles that appeared to be
monomers (Fig. 5a,b). This association was most strikingfor TmFtsZ, where the filaments were 5–10 subunits long.This association must have occurred after the centrifuga-tion because these longer filaments would have sedi-mented well ahead of BSA. Probably the association wasinhibited by the hydrostatic pressure in the sedimentinggradient; a similar pressure inhibition was observed fortubulin ring formation [Erickson, 1974]. Remarkably, theassembly of TmFtsZ protofilaments in our ammoniumbicarbonate/glycerol buffer was essentially identical re-gardless of the addition of GTP, GDP, Mg or EDTA.These results show that FtsZ from species as diverse asE. coli andThermotogahave a tendency to assemble intostraight protofilaments, even under conditions that blockGTPase and larger assembly.
We examined EcFtsZ by negative stain electronmicroscopy in buffers promoting active GTPase andfound long, straight protofilaments in all three buffers(Fig. 5c). Some protofilaments appeared to be single, andothers were paired. This assembly required GTP, but notDEAE dextran. Protofilaments were formed at 0°C andpersisted during the first few min at 37°C. They disap-peared after longer incubation at 37°C, probably when theGTP was largely hydrolyzed. These long protofilamentsappear to be the same as those seen by Mukherjee andLutkenhaus by rotary shadowing [1994], and Wang et al.[1997] by negative stain, and seem to be longer versionsof the short filaments in Figure 5a,b. These protofilamentsare good candidates for the oligomeric form required forGTPase activity (see under Discussion).
Assembly of EcFtsZ protofilaments into largersheets could be obtained after addition of the polycationDEAE dextran (Fig. 5d). The structure of these sheets andtheir similarity to the microtubule wall has been de-scribed previously [Erickson et al., 1996]. Under someconditions, EcFtsZ plus DEAE dextran produces smalltubes, similar to those described by Mukherjee andLutkenhaus [Mukherjee and Lutkenhaus, 1994]. Thestructure of these tubes will be described elsewhere.
AzFtsZ in MEMK6.5 rapidly formed a white precipi-tate upon addition of Mg at 0°C. A similar but slowerprecipitation occurred in PB7.7 after addition of Mg. Thisprecipitation required GTP, and therefore probably repre-sents assembly into meaningful polymers. However, wewere not able to visualize these polymers by electronmicroscopy, perhaps because they are too large. WhenDEAE dextran was added before the Mg, the visibleturbidity was reduced and electron microscopy showedloose protofilament bundles, with a less regular latticestructure than that of EcFtsZ (Fig. 5e). We have yet notfound optimal conditions for assembling AzFtsZ.
Assembly of TmFtsZ required Mg, GTP, and hightemperature, but remarkably did not require DEAEdextran. TmFtsZ in MEMK/Na6.5 plus GTP formed
GTPase and Assembly of FtsZ 79
Figure 3.
80 Lu et al.

highly ordered protofilament sheets with a very clearresolution of individual protofilaments (Fig. 5f). TmFtsZsheets were temperature sensitive, and disassembledquickly when the temperature dropped even to 50°C.Fixation by glutaraldehyde was essential to preserve theassembled sheets before preparation of negatively stainedspecimens. Following assembly and fixation, more than90% of TmFtsZ could be pelleted by centrifugation at20,000g, indicating that the assembly was highly efficient.
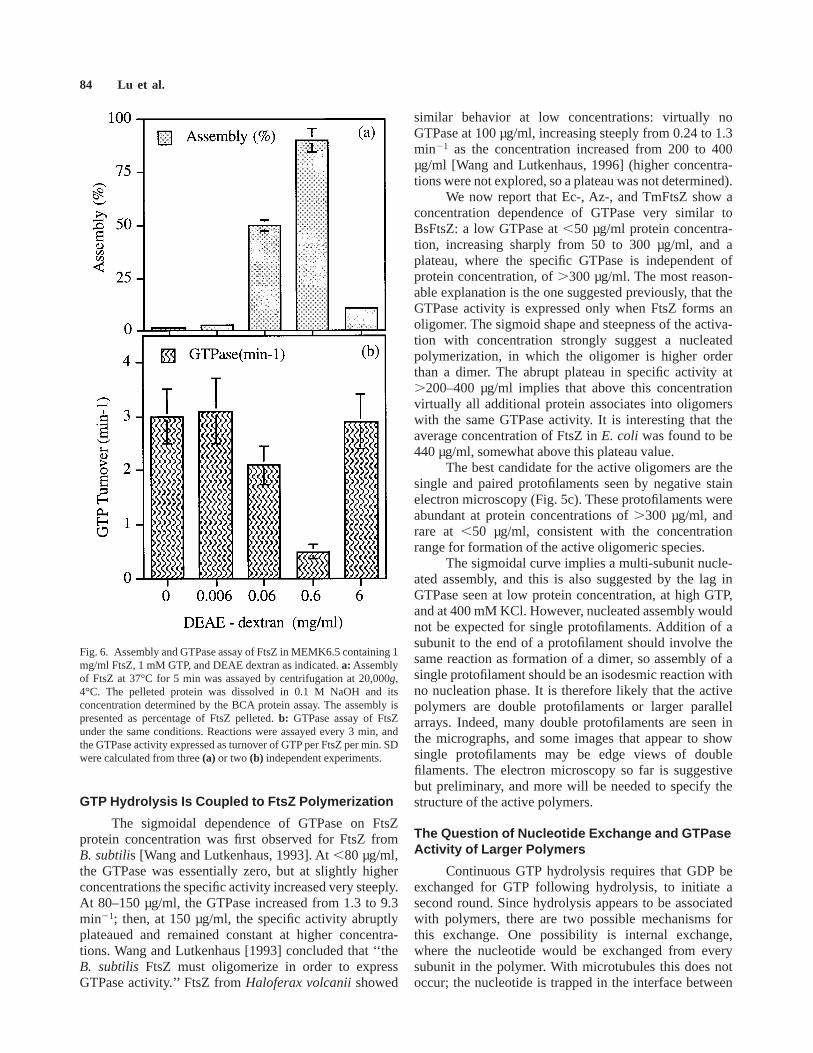
We tested the effect of changing the concentrationof DEAE dextran on assembly and GTPase of EcFtsZ.Figure 6a shows that in MEMK6.5 buffer 87% of the FtsZcould be assembled and pelleted by centrifugation with aratio of 0.6 mg DEAE dextran/FtsZ. The fraction as-sembled dropped at both lower and higher DEAE dex-tran, very similar to the assembly of tubulin with DEAEdextran [Erickson and Voter, 1976]. Electron microscopyconfirmed that polymers were similar in size at all DEAEdextran concentrations, but much more numerous at 0.6mg/ml. A reasonable interpretation is that DEAE dextranis stabilizing the polymer by binding electrostatically toand bridging two or more subunits. At lower concentra-tions of DEAE dextran, assembly is limited by thestoichiometry: 0.06 mg/ml DEAE dextran assembled 0.5mg FtsZ, compared with 0.42 mg tubulin [Erickson andVoter, 1976]. In excess DEAE dextran, each DEAEdextran molecule may bind a single FtsZ, rather thanbridging two or more and stabilizing the polymer. WithFtsZ, as with tubulin, the curves were similar at differentprotein concentrations, i.e., it was the ratio of DEAEdextran to protein that determined the polymerization.
Figure 6b shows that GTPase was inhibited by theDEAE dextran-induced polymerization. A complicationin this experiment is that the polymer form changed. At0.06 and 6 mg/ml, the polymers were protofilamentsheets, but at the peak assembly, 0.6 mg/ml DEAEdextran, the polymers were tubes. It is likely that the tubepolymers are especially inhibited in GTPase, but theprotofilament sheets at 0.06 mg/ml are also inhibited
relative to no DEAE dextran. It is important to rememberthat FtsZ assembles into single or double protofilaments,which appear to be the oligomer required for the highGTPase, in the absence of DEAE dextran. These indi-vidual protofilaments were not pelleted in the centrifuga-tion conditions used. Figure 6b indicates that furtherassembly of these protofilaments into large sheets or tubepolymers substantially inhibits their ability to mediateGTP hydrolysis.
DISCUSSION
Table I summarizes the GTPase activities of FtsZdetermined here and in several independent studies.These hydrolysis rates, 2–10 GTP hydrolyzed per FtsZper min, are surprisingly high. Most proteins that hydro-lyze GTP have a very low intrinsic GTPase, which isaccelerated by interaction with other proteins. In ageneral discussion of the GTPase superfamily, Bourne etal. [1991] comment: ‘‘In many (but not all) GTPases theintrinsic rate constants of GDP release (kdiss.GDP) and GTPhydrolysis (kcat.GTP) are quite low (,0.03 min−1).These are increased by either of two classes of regulatoryproteins: the guanine nucleotide release proteins (GNRPs),which catalyze release of bound GDP, promoting itsreplacement by GTP, and the GTPase activating proteins(GAPs), which speed up GTP hydrolysis.’’
GAPs can accelerate GTP hydrolysis up to 5 ordersof magnitude when they bind to their cognate G protein.The mechanism has been revealed most clearly in therecent x-ray structures of Ras●RasGAP [Scheffzek et al.,1997], and Rho●RhoGAP [Rittinger et al., 1997], whichshow that the GTP molecule is in the interface betweenthe G-protein and the GAP, and makes contact with bothproteins. Importantly, most catalytic residues are pro-vided by Ras or Rho, but in both cases one catalyticresidue is provided by the GAP. The GAP may alsostabilize a conformation of the G-protein favoring thetransition state.
Tubulin has a very low GTPase activity under mostconditions that prevent its assembly into microtubules,but during microtubule assembly each tubulin subunithydrolyzes one GTP shortly after it enters the microtu-bule lattice. We have postulated that tubulin acts as itsown GAP, stimulating hydrolysis only when two subunitsencounter each other for productive assembly [Ericksonand O’Brien, 1992]. The GTPase of dynamin has somesimilarity to that of tubulin. The basal GTP turnover ismuch higher, about 2 min21 but, like tubulin, it issignificantly enhanced to 10 min21 when assembled intopolymers [Warnock et al., 1996]. Cooperative assemblyonto microtubules or lipid vesicles can increase theactivity to 100 min21 [Tuma et al., 1993]. Thus, the
Fig. 3. Effect of protein concentration on GTPase activity in TKM7.5buffer.a: Time course of GTP hydrolysis. Note again that the GTPaseactivity is indicated by the initial slope of the curves, not by the heightof the plateau (which represents the exhaustion of all GTP). Thenumbers to the right of each curve indicate the protein concentration inµg/ml. The time scale on the x-axis is different for TmFtsZ.b: GTPturnover (moles GTP hydrolyzed per mole of FtsZ per min) in theinterval of maximum hydrolysis. At the higher protein concentrations,this was starting from the 0 time point, but at the lower proteinconcentrations the turnover rate was determined after the lag (points inparentheses). The GTP concentration was 0.15–0.5 mM, and severalduplicate experiments indicated no significant difference due to GTPconcentration in this range. EcFtsZ and AzFtsZ were assayed at 37°C,TmFtsZ at 70°C. The straight lines fit the points, as well as morecomplex curves.
GTPase and Assembly of FtsZ 81

GTPase activity of dynamin is expressed primarily whenit is assembled into its characteristic polymer, which inthis case is a curved protofilament forming rings or stacksof rings [Hinshaw and Schmid, 1995].
An important characteristic of tubulin GTPase isthat subunits in the interior of the microtubule cannotexchange nucleotide, so hydrolysis only occurs whennew subunits are added to the ends. Since GTP hydrolysisis coupled to assembly, the GTPase is proportional to theconcentration of soluble tubulin and the concentration ofmicrotubule ends. GTP hydrolysis can reach 1–3 min–1
per mol of total tubulin during the initial phase ofmicrotubule assembly, but slows to 0.06 min–1 at steadystate [O’Brien et al., 1987]. Obviously, steady-statehydrolysis requires a continuous association of subunitsonto some microtubules, which must be balanced by anequal dissociation of subunits from other microtubules.This process is known as microtubule dynamic instability[Erickson and O’Brien, 1992]. Continuous assembly anddisassembly of dynamin has also been implicated in itsGTPase [Warnock et al., 1996], but the mechanism ismost clearly established for microtubules.
Fig. 4. Effect of GTP concentration on GTPase activity of EcFtsZ. The buffer was as in Fig. 3, except for350 mM KCl (bottom). EcFtsZ was 0.3 mg/ml in all cases.Left, top and bottom, GTP hydrolysis as afunction of time at different GTP concentrations, indicated in mM on the right of each curve.Right,maximum GTP turnover, measured after the lag when one exists.
82 Lu et al.

Fig. 5. a,b: Electron microscopy of FtsZ after glycerol gradientsedimentation. Rotary shadowed specimens were prepared at roomtemperature from gradient fractions in 0.2 M ammonium bicarbonate,30% glycerol. EcFtsZ(a) shows mostly small globular subunits that weinterpret to be FtsZ monomers(arrow), and some dimers and trimers.TmFtsZ(b) shows some monomers(arrow), but mostly short straightprotofilaments several subunits in length.c: Single(arrow) and paired(arrowhead)protofilaments imaged by negative stain, from samples ofEcFtsZ under conditions of high GTPase.d–f: Protofilament sheets and
bundles assembled by EcFtsZ, AzFtsZ, and TmFtsZ.d: EcFtsZ (1mg/ml) plus 0.6 mg/ml DEAE dextran in MEMK6.5 at 37°C assemblesinto protofilament sheets. Similar sheets were assembled in TKM7.5and PB7.7.e: AzFtsZ was assembled with 1 mg/ml protein plus 0.6mg/ml DEAE dextran at 37°C in PB7.7. It forms bundles of protofila-ments in a looser array than EcFtsZ sheets.f: TmFtsZ assembled at 1mg/ml protein and no DEAE dextran at 70°C in MEMK6.5. Thispreparation was fixed by adding glutaraldehyde to 1%, and a negativelystained specimen was prepared after 5 min at 70°C.
GTPase and Assembly of FtsZ 83
GTP Hydrolysis Is Coupled to FtsZ Polymerization
The sigmoidal dependence of GTPase on FtsZprotein concentration was first observed for FtsZ fromB. subtilis [Wang and Lutkenhaus, 1993]. At,80 µg/ml,the GTPase was essentially zero, but at slightly higherconcentrations the specific activity increased very steeply.At 80–150 µg/ml, the GTPase increased from 1.3 to 9.3min21; then, at 150 µg/ml, the specific activity abruptlyplateaued and remained constant at higher concentra-tions. Wang and Lutkenhaus [1993] concluded that ‘‘theB. subtilis FtsZ must oligomerize in order to expressGTPase activity.’’ FtsZ fromHaloferax volcaniishowed
similar behavior at low concentrations: virtually noGTPase at 100 µg/ml, increasing steeply from 0.24 to 1.3min21 as the concentration increased from 200 to 400µg/ml [Wang and Lutkenhaus, 1996] (higher concentra-tions were not explored, so a plateau was not determined).
We now report that Ec-, Az-, and TmFtsZ show aconcentration dependence of GTPase very similar toBsFtsZ: a low GTPase at,50 µg/ml protein concentra-tion, increasing sharply from 50 to 300 µg/ml, and aplateau, where the specific GTPase is independent ofprotein concentration, of.300 µg/ml. The most reason-able explanation is the one suggested previously, that theGTPase activity is expressed only when FtsZ forms anoligomer. The sigmoid shape and steepness of the activa-tion with concentration strongly suggest a nucleatedpolymerization, in which the oligomer is higher orderthan a dimer. The abrupt plateau in specific activity at.200–400 µg/ml implies that above this concentrationvirtually all additional protein associates into oligomerswith the same GTPase activity. It is interesting that theaverage concentration of FtsZ inE. coli was found to be440 µg/ml, somewhat above this plateau value.
The best candidate for the active oligomers are thesingle and paired protofilaments seen by negative stainelectron microscopy (Fig. 5c). These protofilaments wereabundant at protein concentrations of.300 µg/ml, andrare at ,50 µg/ml, consistent with the concentrationrange for formation of the active oligomeric species.
The sigmoidal curve implies a multi-subunit nucle-ated assembly, and this is also suggested by the lag inGTPase seen at low protein concentration, at high GTP,and at 400 mM KCl. However, nucleated assembly wouldnot be expected for single protofilaments. Addition of asubunit to the end of a protofilament should involve thesame reaction as formation of a dimer, so assembly of asingle protofilament should be an isodesmic reaction withno nucleation phase. It is therefore likely that the activepolymers are double protofilaments or larger parallelarrays. Indeed, many double protofilaments are seen inthe micrographs, and some images that appear to showsingle protofilaments may be edge views of doublefilaments. The electron microscopy so far is suggestivebut preliminary, and more will be needed to specify thestructure of the active polymers.
The Question of Nucleotide Exchange and GTPaseActivity of Larger Polymers
Continuous GTP hydrolysis requires that GDP beexchanged for GTP following hydrolysis, to initiate asecond round. Since hydrolysis appears to be associatedwith polymers, there are two possible mechanisms forthis exchange. One possibility is internal exchange,where the nucleotide would be exchanged from everysubunit in the polymer. With microtubules this does notoccur; the nucleotide is trapped in the interface between
Fig. 6. Assembly and GTPase assay of FtsZ in MEMK6.5 containing 1mg/ml FtsZ, 1 mM GTP, and DEAE dextran as indicated.a: Assemblyof FtsZ at 37°C for 5 min was assayed by centrifugation at 20,000g,4°C. The pelleted protein was dissolved in 0.1 M NaOH and itsconcentration determined by the BCA protein assay. The assembly ispresented as percentage of FtsZ pelleted.b: GTPase assay of FtsZunder the same conditions. Reactions were assayed every 3 min, andthe GTPase activity expressed as turnover of GTP per FtsZ per min. SDwere calculated from three(a) or two (b) independent experiments.
84 Lu et al.

subunits, so that internal subunits cannot exchange nucle-otide. The other possibility is exchange on free subunitsaccompanied by continuous dissociation and reassocia-tion. With microtubules, nucleotide hydrolysis occursrapidly after a subunit associates onto the end of amicrotubule, and the subunit retains its GDP as long as itremains in the microtubule. During the shortening phaseof dynamic instability subunits are released, and once freein solution they can exchange GDP for GTP and becharged for another round of assembly. It is unclear howthis scenario might apply to FtsZ, but the similarity ofatomic structures [Lo¨we and Amos, 1998; Nogales et al.,1998] strongly suggests that the nucleotide will benonexchangeable in the straight protofilament.
We observed in Fig. 6 that assembly into largersheets of protofilaments stabilized by DEAE dextransubstantially reduced the GTPase activity. Yu and Margo-lin [1997] reported recently that 10 mM calcium inducedassembly of larger polymers; we have repeated theseresults (unpublished work) and found that calcium in-duces assembly of protofilament sheets and tubes that areessentially identical to those induced by DEAE dextran.Yu and Margolin also reported reduction in GTPase at thecalcium concentrations giving maximum assembly, simi-lar to our results with DEAE dextran. Apparently the GTPhydrolysis is stimulated primarily by small polymers, theprotofilaments shown in Figure 5c, and inhibited when
these protofilaments associate into larger polymers. Alikely explanation is that dissociation and turnover ofsubunits is reduced in the larger polymers.
A final word of caution is needed concerning thehigh rate of GTP hydrolysis observed in vitro. Hydrolysisof 2–10 molecules of GTP per min by the 15,000molecules of FtsZ in a cell would seem a large metabolicburden. Little is known about the dynamics of FtsZassembly in the cell, so perhaps it is assembled once andmaintained in a polymer form that blocks GTP exchangeand further hydrolysis. A different enigma is posed by themutant FtsZ84. This temperature sensitive mutant isdefective for cell division at 42°C but can function fullyat 30°C. However, its GTPase in vitro is less thanone-tenth that of wild-type FtsZ over the entire range of30–44°C [RayChaudhuri and Park, 1992; de Boer et al.,1992]. This finding suggests that the very high level ofGTP hydrolysis observed in vitro may not be biologicallyimportant. The lower hydrolysis rates achieved by FtsZ84,or by FtsZ assembled with DEAE dextran may be morerelevant to the in vivo function.
ACKNOWLEDGMENTS
We thank Dr. David Bramhill, Merck, for providingthe pET plasmid for expression of EcFtsZ; Dr. MichaelAdams, University of Georgia, forThermotogaDNA; Dr.
TABLE I.
Spec. act. Temp. (°C) Protein concn. (mg/ml) KCl (mM) GTP (mM) Lag Buffera Ref.c
TmFtsZ 4.6 90 0.8 50 0.5 2 A a2.2 70 0.3–0.8 50 0.5 2 A a1.4 65 0.8 50 0.5 2 A a0.2 50 0.8 50 0.5 2 A a0.05 37 0.8 50 0.5 2 A a
AzFtsZ 3.3 37 0.3–0.87 50 0.5 2 A aEcFtsZ 2.4 37 0.4–1.5 50 0.5 2 A a
2.3 37 0.3 50 0.5 2 A a4.8 37 0.3 350 0.5 2 A a7.5 37 0.3 50 5 1 A a
26 37 0.3 350 5 1 A a0.4–0.7 37 0.18–0.27 100 0.5 1 B b
1.4 37 0.25 200 5 11 C c1.4 37 1–2 200 5 1 C c0.6 30 1.0 200 5 2 Cb d1.2 37 1.0 200 5 2 Cb d2.8 42 1.0 200 5 2 Cb d1.3 30 0.4 50 0.5 2 D e
BsFtsZ 1.3–9.3 37 0.1–0.18 100 0.5 2 B fHvFtsZ 0.2–1.3 37 0.2–0.4 2000 0.5 2 E g
aA, 50 mM Tris-HCl, pH 7.5, 50 mM KCl, 5 mM MgAC2, 0.15–0.5 mM GTP; B, 50 mM Hepes, pH 7.2, 100 mM KCl, 10 mM MgCl2, 0.5 mMGTP; C, 40 mM Tris-acetate, pH 7.0, 200 mM KAC, 15 mM MgAC2, 5 mM GTP, 2 mM EDTA, 1 mM DTT, 0.5% Triton X-100; D, 50 mMTris-HCl, pH 7.5, 50 mM KCl, 2.5 mM MgCl2, 0.5 mM GTP, 5% glycerol; E, 50 mM Hepes, pH 7.2, 2 M KCl, 10 mM MgCl2, 0.5 mM GTP.TmFtsZ,Thermotoga maritimaFtsZ; EcFtsZ:Escherichia coliFtsZ; AzFtsZ,Azotobacter vinelandiiFtsZ; BsFtsZ:Bacillus subtilisFtsZ; HvFtsZ,Haloferax volcaniiFtsZ.bFtsZ was preincubated with 5 mM GTP at 37°C for 80 min.ca, this work; b, Fig. 4 of Mukherjee [1993]; c, Fig. 3a of de Boer et al. [1992]; d, Fig. 3b of de Boer et al. [1992]; e, Fig. 2e of Ray Chaudhuri[1992]; f, Fig. 7A of Wang et al. [1993]; g, Fig. 2B of Wang et al. [1996].
GTPase and Assembly of FtsZ 85

Paul E. Bishop, North Carolina State University, forAzotobacterDNA; Dr. Limin Zhang, Virginia Polytech-nic Institute, for theAzotobactercosmid library.
REFERENCES
Addinall, S.G., Bi, E.F., and Lutkenhaus, J. (1996): FtsZ ring formationin ftsmutants. J. Bacteriol. 178:3877–3884.
Beall, B., Lowe, M., and Lutkenhaus, J. (1988): Cloning and character-ization ofBacillus subtilishomologues ofEscherichia colicelldivision genesftsAandftsZ. J. Bacteriol. 170:4855–4864.
Bourne, H.R., Sanders, D.A., and McCormick, F. (1991): The GTPasesuperfamily: Conserved structure and molecular mechanism.Nature 349:117–127.
Bramhill, D. and Thompson, C.M. (1994): GTP-dependent polymeriza-tion of Escherichia coliFtsZ protein to form tubules. Proc. Natl.Acad. Sci. U.S.A. 91:5813–5817.
Brennan, K.J., and Hardeman, E.C. (1993): Quantitative analysis of thehumana-skeletal actin gene in transgenic mice. J. Biol. Chem.268:719–725.
Cayley, S., Lewis, B.A., Guttman, H.J., and Record, M.T., Jr. (1991):Characterization of the cytoplasm ofEscherichia coliK-12 as afunction of external osmolarity: Implications for protein–DNAinteractions in vivo. J. Mol. Biol. 222:281–300.
Dai, K., and Lutkenhaus, J. (1992): The proper ratio of FtsZ to FtsA isrequired for cell division to occur inEscherichia coli. J.Bacteriol. 174:6145–6151.
de Boer, P., Crossley, R., and Rothfield, L. (1992): The essentialbacterial cell division protein FtsZ is a GTPase. Nature 359:254–256.
Donachie, W.D., Begg, K.J., and Vicente, M. (1976): Cell length, cellgrowth and cell division. Nature 264:328–333.
Erickson, H.P. (1974): Assembly of microtubules from preformed,ring-shaped protofilaments and 6-S tubulin. J. Supramol. Struct.2:393–411.
Erickson, H.P. (1997): FtsZ, a tubulin homolog, in prokaryote celldivision. Trends Cell Biol. 7:362–367.
Erickson, H.P., and O’Brien, E.T. (1992): Microtubule dynamicinstability and GTP hydrolysis. Annu. Rev. Biophys. Struct.Biol. 21:145–166.
Erickson, H.P., and Stoffler, D. (1996): Protofilaments and rings, twoconformations of the tubulin family conserved from bacterialFtsZ toa/b and gamma tubulin. J. Cell Biol. 135:5–8.
Erickson, H.P., and Voter, W.A. (1976): Polycation-induced assemblyof purified tubulin. Proc. Natl. Acad. Sci. U.S.A. 73:2813–2817.
Erickson, H.P., Taylor, D.W., Taylor, K.A., and Bramhill, D. (1996):Bacterial cell division protein FtsZ assembles into protofilamentsheets and minirings, structural homologs of tubulin polymers.Proc. Natl. Acad. Sci. U.S.A. 93:519–523.
Foster, J.F., and Sterman, M.D. (1956): Conformation change in bovineplasma albumin associated with hydrogen ion and urea binding.II. Hydrogen ion titration curves. Journal of the AmericanChemical Society 78:3656–3660.
Fowler, W.E., and Erickson, H.P. (1979): Trinodular structure offibrinogen. Confirmation by both shadowing and negative stainelectron microscopy. J. Mol. Biol. 134:241–249.
Gill, S.C., and Von Hippel, P.H. (1989): Calculation of proteinextinction coefficients from amino acid sequence data. Anal.Biochem. 182:319–326.
Hinshaw, J.E., and Schmid, S.L. (1995): Dynamin self-assembles intorings suggesting a mechanism for coated vesicle budding [seecomments]. Nature 374:190–192.
Kubitschek, H.E. (1986): Increase of cell mass during the divisioncycle ofEscherichia coliB/rA. J. Bacteriol. 168:613–618.
Lowe, J., and Amos, L.A. (1998): Crystal structure of the bacterialcell-division protein FtsZ. Nature 391:203–206.
Ma, X., Ehrhardt, D.W., and Margolin, W. (1996): Colocalization ofcell division proteins FtsZ and FtsA to cytoskeletal structures inliving Escherichia colicells by using green fluorescent protein.Proc. Natl. Acad. Sci. U.S.A. 93:12998–13003.
Margolin, W., Corbo, J.C., and Long, S.R. (1991): Cloning andcharacterization of aRhizobium melilotihomolog of theEsch-erichia colicell division geneftsZ. J. Bacteriol. 173:5822–5830.
Margolin, W., and Long, S.R. (1994):Rhizobium meliloticontains anovel 2nd homolog of the cell division geneftsZ. J. Bacteriol.176:2033–2043.
Mukherjee, A., Dai, K., and Lutkenhaus, J. (1993):Escherichia colicell division protein FtsZ is a guanine nucleotide bindingprotein. Proc. Natl. Acad. Sci. U.S.A. 90:1053–1057.
Mukherjee, A., and Lutkenhaus, J. (1994): Guanine nucleotide-dependent assembly of FtsZ into filaments. J. Bacteriol. 176:2754–2758.
Nogales, E., Wolf, S.G., and Downing, K.H. (1998): Structure of theab tubulin dimer by electron crystallography. Nature 391:199–203.
O’Brien, E.T., Voter, W.A., and Erickson, H.P. (1987): GTP hydrolysisduring microtubule assembly. Biochemistry 26:4148–4156.
Ochman, H., Gerber, A.S., and Hartl, D.L. (1988): Genetic applicationsof an inverse polymerase chain reaction. Genetics 120:621–623.
Pla, J., Sanchez, M., Palacios, P., Vicente, M., and Aldea, M. (1991):Preferential cytoplasmic location of FtsZ, a protein essential forEscherichia coliseptation. Mol. Microbiol. 5:1681–1686.
RayChaudhuri, D., and Park, J.T. (1992): Escherichia coli cell-divisiongeneftsZ encodes a novel GTP-binding protein. Nature 359:251–254.
Rittinger, K., Walker, P.A., Eccleston, J.F., Smerdon, S.J., and Gam-blin, S.J. (1997): Structure at 1.65 A˚ of RhoA and its GTPase-activating protein in complex with a transition-state analogue.Nature 389:758–761.
Scheffzek, K., Ahmadian, M.R., Kabsch, W., Wiesmu¨ller, L., Lautwein,A., Schmitz, F., and Wittinghofer, A. (1997): The Ras–RasGAPcomplex: structural basis for GTPase activation and its loss inoncogenic ras mutants. Science 277:333–345.
Smith, P.K., Krohn, R.I., Hermanson, G.T., Mallia, A.K., Gartner, F.H.,Provenzano, M.D., Fujimoto, E.K., Goeke, N.M., Olson, B.J.,and Klink, D.C. (1986): Measurement of protein using bicin-chonic acid. Anal. Biochem. 150:76–85.
Trueba, F.J. and Woldringh, C.L. (1980): Changes in cell diameterduring the division cycle ofEscherichia coli. J. Bacteriol.142:869–878.
Tuma, P.L., Stachniak, M.C., and Collins, C.A. (1993): Activation ofdynamin GTPase by acidic phospholipids and endogenous ratbrain vesicles. J. Biol. Chem. 268:17240–17246.
Wang, X., and Lutkenhaus, J. (1993): The FtsZ protein ofBacillussubtilis is localized at the division site and has GTPase activitythat is dependent upon FtsZ concentration. Mol. Microbiol.9:435–442.
Wang, X., and Lutkenhaus, J. (1996): FtsZ ring: The eubacterialdivision apparatus conserved in archaebacteria. Mol. Microbiol.21:313–319.
Wang, X.D., Huang, J.A., Mukherjee, A., Cao, C., and Lutkenhaus, J.(1997): Analysis of the interaction of FtsZ with itself, GTP, andFtsA. J. Bacteriol. 179:5551–5559.
Warnock, D.E., Hinshaw, J.E., and Schmid, S.L. (1996): Dynaminself-assembly stimulates its GTPase activity. J. Biol. Chem.271:22310–22314.
Yu, X.C., and Margolin, W. (1997): Ca21-mediated GTP-dependentdynamic assembly of bacterial cell division protein FtsZ intoasters and polymer networksin vitro. EMBO J. 16:5455–5463.
86 Lu et al.