ftse - momentum factor · ftse russell factor exposure indexes – momentum factor 3 correlation in...
TRANSCRIPT
Factor exposure indexesMomentum factor
ftserussell.com August 2014
Research

FTSE Russell | Factor exposure indexes – momentum factor 1
SummaryIn this paper we construct and investigate the properties and robustness of a set of momentum factors. We also construct illustrative indexes, based on a preferred momentum definition and show that the resulting indexes exhibit a substantial exposure to momentum and relatively low levels of turnover.
We identify candidate momentum factors from a survey of the academic literature and current market practice. The candidate factors are assessed and formation and holding periods examined for the FTSE Developed universe over the period 2001 – 2014.
We note that absolute momentum may be decomposed into three component measures; namely stock specific momentum; momentum resulting from systematic risk factor exposures; and residual momentum linked to stock specific shocks.
Stock specific return (Alpha) is used to capture stock specific momentum, whilst the Residual Sharpe Ratio captures momentum linked to stock specific news. Each momentum factor shows robust performance across regions. Furthermore, each factor appears to exhibit a degree of independence.
We also consider three factors that broadly capture absolute or total momentum; the one-year cumulative return (Return); the one-year Sharpe Ratio; and the ratio of the current price to the highest price over the last 12 months (the CH12 Ratio). We note that all three measures, by construction will exhibit exposure to systematic risk factors that have performed well over the momentum formation period. Consequently, indexes premised on such measures of momentum are likely to experience significant reversals in exposure to systematic risk factors.
Measures of momentum based on raw returns have historically shown strong risk adjusted performance outcomes that are not primarily the result of country or industry effects. We prefer cumulative return measures of momentum to Sharpe Ratio measures, despite both exhibiting similar historical risk adjusted performance outcomes, since the latter has historically displayed substantial industry and country effects. The simulated performance outcomes of Return and CH12 Ratio are very similar; however the CH12 Ratio results in outcomes with a substantial bias (low beta) to systematic factors.
Our preferred measure of momentum is the Residual Sharpe Ratio, which displays relatively high risk-adjusted performance outcomes, and relatively low levels of volatility and turnover. In contrast to traditional measures of momentum, the Residual Sharpe Ratio shows limited time-varying exposure to other systematic factors.
Finally, we construct illustrative indexes based on the Residual Sharpe Ratio and show that they exhibit substantial exposure to momentum and relatively low levels of turnover.

FTSE Russell | Factor exposure indexes – momentum factor 2
1. The momentum effectThe momentum effect relies on a continuation of past patterns of stock returns. The capture of any momentum effect requires the selection of stocks based on past return or return related metrics in the expectation that such performance patterns are repeated in the future. Typically, stock performance over some past period, excluding the most recent monthly return is employed as the criterion to select stocks. The practice of ignoring the most recent performance when constructing a momentum factor is an attempt to avoid conflating momentum with short-term reversal effects. In this section we review the momentum literature; both from the perspective of assessing evidence for the existence of a momentum effect and from attempts to rationalize its existence.
1.1 Evidence of a momentum effectThe empirical literature examining evidence for a momentum effect is vast. Levy (1967) highlights that, stocks with higher than average past returns exhibit significant abnormal future returns. Subsequently, Grinblatt and Titman (1989), Jegadeesh and Titman (1993) and Chan, Jegadeesh and Lakonishok (1996), find that momentum is a useful indicator of future performance, that is not subsumed by market risk, size or value.
Later studies examine the effectiveness of momentum in risk adjusted performance metrics in contrast to momentum in raw returns. Biglova et al. (2004) find that risk adjusted momentum measures including the Sharpe Ratio exhibit improvements in risk adjusted performance compared to simple return based momentum factors. Bornholt and Malin (2011) show that adding volatility and other risk metrics to momentum strategies is effective. Liu et al (2010) examine measures comparing the current price to prior highs.
Momentum approaches incur high levels of turnover. Consequently, an important practical consideration is the extent of any momentum effect net of transaction costs. Li, Brooks and Miffre (2009) find that momentum effects are disproportionately concentrated amongst small and illiquid stocks. Korajczyk and Sadka (2003) show that liquidity weighted momentum strategies are superior to a capitalisation weighted approach, both in terms of abnormal returns net of transaction costs and in improving capacity.
1.2 Explanations of the momentum effectA key consideration in developing explanations for the momentum effect is the level at which momentum arises; is momentum primarily an industry, country, or stock level effect? Moskowitz and Grinblatt (1999) and Sefton and Scowcroft (2005) find that momentum in the US is largely an industry effect. In contrast, Nijman et al (2004) conclude that momentum in Europe is largely a stock effect.
Daniel, Hirschleifer, and Subrahmanyam (1998) and Barberis, Shleifer and Vishny (1998) develop a behavioural finance rationale for the existence of momentum effects, founded on investor under and over-reaction to news. Jegadeesh and Titman (2000) assume that returns are driven by a one-factor model and show analytically that momentum profits have three possible origins; the degree of cross-sectional dispersion in expected returns; the ability to time momentum; and the degree of serial

FTSE Russell | Factor exposure indexes – momentum factor 3
correlation in idiosyncratic stock returns. If momentum arises primarily from the first or second sources, then momentum profits may be interpreted as compensation for bearing systematic risk. However, if momentum arises from the third source, then momentum effects may be attributed to market inefficiency.
Momentum effects may also have more prosaic origins; the seasonality of momentum effects is well documented, exhibiting a persistent January effect that is attributed to tax-loss harvesting and window dressing behaviour by investors, see Debondt and Thaler (1985), Jegadeesh and Titman (1993), and Chu, Liu and Rathinasamy (2004).
2. Definitions of momentumMomentum is typically defined as the cumulative stock return over some prior time frame ignoring the most recent period of performance. A precise definition of momentum requires design choices from several perspectives:
• Does currency play a role in momentum – should returns be calculated in local or a common currency?
• Is the distinction between price (capital) and total returns important?
• Is momentum a stock, industry or country effect?
• Do momentum effects exist for risk-adjusted metrics in addition to return measures?
• To what degree are risk adjusted measures of momentum independent of price momentum?
• What is the appropriate formation period, i.e. over what past period should past performance be calculated?
• What are the appropriate holding and rebalancing periods?
• How important are short term reversal effects? What period of recent performance should be ignored in order to avoid conflating reversal and momentum effects?
Table 1 on the next page summarises common approaches to momentum used by academics and practitioners.
2.1 Momentum definitions in the academic literatureIn order to avoid contaminating momentum effects with currency fluctuations when examining momentum in an international context, we restrict our investigation to local currency measures of momentum. Chan, Hameed and Tong (2000) find statistically significant evidence for international momentum effects and conclude that momentum is primarily a stock phenomenon, with exchange rate dynamics playing almost no role. This suggests that the choice over local or common currency factors of momentum is unimportant. Common currency measures of momentum are used by Rouwenhorst (1998) and Nijman et al (2004), while local measures are used by Leipold and Lohre (2012), Bacmann et al (2001) and Liu et al (2010).
The majority of academic and practitioner approaches to momentum utilise total returns; the exception being MSCI who use capital returns. Furthermore, an absolute measure of return is the most common definition of momentum. Excess

FTSE Russell | Factor exposure indexes – momentum factor 4
industry returns are examined by Moskowitz and Grinblatt (1999). Other studies consider risk-adjusted measures of momentum; for example Biglova et al (2004) and MSCI (Sharpe Ratio). Liu et al (2010) define momentum as the ratio of the current price to the past 52-week high. This approach to momentum appears to be independent of industry effects.
Guiterrez and Pitinsky (2007) and Blitz et al (2011) study residual measures of momentum for US stocks, finding risk-adjusted performance substantially in excess of that generated by absolute return measures of momentum.
Table 1. Summary of momentum definitions in the academic literature
Source CurrencyRegion/ Country Return Measure
Formation Period (month)
Holding Period (month)
Reversal Period Remarks
Jegadeesh 1993 – US Total Absolute 9, 12 6 1 Week –
Chan 1996 – US Total Absolute 6 6, 12 None –
Moskowitz 1999 – US Total Absolute/Excess Industry
1 1 1 Month Industry phenomenon in US
Rouwenhorst 1998 Common Europe Total Absolute 9, 12 6 1 Week –
Nijman 2004 Common Europe Total Absolute 6 6 None Stock phenomenon in Europe
Leippold 2012 Local Developed Total Absolute 6 6 None –
Chan 2000 Local and Common
Developed Total Absolute 12 6 None Results insensitive to currency choice
Bacmann 2001 Local G7 Total Absolute 12 12 None –
Liu 2010 Local 20 Countries
Total Price to highest price over last year
12 6 1 Month Independent of common measures
Guiterrez 2007 – US Total Systematic/Residual
60 6 1 Month Residual momentum shows greater persistence
Blitz 2011 – US Total Absolute/Residual
36 1 1 Month Residual momentum exhibits higher risk-adjusted outcomes
Biglova 2004 – Germany Total Risk-Reward Ratio
12 6 None Risk-reward metrics exhibit higher risk adjusted outcomes
FTSE Russell | Factor exposure indexes – momentum factor 5
The ratio of the current price to the 52-week high is examined in a US context by George and Hwang (2004). They conclude that this ratio contains incremental information to traditional momentum factors and suggest an under-reaction explanation. A number of later studies confirm the predictive power of this factor in both US and international markets; see Liu et al (2010) for a detailed literature survey.
The majority of studies use momentum factors formed (formation periods) over six, nine or 12 months and holding periods of six or 12 months. Jegadeesh and Titman (1993) examine formation and holding periods from a US perspective and conclude that nine and 12 month formation and six month holding periods exhibit the strongest momentum effects. Rouwenhorst (1998) in an international context confirms these results, highlighting nine and 12 month formation periods and a six month holding period.
Typically a one-month period between the construction of any momentum factor and its incorporation is used to mitigate reversal effects. Jegadeesh and Titman (1993) allow a one-week lag; no lag is used by Nijman et al (2004), Leippold (2012), or Biglova et al (2004).
Section 2.2 reviews the momentum definitions of other index providers. Section 3.1 proposes specific momentum definitions drawn from the academic literature and used by practitioners, which we use as a starting point for our empirical investigations.
2.2 Index provider momentum definitionsThe MSCI Momentum indexes utilise two Sharpe Ratio measures of momentum. Six and 12 month local capital returns after excluding the most recent month and the annualised standard deviation of weekly local capital returns over a three-year period are combined. The premise of the MSCI Momentum indexes is that momentum in risk/reward measures is superior to the use of momentum in return measures. There is support for this approach in the literature – see Biglova et al. (2004) and Bornholt and Malin (2011).
The S&P 1500 Positive Momentum Tilt Index uses a more traditional approach, defining momentum as the 11 month total return to the month prior to the rebalance month.
The Russell-Axioma Momentum Indexes follow a two stage process. Initially, naïve factor indexes are constructed using the cumulative 250 trading day performance excluding the last 20 trading days. Stage two applies an optimisation approach to derive narrower indexes that track the performance of the naïve factor index whilst controlling for turnover and exposure to other risk factors.
3. Empirical results
3.1 Testing momentum definitionsFrom a review of the academic literature and current commercial practices, we test empirically the following measures of momentum:
• Local 12 month total returns, after excluding the most recent month (Return).
FTSE Russell | Factor exposure indexes – momentum factor 6
• Sharpe Ratio based on local total 12 month returns, after excluding the most recent month. Annualised volatility is calculated using daily returns over the same period (Sharpe Ratio).
• The ratio of the current local price to the highest local price over the previous 52 weeks, excluding the most recent month (CH12 Ratio).
Grundy and Martin (2001), Chordia and Shivakumar (2002) and Blitz et al (2011) note that raw return momentum strategies have time-varying exposure to systematic risk factors (e.g. market beta). A raw return measure of momentum for example, will tilt towards high-beta stocks if the market is rising over the momentum formation period and conversely towards low-beta stocks if the market is falling.
Consequently, we also examine momentum factors designed to avoid time-varying market exposure. We use the following risk model to separate systematic and non-systematic sources of return:
Rt = α + Σk βkFkt+εt (1)
where Rt is the stock local total return in period t; α is the stock specific return not explained by the risk factors ; βk is the stock exposure to risk factor k; Fkt is the return to risk factor k in period t, and εt is the residual return. We include two risk factors – the country return and global industry return respectively. We investigate momentum in two non-systematic sources of return; stock specific return (α) and residual return (εt).
We use the Residual Sharpe Ratio measure proposed by Blitz et al (2011). The Residual Sharpe Ratio captures firm specific news that influences future returns. Gutierrez and Pirinsky (2007) and Blitz et al (2011) argue that standardising residual returns (Residual Sharpe Ratio) leads to an improved assessment of whether firm specific return shocks are news as opposed to noise. We calculate the Residual Sharpe measure of momentum in the following manners:
• Estimate equation (1) using 36 months of local total returns on rolling monthly basis for the 11 months prior to factor construction month. Each month, we calculate the average residual return for the most recent 12 months. The mean and standard deviation of the 11 month time-series of average values forms the residual momentum measure (Residual Sharpe Ratio).
The remaining source of momentum is the stock specific return. Gutierrez and Pirinsky (2007) and Blitz et al (2011) suggest that alpha should be ignored, since it captures any misspecification of the risk model. However, conditional on the given risk model, alpha may be interpreted as the stock specific return that is not the result of systematic risk factor exposures. We calculate the stock specific measure of momentum as follows:
• Estimate the annualised stock specific return from equation (1) using one-year of daily local total returns excluding the most recent month (Alpha).
The Return, Sharpe Ratio, and the CH12 Ratio measures of momentum represent total momentum measures, where momentum is predominantly a reflection of exposure to systemic risk factors, whilst Alpha and the Residual Sharpe Ratio capture momentum effects that do not originate from systematic risk exposures.

FTSE Russell | Factor exposure indexes – momentum factor 7
3.1.1 Formation periodsWe begin by investigating formation and holding periods. Table 1 indicates that the most common formation periods used in the academic literature are six and 12 months.
We first perform tests on the length of the formation period for the Return, Sharpe Ratio, and CH12 Ratio measures of momentum. We rank FTSE Developed constituents on each momentum factor calculated over formation periods of varying length into quartiles. Each quartile contains equal numbers of stocks and we assess the performance of the top (high momentum) and bottom quartiles (low momentum). Stocks are weighted by free-float market capitalisation within quartiles, held for six months, and rebalanced on a March / September rebalance cycle. Chart 1 shows the spread in annualised Sharpe Ratios of the resulting momentum quartiles. All performance metrics in this paper are based on USD total returns.
Chart 1. Sharpe Ratio: Momentum measures with variable formation periods
3 6 9 12 15 18 21 24 27 30 33 36 39 42 45 48 51 54 57 60
0
0.1
-0.1
0.2
0.3
0.4
0.5
0.6
Length of Formation Period in Months
Sha
rpe
Rat
io (p
.a.)
� Current to Highest Ratio � Sharpe Ratio � Return
Source FTSE Russell: FTSE Developed, March 2001 to January 2014, USD Total Return. Past performance is no guarantee of future results. Returns shown may reflect hypothetical historical performance. Please see the disclaimer page for important legal disclosures.
Chart 1 indicates that outcomes for the Return and Sharpe Ratio momentum factors are broadly maximised and stable over formation periods of nine to 12 months. The CH12 Ratio achieves marginally superior outcomes at longer formation periods, peaking at 45 months. However, the striking feature of the CH12 Ratio results is their stability over a wide range of formation periods. A 12 month formation period for this factor results in comparable outcomes. Given

FTSE Russell | Factor exposure indexes – momentum factor 8
the robustness of these results, we prefer to use a common formation period of 12 months for the Return, Sharpe Ratio, and CH12 Ratio measures of momentum. Our findings in this section hold, irrespective of whether an equally-weighted or a market capitalisation weighting scheme is used.
Blitz et al (2011) effectively use a 12 month formation period to estimate the Residual Sharpe Ratio. The rolling regression methodology appears designed to overcome the mean zero property associated with the regression residuals and allow a non-zero residual return value to be assigned to each month. They find that the performance of the Residual Sharpe Ratio measure is robust to alternative estimation windows. We follow this approach and use a formation period of 12 months excluding the last month for the Residual Sharpe Ratio. This is consistent with the formation periods used for Return, Sharpe Ratio and the CH12 Ratio momentum measures. The estimation of Alpha does not require the rolling regression approach, since the difficulty associated with the mean zero residual return property does not arise. Consequently, we simply estimate equation (1) for the most recent 12 months, after excluding the most recent month, using returns on a daily frequency to determine the stock specific momentum measure (Alpha).
3.1.2 Holding periodsConditional on a 12 month formation period for Return, Sharpe Ratio, and the CH12 Ratio, we investigate holding periods for each of the three absolute momentum measures, for the FTSE Developed universe. We follow the same process used to examine formation periods, ranking FTSE Developed constituents into quartiles containing equal numbers of stocks on each momentum measure calculated over a 12 month formation period. We assess the performance of the top (high momentum) and bottom quartiles (low momentum) over various holding periods. Stocks are weighted by free-float market capitalisation within quartiles.

FTSE Russell | Factor exposure indexes – momentum factor 9
Chart 2. Sharpe Ratio: Momentum measures with variable holding period
2 3 4 5 6 7 8 9 10 11 12 13 14 15 16 17 18 19 20 21 22 23 24 27 30 33 36
0
0.1
-0.1
0.2
0.3
0.4
0.5
0.6
0.7
Length of Holding Period in Months
Sha
rpe
Rat
io (p
.a.)
� Returns � CH12 Ratio � Sharpe Ratio
Source FTSE Russell: FTSE Developed, March 2001 to January 2014, USD Total Return. Past performance is no guarantee of future results. Returns shown may reflect hypothetical historical performance. Please see the disclaimer page for important legal disclosures.
Chart 2 indicates that a six-month holding period for the Return factor is sensible. A six-month holding period also results in strong outcomes in terms of Sharpe Ratios for both the CH12 Ratio and the Sharpe Ratio momentum factors. Other holding periods generate marginally superior outcomes, but lie in areas where outcomes are unstable and additionally, would require an index to be rebalanced on an irregular cycle i.e. a different month each year. We conclude that common holding and formation periods of six and 12 months respectively, are preferred for Return, Sharpe Ratio, and CH12 Ratio momentum measures.
We repeat the above holding period analysis for the Residual Sharpe Ratio and Alpha measures of momentum.
FTSE Russell | Factor exposure indexes – momentum factor 10
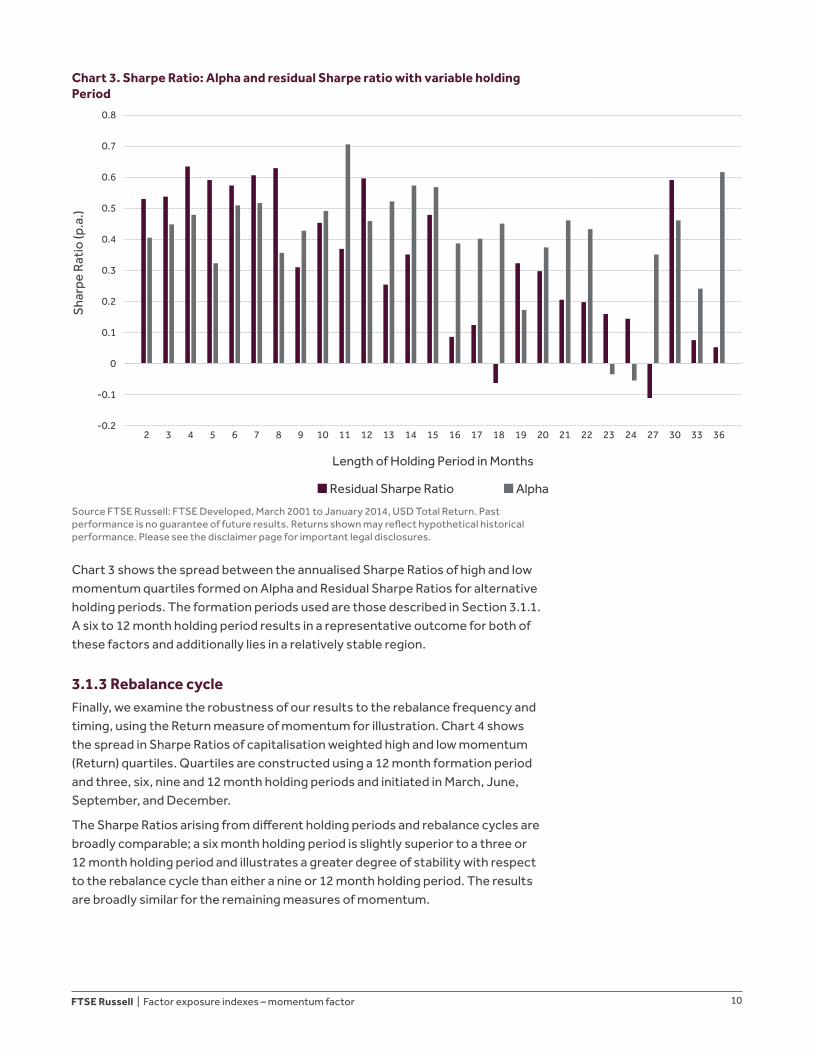
Chart 3. Sharpe Ratio: Alpha and residual Sharpe ratio with variable holding Period
2 3 4 5 6 7 8 9 10 11 12 13 14 15 16 17 18 19 20 21 22 23 24 27 30 33 36
-0.1
-0.2
0
0.1
0.2
0.3
0.4
0.5
0.6
0.7
0.8
Length of Holding Period in Months
Sha
rpe
Rat
io (p
.a.)
� Residual Sharpe Ratio � Alpha
Source FTSE Russell: FTSE Developed, March 2001 to January 2014, USD Total Return. Past performance is no guarantee of future results. Returns shown may reflect hypothetical historical performance. Please see the disclaimer page for important legal disclosures.
Chart 3 shows the spread between the annualised Sharpe Ratios of high and low momentum quartiles formed on Alpha and Residual Sharpe Ratios for alternative holding periods. The formation periods used are those described in Section 3.1.1. A six to 12 month holding period results in a representative outcome for both of these factors and additionally lies in a relatively stable region.
3.1.3 Rebalance cycleFinally, we examine the robustness of our results to the rebalance frequency and timing, using the Return measure of momentum for illustration. Chart 4 shows the spread in Sharpe Ratios of capitalisation weighted high and low momentum (Return) quartiles. Quartiles are constructed using a 12 month formation period and three, six, nine and 12 month holding periods and initiated in March, June, September, and December.
The Sharpe Ratios arising from different holding periods and rebalance cycles are broadly comparable; a six month holding period is slightly superior to a three or 12 month holding period and illustrates a greater degree of stability with respect to the rebalance cycle than either a nine or 12 month holding period. The results are broadly similar for the remaining measures of momentum.

FTSE Russell | Factor exposure indexes – momentum factor 11
Chart 4. Sharpe Ratio: Momentum with variable holding period and starting month
3 6 9 120
0.1
0.2
0.3
0.4
0.5
0.6
Length of Holding Period in Months
Sha
rpe
Rat
io (p
.a.)
� Start in Mar � Start in Jun � Start in Sep � Start in Dec
Source FTSE Russell: FTSE Developed, March 2001 to January 2014, USD Total Return. Past performance is no guarantee of future results. Returns shown may reflect hypothetical historical performance. Please see the disclaimer page for important legal disclosures.
We therefore conclude that a common 12 month formation and six month holding period is appropriate for all factors. Furthermore these choices are robust to the timing of the rebalance cycle and we therefore restrict our attention in the remainder of this paper to a March/September rebalance cycle for all quartile based analysis.
3.1.4 Momentum effectsWe use the results in 3.1.1-3.1.3 to fix the formation and holding periods and examine the performance of each of the candidate definitions of momentum detailed in 3.1. We employ the same approach, sorting the constituents of the FTSE Developed universe in March and September into quartiles containing equal numbers of stocks for each momentum definition. The stocks in each quartile are weighted by their investable market capitalisation.
For each of the three absolute momentum definitions (Return, Sharpe Ratio and CH12 Ratio), the analysis is conducted at three levels; an absolute level; momentum in excess of the relevant country; and momentum in excess of the relevant global industry. The Residual Sharpe Ratio and Alpha measures are estimated using a two-factor (country and global industry) risk model. Hence momentum is in excess of country and industry by construction and therefore only one set of results is presented.

FTSE Russell | Factor exposure indexes – momentum factor 12
Table 2. Annualised spread in Sharpe ratios for candidate momentum measures
FTSE Developed World FTSE US
AbsoluteExcess of
CountryExcess of Industry Absolute
Excess of Country
Excess of Industry
Return 0.39 0.34 0.54 0.27 0.27 0.20
Sharpe Ratio 0.46 0.33 0.36 0.33 0.33 0.12
CH12 Ratio 0.37 0.39 0.36 0.20 0.20 0.21
Alpha 0.51 0.24
Residual Sharpe 0.53 0.38
FTSE Developed Europe FTSE Developed Asia Pacific
AbsoluteExcess of
CountryExcess of Industry Absolute
Excess of Country
Excess of Industry
Return 0.40 0.44 0.51 0.29 0.19 0.29
Sharpe Ratio 0.33 0.36 0.14 0.33 -0.08 0.23
CH12 Ratio 0.30 0.37 0.26 0.31 0.26 0.20
Alpha 0.48 0.26
Residual Sharpe 0.53 0.01
Source FTSE Russell: FTSE Developed, FTSE US, FTSE Developed Europe & FTSE Developed Asia Pacific; March 2001 to January 2014, USD Total Returns. Semi-annual rebalance. Past performance is no guarantee of future results. Returns shown may reflect hypothetical historical performance. Please see the disclaimer page for important legal disclosures.
Results are reported for each of the following regions: FTSE Developed, FTSE US, FTSE Developed Europe, and FTSE Developed Asia Pacific. Table 2 reports the difference in the resulting Sharpe Ratios of the high and low quartile momentum baskets. The Return, Sharpe Ratio and CH12 Ratio momentum factors all result in relatively high Sharpe ratio outcomes, albeit that the latter typically has lower outcomes.
The Return and the CH12 Ratio factors both appear to be primarily stock level effects, since outcomes are robust to construction in excess of industry or country momentum. In contrast, whilst the Sharpe Ratio measure results in comparable high absolute outcomes, this appears to be primarily an industry effect in the US and Europe and a country effect in the Asia Pacific region. The one-year Alpha factor results in high Sharpe Ratios in all regions. The Residual Sharpe Ratio measure displays strong outcomes in all regions except for Asia Pacific.
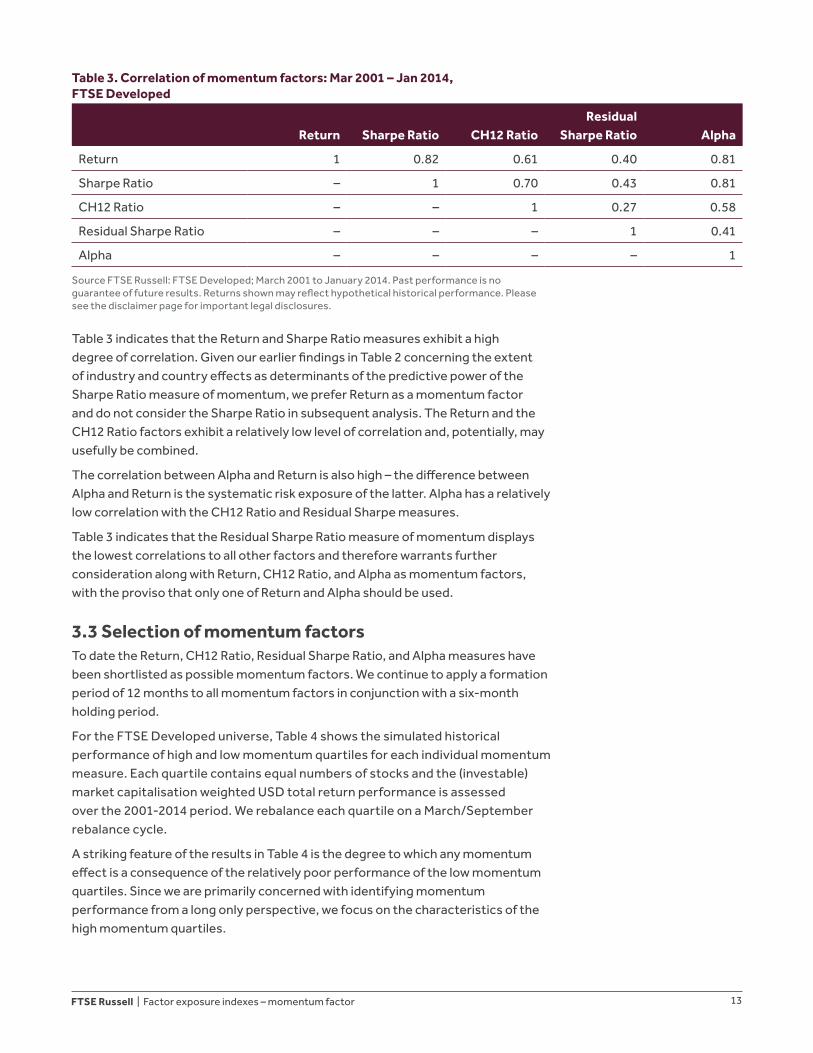
3.2 Independent momentum effectsIn this section we assess the degree of independence exhibited by the candidate momentum factors. From 2001 to 2014 in March and September, we calculate the cross-sectional correlation between each pair of momentum factors. Table 3 reports the mean cross-sectional correlation for each pair of momentum factors. These results are robust to the use of a rank correlation measure.
FTSE Russell | Factor exposure indexes – momentum factor 13
Table 3. Correlation of momentum factors: Mar 2001 – Jan 2014, FTSE Developed
Return Sharpe Ratio CH12 RatioResidual
Sharpe Ratio Alpha
Return 1 0.82 0.61 0.40 0.81
Sharpe Ratio – 1 0.70 0.43 0.81
CH12 Ratio – – 1 0.27 0.58
Residual Sharpe Ratio – – – 1 0.41
Alpha – – – – 1
Source FTSE Russell: FTSE Developed; March 2001 to January 2014. Past performance is no guarantee of future results. Returns shown may reflect hypothetical historical performance. Please see the disclaimer page for important legal disclosures.
Table 3 indicates that the Return and Sharpe Ratio measures exhibit a high degree of correlation. Given our earlier findings in Table 2 concerning the extent of industry and country effects as determinants of the predictive power of the Sharpe Ratio measure of momentum, we prefer Return as a momentum factor and do not consider the Sharpe Ratio in subsequent analysis. The Return and the CH12 Ratio factors exhibit a relatively low level of correlation and, potentially, may usefully be combined.
The correlation between Alpha and Return is also high – the difference between Alpha and Return is the systematic risk exposure of the latter. Alpha has a relatively low correlation with the CH12 Ratio and Residual Sharpe measures.
Table 3 indicates that the Residual Sharpe Ratio measure of momentum displays the lowest correlations to all other factors and therefore warrants further consideration along with Return, CH12 Ratio, and Alpha as momentum factors, with the proviso that only one of Return and Alpha should be used.
3.3 Selection of momentum factorsTo date the Return, CH12 Ratio, Residual Sharpe Ratio, and Alpha measures have been shortlisted as possible momentum factors. We continue to apply a formation period of 12 months to all momentum factors in conjunction with a six-month holding period.
For the FTSE Developed universe, Table 4 shows the simulated historical performance of high and low momentum quartiles for each individual momentum measure. Each quartile contains equal numbers of stocks and the (investable) market capitalisation weighted USD total return performance is assessed over the 2001-2014 period. We rebalance each quartile on a March/September rebalance cycle.
A striking feature of the results in Table 4 is the degree to which any momentum effect is a consequence of the relatively poor performance of the low momentum quartiles. Since we are primarily concerned with identifying momentum performance from a long only perspective, we focus on the characteristics of the high momentum quartiles.

FTSE Russell | Factor exposure indexes – momentum factor 14
The performance of all high momentum quartiles is similar; all high momentum quartiles display relatively low levels of volatility and drawdown compared to low momentum quartiles.
Table 4 highlights an important difference between absolute or systematic measures of momentum (Return and the CH12 Ratio) and non-systematic measures (Alpha and Residual Sharpe Ratio); the former display slightly superior return and risk adjusted performance outcomes, but exhibit higher turnover and substantially greater systematic risk biases. Amongst absolute momentum measures, the CH12 Ratio displays higher levels of turnover and substantially greater market exposure imbalances than the Return measure. A comparison of Alpha and Residual Sharpe Ratio favours the latter in terms of turnover.
The results in Table 4 do not provide conclusive empirical evidence for the selection of a particular momentum factor or whether an absolute measure of momentum is preferable to a non-systematic measure of momentum. Absolute and non-systematic measures of momentum may be viewed as different forms of momentum.
The selection of a momentum factor depends on preferences regarding the desirability of embedding dynamic systematic risk exposures in a momentum measure. Given our desire to avoid time-varying exposure to systematic factors, the similarity in performance outcomes across high momentum quartiles and significantly lower turnover, we focus on the Residual Sharpe Ratio measure of momentum.
Table 4. Momentum factor performance: Mar 2001 – Jan 2014, FTSE Developed
Systematic Momentum Non-Systematic Momentum
FTSE Return CH12 Ratio Alpha Residual Sharpe Ratio
Dev High Low High Low High Low High Low
Return (% p.a.) 6.36 8.68 2.46 8.67 1.38 8.38 3.36 7.74 3.90
Volatility (% p.a.) 17.43 17.39 23.59 15.30 24.43 18.15 20.42 16.87 18.92
Sharpe Ratio (p.a.) 0.37 0.50 0.10 0.57 0.06 0.46 0.16 0.46 0.21
Max Drawdown (%) -57.37 -51.11 -73.08 -46.58 -72.82 -55.52 -69.01 -53.26 -62.70
Alpha (% p.a.) 2.13 -3.44 2.63 -4.46 1.63 -2.71 1.28 -2.12
Alpha t-stat 1.52 -1.52 2.22 -1.97 1.50 -1.80 1.73 -2.53
Beta 0.92 1.29 0.79 1.37 1.01 1.18 0.94 1.09
Two-way TO (% p.a.) 13.72 235.55 245.42 250.92 250.70 229.25 251.55 202.24 211.78
Source FTSE Russell: FTSE Developed, March 2001 to January 2014, USD Total Return. Past performance is no guarantee of future results. Returns shown may reflect hypothetical historical performance. Please see the disclaimer page for important legal disclosures.
4. Momentum index constructionUsing the Residual Sharpe Ratio measure of momentum, we construct a set of illustrative indexes using the methodology detailed in the paper ‘Factor Exposure Indices - Index Construction Methodology’, FTSE (2014). Briefly, we map the normalised momentum measure (Z-Score) to a score in the range of zero to one using a cumulative normal mapping. This score is then combined with a stock’s
FTSE Russell | Factor exposure indexes – momentum factor 15
weighting in an underlying index to determine individual stock weightings in the factor index. The approach is tantamount to a factor tilt on an underlying index, where the strength (and number) of any tilts and the degree of diversification may be controlled.
We examine the average factor exposure, Effective N, and capacity of the resulting factor index. Factor exposure is a relative measure, defined as the difference in the weighted sum of factor Z-Scores between a factor index and an underlying index. The Effective N1 shows the breadth of the index, measured by the effective number of stocks. We assess potential investment capacity using the weighted capacity ratio (WCR).
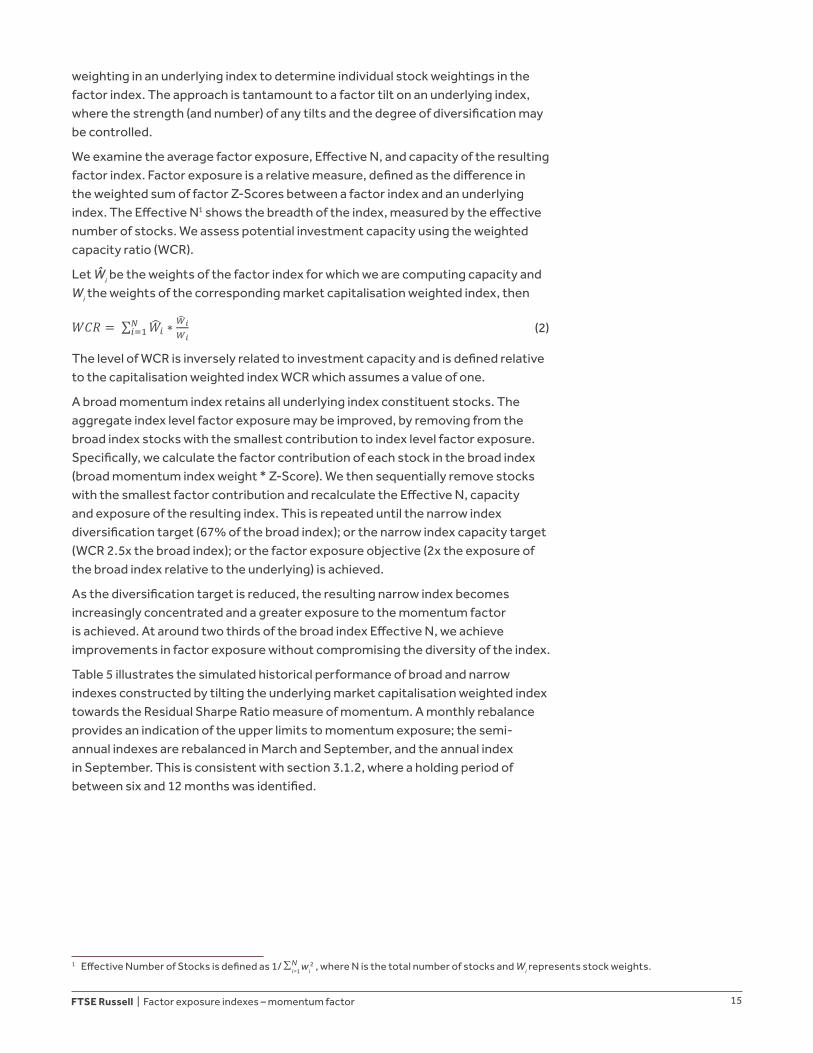
Let Ŵi be the weights of the factor index for which we are computing capacity and Wi the weights of the corresponding market capitalisation weighted index, then
(2)
The level of WCR is inversely related to investment capacity and is defined relative to the capitalisation weighted index WCR which assumes a value of one.
A broad momentum index retains all underlying index constituent stocks. The aggregate index level factor exposure may be improved, by removing from the broad index stocks with the smallest contribution to index level factor exposure. Specifically, we calculate the factor contribution of each stock in the broad index (broad momentum index weight * Z-Score). We then sequentially remove stocks with the smallest factor contribution and recalculate the Effective N, capacity and exposure of the resulting index. This is repeated until the narrow index diversification target (67% of the broad index); or the narrow index capacity target (WCR 2.5x the broad index); or the factor exposure objective (2x the exposure of the broad index relative to the underlying) is achieved.
As the diversification target is reduced, the resulting narrow index becomes increasingly concentrated and a greater exposure to the momentum factor is achieved. At around two thirds of the broad index Effective N, we achieve improvements in factor exposure without compromising the diversity of the index.
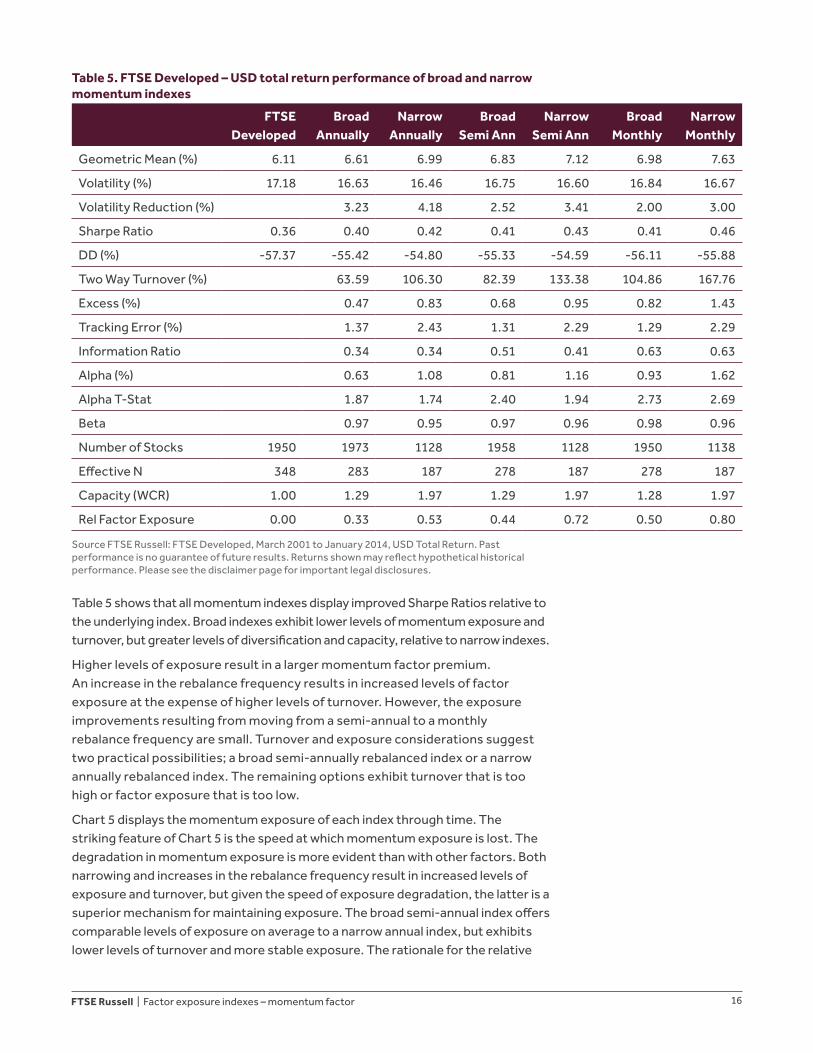
Table 5 illustrates the simulated historical performance of broad and narrow indexes constructed by tilting the underlying market capitalisation weighted index towards the Residual Sharpe Ratio measure of momentum. A monthly rebalance provides an indication of the upper limits to momentum exposure; the semi-annual indexes are rebalanced in March and September, and the annual index in September. This is consistent with section 3.1.2, where a holding period of between six and 12 months was identified.
1 Effective Number of Stocks is defined as 1/ ΣNi=1 wi
2 , where N is the total number of stocks and Wi represents stock weights.
FTSE Russell | Factor exposure indexes – momentum factor 16
Table 5. FTSE Developed – USD total return performance of broad and narrow momentum indexes
FTSE Developed
Broad Annually
Narrow Annually
Broad Semi Ann
Narrow Semi Ann
Broad Monthly
Narrow Monthly
Geometric Mean (%) 6.11 6.61 6.99 6.83 7.12 6.98 7.63
Volatility (%) 17.18 16.63 16.46 16.75 16.60 16.84 16.67
Volatility Reduction (%) 3.23 4.18 2.52 3.41 2.00 3.00
Sharpe Ratio 0.36 0.40 0.42 0.41 0.43 0.41 0.46
DD (%) -57.37 -55.42 -54.80 -55.33 -54.59 -56.11 -55.88
Two Way Turnover (%) 63.59 106.30 82.39 133.38 104.86 167.76
Excess (%) 0.47 0.83 0.68 0.95 0.82 1.43
Tracking Error (%) 1.37 2.43 1.31 2.29 1.29 2.29
Information Ratio 0.34 0.34 0.51 0.41 0.63 0.63
Alpha (%) 0.63 1.08 0.81 1.16 0.93 1.62
Alpha T-Stat 1.87 1.74 2.40 1.94 2.73 2.69
Beta 0.97 0.95 0.97 0.96 0.98 0.96
Number of Stocks 1950 1973 1128 1958 1128 1950 1138
Effective N 348 283 187 278 187 278 187
Capacity (WCR) 1.00 1.29 1.97 1.29 1.97 1.28 1.97
Rel Factor Exposure 0.00 0.33 0.53 0.44 0.72 0.50 0.80
Source FTSE Russell: FTSE Developed, March 2001 to January 2014, USD Total Return. Past performance is no guarantee of future results. Returns shown may reflect hypothetical historical performance. Please see the disclaimer page for important legal disclosures.
Table 5 shows that all momentum indexes display improved Sharpe Ratios relative to the underlying index. Broad indexes exhibit lower levels of momentum exposure and turnover, but greater levels of diversification and capacity, relative to narrow indexes.
Higher levels of exposure result in a larger momentum factor premium. An increase in the rebalance frequency results in increased levels of factor exposure at the expense of higher levels of turnover. However, the exposure improvements resulting from moving from a semi-annual to a monthly rebalance frequency are small. Turnover and exposure considerations suggest two practical possibilities; a broad semi-annually rebalanced index or a narrow annually rebalanced index. The remaining options exhibit turnover that is too high or factor exposure that is too low.
Chart 5 displays the momentum exposure of each index through time. The striking feature of Chart 5 is the speed at which momentum exposure is lost. The degradation in momentum exposure is more evident than with other factors. Both narrowing and increases in the rebalance frequency result in increased levels of exposure and turnover, but given the speed of exposure degradation, the latter is a superior mechanism for maintaining exposure. The broad semi-annual index offers comparable levels of exposure on average to a narrow annual index, but exhibits lower levels of turnover and more stable exposure. The rationale for the relative

FTSE Russell | Factor exposure indexes – momentum factor 17
stability of the broad index exposure and turnover is that the Residual Sharpe Ratio is associated with stock specific news, implying that the degree of persistence in this measure of momentum is small and this, in conjunction with narrowing results in significant instability in index membership.
Chart 5. FTSE Developed: Momentum exposure of broad and narrow indexes
03/2
001
Mo
men
tum
Exp
osu
re
0.0
-0.2
-0.4
0.2
0.4
0.6
0.8
1.0
1.2
09/2
001
03/2
002
09/2
002
03/2
003
09/2
003
03/2
004
09/2
004
03/2
005
09/2
005
03/2
006
09/2
006
03/2
007
09/2
007
03/2
008
09/2
008
03/2
009
09/2
009
03/2
010
09/2
010
03/2
011
09/2
011
03/2
012
09/2
012
03/2
013
09/2
013
FTSE Developed Broad Monthly Broad Semi Annual
Narrow Monthly Narrow Annual
Source FTSE Russell: FTSE Developed, March 2001 to January 2014. Past performance is no guarantee of future results. Returns shown may reflect hypothetical historical performance. Please see the disclaimer page for important legal disclosures.
To ensure that our results are not sensitive to the timing of the semi-annual rebalance, we examine broad momentum indexes for alternative semi-annual rebalance cycles, i.e. indexes that rebalanced in January and July, February and August, etc. Chart 6 shows that the Sharpe Ratio and turnover outcomes are robust to alternative semi-annual rebalance cycles.
Chart 6: Timing of semi-annual rebalance: Sharpe ratio and two way turnover
Sha
rpe
Rat
io (p
.a.)
Tw
o W
ay T
urno
ver
(%p
.a.)
0.20 60
65
70
75
80
85
90
95
0.25
0.30
0.35
0.40
0.45
—— Sharpe Ratio —— Turnover
Jan-Jul Feb-Aug Mar-Sep Apr-Oct May-Nov Jun-Dec
Source FTSE Russell: FTSE Developed, March 2001 to January 2014, USD Total Return. Past performance is no guarantee of future results. Returns shown may reflect hypothetical historical performance. Please see the disclaimer page for important legal disclosures.
FTSE Russell | Factor exposure indexes – momentum factor 18
5. ConclusionIn this paper we investigated stock level momentum factors for FTSE Developed constituents over the period 2001 – 2014. We also examined illustrative indexes tilted towards a preferred set of momentum factors.
Candidate momentum factors are identified from a survey of the academic literature and current market practice. Using the FTSE Developed universe over the period 2001 – 2014, we assessed the candidate factors and identified robust formation and holding periods of 12 and six-12 months, respectively.
We noted that momentum may result from three sources; stock specific momentum; momentum arising from exposure to systematic risk factors; and momentum linked to stock specific shocks. We believe it is important to differentiate between these sources of momentum, since momentum strategies based solely on past stock returns will necessarily incorporate dynamic exposures to risk factors that generated significant performance (positive or negative) over the momentum formation period. For example, if the market is rising (falling) over the momentum formation period, then simple momentum measures, based solely on past stock returns, identify high (low) beta stocks.
One-year stock specific return (Alpha) captures stock specific momentum. The Residual Sharpe Ratio captures the momentum linked to stock specific news. These momentum factors have historically shown strong risk adjusted performance across regions Furthermore, each factor appears to exhibit a degree of independence.
We considered three absolute or total measures of momentum; the one-year cumulative return (Return), the one-year Sharpe Ratio, and the ratio of the current price to the highest price over the last year (CH12 Ratio). The Return measure of momentum has historically shown strong risk adjusted performance outcomes that are not primarily the result of country or industry effects. We prefer the use of Return to Sharpe Ratio as a measure of momentum, despite both exhibiting similar historical risk adjusted performance outcomes, since the latter displays substantial industry and country effects. While the performance of Return and the CH12 Ratio is similar, the CH12 Ratio leads to momentum strategies with significant exposure to systematic factors.
We highlighted the Residual Sharpe Ratio measure of momentum on which to construct momentum indexes, based on relatively low levels of turnover, volatility and similar historical performance to other momentum measures. Importantly and in contrast to traditional measures of momentum, the Residual Sharpe Ratio avoids time-varying exposure to systematic risk factors.
We considered an illustrative set of indexes based on this factor and found that they exhibit a substantial exposure to momentum and relatively low levels of turnover for a momentum based factor index. A broad semi-annually rebalanced momentum index offers a practical combination of high levels of momentum exposure and relatively low turnover outcomes that are robust to the timing of the semi-annual rebalance.
FTSE Russell | Factor exposure indexes – momentum factor 19
ReferencesBacmann, J., Dubois, M. and Isakov, D., 2001, “Industries, Business Cycle and Profitability of Momentum Strategies: An International Persective”, SSRN Working Paper, SSRN id 264657.
Barberis, N., Shleifer, A. and Vishny, R., 1998, “A Model of Investor Sentiment,” Journal of Financial Economics.
Biglova, A., Ortobelli S., Rachev Z. and Stoyanov, S., 2004, “Comparison among Different Approaches for Risk Estimation in Portfolio Theory”, Journal of Portfolio Management.
Blitz, D., Huij, J. and Martens, M., 2011, “Residual Momentum”, Journal of Empirical Finance.
Bornholt, G., and Malin, M., 2011, “Using Volatility to Enhance Momentum Profits”, Finsia Journal of Applied Finance.
Chan, L., Jegadeesh, N. and Lakonishok, J., 1996, “Momentum Strategies”, Journal of Finance.
Chan, K., Hameed, A., and Tong, W., 2000, “Profitability of Momentum Strategies in the International Equity Markets,” The Journal of Financial and Quantitative Analysis.
Chordia, T. and Shivakumar, L., 2002, “Momentum, Business Cycle and Time-varying Expected Returns,” Journal of Finance.
Chu, J., Liu, T. and Rathinasamy, R., 2004 “Robust Test of the January Effect in Stock Markets Using Markov-Switching Model”, Journal of Financial Management and Analysis.
Daniel, K., Hirshleifer, D. and Subrahmanyam A., 1998, “Investor Psychology and Security Market Under-and Overreactions,” Journal of Finance.
De Bondt, W. and Tjaler, R., 1985, “Does the Stock Market Overreact”, Journal of Finance.
‘Factor Exposure Indices – Index Construction Methodology’, FTSE (2014).
George, T. and Hwang, C., 2004, “The 52-Week High and Momentum Investing”, Journal of Finance.
Grinblatt, M., and Titman, S., 1989, “Mutual Fund Performance: An Analysis of Quarterly Portfolio Holdings,” Journal of Business.
Grundy, B. and Martin, S., 2001, “Understanding the Nature of the Risks and the Source of the Rewards to Momentum Investing”, Review of Financial Studies.
Gutierrez, R. and Pirinsky, C., 2007, “Momentum, Reversal, and the Trading Behaviors of Institutions”, Journal of Financial Markets.
Jegadeesh, N. and Titman, S., 1993, “Returns to Buying Winners and Selling Losers: Implications for Stock Market Efficiency”, Journal of Finance.
Jegadeesh, N. and Titman, S., 2000, “Momentum”, SSRN Working Paper, SSRN id 299107.
Korajczyk, R. and Sadka, R., 2003, “Are Momentum Portfolios Robust to Trading Costs?”, SSRN Working Paper, SSRN id 305282.

FTSE Russell | Factor exposure indexes – momentum factor 20
Leippold, M. and Lohre, H., 2012, “International Price and Earnings Momentum”, Empirical Journal of Finance.
Levy, R., 1967, “Relative Strength as a Criterion for Investment Selection”, Journal of Finance.
Li, X., Brooks, C., and Miffre, J., 2009, “Transaction Costs, Trading Volume, and Momentum Strategies”, SSRN Working Paper, SSRN id 1406575.
Liu, M., Liu, Q., and Ma, T., 2010, “The 52-Week High Momentum Strategy in International Stock Markets”, SSRN Working Paper, SSRN id 1364566.
Moskowitz, T, and Grinblatt, M., 1999, “Do Industries Explain Momentum?”, Journal of Finance.
Nijman, T., Swinkels, L., and Verbeek, M., 2004, “Do Industries Explain Momentum?”, Journal of Empirical Finance.
Rouwenhorst, K., 1998, “International Momentum Strategies”, Journal of Finance.
Sefton, J. and Scowcroft, A., 2005, “Understanding Momentum”, Financial Analysts Journal.

FTSE Russell 21
© 2015 London Stock Exchange Group companies.
London Stock Exchange Group companies includes FTSE International Limited (“FTSE”), Frank Russell Company (“Russell”), MTS Next Limited (“MTS”), and FTSE TMX Global Debt Capital Markets Inc (“FTSE TMX”). All rights reserved.
“FTSE®”, “Russell®”, “MTS®”, “FTSE TMX®” and “FTSE Russell” and other service marks and trademarks related to the FTSE or Russell indexes are trademarks of the London Stock Exchange Group companies and are used by FTSE, MTS, FTSE TMX and Russell under licence.
All information is provided for information purposes only. Every effort is made to ensure that all information given in this publication is accurate, but no responsibility or liability can be accepted by the London Stock Exchange Group companies nor its licensors for any errors or for any loss from use of this publication.
Neither the London Stock Exchange Group companies nor any of their licensors make any claim, prediction, warranty or representation whatsoever, expressly or impliedly, either as to the results to be obtained from the use of the FTSE Russell Indexes or the fitness or suitability of the Indexes for any particular purpose to which they might be put.
The London Stock Exchange Group companies do not provide investment advice and nothing in this document should be taken as constituting financial or investment advice. The London Stock Exchange Group companies make no representation regarding the advisability of investing in any asset. A decision to invest in any such asset should not be made in reliance on any information herein. Indexes cannot be invested in directly. Inclusion of an asset in an index is not a recommendation to buy, sell or hold that asset. The general information contained in this publication should not be acted upon without obtaining specific legal, tax, and investment advice from a licensed professional.
No part of this information may be reproduced, stored in a retrieval system or transmitted in any form or by any means, electronic, mechanical, photocopying, recording or otherwise, without prior written permission of the London Stock Exchange Group companies. Distribution of the London Stock Exchange Group companies’ index values and the use of their indexes to create financial products require a licence with FTSE, FTSE TMX, MTS and/or Russell and/or its licensors.
The Industry Classification Benchmark (“ICB”) is owned by FTSE. FTSE does not accept any liability to any person for any loss or damage arising out of any error or omission in the ICB.
Past performance is no guarantee of future results. Charts and graphs are provided for illustrative purposes only. Index returns shown may not represent the results of the actual trading of investable assets. Certain returns shown may reflect back-tested performance. All performance presented prior to the index inception date is back-tested performance. Back-tested performance is not actual performance, but is hypothetical. The back-test calculations are based on the same methodology that was in effect when the index was officially launched. However, back-tested data may reflect the application of the index methodology with the benefit of hindsight, and the historic calculations of an index may change from month to month based on revisions to the underlying economic data used in the calculation of the index.
For more information about our indexes, please visit ftserussell.com.
FTSE Russell
About FTSE RussellFTSE Russell is a leading global provider of benchmarking, analytics and data solutions for investors, giving them a precise view of the market relevant to their investment process. A comprehensive range of reliable and accurate indexes provides investors worldwide with the tools they require to measure and benchmark markets across asset classes, styles or strategies.
FTSE Russell index expertise and products are used extensively by institutional and retail investors globally. For over 30 years, leading asset owners, asset managers, ETF providers and investment banks have chosen FTSE Russell indexes to benchmark their investment performance and create ETFs, structured products and index-based derivatives.
FTSE Russell is focused on applying the highest industry standards in index design and governance, employing transparent rules-based methodology informed by independent committees of leading market participants. FTSE Russell fully embraces the IOSCO Principles and its Statement of Compliance has received independent assurance. Index innovation is driven by client needs and customer partnerships, allowing FTSE Russell to continually enhance the breadth, depth and reach of its offering.
FTSE Russell is wholly owned by London Stock Exchange Group.
For more information, visit www.ftserussell.com.
To learn more, visit www.ftserussell.com; email [email protected], [email protected]; or call your regional Client Service Team office:
EMEA+44 (0) 20 7866 1810
North America+1 877 503 6437
Asia-PacificHong Kong +852 2164 3333Tokyo +81 3 3581 2764Sydney +61 (0) 2 8823 3521