ftir and dsc of polymer films used for packaging: lldpe...
TRANSCRIPT

1
FTIR and DSC of polymer films used for packaging:
LLDPE, PP and PVDC
John Petrovich
SHAPE American High School
Abstract:
Polymers are compounds used in various materials. There are a plethora of methods used
to analyze the composition and other properties of the material; these include Fourier Transform
Infrared Spectroscopy (FTIR) and Differential Scanning Calorimetry (DSC). The profiles of the
DSC display varying melting peaks and glass transition regions for different samples. This
indicates that DSC can be used to determine different qualities of polymeric materials which
include, but are not limited to, high density character, low density character, amorphousness, and
semi crystallinity. We found from the DSC profile that the melting point for various
polyethylene samples range from approximately 120-130 degrees C. The DSC profile for the
polypropylene (PP) shows peaks at 163 and 156 degrees C at the main and secondary melting
peaks respectively. The DSC profile for Stretch-Tite does not even have melting peaks. It
instead has glass transition regions found at approximately 60 and 95 degrees C. The lack of a
melting peak in the polyvinylidene chloride (PVDC) sample is indicative of an amorphous
polymer.
Introduction:
Polymer films are extensively used commercial packaging. Species used in packaging
include, but are not limited to polyester (PET), polyamide, polyvinyl chloride (PVC),
polystyrene (PS), polypropylene (PP) and polyethylene (PE).
Polyethylene can form with different densities. These include low density (LDPE), linear
low density (LLDPE), medium density (MDPE), high density (HDPE), and ultra-high
density (UHDPE).
It is possible for samples of LLDPE to take on characteristics of either LDPE or HDPE.
Polymers can exist in two different morphologies while in a solid phase:
o Amorphous: Molecules are randomly oriented within the polymer. These
polymers can easily be altered in shape and generally exist in a rubbery state.
o Semi crystalline: An arrangement of ordered molecules with some amorphous
regions. These polymers are stiff and exist in a glassy state.
This paper is focused on answering the following hypotheses:
Hypothesis: Can we utilize DSC and FTIR data to determine why different LLDPE
samples exhibit properties similar to either LDPE or HDPE? Can one identify whether a
polymer material is crystalline or amorphous based upon DSC melting temperature data?

2
Samples:
The pictures of the polymeric material samples that we used in this experiment are shown
in figure 1. These samples are used in the physical state seen in the pictures.
(a) (b) (c)
(d) (e) (f)
Figure 1: (a) Ziplock Sandwich Bags, (b) PE-LD bag with recycling code 4, (c) Glad wrap with
adhesive side, (d) Act II popcorn bags, (e) Stretch-Tite Saran Wrap, (f) Walmart Bag
Differential Scanning Calorimetry (DSC):
DSC is a method of analysis that allows the user to measure glass transition, melting
temperature, and crystallization temperature while a polymeric material sample is being heated
or cooled. Each polymer film tested had a specific melting and recrystallization point that was
reflected in the DSC as an endothermic and exothermic peak, respectively. During our research,
we subjected various samples through a heating phase, a cooling phase, and another heating
phase.
We used a TA Instruments DSC (Model Q2000) using low mass Aluminum sample pans
and a sample weight with a mass of approximately 2-3 milligrams. The polyvinyl chloride
sample was heated/cooled at a rate of 20 degrees centigrade per minute. All other samples were
heated/cooled at a rate of 10 degrees centigrade per minute. For the data analysis of the DSC
profiles, TA Universal Analysis 2000 was used.
Fourier Transform Infrared Spectroscopy (FTIR):
FTIR is a spectroscopic method of analysis where IR rays are absorbed by bonds in a
molecule. These IR ray’s energy can be related to the vibrational energy of different bonds
found within different functional groups in a compound. To provide a few examples, one might

3
be able to find a relatively large O-H peak at approximately 3500-3200 cm-1. Another
prominent example that can be seen in a plethora of polymer samples in the carbonyl functional
group peak (C=O) which occurs at about 1690 – 1820 cm-1. Peaks in lower energy areas on an
FTIR graph are collectively known as the fingerprint region. Each region is unique for an
individual compound and are thus extremely helpful in comparisons between different FTIR
graphs.
The exact model used in this research was the Perkin Elmer (Model Spectrum Two) for
taking spectrum data in the wavelength range of 4000-7000 cm-1. Samples were prepared by
cutting 3 cm in diameter from each film and taping it to a Rensselaer Summer Program business
card.
Results:
FTIR: The first portion of my research involved placing my samples into a FTIR
spectrophotometer in hopes of revealing differences in functional groups between the various
polymers. The following IR spectra are from those that I prepared with the assistance of various
teacher’s assistants:
(a) Ziplock Bag (PE) (b) Bag PE-LD (PE)
(c) Glad Wraps with Adhesive (PE) (d) Walmart Bag (PE)

4
(e) Act II Popcorn Wrapper (PP) (f) Stretch-Tite Wrap (PVDC)
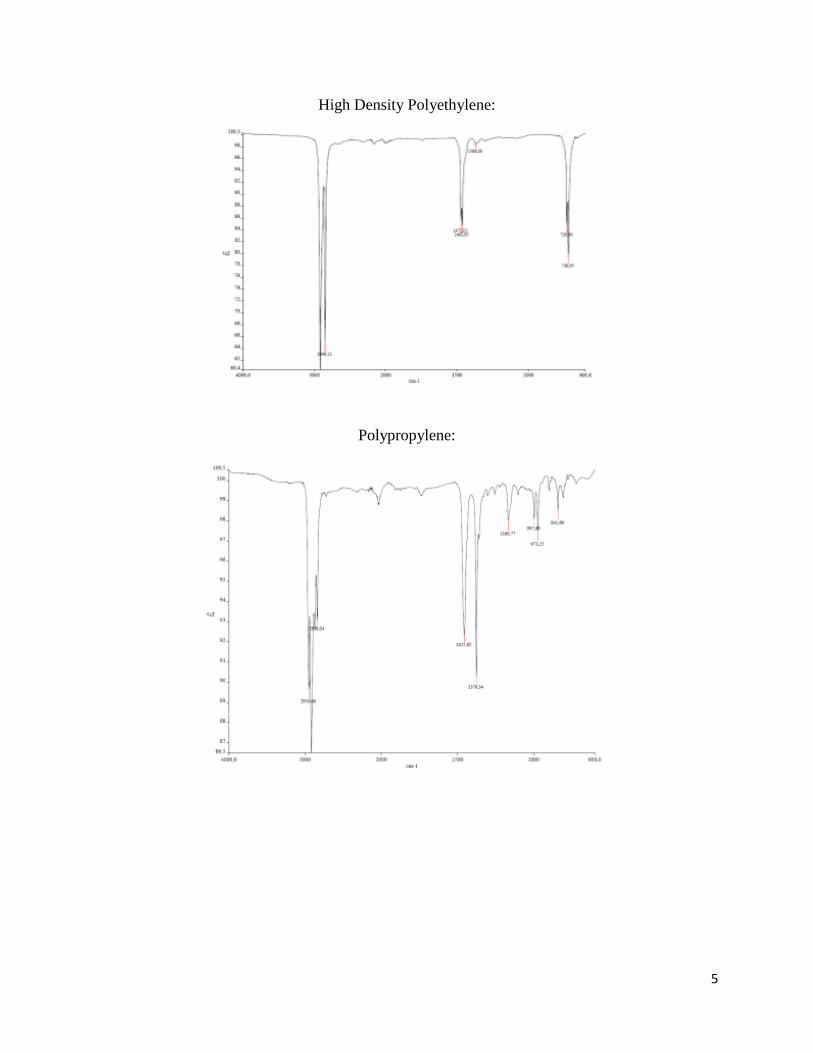
FTIR spectra from previously published polymer chemistry literature is seen below. Due
to a lack of HDPE or LDPE specific LLDPE FTIR spectra, comparison with the samples above
was done with regular HDPE and LDPE spectra:
Low Density Polyethylene:
5
High Density Polyethylene:
Polypropylene:

6
Polyvinylidene Chloride
Comparing my LLDPE-LDPE IR spectra with the example from previous literature, one
might tell that the same functional groups are present, but their respective peaks are of slightly
different proportions. One must recognize that the comparison is between LLDPE-LDPE and
LDPE, and a differentiation in the amount of branching in both samples accounts for some of the
different proportions in peaks. Another reason for this might be due to the fact that our
experimental samples had color additives within them. This particular possible source of error
can be seen when the peak is fatter than the established reference.
Something similar occurs when comparing the experimental LLDPE-HDPE samples with
the established reference from previous literature. This is particularly evident in the Walmart
Bag sample. The aromatic C-H peak approximately at 2900 cm-1 is particularly thick when
compared to findings of the European Commission. This thickness is due to the grey color
additives found in the Walmart bag.
The experimentally determined IR spectrum for PP that we generated varied a great deal
from the spectrum from the other literature. Most of the same functional groups are still present,
but there are distinct curves in the profile that are not present from the spectrum generated by the
European Commission. These curves are due to the sample that we used being of a relatively
high thickness. It is also worth mentioning a strange fingerprint region not present in the
reference spectrum. This could possibly be due to additives or contamination, a much less likely
possibility considering the sample had been disinfected in a Suprasil ozone/UV oven.
When one compares the LLDPE-HDPE and LLDPE-LDPE spectra, they lack any
noticeable difference in structure. The only exception would be the inclusion of additional
thickness/length to peaks due to additional branching in some samples.
In a similar manner, FTIR didn’t provide much information concerning levels of
crystallinity of polypropylene and polyvinylidene chloride besides its structure. The FTIR

7
spectra generated in this experiment were similar to those determined by the European
Commission except for the fact that the fingerprint regions are of slightly different proportions.
This could be due to color additives, additional branching, or the reflection of IR light from the
sample due to its thickness.
DSC: The second portion of my research involved putting my samples in a Differential
Scanning Calorimeter in order to determine melting temperature.
Melting
Peak
2nd Melting
Peak
Heat of
Fusion
118.54
Degrees
C
105.42
Degrees C
113.8 J/g
Melting Peak 2nd Melting
Peak
Heat of
Fusion
119.64
Degree C
105.01
Degree C
98.07 J/g
Ziplock Bag (LDPE-like LLDPE)
Tm(Main)
Ziplock Bag (LDPE-like LLDPE)
Tm(Secondary)

8
For this LDPE-like LLDPE DSC profile, notice that both the Tm(main) and
Tm(secondary) peaks are found around 118-120 degrees C. Also notice that both DSC profiles
have a distinct second peak. This peak exists due to differentiating densities throughout the
polymeric sample.
Main
Melting
Peak
Second
Melting Peak
Heat of
Fusion
121.35
Degrees
C
117.27
Degrees C
81.21 J/g
Main
Melting
Peak
Second
Melting
Peak
Heat of
Fusion
121.35
Degrees
C
117.27
Degrees C
81.21
J/g
PD-LE Bag (LDPE-like LLDPE)
Tm(Main)
PD-LE Bag (LDPE-like
LLDPE) Tm(Secondary)

9
For this sample, both main and secondary temperature peaks fall around 120 degrees C.
Both DSC profiles also have an additional peak due to a differentiation in density within the
polymer sample.
Main
Melting
Peak
Second
Melting
Peak
Heat of
Fusion
126.31
Degrees
C
N/A 149.1
J/g
Main
Melting
Peak
Second
Melting
Peak
Heat of
Fusion
126.31
Degrees
C
N/A 149.1
J/g
Glad Cling Wrap (HDPE-like
LLDPE) Tm(Main)
Glad Cling Wrap (HDPE-like
LLDPE) Tm(Secondary)

10
This HDPE-like LLDPE sample only has one noticeably melting peak in both DSC
profiles. This is a stark contrast with the two peaks experienced in the LDPE-like LLDPE
samples. It is also worth mentioning that the melting peak is found at a higher temperature
(~130 Degrees C). This is higher than the value determined for the LDPE-like LLDPE samples.
Main
Melting
Peak
Second
Melting
Peak
Heat of
Fusion
125.17
Degrees
C
N/A 119.2
J/g
Main
Melting
Peak
Second
Melting
Peak
Heat of
Fusion
126.74
Degrees
C
N/A 132.7
J/g
Walmart Bag (HDPE-like LLDPE)
Tm(Main)
Walmart Bag (HDPE-like LLDPE)
Tm(Secondary)

11
Notice that the melting peaks for this HDPE-like sample is also close to 130 degrees C.
The fact that this sample along with the other HDPE-like sample above have melting peaks
nearly ten degrees higher may indicate that these species are highly ordered with little branching.
Main
Melting
Peak
Second
Melting
Peak
Heat of
Fusion
163.42
Degrees
C
176.98
Degrees C
161.2
J/g
Main
Melting
Peak
Second
Melting
Peak
Heat of
Fusion
156.34
Degrees
C
N/A 84.21
J/g
Act II Popcorn Wrapper (PP)
Tm(Main)
Act II Popcorn Wrapper (PP)
Tm(Secondary)

12
In this polypropylene sample, we experienced an anomaly at the main melting peak
during the initial heating. As seen in the first DSC profile on the page, there is an additional
melting peak not observed in the graph directly above. This is most likely due to residual
reactants from its synthesis or contamination before analysis. The second peak at approx.176.98
degrees C can be attributed to this residue burning away.
For this PVDC sample, it is important to note that it lacks a melting peak. The lack of a
distinctive melting point indicates that the sample has a greater amorphous character than it does
crystalline. Instead of a melting peak, the polymer film has two glass transitions, the first
occurring at approximately 61 degrees C and the other occurring at approximately 95 degrees C.
Compared to the established literature, the glass transitions are extremely high for the agreed-
upon glass transition temperature for PVDC falls around 16 degrees C. This difference in glass
transition temperature range can be accounted for if one considers the additives that could be
present in the Stretch-Tite wrap.
1st Glass Transition 2nd Glass Transition
60.97 Degrees C 95.36 Degrees C
Stretch-Tite Wrap (PVDC)
Tm(Main)

13
Conclusion:
In this research project, we created various samples from polymeric materials and ran
them through FTIR spectroscopy and Differential Scanning Calorimetry. I did so with the intent
of discovering whether or not one could determine why LLDPE could exhibit LDPE or HDPE-
like characteristics. I also carried out this research with a secondary intent of being able to
determine whether or not a polymeric sample was amorphous or semi crystalline just from
reading DSC profiles.
Seeing as FTIR analysis did not provide much insight as to why LLDPE exhibits
HDPE or LDPE like characteristics past structure, I put the samples through DSC. For the
Ziplock bag and PE-LD bag (LDPE-like LLDPE samples), their DSC profiles show two distinct
melting peaks that occur at approximately 110 degrees C and 120 degrees respectively. For the
Glad adhesive wrap and the Walmart bag (HDPE-like LLDPE samples), the DSC profiles show
one distinct melting peak that occurs closer to the 125-130 degree C range. The fact that the
HDPE-like LLDPE samples’ melting peaks occur a temperatures ten degrees higher than LDPE-
like LLDPE samples agrees with the idea that HDPE samples are more highly ordered with less
branching. This piece of evidence supports the portion of my hypothesis where DSC can
effectively be used to determine why LLDPE can exhibit HDPE and LDPE character.
The DSC profile for the popcorn wrapper (PP) shows peaks at 163 and 156 degrees C at
the main and secondary melting peaks respectively. The DSC profile for Stretch-Tite does not
even have melting peaks. It instead has glass transition regions found at approximately 60 and
95 degrees C. The lack of a melting peak in the PVDC sample is indicative of an amorphous
polymer, and thus confirms the hypothesis that DSC melting temperature data can be used to
confirm whether a sample is crystalline or amorphous.
Further research that could conducted involves exposing the samples to
thermogravimetric analysis to see the level of thermal degradation. This would be especially
helpful in making firmer conclusions concerning the contamination found in the PVDC sample.
Acknowledgements:
I would like to thank the Research in Polymers Program at Rensselaer Polytechnic
Institute as well as the National Science Foundation (Award Number 1308617). I would also
like to thank Dr. Ryu, Dr. Ma, Sara Till, Casey Wong, Miriam Shao, Ben Stovall, my fellow
high school research classmates, the SHAPE American High School Science Department
(particularly Todd Mitchell), and my family for their generous support.
References:
[1] M.A Peltzer and C. Simoneau “OLC002 2013 – Identification of Polymeric
Materials” European Commission Joint Research Center, Institute for Health and Consumer
Protection (ISBN 978-92-79-35267-6) Publication Office of the European Union (2013).
[2] Thomas, L.C. Characterization of Melting Phenomena in Linear Low Density
Polyethylene by Modulated DSC. TA Instruments, Inc.