ftir analysis of aviation fuel depositsoperation of a nlcolet 7199 ftir spectrophotometer and...
TRANSCRIPT
NASA Technical Memorandum 83773
FTIR Analysis of Aviation Fuel Deposits
Larry S. Helmick and Gary T. SengLewis Research Center
Cleveland, Ohio
September 1984
https://ntrs.nasa.gov/search.jsp?R=19840025537 2020-05-30T03:31:40+00:00Z

j_

FTIR ANALYSIS OF AVIATION FUEL DEPOSITS
Larry S. Helmlck* and Gary T. Seng
National Aeronautics and Space AdministrationLewis Research Center
Cleveland, Ohio 44135
C)C)c,Jc_J!
L_
SUMMARY
Five modes of operation (absorption, emission, single reflectance, at-tenuated total reflectance, and photoacoustlc) of a Nico}et 7199 FourierTransform Infrared Spectrophotometer have been investigated in order to deter-mine which modes were most suitable for qualitative analysis of Jet fueldeposits. The absorption and emission modes were'found to be the most advan-tageous for investigation of the bulk and surface properties of acceleratedstorage/thermal deposits where relatively large quantities of deposit aregenerally available.
The general effects of fuel type, stress temperature, stress time, type
of spiking agent, spiking agent concentration, fuel flow, and postdeposltlonal
treatment on the chemical nature of accelerated storage/thermal deposits were
then investigated by FTIR by systematically varying these parameters.
A correlation of the infrared spectra and chemical structure of modelfuel storage/thermal deposits has been attempted.
INTRODUCTION
Jet fuels undergo chemical reactions which ultimately result in sedl-
ment/deposlt formation when subjected to high temperatures in the presence of
oxygen. Temperatures of lO0 ° to 300 ° C are presently encountered in the heatexchangers, fuel lines, and nozzles of Jet aircraft under normal operating
conditions. Accumulation of deposits in these areas reduces the rate of heat
and fuel flow, thus adversely affecting the operation of the aircraft. With
increased use of higher temperature, advanced design turbines, and the po-
tential use of broadened-propertles fuels and synfuels, thermal degradation
problems are expected to increase in future years. Knowledge of the chemical
structure of the deposit is necessary in order to identify the chemical reac-
tions involved in its formation. Suitable modification of fuels, handling
techniques, or materials may then be possible in order to eliminate thesereactions and minimize the deposits.
Several approaches have been taken in recent years to obtain information
concerning the chemical structure of fuel deposits. These include photo-
acoustic spectroscopy, electron spectroscopy for chemlcal analysis, scanning
electron microscopy, energy dispersive analysis of X-rays, secondary ion mass
spectroscopy, Fourier transform infrared spectroscopy, Raman spectroscopy, and
pyrolysls/gas chromatography-mass spectrometry. Much of this research has
been supported by NASA and has recently been summarized (ref. l).
*Cedarville, College, Cedarville, Ohio 45314 and NASA-ASEE Faculty Fellow.

The purposes of this investigation were (1) to evaluate five modes ofoperation of a Nlcolet 7199 FTIR spectrophotometer and determine which modes
would be most valuable in a qualitative investigation of the surface and bulk
chemical structure of Jet fuel accelerated storage/thermal deposits; (2) to
use Fourier transform infrared spectroscopy (FTIR) to qualitatively determine
the effects of the type of fuel, stress temperature, stress time, type of
spiking agent, spiking agent concentration, fuel flow, and post-deposltlonal
treatment on the nature of the accelerated storage/thermal deposit; and (3) todetermine whether low temperature storage deposits contained precursors which
could be converted into thermal deposits by additional post-deposltlonal heat-ing under nitrogen or air.
To accomplish these objectives, Fourier transform infrared absorption,emission, single reflectance, attenuated total reflectance, and photoacoustlc
spectra were obtained for deposits produced on stalnless-steel foll by heating
fuel samples containing selected spiking agents. The advantages and dis-
advantages of each mode were then evaluated. The absorption and emission
modes were selected for analysis of fuel deposits. The type of fuel used,
stress temperature, stress time, type of spiking agent, spiking agent concen-
tration, fuel flow , and post-deposlt treatment were then systematically var-
ied to determine which factors affect the nature of the deposit and thus the
FTIR spectrum. Finally, post-deposltlonal heating of accelerated storagedeposits was conducted to determine whether they could be converted intothermal deposits.
EXPERIMENTAL PROCEDURE
Instrument Description
Infrared spectra were obtained on a Nicolet 7199 Fourier Transform Infra-
red Spectrophotometer equipped wlth a liquid nitrogen cooled mercury-cadmlum-
tellurlde detector, model NIC-E?O00 Emission Accessory, model NIC-ATTO00
Variable Angle Attenuated Total Reflectance Accessory with a 50 mm KRS-5
crystal, and a single External _Reflectance Accessory constructed In-house.
Photoacoustlc spectra were obtained on the same instrument with a helium fil-led Nlcolet Photoacoustlc Cell.
Sample Preparation and Instrument Operation
Absorption spectra. - Samples were prepared by carefully scraping ap-
proximately O.l mg of deposit off the metal foll and grinding it with 200 mgof spectroscopic grade potassium bromide in a Wig-L-Bug ball mill for 30 sec.
The powder was then placed in a die, evacuated, and pressed into a transparentpellet. After collecting between 20 and lO0 scans employing a suitable set of
instrumental parameters, the single beam spectrum was ratloed against the
spectrum of a blank potassium bromide pellet and plotted as percent transmit-
tance versus wave number. Proper instrument adjustment, calibration, andoperation was verified using a polystyrene standard.
Emission spectra. - Samples were prepared by cutting a 0.5 cm disk from
the stalnless-steel loll coated with the deposit. The sample was placed in
the thermostatted sample holder well of the Nicolet emission attachment which
had previously been calibrated with a YSI (Yellow Springs Instrument) therm-Istor thermometer. Using a suitable set of instrumental parameters, 400background scans were collected at 30° C. The temperature was then increased
to the desired value and 400 sample scans were collected. The background was
subtracted from the sample and the difference spectrum so produced was ratloed
against the difference spectrum of a powdered charcoal blackbody produced In
the same manner at the same temperatures. The resulting spectrum was plottedas emission intensity versus wave number. To insure proper operation of the
instrument, polystyrene was run in the emission mode and the spectrum was
compared wlth that obtained using the absorption mode.
Photoacoustlc spectra. - Samples were prepared by cutting a 0.5 cm disk
from the stalnless-steel loll coated with the deposit. Using a dry bag, the
sample was sealed in the Nicolet photoacoustlc attachment under helium.
Between 300 and 500 scans were collected using an appropriate set of instru-
mental parameters and ratloed against the spectrum of powdered charcoal which
was similarly obtained. A spectrum of polystyrene was obtained and compared
with an absorption spectrum to insure proper operation of the instrument.
Attentuated total reflectance spectra. - Three clean stainless steel
foils and one loll coated with the thermal deposit were clamped (two on each
side) to an ultrasonically cleaned and vacuum dried crystal of KRS-5, and
mounted in the instrument at an angle of 46°. Approximately lO0 scans were
collected using a suitable set of instrumental parameters and ratloed against
four blank foils identically attached to the crystal. However, optimum
results were obtained when the contact surface area was increased by using
four identical samples. Since four identical samples were generally not
available, and since the roughness of the thermal deposit prevented good
surface contact with the crystal, it was difficult to obtain spectra of satis-
factory quality in this mode. Proper instrument operation was verified using
a Teflon sample.
Single reflectance spectra. - The stalnless-steel foll coated with thedeposit was mounted on the single reflectance attachment which had been
aligned in the instrument. The sample was scanned 200 times using a suitable
set of instrumental parameters and ratloed against an ultrasonically cleanedstalnless-steel blank.
Control spectra. - Absorption spectroscopy reveals information concerning
the bulk of the material, while emission spectroscopy is a surface analysis
technique (ref. 2). For material in which the surface and bulk are similar,
essentially identical spectra should be obtained, providing that in the em_s-
slon mode, reabsorptlon due to temperature gradients within the sample does
not occur. Polystyrene spectra (fig. l) exhibit this similarity, indicating
that no reabsorptlon is occurring to alter the emission spectra.
Since photoacoustlc and emission spectroscopy are both surface analysistechniques, they should produce spectra of the surface material which exhibit
similar frequencies (although relative band intensities may vary somewhat.)
Actual observation of spectra wlth similar band frequencies for polystyrene
(fig. l) as well as for fuel deposits indicates that this is the case and that
again no reabsorptlon is occurring in the emission mode which might seriously
alter the spectra of the material.

Preparation of Static Accelerated Storage/Thermal
Deposits at 60° and 125 ° C
Deposits were prepared employing a procedure developed by Daniel(ref. 3). A specific amount of spiking agent was added to 20 ml of fuel in a
wlde-mouth, 4 oz, glass Jar containing two weighed stalnless-steel foils andsealed with a Teflon-llned cap. The Jars were placed in an oven set at the
test temperature (60 ± l° or 125 ± 3° C). After a suitable amount of deposit
had formed, the Jar was opened and the foll removed, rinsed with hexane, dried
at room temperature and atmospheric pressure or at 80° C under vacuum (60torr), and weighed. Fuels which were slow to produce deposits were saturated
with oxygen by opening the Jar and bubbling oxygen through the solution for 5
mln, reseallng, and replacing the Jar in the oven. A summary of conditionsemployed is given in table I.
Preparation of Static Accelerated Thermal Deposits at 250 ° C
Thermal deposits were prepared under static fuel conditions by adding anappropriate amount of the spiking agent to lO ml of oxygen-saturated fuel in a
35 ml hlgn-pressure stalnless-steel capsule containing a prewelghted stain-less-steel foil. The capsule was placed in a muffle furnace at 250 ° ± 20° C
for 7 to lO days. After cooling to room temperature, the capsule was openedand the fuel and foll removed. The foll was rinsed with hexane and dried at
atmospheric pressure and room temperature. The fuel was centrifuged to obtainthe suspended sediment for analysis. This sediment was washed with hexane and
dried at ro_m temperature and 0.05 torr. A summary of conditions employed forpreparation of static accelerated thermal deposits is also included in table I.
Preparation of Modified JFTOT Accelerated Thermal Deposits
Thermal deposits were produced by stressing ?00 ml of alr-saturated fuelcontaining the appropriate amount of spiking agent on the Modified JFTOT Flat
Sample Rig (MJFSR) at 260 ° C (ref. 4). After stressing, the prewelghed stain-less-steel foll containing the deposit was rinsed with hexane, dried at 80 ° C
under vacuum (60 torr) and weighed.
RESULTS AND DISCUSSION
FTIR Mode Selection
The Nicolet 7199 Fourier Transform Infrared spectrophotometer offers fivemodes of operation: absorption, emission, single reflectance, attenuated
total reflectance, and photoacoustlc. All of these modes were investigated in
order to determine whlch modes of operation were most suitable for qualitative
analysis of fuel deposits. Modes for both bulk and surface analyses were
desired. Although the absorption mode required relatively large quantles of
deposit, it was selected for continued use because it was the only mode whichprovided bulk analyses. Of the surface analysis techniques, attenuated total
reflectance (ATR) was not practical for contlnued use because the hardness and
roughness of the thermal deposits prevented good contact between the deposit

and the ATR crystal. Consequently, four identical samples were required inorder to obtain satisfactory spectra, and generally only one or two sampleswere available. Photoacoustlc spectroscopy lacked adequate signal to no_seratio, particularly at the lower frequencies. The single reflectance mode wasrapid to use and provided good quality spectra. However, it did not affordthe opportunity to do in sltu post-deposlt stressing of samples. The emissionmode afforded adequate sensitivity and resolution, and was the only mode whichalso provided the ability to do in sltu post-deposit thermal stressing ofsamples. Consequently, it was selected for continued use as a surface analy-sis technique. The results of this portion of the investigation are brieflysummarized in table II.
Unsplked Fuel Deposits
All commercial fuels contain small amounts of a large variety of com-
pounds which readily undergo free radical air oxidation. Regardless of the
fuel, the products obtained from the oxidation reactions presumably contain
similar functional groups (alcohols, ketones, peroxides, carboxylIc acids,
etc.), although their exact individual structures may vary. These relatively
polar compounds would then tend to separate out of the relatively nonpolar
fuel, producing deposits containing compounds with similar functional groups
(ref. 5). Since infrared spectroscopy detects the functional groups of com-
pounds, the infrared spectra of most fuel deposits should be similar in the
functional group region from approximately 1300 to 2000 cm-l, However, the
fingerprint region from 400 to 1300 cm-l is dependent upon the exact chemi-
cal structure. Therefore, differences in band frequencies should exist in the
flngerprln, region. This can be seen for fuel deposits from a variety of
fuels (Jet A, ERBS, JP-4, JP-5) in figure 2. These spectra are comparable to
spectra of deposits already in the fuels literature (refs. 6 and 7).
However, a model fuel prepared from purified dodecane and tetralln does
not contain the large variety of compounds presumably important in deposit
formation in actual fuels. Consequently, the deposit produced from this model
fuel might be expected to be somewhat different than deposits produced from
actual fuels, as is seen by the differences in band frequencies in the spectra
in figure 2.
Stress Temperature
Although it is generally recognized that the fuel stress temperature af-
fects the rate of oxidation as well as rate of deposit formation, It is not
known whether it also affects the type of functional groups produced or the
degree of oxidation or polymerization which occurs when fuels produce depos-
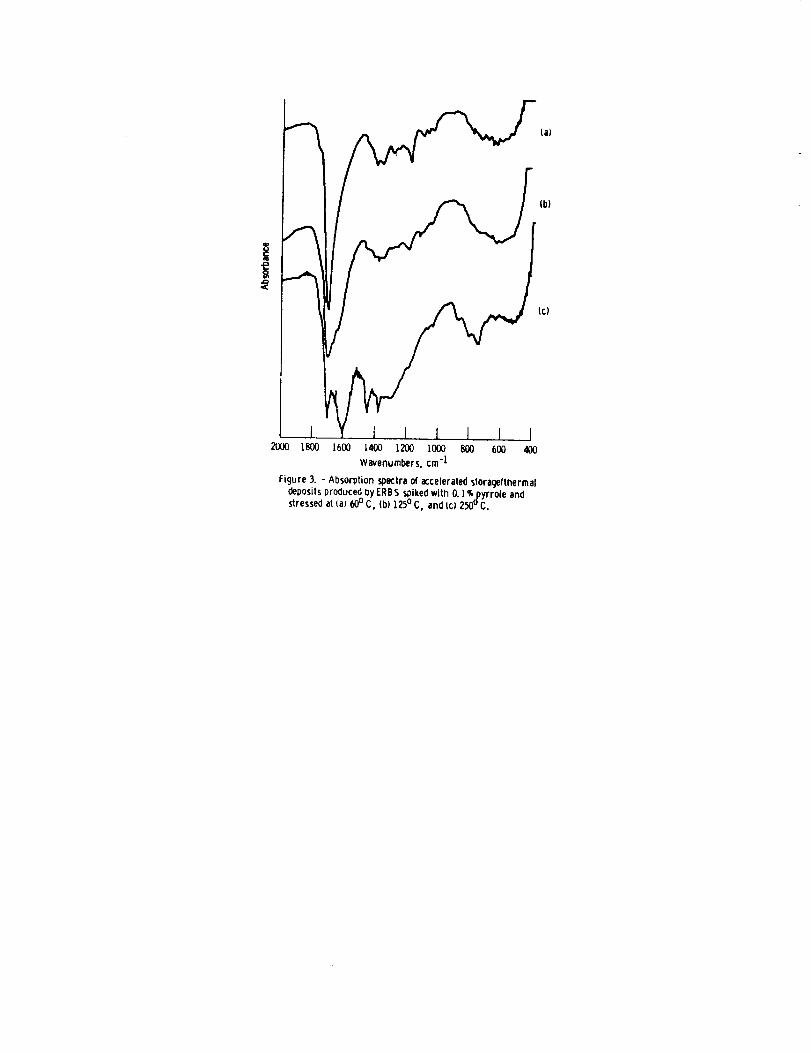
its. The differences in the spectra of figure 3 at ll80 cm -l and 1450 to
1650 cm-I for deposits obtained from ERBS spiked with pyrrole and stressed
at 60°, 125 °, and 250 ° C under static conditions (as well as differences in
spectra for deposits from ERBS spiked with l percent shale extract, and un-
spiked ERBS) suggest that stress temperature may be important in determining
the type of functional groups present. At this time, it is not possible to
determine what factors are significant in determining the effects of thestress temperature on the nature of the deposit, although some suggestions
have recently been made (ref. 8).

Length of Stress Tlme
The similarity of band frequencies in spectra for deposits from dodec-
ane/tetralln spiked wlth thlophene (fig. 4) as well as ERBS spiked with
pyrrole obtained after different lengths of stress tlme indicate that the
length of stress tlme has little effect on the type of functional groups inthe deposit.
In order for precipitates to form, compounds must undergo sufficient
oxidation and/or polymerization to become insoluble in the relatively nonpolar
fuel. Apparently, the major changes In chemical structure occur before,rather than after, separatlon has occurred, wlth the introduction of several
new types of oxygen containing functional groups. That Is not to say that no
further reaction (i.e., "aging", crystallization, or polymerization) Is occur-
ring In the deposit after It has formed (ref. 8). However, any further
reaction may simply be introducing more of the same types of functional
groups, rather than new types of functional groups, Into the deposit.
Consequently, the "age" of the deposit would have little effect upon theinfrared spectrum. Thus, infrared data obtained on fuels which have had suf-
ficient stress tlme to produce enough deposit to give a reasonable spectrumshould still be comparable, even though the stress times are different.
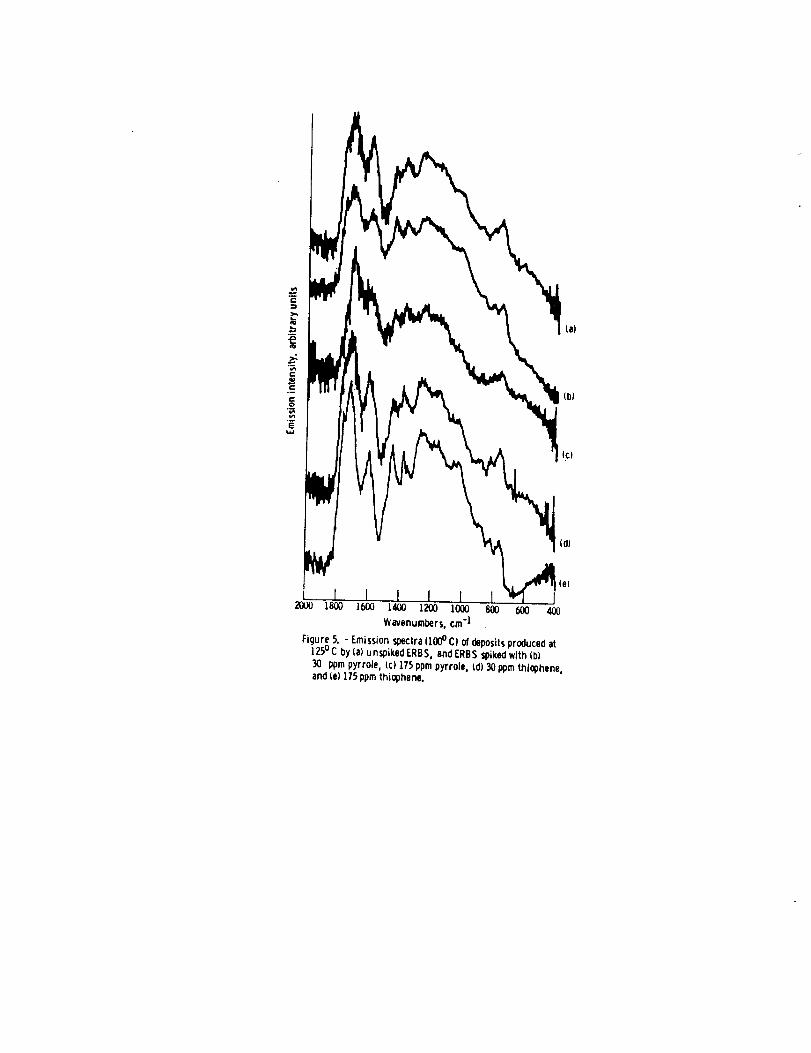
Spiking Agents
Since commercial fuels already contain low concentrations of a broadvariety of compounds containing heteroatoms, the addition of a small amount
(175 ppm or less) of nitrogen or sulfur In the form of a heterocycle such aspyrrole or thlophene might not change the chemical composition of the fuel
enough to appreciably alter the chemical reaction paths leading to deposltformation. Therefore, it Is not surprising that it Is difficult to detect
significant differences In band frequencies or relative intensities In the
spectra of the deposits from ERBS spiked with pyrrole or thlophene (fig. 5),or Jet A spiked wlth qulnollne, thlophene, or shale extract, regardless of the
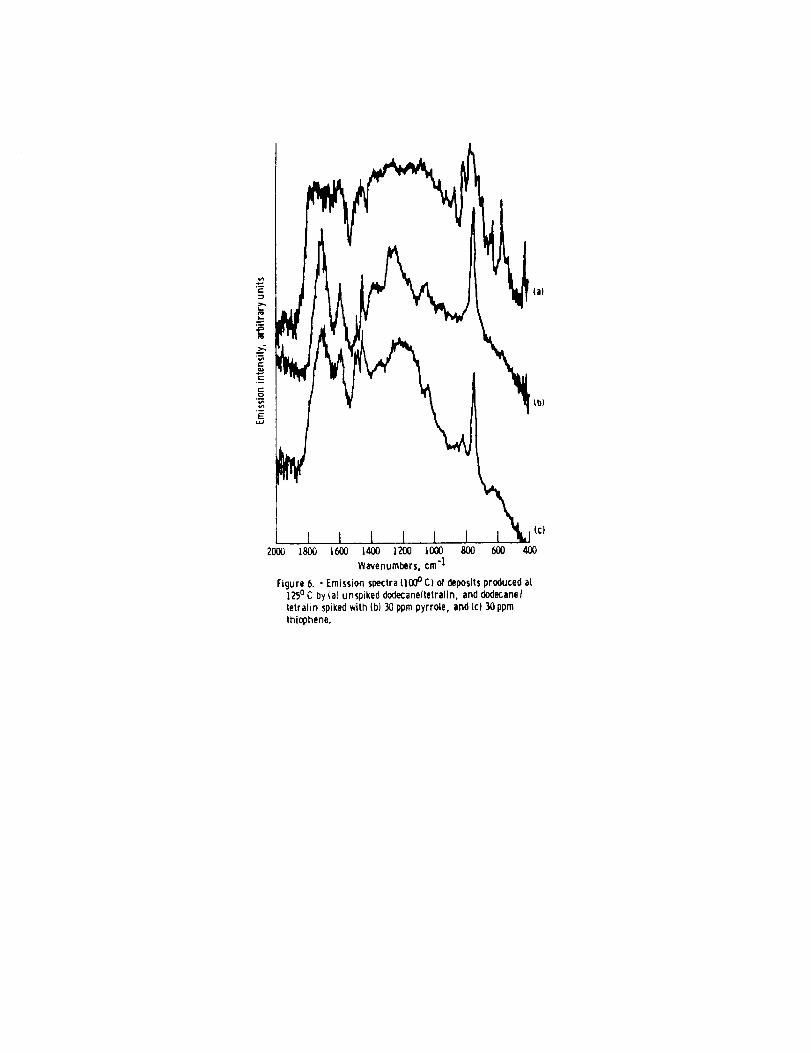
spiking agent, as long as the concentration Is low. However, the model fuel
prepared from purified dodecane and tetralln does not contain appreciable
concentrations of compounds containing heteroatoms. Consequently, addition of
even low concentrations of pyrrole or thlophene apparently alters the chemical
reaction paths sufficiently to significantly affect the chemical nature of the
deposit, as seen by the differences In the 500 to 900 cm-l region of thespectra of figure 6.
At higher concentrations (500 ppm or more), however, the spiking agentdetectably affects the nature of the deposit as seen by the differences In
band frequencies in figure 7 for ERBS spiked with pyrrole, thlophene, fuel
oll, and shale extract. (Concentrations between 175 and 500 ppm were not
investigated.) However, the effect of a high concentration of spiking agent
Is generally not sufficient to totally dominate the reaction paths leading to
deposit formation, and thus the nature of the deposit itself, regardless of
the fuel employed. The deposit produced by fuels such as ERBS, Jet A, dode-
cane, or dodecane/tetralln spiked with pyrrole, shale extract, thlophene, orfuel oll Is dependent on the fuel used.

Fuel Flow
Although It ls difficult to obtain deposits under the flowing fuelconditions of the Modified JFTOT Flat Sample Rlg which are heavy enough to beanalyzed by commercial FTIR absorption or emission techniques, results on twodeposits (ERBS spiked wlth shale extract, and dodecane/tetralln spiked withpyrrole at 250 ° C) providing marginal spectral quality have been obtained.Comparison of their spectra wlth the spectra of deposits produced under sta-tionary fuel conditions at 250 ° C (fig. 8) suggests that fuel flow probablyhas an effect on the nature of the deposit, as has prevlously been suggested(ref. 8). However, spectra of better quality must be obtained before thisconclusion can be substantiated.
Post-deposltlonal Treatment of Deposit
Deposits are coated wlth a thln fllm of fuel when they are removed from
the preparation apparatus. In order to be able to analyze the deposit without
interference from the fuel, It Is necessary to remove the film. Thls Is gen-erally done by rinsing the deposit wlth hexane followed by drying at 80 ° C and60 tort for 2 hr. The deposit must remain unaltered under these conditions if
accurate and reliable data are to be obtained on the nature of the deposit asit Is produced In the fuel.
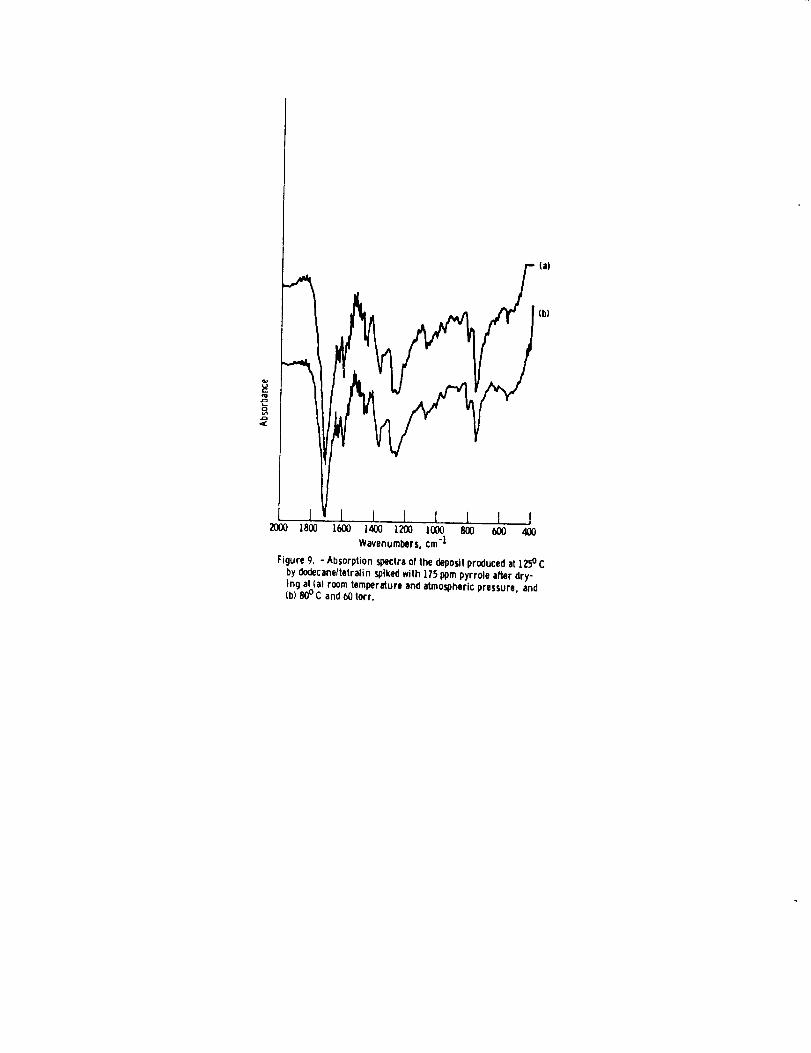
The similarity of band frequencies and relative intensities In the ab-
sorption spectra shown in figure 9 for dodecane/tetralln spiked with pyrrole
indicates that heating under vacuum, as described above, does not drasticallyaffect the bulk of the deposit. However, differences In the 500 to llO0
cm -I region of the emission spectra (fig. lO) on the same deposits suggest
that some type of change may have occurred on the surface of these deposits.
That not all deposits undergo these surface changes can be demonstrated by thesimilarity of the emission spectra (not shown) for ERBS spiked wlth pyrroleand Jet A spiked with shale extract.
If the differences are due solely to loss of low molecular weight
volatile components from the surface, then room temperature vacuum drying of
the deposit at 0.05 torr would be expected to produce emission spectra whichare different than emission spectra obtained on deposits dried at room
temperature and atmospheric pressure. Comparison of such spectra, for ex-
ample, dodecane/tetralln spiked wlth pyrrole, (fig. ll) indicates that gener-ally this Is not the case. These findings suggest that the surface of the
deposit does not always contain the same functional groups or distribution of
functional groups as the bulk, and that the changes In the surface or bulkwhich occur wlth heating might also be ascribed to the loss of volatile com
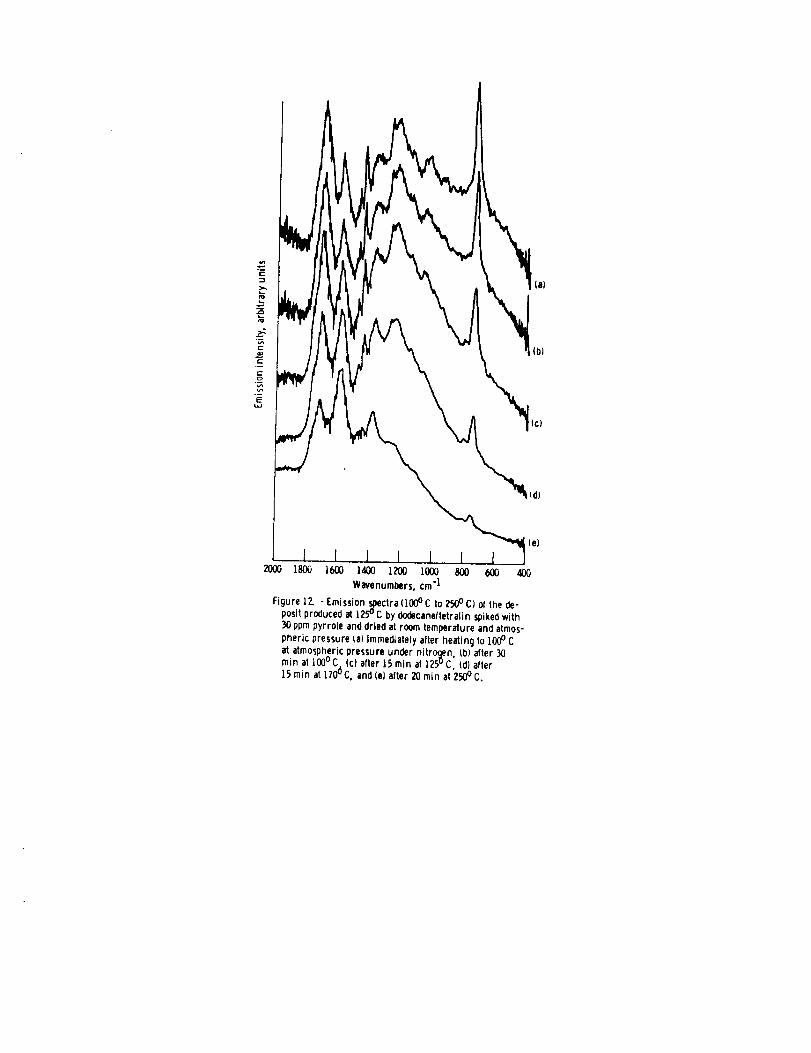
ponents produced by oxidation, condensation, or pyrolysis reactions induced byth_s heating. This hypothesis Is supported by the observation that on heating
of the sample from lO0 ° to 250 ° C at atmospheric pressure, the emission spec-
trum becomes weaker and loss of material from the deposit Is visibly appar-ent. Scanning electron microscope photographs show loss of material fro_ the
deposit as well. Furthermore, emission spectra obtained as the temperature Is
increased from lO0 ° to 250 ° C indicate that some samples, such as the depositfrom dodecane/tetralln spiked with pyrrole, which have been dried at atmos-
pheric pressure and room temperature undergo relatively major changes both in
band frequencies and relative intensities as material Is lost (fig. 12).
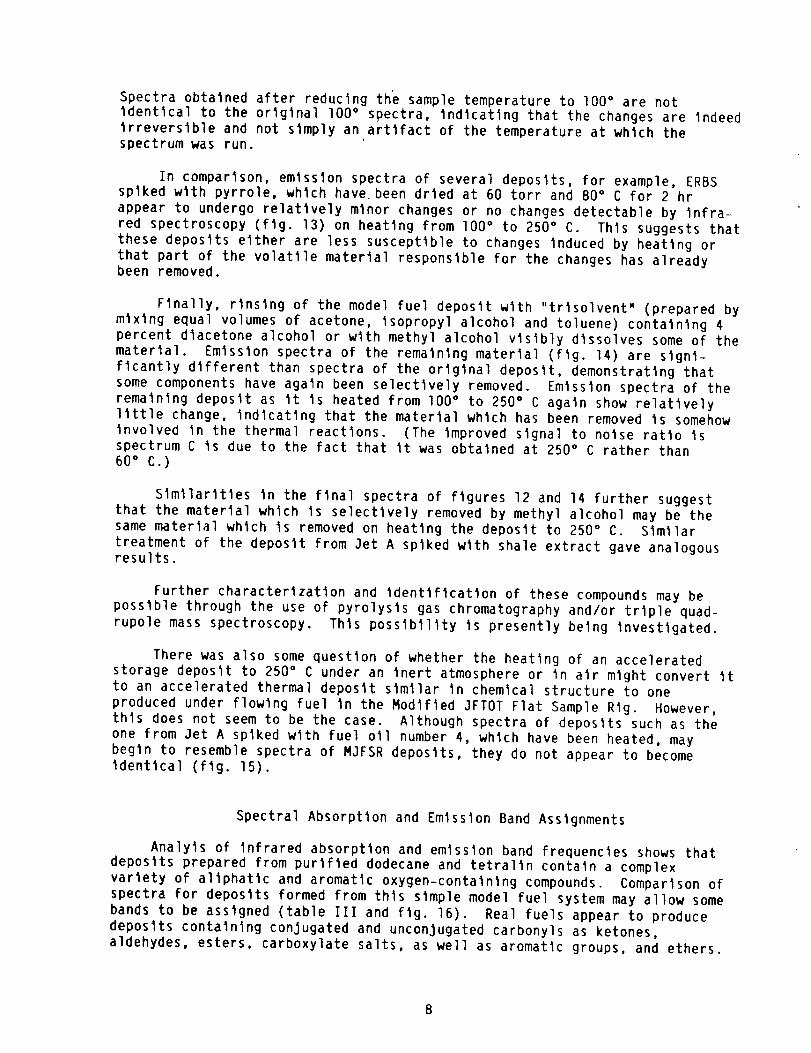
Spectra obtained after reducing th'e sample temperature to I00° are not
identical to the original lO0 ° spectra, indicating that the changes are indeed
irreversible and not simply an artifact of the temperature at which theJ
spectrum was run.
In comparison, emission spectra of several deposits, for example, ERBS
spiked with pyrrole, which have. been dried at 60 torr and 80° C for 2 hr
appear to undergo relatively minor changes or no changes detectable by infra-
red spectroscopy (fig. 13) on heating from lO0 ° to 250 ° C. This suggests that
these deposits either are less susceptible to changes induced by heating or
that part of the volatile material responsible for the changes has alreadybeen removed.
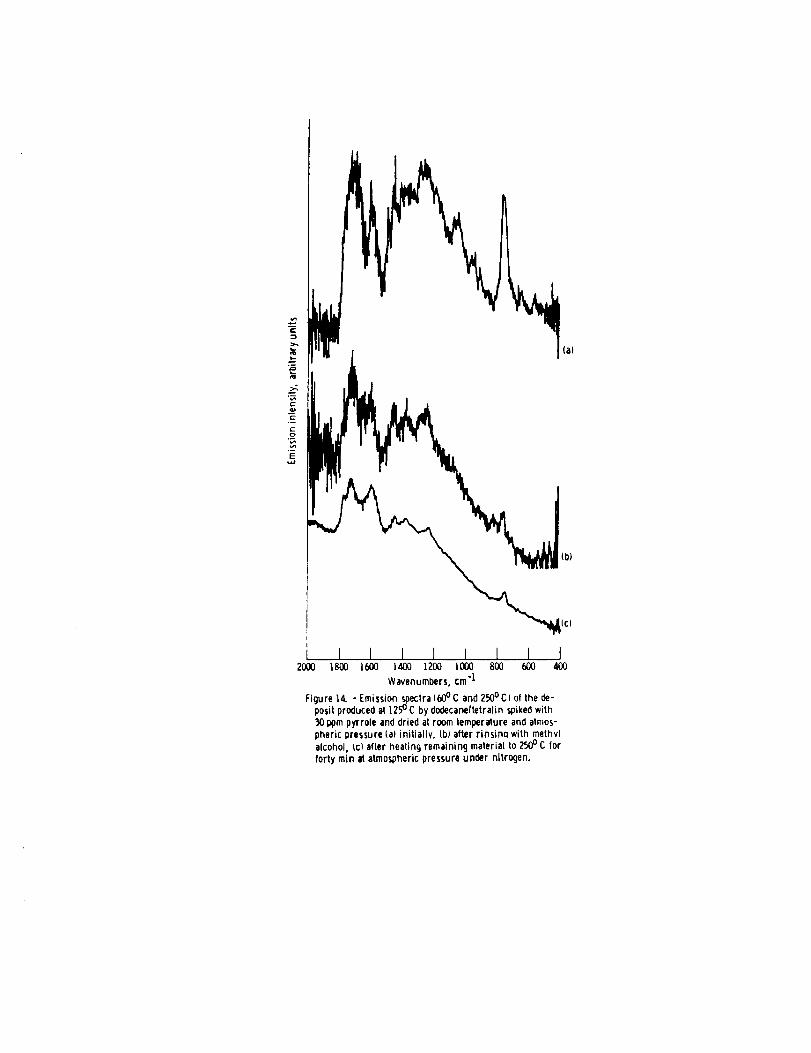
Finally, rinsing of the model fuel deposit wlth "trlsolvent" (prepared by
mixing equal volumes of acetone, Isopropyl alcohol and toluene) containing 4
percent dlacetone alcohol or with methyl alcohol visibly dissolves some of thematerial. Emission spectra of the remaining material (fig. 14) are signi-
ficantly different than spectra of the original deposit, demonstrating that
some components have again been selectively removed. Emission spectra of the
remaining deposit as it is heated from lO0 ° to 250 ° C again show relatively
little change, indicating that the material which has been removed is somehow
involved in the thermal reactions. (The improved signal to noise ratio is
spectrum C is due to the fact that it was obtained at 250 ° C rather than
60° C.)
Similarities in the final spectra of figures 12 and 14 further suggest
that the material which is selectively removed by methyl alcohol may be the
same material which is removed on heating the deposit to 250 ° C. Similar
treatment of the deposit from Jet A spiked with shale extract gave analogousresults.
Further characterization and identification of these compounds may bepossible through the use of pyrolysis gas chromatography and/or triple quad-
rupole mass spectroscopy. This possibility is presently being investigated.
There was also some question of whether the heating of an accelerated
storage deposit to 250 ° C under an inert atmosphere or in air might convert it
to an accelerated thermal deposit similar in chemical structure to one
produced under flowing fuel In the Modified JFTOT Flat Sample Rig. However,
this does not seem to be the case. Although spectra of deposits such as the
one from Jet A spiked with fuel oll number 4, which have been heated, may
begin to resemble spectra of MJFSR deposits, they do not appear to become
identical (fig. 15).
Spectral Absorption and Emission Band Assignments
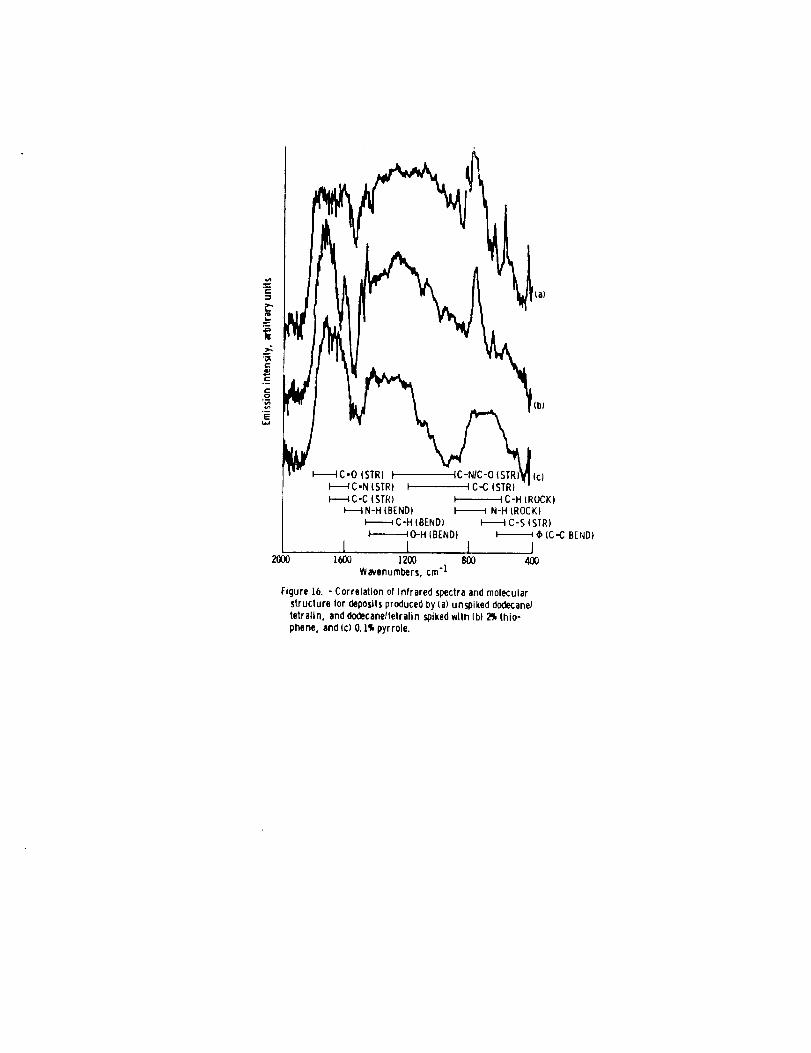
Analyls of infrared absorption and emission band frequencies shows thatdeposits prepared from purified dodecane and tetralln contain a complex
variety of allphatlc and aromatic oxygen-contalnlng compounds. Comparison of
spectra for deposits formed from this simple model fuel system may allow some
bands to be assigned (table Ill and fig. 16). Real fuels appear to produce
deposits containing conjugated and unconJugated carbonyls as ketones,
aldehydes, esters, carboxylate salts, as well as aromatic groups, and ethers.
8

Heterocycles such as pyrroles and thlophenes may also be present. However,actual fuel deposits are generally too complex to be able to make specificband assignments with any degree of certainty.
CONCLUSIONS
The Nicolet 7199 Fourier Transform Infrared Spectrophotometer offers five
modes of operation: absorption, emission, single reflectance, attenuated
total reflectance, and photoacoustlc. The absorption and emission modes were
found to be the most suitable for qualitative analysis of bulk and surface
properties of accelerated storage/thermal deposits produced under static fuelconditions.
Real fuels produce similar but not identical accelerated storage/thermaldeposits. These deposits can readily be distinguished from deposits produced
by a model fuel consisting of dodecane and TO percent tetralln. The nature of
the deposits appears to be dependent upon the stress temperature, but inde-
pendent of the length of stress time.
Low concentrations (175 ppm or less) of spiking agents appear to havelittle, if any, effect on the nature of the deposit for real fuels. Highconcentrations (500 ppm or more), on the other hand, appear to have a majoreffect on the nature of the deposit.
Accelerated storage/thermal deposits produced under static fuel con-
dltlons at 250 ° C appear to be different than accelerated thermal deposits
produced on stainless steel foll under flowing fuel conditions in the Modified
JFTOT Flat Sample Rig.
Generally, changes occur in the FTIR emission spectra on heating the
accelerated storage/thermal deposits under nitrogen, or in the presence of
oxygen. Comparison of absorption spectra (a bulk property technique) and
emission spectra (a surface property technique) as well as vacuum drying
experiments and solvent extraction experiments indicate that these changes may
be due to loss of volatile components produced by oxidation, condensation or
pyrolysis reactions induced by heating. However, these storage/thermal
deposits do not appear to be converted to accelerated thermal deposits on
heating.
Because of the relatively small number of possibilities, limited infrared
band assignments may be made on deposits from simple model fuel systems.However, deposits from real fuels have the potential of being much more
complex. Consequently, for these deposits specific band assignments are dlf-flcult to make.
Additional information concerning the chemical structure of fuel depositsmay be obtainable from more sophisticated FTIR instruments such as thepolarlzatlon-modulated Fourier infrared emission mlcrospectrophotometerpresently being operated by Lauer (refs. 8 and 9). Preliminary work alsosuggests that identification of specific compounds present in deposits fromthe model fuel may be possible using gas chromatography/trlple quadrupole massspectroscopy.
9
l •
0
.
.
.
•
/ •
a.
gm
lO.
REFERENCES
Baker, C. E., et al.: Research on Aviation Fuel Instability. NASATM-83420, 1983.
Nagasawa, Y.; and Ishitanl, A.: Application of Fourier Transform Infra-
red Emission Spectrometry to Surface Analysis. Appl. Spectrosc., vol.
38, no. 2, Mar./Apr. 1984, pp. 168-173.
Dahlln, Kenneth E.; Daniel, Stephen R.; and Worstell, Johnathan H.:Deposlt Formation in Liquid Fuels. I. Effect of Coal-derlved Lewis Bases
on Storage Stability of Jet A Turbine Fuel. Fuel, vol. 60, no. 6, June
IgSl, pp. 477-480.
Cohen, S. M.: Fuels Research-Fuel Thermal Stability Overview. Aircraft
Research and Technology for Future Fuels. NASA CP-2146, Ig80, pp.161-168.
Peat, A. E.: Fuel Thermal Stability. Propulsion and Energetics Panel,
Working Group 13 on Alternative Jet Engine Fuels, Vol. 2, R. B. Whyte,
ed., AGARD-AR-181-Vol-2, 1982, pp. ll9-141. (AD-Al19917)
Brlnkman, O. W.; Whisman, M. L.; and Bowden, 3. N.:
Istlcs of Hydrocarbon Fuels from Alternative Sources.Mar. 1979.
Stability Character-
BETC/RI-TB/23,
Daniel, S. R.: Studies of the Mechanisms of Turbine Fuel Instability.(Colorado School of Mines; NASA Contract NSG-3122.) NASA CR-167963, 1983.
Lauer, J. L.; and Keller, L. E.: Oxidized Aircraft Fuel Deposits onMetal Surfaces Studied by Polarization - Modulated Fourier Infrared
Emission Microspectrophotometry. Appl. Surf. Sci., vol. 15, Mar. 1983,
pp. 50-65.
Lauer, O. L.; and Vogel, P.: Emission FTIR Analyses of Thin Microscoplc
Patches of Jet Fuel Residue Deposited on Heated Metal Surface. (Rens-salaer Polytechnic Inst.; NASA Grant NAG3-205.) _ NASA CR-168331, 1984.
Seng, Gary T.: Characterization of An Experimental Referee Broadened
Specification (ERBS) Aviation Turbine Fuel and ERBS Fuel Blends. NASATM-82883, 1982.
IO
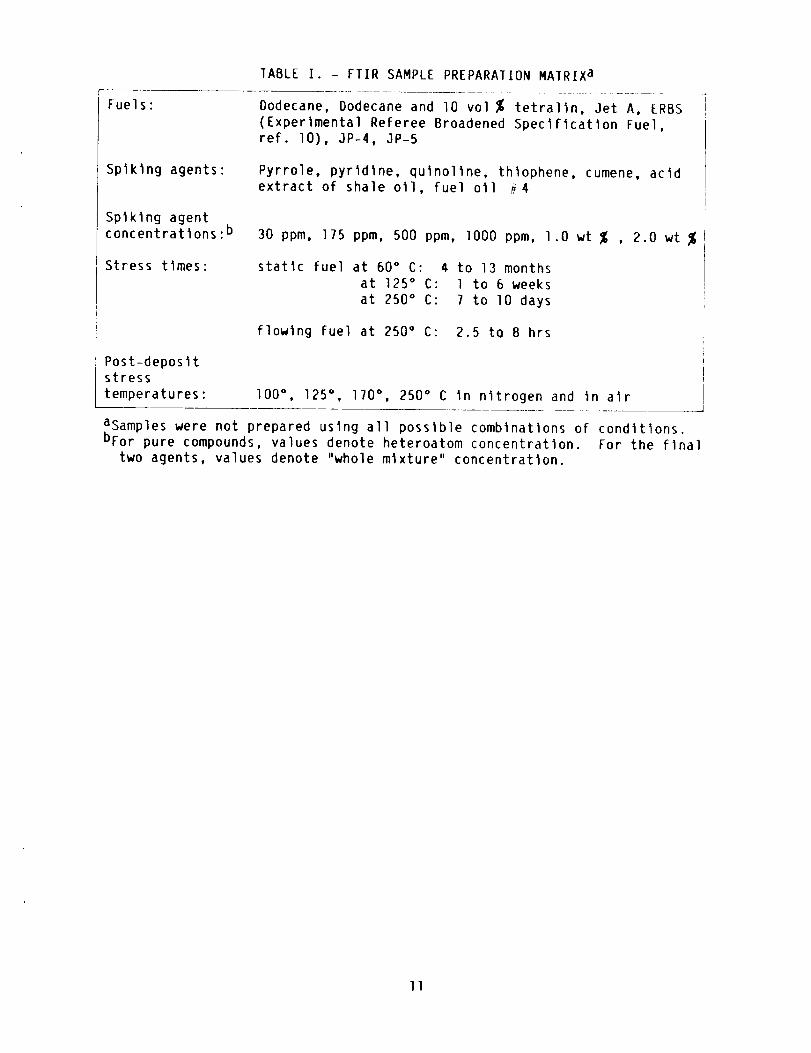
Fuels:
TABLEI. - FTIR SAMPLEPREPARATIONMAIRIXa
Dodecane, Dodecaneand lO vol % tetralln, Jet A, ERBS
(Experimental Referee Broadened Specification Fuel,ref. lO), JP-4, JP-5
Splklng agents: Pyrrole, pyrldine, quinollne, thlophene, cumene, acldextract of shale oil, fuel o11 #4
Spiking agentconcentratlons: b
Stress times:
30 ppm, 175 ppm, 500 ppm, lO00 ppm, l.O wt % , 2.0 wt
statlc fuel at 60° C: 4 to 13 months
at 125 ° C: 1 to 6 weeks
at 250 ° C: 7 to lO days
flowing fuel at 250 ° C: 2.5 to 8 hrs
Post-deposltstress
temperatures: I00 °, 125 ° , 170 ° , 250 ° C in nitrogen and in alr
aSamples were not prepared using all possible comblnatlons of conditions.bFor pure compounds, values denote heteroatom concentration. For the flna]
two agents, values denote "whole mixture" concentration.
II
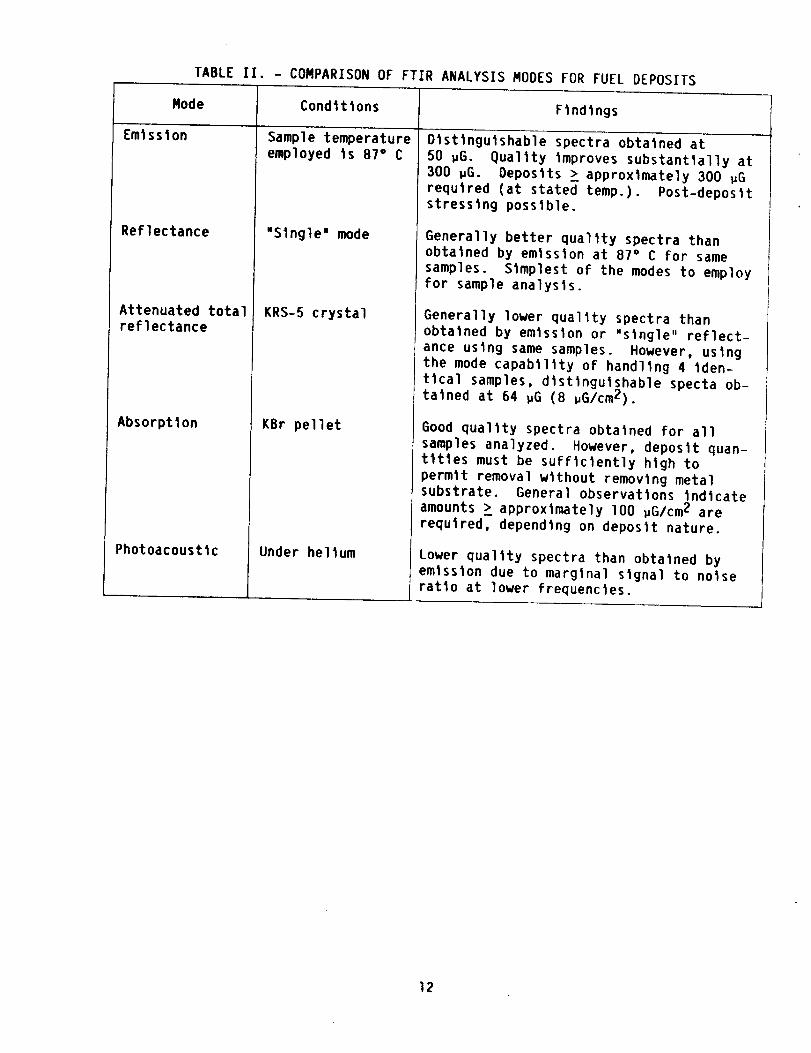
TABLE II - COMPARISON OF FTIR ANALYSIS MODES FOR FUEL DEPOSITS
Mode Conditions Findings
Emission Olstlngulshable spectra obtalned at
Reflectance
Attenuated totalreflectance
Absorption
Photoacoustlc
Sample temperature
employed ts B/° C
"Single" mode
KRS-5 crystal
KBr pellet
Under helium
50 vG. Quality improves substantially at
300 vG. Deposits _ approximately 300 _G
required (at stated temp.). Post-deposlt
stressing possible.
Generally better quality spectra than
obtained by emission at 87" C for same
samples. Simplest of the modes to employfor sample analysis.
Generally lower quality spectra than
obtained by emission or "single" reflect-
ance using same samples. However, usingthe mode capability of handling 4 iden-
tical samples dlstlngulshable specta ob-talned at 64 _G (8 _G/cm2).
Good quality spectra obtained for all
samples analyzed. However, deposit quan-
tities must be sufficiently hlgh to
permit removal without removing metalsubstrate. General observations indicate
amounts _ approximately lO0 _G/cm 2 are
required, depending on deposit nature.
Lower quallty spectra than obtained by
emission due to marginal signal to noiseratio at lower frequencies.
12
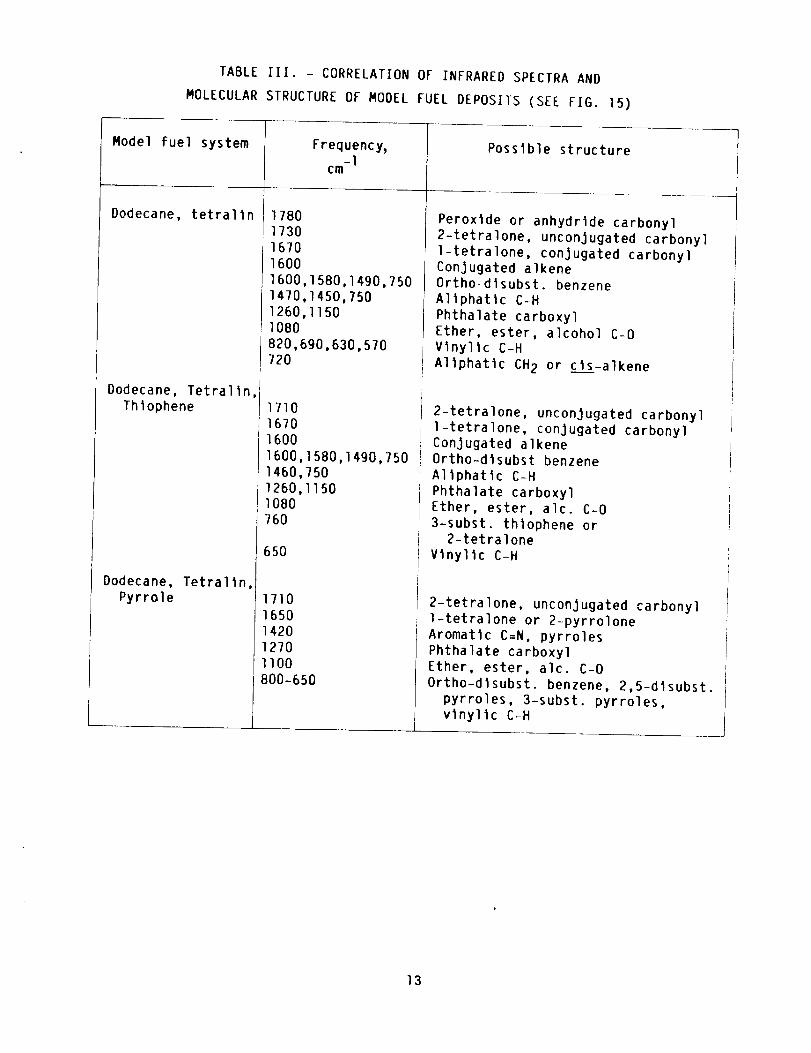
TABLE Ill. - CORRELATION OF INFRARED SPECTRA AND
MOLECULAR STRUCTURE OF MODEL FUEL DEPOSITS (SEE FIG. 15)
Model fuel system
Dodecane, tetralln
Frequency,-1
cm
17801730
1670
1600
1600,1580,1490,750
1470,1450,750
1260,I150I080
820,690,630,570
Posslble structure
Peroxlde or anhydrlde carbonyl
2-tetralone, unconjugated carbonyl
l-tetralone, conjugated carbonyl
Conjugated alkeneOrtho-dlsubst. benzene
Allphatlc C-H
Phthalate carboxyl
Ether, ester, alcohol C-O
Vlnyllc C-H720
Dodecane, Tetralln,
Thlophene 1710
1670
1600
1600,1 580,1490,750
Allphatlc CH 2 or cls-alkene
2-tetralone, unconJugated carbonyl1-tetralone, conjugated carbonylConjugated alkeneOrtho-d_subst benzene
1460,750
1260,I150I080
760
650
Dodecane, Tetralln,
Pyrrole 1710
1650
1420
1270
II00
800-650
Allphatlc C-H
Phthalate carboxyl
Ether, ester, alc. C-O
3-subst. thlophene or2-tetralone
Vinyllc C-H
2-tetralone, unconJugated carbonyl
l-tetralone or 2-pyrrolone
Aromatlc C=N, pyrroles
Phthalate carboxylEther, ester, alc. C-O
Ortho-dlsubst. benzene, 2,5-dlsubst.
pyrroles, 3-subst. pyrroles,
vlnyllc C-H
13

e--QJ
C
g
o--
.e
(b)
c
,.J
(¢)
2000 lgO0 1600 l_O 1200 lO00 800 600 400
Wavenumbers,cm"1
Figure 1. - Spectraof polystyrenefilm. (a) absorption,(b)emission(100o C), and (c) photoacoustlc.

e-.::3
e--
o=
I I I I I ] I I
(d)
(e)
Z8OO 1600 14OO ) ZOO |000 8OO 600 400
Wavenumbers, cm-]
Figure 2- - Emission s,oectra (lO0°C) of accelerated sloragelthermal deposils produced a! |25o C by neat taJ dodecanel
lelralin, Ib_ ERBS, it) JP-4, Id) JP-5, and (el Jet A.
(a)
(b)
(c)
,,IC
(aJ
(b)
(c)
I 1 J J l2000 1800 1600 1400 1200 1000 800 600 400
Wavenumbers. cm-l
Figure 3. - Absorption spectra of accelerated storage/thermal
deposits produced by ERBS spiked with O.1%pyrrole andstressed at {a) 600 C, (b) 1250 C, and tc) 2_°C.

P
1400 1200 1000 800 60OWavenumbers. cm "1
Figure 4. - Emission spectrallO0° C) ofdepositsproducedat1250C byOodecaneltetralinspikedwith 2 Percentthiopheneafter (a) 6 days, (b) 13 (lays, and(c) 24days.
(a)
(c)
40O
vl
e--
e
e.-.-
o:
owE
u.J
(a)
(bl
I I I I I I _q'"l_e_2000 1800 1600 1400 1200 I000 800 600 400
Wavenumbers, cm"1
Figure 5. - Emission spectra (lO0° C) of depositsproduced at1250C by(a) unspiked£RBS, and ERBSspikedwith (b)
3Q ppmpyrrole, ic) 175ppmpyrrole. (d) 30ppm thiophene,and(e) 175ppmthiophene.
(a)
I 11600 1400 1200 lO00
Wavenumbers,cm -I
80O 6OO
Figure 6. - Emissionspectra(lO0° C) ofdepositsproduced at12.5oC by(a) unspikeddodecaneftetralin,and dodecane!tetralin spikedwith (b) 30 ppmpyrrole, and(cl 30 ppmthiophene.

20001800 X600 1400 1200 1000 800 600 400Wavonumbers. cm"|
Figure 7. - Emissionspectre (]O0° C) of depositsproducedat 12.5oC by(a) unspikedF.RBS,and ERBSspikedwith(hi O.| 'I, pyrrole, (cl 1• thlophtlne, (d) 1'/, fuel oil,and (el ! '/, shale extract.

¢:::}
.m
e
La)
(dl
2000 1800 ]600 1400 1200 IO00 800 600 400
Wavenumbers, cm "I
Figure 8. - Emission spectra(I.00° C¿of acceleratedstorage/thermaldepositsproducedat250oC byERBS spikedwith
)_ shale extract under _a) flowingfuet, ib) stationaryfuel. and by dodecane/tetralin spikedwith (11 '/, pyrroleunder (c) flowingfuel, (d} stationaryfuel.
I
I I I 1 I I200 1800 1600 i400 1200 1000 800 600 400
Wavenumbers, cm -|
Figure 9. - Absorption spectra of the deposit produced at 125o C
by dodecanettetralin spiked with ]75 ppm pyrrole after dry-ing at (a} room temperature and atmospheric pressure, and(b) 800 C and 60 torr.
(a)
(b)

e.-
z:v_c
N.--Eu.i
2OOO 1800
la)
(b)I I I I
1600 1400 IZO0 i000 800 600 400
Wavenumbers, cm-1
Figure 10. - Emission spectra(60° C) ofthe depositproducedat125°C bydodecaneltetralinspikedwith 175ppmpyrroleafterdrying at(a) roomtemperatureand atmosphericpressure and (b) 80° C and60 torr.

r-
_>:mq,n
¢=._
o_
tai
2000 %800 1600 1400 1200 1000 800 600 400Wavenumbers, cm"l
Figure 11. - Emissionspectra(60o CI of the depositproducedat ]Z5o C bydodecaneltetralinspikedwith 30 ppmpyrroleand driedat room temperatureand(a) atmosPheric pres-sure (hi O.05 torr.
eat
e--
>,.,
=o
"_=t,:,J
(c)
J I2000 1800 1600 1400 1290 1000 800 600
Wavenumbers,cm"1
Figure 12. - Emissions.pectra(lO0°C to 250°Cj of the de-positpr_uced at 125"C bydodecaneltetralin spikedwith30 ppmpyrrole anddried at roomtemperatureandatmos-pheric pressure lal immediatelyafter heating to 100o Cat atmosphericpressure under nitroqen, tb) after 30rain at100° C. (c} after |Smin at ].25°C, (d) after15 mi n at 170_ C, and (e} after 20 rain at 2.500C.

o=
(c)
I J2000 1800 1600 1400 1200 I000 800 600
Wavenumbers,cm "I
Figure13.-Emission_tra (I0__C to2500C)ofthedeoposit produced at 125v C byERBSspikedwith O.1'/,pyrroleand driedat 80° C and 60 torr (a) immediatelyafter heat-ing to lO0°C atatmosphericpressure under nitrogen,Ib) after 30rain at 170°C, and(c) after 30rain at 290°C.
e,-
b..
o:
i=w
(b)
2000 1800 1600 1400 1200 1000 800 600 400
Wavenumbers, ¢m "l
Figure 14. - Emission s:pectra(_° C and 2500 C I of the de-posit produced at 125uc by dodecaneltetralin spiked wilh
30 POrepyrrole and dried at room temperature and atmos-
pheric pressure (a_ initially. (b) after rinsino with methyl
alcohol, (el after heating remaining material to 2500 C for
forty rain at atmospheric pressure under nitrogen.

c
ce_
c_
g
E
2000 1600 1200 800
Wavenumber5o ¢m']
Figure 1.5. - £mJ55ion _ecfra (125 ° C and 25(]° C) o_ Ihe
_¢eleroled storage deposit produced 81 125o C by Je! A
5piked with 25 fuel oil No. 4 after (aJ 5 rain at 125° C
under nllro(jen, (b) 5 rain a( Zc_ C under nitrogen,
L¢) 1(] rain el 250° C in dr, and (d) 4 hr al Z._]° C in
air. (e) [mission _eclrum (250 ° C) of the 8cceJera-
ted lherm81 deposi( produced in Ihe MJFSR al 2.5(:)° C
by the same spiked fuel.
4OO
le
NIr
2OOO
_--_C-O (SIR) I tC-N/C-O(STR Ic)
C,NISIRt t I C-C (SIR)
_C-C (SIR) _ C-H (ROCK)_N-H (BEND) _ N-H (ROCK)
_.--_ C*H (BEND) _ C-S (STR)
_O-H (BEND) F------4 4, (C-C BEND)
[ I [ J1600 1200 800 400
Wavanumbers, ¢m -I
Figure 16. - Correlation of infrared spectra and molecular
structure for deposits produced by (a) unspiked dodecanel
tetralin, and dodecaneltetralin spiked with (bl 2% thio-
phene, and Ic) O.15 pyrrole.

I.Repot1No.NASA TM-83773
L
4. Title end Subtille
'2. Government Accession No. 3. Reclplent'li Cltelo_ No.
FTIR Analysis of Aviation Fuel Deposits
7. Author(s)
Larry S. Helmick and Gary T. Seng
g. Psr/ormlng Orgenlzetlon Nlme end Address
National Aeronautics and Space Administration
Lewis Research Center
Cleveland, Ohio 44135
i2. Sponsoring Agency Neme lind Address
National Aeronautics and Space Administration
Washington, D.C. 20546
September 1984
_. Plirforrnlng Orgmntzstlon Code
505-31-42
8. Performing Orgsnlzlillon Report No.
E-2200
!._: wo_ unltNo.
111. Contract or Grant No.
13. Tyl_l Of Rligort ind Pt!rio(:l Covlrl;'d "
Technical Memorandum
14. Sponsoring Agency Code
15. Supp|ementew Notes
Larry S. Helmick, Cedarville College, Cedarville, Ohio 45314 and NASA-ASEE
Faculty Fellow; Gary T. Seng, NASA Lewis Research Center.
lB. Abstract
Five modes of operation of the Nicolet 7199 Fourier Transform Infrared spec-trophotometer have been evaluated for application in analysis of the chemicalstructure of accelerated storage/thermal deposits produced by jet fuels.Using primarily the absorption and emission modes, the effects of fuel type,stress temperature, stress time, type of spiking agent, spiking agent concen-tration, fuel flow, and post-depositional treatment on the chemical nature offuel deposits have been determined.
17. Key Wo'rdli (Suggelitacl by Author(s))
Jet fuels; Fuel thermal deposits; Thermalstability; Fourier Transform InfraredSpectroscopy
19. Security CIssslf. (o| ihlli report)
Unclassified
111. Olstrlbuilon Stlilement
Unclassified - unlimitedSTAR Category 28
20. Securlly (_lesslf. (Of this page)
Unclassified
21. NO. of Pliges 22. Price"
"For sale by the National Technical Information Service, Springfield, Virginia 22161