fsp27/cidec is a creb target gene induced during fasting ... · fsp27/cidec is a creb target gene...
TRANSCRIPT

Joana Fernandes Gonçalves
Licenciatura em Bioquímica
Fsp27/CIDEC is a CREB target gene induced during fasting and regulated by
fatty acid oxidation rate
Dissertação para obtenção do Grau de Mestre em Biotecnologia
Orientador: Dr. Diego Haro Bustista, Professor Catedrático, Facultat de Farmàcia, Universitat de
Barcelona
Co-orientador: Dr. Pedro Marrero González, Professor Titular, Facultat de Farmàcia, Universitat de Barcelona
Presidente: Prof. Doutora Maria Ascensão Carvalho Fernandes Miranda Reis
Arguente: Prof. Doutora Maria Alexandra Núncio de Carvalho Ramos Fernandes
Setembro, 2012
Fsp27/CIDEC is a CREB target gene induced during fasting and regulated by fatty acid oxidation rate
Dissertação de Mestrado em Biotecnologia
Joana Fernandes Gonçalves
Dr. Diego Haro | Dr. Pedro Marrero Facultat de Farmàcia, Universitat de Barcelona
2012
i
Copyright
Fsp27/CIDEC is a CREB target gene induced during fasting and regulated by
fatty acid oxidation rate.
Joana Fernandes Gonçalves
FCT/UNL
UNL
A Faculdade de Ciencias e Tecnologia e a Universidade Nova de Lisboa têm o direito, perpétuo
e sem limites geográficos,de arquivar e publicar esta dissertação através de exemplares
impressos reproduzidos em papel ou de forma digital, ou por qualquer outro meio conhecido ou
que venha a ser inventado, e de a divulgar atraves de repositórios cientificos e de admitir a sua
cópia e distribuição com objectivos educacionais ou de investigacao, não comerciais, desde
que seja dado crédito ao autor e editor.

ii
iii
“Por que foi que cegámos, Não sei, talvez um dia se chegue a
conhecer a razão, Queres que te diga o que penso, Diz, Penso que
não cegámos, penso que estamos cegos, Cegos que vêem, Cegos
que, vendo, não vêem.”
José Saramago “Ensaio sobre a Cegueira”

iv

v
“Why did we go blind, I don’t know, maybe one day we’ll find out, Do you
want me to tell you what I think, Yes, I don't think we did go blind, I think we
are blind, Blind but seeing, Blind people who can see, but do not see.”
José Saramago, “Blindness”

vi
vii
Acknowledgments
The present study was supported by many people whose advice knowledge and
encouragement were critical throughout this year of research in the Department of Biochemistry
and Molecular Biology of the Pharmacy School, University of Barcelona, and I’m indebted to all
of them.
I am grateful to Dr. Diego Haro and Dr. Pedro Marrero who allowed me to integrate their
research team, for the project design, all the support, encouragement and teaching and whose
dedication to produce high quality science inspired by best efforts and made this a rewarding
experience.
One of the special advantages during this process was the access to the extraordinary
community of researchers at Pharmacy School. I wish to thank the entire team of the Signaling
Transduction Lab, doctors Joana, Ana Luísa, Helena and Mariona and Albert whose teaching,
trust, experience, wisdom, friendship and constructive challenges inspired the improvements of
this project and made it possible. I have to particularly thank Dr. Ana Luísa since she helped to
coordinate the entire project and whose teaching and trust was a hallmark in my scientific
development this year.
Further, I thank my colleague and friend Alexandra Rosário whose support and friendship were
crucial throughout all this process and for the constant and graceful presence to the long
evenings and weekends we devoted to the lab.
Finally, I express my deepest appreciation to my family, who supported this project and
provided constant encouragement.

viii
ix
Abstract
Fsp27 (CIDEC the human homologue) is a lipid droplet protein that when overexpressed down
regulates fatty acid oxidation (FAO). Previous results of this group showed that Fsp27/CIDEC
expression is regulated by fasting in liver in a time-dependent manner. The present study aimed
to elucidate the mechanism by which Fsp27/CIDEC is mediating fasting adaptation and
regulated by FAO rate in liver. We showed that induction of Fsp27/CIDEC expression during
fasting is not regulated by PPARα. Pharmacological inhibition of FAO by etomoxir induces
Fsp27/CIDEC in fasting conditions and this regulation is not mediated by PPAR – a master
regulator in triglyceride accumulation. The early response to fasting can be explained by a
canonical PKA-CREB-CRTC2 signaling pathway, since CIDEC expression was increased by
forskolin which effect was lost when a vector containing a dominant negative of CREB construct
(KCREB) was co-transfected in HepG2 cells, and, consistently, Fsp27 promoter activity was
increased by CREB. Also, CIDEC expression was up-regulated by specific Sirt1 depletion by
siRNA in HepG2 cells. Our data demonstrate that Fsp27/CIDEC is a CREB target gene that
could be up-regulated when FAO is reduced and that fluctuations in SIRT1 activity, in response
to nutrient availability, mediate this mechanism.
The peroxissome proliferator-activated receptor gamma coactivator-1α (PGC-1α) induces and
coordinates gene expression that stimulates metabolic pathways linked to the fasted response
in liver including gluconeogenesis. We observed that Pgc-1α expression was increased in late
fasting in the liver of mice previously subjected to a leucin deprived diet. These conditions also
enhanced transcription from Foxa2 gene. This study showed that the mechanism regulating the
induction of Pgc-1α expression under these conditions is not mediated by the recruitment of
CREB by Foxa2 to the Pgc-1α or the Pepck promoters, since both promoters activities were not
enhanced by the co-transfection of FOXA2 with CREB in HepG2 cells.
Keywords: CIDEC/Fsp27; Fasting; FAO; CREB; SIRT1; Amino-acid deprivation; PGC-1α;
FOXA2.

x
xi
Resumo
Fsp27 (CIDEC, o homologo humano) é uma proteina associada às gotas lipídicas que quando
sobre-expressada inibe a oxidação dos ácidos gordos (FAO). Recentemente, resultados deste
grupo demonstraram que a sua expressão é regulada durante o estado de jejum no fígado no
decurso do tempo. Neste estudo pretende-se elucidar o mecanismo pelo qual Fsp27/CIDEC
medeia a adaptação ao jejum e a sua regulação pela taxa de FAO no fígado. Demonstrou-se
que a sua indução durante o jejum não é regulada por PPARα e a indução registada pela
inibição farmacológica da FAO por etomoxir não é mediada por PPAR – regulador crucial na
acumulação de triglicéridos. A resposta à fase inicial do jejum explica-se pela via de sinalização
PKA-CREB-CRTC2 uma vez que a expressão de CIDEC aumentou com forskolina e este
efeito foi atenuado com a transfecção de um dominante negativo de CREB em células HepG2.
Consistentemente, a actividade do promotor Fsp27 aumentou com CREB. A indução da
expressão de CIDEC observou-se com a supressão específica de Sirt1 por siRNA em células
HepG2. Estes resultados demonstram que Fsp27/CIDEC é um gene alvo de CREB cuja
expressão aumenta com redução da FAO e este processo é mediado pela actividade de
SIRT1.
PGC-1α induz e coordena a expressão genética que estimula processos metabólicos
relacionados com a resposta ao jejum no fígado incluindo a gluconeogenese. Observou-se que
a sua expressão aumenta na fase tardia do jejum no fígado de ratos previamente sujeitos a
uma dieta sem leucina, condições que induziram a transcrição do gene Foxa2. Este estudo
demonstrou que o mecanismo que regula a indução da expressão de Pgc-1α nestas condições
não é mediada pelo recrutamento de CREB por Foxa2 para os promotores Pgc-1α e Pepck,
uma vez que ambas as actividades promotoras não foram induzidas pela transfecção
simultânea de FOXA2 com CREB em células HepG2.
Palavras Chave: CIDEC/Fsp27; Jejum; FAO; CREB; SIRT1; Deprivação de aminoácidos;
PGC-1α; FOXA2.

xii
xiii
Table of Contents
1. INTRODUCTION 1
1.1. Fasting 1
1.2. Molecular mechanisms regulating adaptation to fasting 3
1.2.1. CREB/CRTC2 Signaling Pathway 3
1.2.2. SIRT1 5
1.2.3. PGC-1α 6
1.2.4. FOXA2 9
1.3. Fatty Acid Signal Transduction Pathway 11
1.3.1. Fatty Acid Oxidation 11
1.3.2. Ketogenesis 13
1.3.3. PPARs 15
1.3.4. Fsp27/CIDEC 18
1.4. Amino acid deprivation 21
2. THESIS GOAL 23
3. MATHERIALS AND METHODS 25
3.1. Plasmid DNA preparation 25
3.2. Plasmid construct and site directed mutagenesis 26
3.2.1. Mouse PGC1-α promoter 26
3.2.2. Mouse Fsp27 promoter 26
3.2.3. Automatic sequenciation of DNA 27
3.2.4. DNA oligonucleotide (primers) 27
3.3. Cell culture 27
3.4. Reagents 28
3.4.1. Reagents used in cell culture maintenance 28
3.4.2. Reagents used in cell culture specific treatments 28
3.4.3. Reagents used in cell culture transfection 28
3.5. Transient transfection and gene reporter assays 28
3.6. siRNA Transfection 29
3.7. KCREB Transfection – Fluorescence assay 29
3.8. Isolation and analysis of RNA 29
3.8.1. Isolation of total RNA 29
3.8.2. RT-PCR 30
3.8.3. Real time PCR 30
3.9. Statistical analysis 30
3.10. Information technologic tools 31
xiv
3.11. Additional Information 31
4. RESULTS 33
4.1. Down regulation of FAO increases CIDEC expression. 33
4.2. The induction of CIDEC expression is not mediated by PPARα during fasting. 34
4.3. Fsp27 is activated by CREB and its induction by fasting is repressed by SIRT1. 35
5. DISCUTION 43
6. CONCLUSIONS 47
7. REFERENCES 49
8. ANNEX 55
8.1. Vectors 55
8.1.2. Cloning vectors 55
8.1.3. Promoter vectors 55
8.1.4. Expression vectors 56
8.2. Primer Design (5’ - 3’) 57
8.2.2. Site Directed Mutagenesis 57
xv
Table of Figures
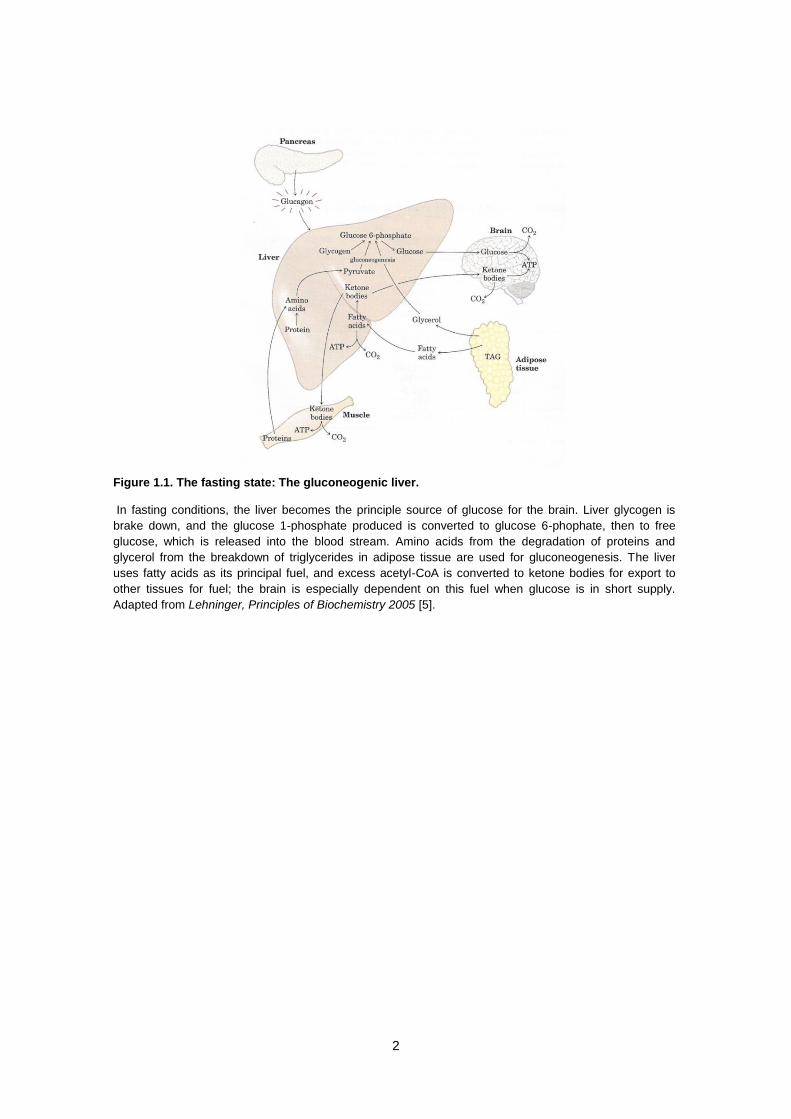
Figure 1.1. The fasting state: The gluconeogenic liver. In fasting conditions, the liver
becomes the principle source of glucose for the brain. Liver glycogen is brake down, and the
glucose 1-phosphate produced is converted to glucose 6-phophate, then to free glucose, which
is released into the blood stream. Amino acids from the degradation of proteins and glycerol
from the breakdown of triglycerides in adipose tissue are used for gluconeogenesis. The liver
uses fatty acids as its principal fuel, and excess acetyl-CoA is converted to ketone bodies for
export to other tissues for fuel; the brain is especially dependent on this fuel when glucose is in
short supply. Adapted from Lehninger, Principles of Biochemistry 2005 [5]. ................................ 2
Figure 1.2. Schematic diagram of the inducible switch that modulates gluconeogenesis
through the CREB/CRTC2 signaling pathway. Fasting corresponds to a metabolic state
where insulin levels are low and glucagon levels are high and it can be dissected in two distinct
phases, the early phase (<12-18h) and late phase (>12-18h). CRTC2 – CREB regulated
transcription coactivator 2; CREB - cAMP responsive element binding protein, FOXO1 -
Forkhead box protein O1 , PGC-1α - Peroxissome proliferator-activated receptor gamma
coactivator- 1α, SIRT1 – Sirtuin 1. ................................................................................................ 4
Figure1.3. Transcriptional regulation of hepatic gluconeogenesis by PGC-1 alpha. Hepatic
glucose production in the liver is tightly controlled by hormones. Glucagon and catecholamines
stimulate the cAMP pathway and CREB, which activates PGC-1α gene expression. PGC-1α is
then recruited to different transcription factors that bind to the promoter of gluconeogenic genes
such as PEPCK. Glucocorticoids induce a specific interaction between PGC-1α and GR-
activating PEPCK. Insulin represses cAMP activation on gluconeogenic genes, but how it
blocks PGC-1α gene expression is unknown. Adapted from Puigserver et al., 2003 [34]. .......... 8
Figure 1.4. Fatty acid entry into mitochondria via acyl carnitine/carnitine transporter. After
fatty acyl-carnitine is formed at the outer membrane in the intermembrane space, it moves into
the matrix by facilitated diffusion through the transporter in the inner membrane. In the matrix,
the acyl group is transferred to mitochondrial coenzyme A, freeing carnitine to return to the
inter-membrane space through the same transporter. Acyl transferase I is inhibited by malonyl
CoA. This inhibition prevents the simultaneous synthesis and degradation of fatty acids.
Adapted from Lehninger, Principles of Biochemistry 2005 [1]. ................................................... 12
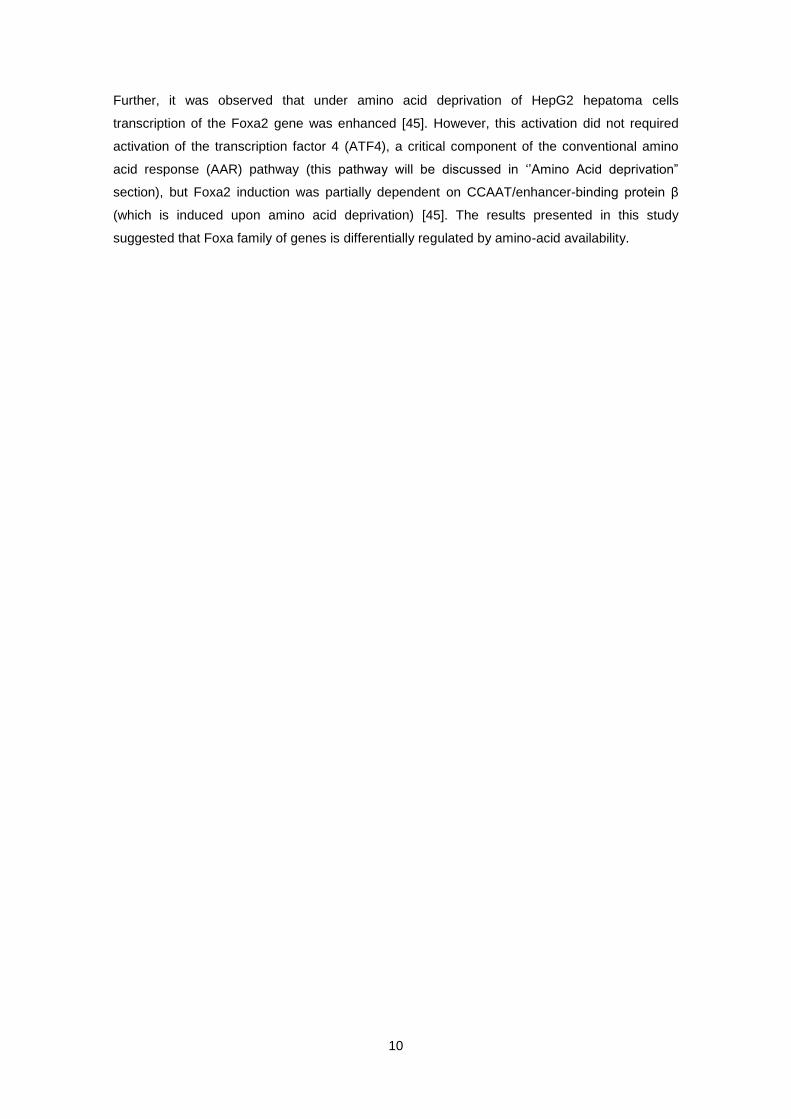
Figure 1.5. Formation of ketone bodies from acetyl-CoA. Adapted from Lehninger,
Principles of Biochemistry [6]. ..................................................................................................... 14
Figure 1.6. The insulin sensitization action of PPAR gamma. Adapted from Lehrke et al.,
2005 [33]. ..................................................................................................................................... 17
Figure 1.7. Hepatic Fsp27 expression is induced by early fasting. Mice fed Ad Libitum (AL)
or subjected to 6h, 15h, or 24h fasting. (A) Fsp27, (B) Hmgcs2 and other fatty acid oxidation
genes (Cpt1a, Cact and Cpt2) mRNA levels in liver. Results are means ± SEM for each group
(n=5) ** P <0.01, *** P<0.001 relative to AL; # P<0.05, ## P <0.01 relative to 6h fast; ᵹᵹ P<0.01
relative to 15h fasting. ................................................................................................................. 20
Figure 4.1. CIDEC is induced by etomoxir. (A) CIDEC (left panel) and PEPCK (right panel)
mRNA levels in HepG2 cells, serum-starved for 16 h and treated with 10 µM of etomoxir for an
additional 6 h. (B) Effect of synthetic PPAR antagonist (GW9662) in CIDEC expression. CIDEC
(left panel) and PEPCK (right panel) mRNA levels in HepG2 cells, serum-starved for 16 h and
treated with 10 µM of etomoxir and with or without 10 µM of GW9662 (6 hours). Results are

xvi
means ± SEM of three independent measurements. ***, P<0.001, relative to control (HepG2
cells treated with vehicle - DMSO); ##, P<0.01 relative to the etomoxir treatment..................... 33
Figure 4.2. Effect of specific PPARα agonist (Wy14643) in CIDEC expression. CIDEC (left
panel) and HMGCS2 (right panel) mRNA levels in HepG2 cells treated with 10 µM of Wy14643
(Sigma) for 24 hours. Results are means of two independent experiments. **, P<0.01 relative to
control (HepG2 cells treated with vehicle - DMSO). .................................................................... 35
Figure 4.3. CIDEC is induced by Forskolin and repressed by PKA inhibitor H89. (A) CIDEC
(left panel) and PEPCK (right panel) mRNA levels in HepG2 cells treated with 10 µM of forskolin
in OPTI-MEM (Invitrogen) for 6 h (mean of three independent experiments). (B) The effect of
treatment with forskolin 10 µM for 6h and/or pretreatment with H89 (50 µM) for 1 hour in CIDEC
(left panel) and PEPCK (right panel) mRNA levels in HepG2 cells. Cells were in OPTI-MEM
(Invitrogen), or vehicle (DMSO). Data represent the means ± SEM of three independent
experiments. **, P<0.01; ***, P<0.001, relative to the control; ##, P<0.01, ###, P<0.001 relative
to forskolin activation of CIDEC and PEPCK mRNA levels. ....................................................... 36
Figure 4.4. CIDEC is induced by Forskolin and repressed by a negative dominant of
CREB – KCREB. (A) HepG2 appearance (left panel) and transfection assessment in HepG2
cells by green fluorescence protein (GFP) (right panel). (B) CIDEC (left panel) and PEPCK (right
panel) mRNA levels in HepG2 cells transfected with GFP (green fluorescent protein), or GFP
plus KCREB (500 ng) expression vector and treated with 10 µM of Forskolin (in OPTI-MEM -
Invitrogen) for 6h. Data represent the means ± SEM of three independent experiments. ***,
P<0.001, relative to the control; #, P<0.05, relative to forskolin activation of CIDEC and PEPCK
mRNA levels. ............................................................................................................................... 37
Figure 4.5. Fsp27 mouse promoter activity is induced by CREB transcription factor. (A)
5’-flanking region of the mouse Fsp27 gene with the nucleotide sequences of the putative
CREB sites - CRE1 and CRE2. (B) The subsequent constructs have the correspondent mutated
elements inside the boxes bellow the wild type construct. The original sequence is shown as a
line. (C) HepG2 cells transfected for 48 h with Fsp27 promoter constructs cloned in pGL3basic
and co-transfected with either pcDNA3 or pcDNA3-CREB (150 ng) expression vectors. Results
are represented by fold activation to the WT promoter construct. pGL3basic activation was
subtracted from each condition. Data represent the means ± SEM of four independent
experiments performed in duplicate. *, P<0.05; **, P<0.01; relative to wt construct; #, P<0.05,
##; P<0.01 relative to CREB activation of WT promoter. ............................................................ 39
Figure 4.6. CIDEC is induced by SIRT1 depletion.CIDEC mRNA levels in HepG2 cells treated
with siRNA control or siRNA of SIRT1. Data represent the means ± SEM of three independent
experiments. *, P<0.05 relative to the siRNA control. ................................................................. 40
Figure 4.7. Pgc-1α and Foxa2 are induced upon leucin deprived diet in fasting conditions.
(A) Pgc-1α mRNA levels and (B) Foxa2 mRNA levels in liver of mice fed Ad Libitum (Ad Libitum
Control), fed with a leucin deprived diet (Ad Libitum (-) leu, fasted (Fast control) or fasted and
previously subjected to a leucin deprived diet (Fast (-) leu). Results represent the means ± SEM
of six independent experiments. *, P<0.05; **, P<0.01; relative to the Ad Libitum control group; #
P<0.05 relative to the fast control group. .................................................................................... 41
Figure 4.8. Pgc-1α and Pepck promoter activities are induced by CREB but not by FOXA2
transcription factors.Transient assay of HepG2 cells transfected for 48 h with pGL3b (control)
or the Pgc-1α and Pepck promoters and co-transfected with either pcDNA3 and/or pcDNA3-
CREB, pcDNA3 and/or pcDNA3-FOXA2 or pcDNA3-CREB plus pcDNA3-FOXA2 expression
vectors, represented by fold activation to pGL3b. pGL3b activation was subtracted from each
xvii
condition. Data represent the means ± SEM of three independent experiments performed in
duplicate. **, P<0.01 relative to pcDNA3..................................................................................... 42
Figure 5.1. Temporal regulation of Fsp27/CIDEC expression in response to fasting
adaptation and FAO rate. At the onset of fasting glucagon circulating levels are increased and
insulin levels decreased. This hormonal change produces an increase in both the levels and
activity of the transcriptional coactivator CRTC2, which by activating CREB increases the
expression of hepatic Fsp27/CIDEC. With sustained fasting (>12-18h) SIRT1 becomes
activated and deacetylates CRTC2. This event allows the ubiquitination of the protein targeting
it for degradation. Furthermore, these conditions promote the switching to the utilization of free
fatty acids and thereby FAO rate increases. This increment results in the increase of
NAD+/NADH ratio which will further activate SIRT1 (a NAD
+ consuming enzyme activity). The
activation of SIRT1 results in an impairment of CIDEC expression. SIRT1 activation also
outcomes the deacetylation of FOXO1 and its coactivator PGC-1α which is associated with an
increase in their activities, providing a further mechanism for gluconeogenesis maintenance in
response to prolonged fasting. .................................................................................................... 45

xviii

xix
Table of Tables
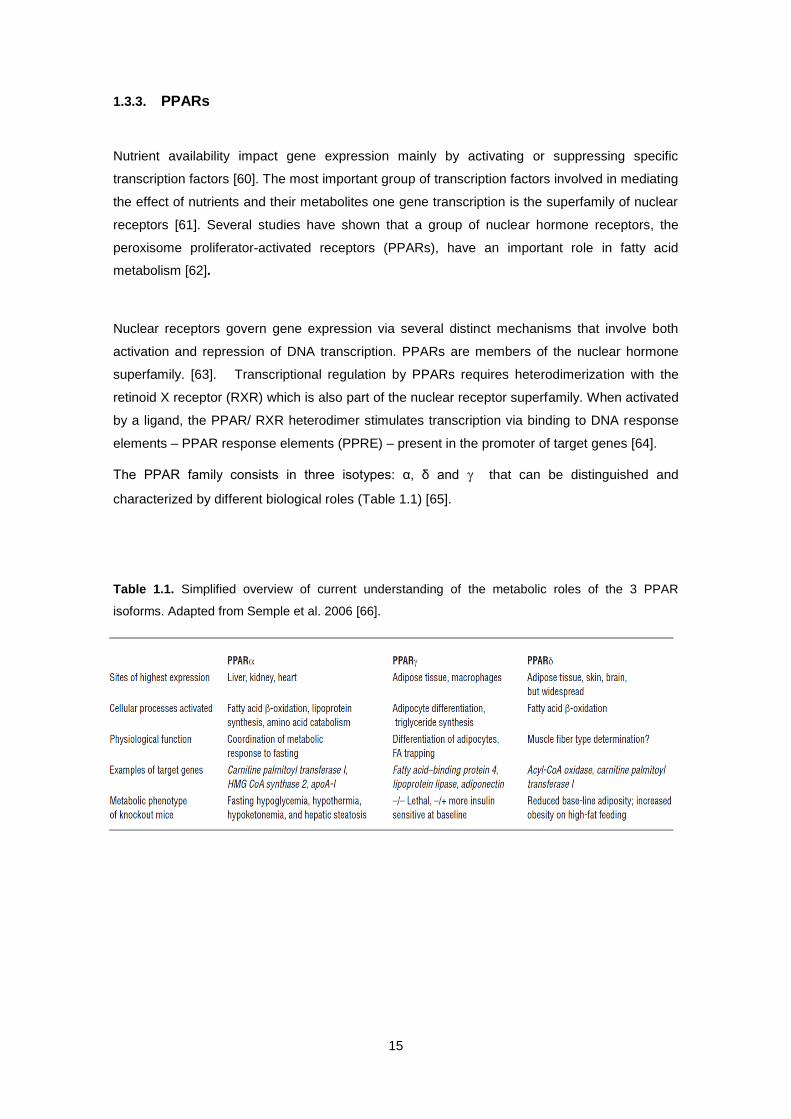
Table 1.1. Simplified overview of current understanding of the metabolic roles
of the 3 PPAR isoforms.
15
Table 1.2. Genes that are up regulated by HMGCS2 knock down. List of
differentially expressed genes (up regulated >1.6 fold) in a microarray Affymetrix®
(GeneChip Mouse Gene 1.0ST) performed with RNA of liver of shRNA control or
shRNA Hmgcs2 treated mice (n=3). (Unpublished data from Haro D. and Marrero P.,
School of Pharmacy, University of Barcelona)
19

xx

xxi
List of Abbreviations
AAR
Amino acid response
ADP
Adenosine diphosphate
ATP ATF4
Adenosine triphosphate Activating transcription factor 4
BAT
Brown adipose tissue
CACT
Carnitine Acylcarnitine Translocase
cAMP Cyclic Adenosine monophophate
CARE CCAAT-enhancer binding protein-activating transcription factor C/EBP-ATF response elements
CBP
CREB binding protein
C/EBP
CCAAT/enhancer binding protein
ChIP
Chromatin Immunoprecipitation
CIDEC
Cell death inducing DFF45-like effector C
CPT-I
Carnitine palmitoytranferase I
CPT-II
Carnitine palmitoyltransferase II
CRTC2
CREB-regulated transcriptional co-activator 2
CREB CMV CoA
cAMP responsive element binding protein Cytomegalovirus Coenzyme A
DMSO
Dimetylsulfoxid
DNA E.Coli eIF2
Deoxyribonucleic Acid Escherichia Coli Eukaryotic Initiation factor 2
ERR EDTA
Estrogen related receptor Ethylenediamine tetraacetic acid
FFA
Free fatty acids
FADH2
Flavine adenine dinucleotide
FOXA
Forkhead box protein A
FOXO1
Forkhead box protein O1
xxii
FSP27
Fat specific protein 27
GCN2
General Control Nonderepressible protein 2 kinase
G6P
Glucose-6-phosphate
GFP Green fluorescent protein
GR
Glucocorticoid receptors
HAT
Acetyl transferases
HMG-CoA 3-hydroxy-3-methylglutaryl CoA
HMGCS2
3-hydroxy-3-methylglutaryl-CoA (HMG-CoA) synthase 2
HNF3
Hepatic nuclear factor 3
HNF4α IPTG
Hepatic nuclear factor-4α Isopropyl β-D-1-thiogalactopyranoside
KCREB LB
Expression vector (pcDNA3-KCREB) containing a dominant negative CREB construct Lysogeny Broth (growth media for bacteria)
LCAS
Long-chain acyl-CoA synthetase
LD
Lipid Droplet
(-) leu Luc
Leucin deficient Luciferase gene, from Photinus pyralys
MEM Minimum Essential Medium
mut µ
Mutated Micro (10
-6)
NAD
Nicotinamide adenine dinucleotide, oxidizing agent
NADH ng
Nicotinamide adenine dinucleotide, reducing agent Nanogram(s)
PBS Phosphate buffered-saline
PCR Polymerase Chain Reaction
PEPCK
Phosphoenolpyruvate carboxykinase
PGC-1α
Peroxissome proliferator-activated receptor gamma coactivator- 1α
PKA
Protein kinase A
PPARs PPRE
Peroxissome proliferator-activated receptors PPAR response element
xxiii
PPARα
Peroxisome proliferator-activated receptor alpha
PPAR
Peroxisome proliferator-activated receptor gamma
RNA Ribonucleic Acid
SIRT1
Sirtuin 1
SRC-1
CBP/p300 and steroid receptor coactivator
Tat
Tyrosine aminotransferase
TG TORC2
Triglycerides Transducer of regulated CREB protein 2
TZD
Thiazolidinedione
WAT
White adipose tissue
WT Wild type
VLDL
Very low density lipoprotein

xxiv

1
1. INTRODUCTION
1.1. Fasting
Mammals have evolved a metabolic response system that allows them to survive during long
periods of energy deprivation. The overall metabolic response to fasting operates at numerous
levels. One prominent feature is the gradual shift in whole-body fuel utilization from
carbohydrates and fat in the fed state to almost exclusively fat after a day of fasting [1]. This
adaptation is particularly striking in the brain, an obligate glucose utilizer in the fed state, which
is able to acquire energy predominantly from ketone bodies after prolonged fasting [2,3]. The
main metabolic fuels of the human body are glucose, fatty acids and ketone bodies. Its principal
energy stores are liver glycogen, adipose tissue triglyceride and muscle protein. Most of the
actual inter-conversions in energy substrates occur in liver, which plays a central role in the
adaptive response to fasting [4].
Prolonged fasting is characterized by low insulin concentrations, high glucagon, glucocorticoids
and epinephrine concentrations in plasma (Figure 1.1). In feeding/fasting conditions, these
counter regulatory hormones will maintain blood glucose levels [5].
In this state liver degrades glycogen into glucose. In addition, it receives glucogenic amino acids
such as alanine and lactate (from muscle) and glycerol (from adipose tissue) which are
precursors for gluconeogenesis or de novo synthesis of glucose [4]. Gluconeogenesis it is a
highly polarized metabolic pathway involving biochemical reactions in different compartments
such as the cytoplasm, mitochondria, endoplasmic reticulum and plasma membrane. The rate
of gluconeogenesis is controlled by three key enzymes: phosphoenol-pyruvate carboxykinase
(PEPCK), fructose 1,6-bisphosphatase and glucose-6-phosphatase (G6P). Hormonal control of
these enzymes is achieved at the transcriptional level. The main positive signals to turn on
gluconeogenesis are activated during fasting, stress and diabetes. As already referred, among
these signals is glucagon that produces an increase in intracellular cAMP and glucocorticoids,
endogenous ligands for the glucocorticoid receptor [5].
The fasting liver also receives non-esterified fatty acids (mainly long chain fatty acids), released
from adipose tissue triglycerides [5]. The hormonal profile of the fasted state promotes the
hydrolysis of triacylglycerol in adipose tissue, thereby increasing the concentration of free fatty
acids (FFA) in plasma. The fatty acids are taken up by the liver, where they are either re-
esterified to triacylglycerol and secreted as very-light-density lipoproteins (VLDL) or oxidized in
the mitochondria via β-oxidation. The majority of fatty acids are only partially oxidized to acetyl-
coenzyme A (acetyl-CoA), which then condenses with itself to form ketone bodies, an important
fuel to the brain [6].
2
Figure 1.1. The fasting state: The gluconeogenic liver.
In fasting conditions, the liver becomes the principle source of glucose for the brain. Liver glycogen is
brake down, and the glucose 1-phosphate produced is converted to glucose 6-phophate, then to free
glucose, which is released into the blood stream. Amino acids from the degradation of proteins and
glycerol from the breakdown of triglycerides in adipose tissue are used for gluconeogenesis. The liver
uses fatty acids as its principal fuel, and excess acetyl-CoA is converted to ketone bodies for export to
other tissues for fuel; the brain is especially dependent on this fuel when glucose is in short supply.
Adapted from Lehninger, Principles of Biochemistry 2005 [5].
3
1.2. Molecular mechanisms regulating adaptation to fasting
1.2.1. CREB/CRTC2 Signaling Pathway
Circulating glucose levels reflect a balance between glucose production by the liver and glucose
utilization by skeletal muscle. The liver, a key target of both insulin and glucagon signaling,
contributes to the control of glucose metabolism by facilitating glucose uptake and output
depending on the physiological condition [7]. Under fasting conditions, mammals initiate a whole
body metabolic response that limits glucose and favors fatty acid oxidation. In these conditions
the liver is central in the metabolic response to glucagon, epinephrine and glucocorticoids,
which act to stimulate hepatic glucose via glycolysis and gluconeogenesis in order to prevent
extend periods of hypoglycemia [8].
The gluconeogenic program is largely regulated at the transcriptional level, by the cyclic AMP
(cAMP) responsive element binding protein (CREB) and its ability to activate PGC-1α (PPAR
gamma coactivator- 1α) [9]. This response is dependent on the phosphorylation of CREB at
Ser133 mediated by protein kinase A (PKA) and the subsequent recruitment of the coactivators
CREB binding protein (CBP)/p300 to promoters of gluconeogenic genes (such as PEPCK and
G6P) [9]. The simplicity of this model, has been challenged with the discovery of the CREB-
regulated transcription coactivator 2 (CRTC2) [10] which has been implicated as the foremost
mediator driving CREB target expression [11].
In fact, CRTC2 was described as a critical component of the early transcriptional fasting
response in the liver by acting up-stream of PGC-1α in the gluconeogenic pathway [12, 13].
In the early state of fasting, circulating glucose and insulin levels are low, glucagon and/or
epinephrine signaling results in the dephosphorylation of CRTC2 and its translocation to the
nucleus where it drives the transcription of several genes implicated in gluconeogenesis by
specifically interacting with CREB and facilitating recruitment of the coactivators CBP and p300
to CREB target sequences. Following long-term stimulation, it has been proposed that CRTC2
is deacetylated by SIRT1 and targeted for degradation in proteasome (Figure 1.2) [13]. Sirtuin 1
(SIRT1) is a type III NAD+
dependent deacetylase (its role will be further explored in the next
section).
CRTC2 activity is also controlled by insulin signaling which results in CRTC2 phosphorylation
and exclusion from the nucleus where it can no longer impact gene expression [14].
Interestingly, whereas the increase in SIRT1 activity that accompanies prolonged fasting
attenuates CRTC2 signal, it actually improves PGC-1α’s ability to increase hepatic
gluconeogenesis [15]. In fact, maintenance of the gluconeogenic response through prolonged
fasting will be mediated by PGC-1α and Forkhead box O1 (FOXO1) (Figure 1.2) [13].

4
Figure 1.2. Schematic diagram of the inducible switch that modulates gluconeogenesis through the CREB/CRTC2 signaling pathway.
Fasting corresponds to a metabolic state where insulin levels are low and glucagon levels are high and it can be dissected in two distinct phases, the early phase (<12-18h) and late phase (>12-18h). CRTC2 – CREB regulated transcription coactivator 2; CREB - cAMP responsive element binding protein, FOXO1 - Forkhead box protein O1 , PGC-1α - Peroxissome proliferator-activated receptor gamma coactivator- 1α, SIRT1 – Sirtuin 1.

5
1.2.2. SIRT1
Caloric restriction causes many changes in glucose metabolism [16]. Recently, it was
suggested a model in which protein acetylation regulates metabolic strategy and also helps
store energy in cells [17]. In the cell, acetylation is carried out by histones acetyl transferases
(HATs) and deacetylation by class I, II and III deacetylases. The type III, NAD+
dependent
deacetylase is termed sirtuins [17]. Among sirtuins, SIRT1 – which modulates ageing in several
species [18, 19] – appears to be involved in a great number of physiological pathways, including
gluconeogenic/glycolytic pathways in liver in response to fasting signals through the
transcriptional coactivator PGC-1α [20]. Also, SIRT1 is known to target MyoD, p53 and forkhead
transcription factors for deacetylation [21, 22].
SIRT1 seems to be involved in pathways affected directly by caloric restriction in mammals [23].
Several studies showed that SIRT1 activity is low in growth conditions of glucose excess and
high during energy limitation [15, 16]. This behavior is due to SIRT1 being a NAD-dependent
deacetylase. In energy abundance conditions, there is ATP generation trough glycolysis and
conversion of NAD to NADH in mitochondria and therefore SIRT1 activity is expected to
decrease. This behavior suggests a feed forward mechanism, in which diet drives glycolysis,
convert NAD to NADH, inactivate sirtuins, and increase acetylation and activity of glycolytic
enzymes [17]. Conversely, under fasting or low nutrient conditions, limit glycolysis, activate
SIRT1 triggering protein deacetylation in mitochondria. These conditions, fit with one of the
main outputs of SIRT1 activity, the deacetylation of PGC-1α to promote mitochondrial
biogenesis and oxidative metabolism [15] (Figure 1.2).
This evidence, suggest protein acetylation as a regulatory mechanism, as well as energy-
storage mechanism when energy is in excess. The regulatory aspects include histone
acetylation to regulate gene transcription, acetylation of metabolic enzymes to favor glycolysis
for ATP production, and acetylation of several transcription factors such as p53, FOXO1, PGC-
1α, nuclear receptors to adjust expression levels of pathways for oxidative versus glycolytic
metabolism [24]. Regarding the transcription factors, SIRT1 has mainly been linked to negative
regulation of gene expression through protein deacetylation (e.g. p53) [25, 26]; however it can
act both positively and negatively to control gene expression as PGC-1α [15] in response to
NAD+ fluctuations in accordance to nutrient availability [13, 15, 16, 23].
The storage aspect of acetylation may be important in transitioning from energy access to
energy limitation. Under these conditions, the acetate generated by SIRT1 deacetylation of
many proteins would be a substract for acetyl-CoA synthethase. Along with the oxidation of fatty
acids, would drive the citric acid cycle and oxidative phosphorylation to yield ATP and CO2 [17].
6
1.2.3. PGC-1α
One of the components of the signal transduction pathway involved in metabolic reprogramming
is the peroxissome proliferator-activated receptor gamma coactivator-1α – PGC-1α. This
transcriptional co-activator is able to coordinate the expression of a wide array of genes
involved in glucose and fatty acid metabolism [3].
Molecular mechanisms of PGC-1α function
PGC-1α was first identified as a binding partner and co-activator of the transcriptional activity of
PPAR [27]. It is known to bind and consequently modulate the activity of a wide range of
transcription factors such as PPARα, glucocorticoid receptor, hepatic nuclear factor-4α
(HNF4α), members of the estrogen related receptor (ERR) family, Foxo1, among others [28,
29].
Once it is activated, PGC-1α is recruited to the chromatin through interaction with transcription
factors [30]. After docking to a transcription factor, PGC-1α undergoes a conformational change
that allows interaction with histone acetyl transferases (HAT) such as CBP/p300 and steroid
receptor coactivator (SRC-1). This set of proteins interacts at the PGC-1α N-terminal region that
contains a potent transcriptional activation domain. Although they enhance the activity of PGC-
1α, SRC-1 and CBP/300 do not acetylate PGC-1α. In fact, acetylation of PGC-1α, is correlated
to a decrease in its activity [15].
This data reveal that the regulation of gene expression by PGC-1α is achieved by a sequential
and dynamic recruitment of different set of proteins making a functional multiprotein complex
that transcribes specific genes.
From a physiological standpoint, the co-activation of these transcription factors by PGC-1α has
important metabolic repercussions. Specifically, this set of transcription factors to which PGC-1α
binds, controls the expression of genes involved in adaptive thermogenesis, gluconeogenesis,
glycolysis, lipogenesis, mitochondrial fatty acid oxidation, and mitochondrial respiration
efficiency [3]. Thus, PGC-1α can single coordinate gene expression of multiple energy
pathways. This point is based in studies where PGC-1α knockout mouse, shows a reduced
respiratory capacity, reduces rates of hepatic gluconeogenesis and β-oxidation, hepatic
steatosis under fasting conditions and hypoglycemia [31, 32].

7
PGC-1α in the adaptation to food deprivation
In terms of its contribution to the diet-dependent maintenance of energy homeostasis in
mammals, there is a body of evidence to suggest that the co-transcriptional activity of PGC-1α
is important to the compensatory metabolic responses that occur during food deprivation [3, 33].
During fasting, gluconeogenesis is profoundly up regulated primarily at the level of transcription.
As already described (in CREB/CRTC2 signaling pathway section) a compelling argument can
be made for dissecting the up regulation of gluconeogenesis into two temporally distinct phases
[13]. Regarding the adaptation to the maintenance of the gluconeogenic response through
prolonged fasting is thought to be mediated by PGC-1α and its transcription factors [3]. Indeed,
in the late state of fasting, the elevated levels of PGC-1α facilitate increased hepatic glucose
output by promoting the expression of gluconeogenic genes [29]. This regulation is mediated by
the hormones that signal fasting such as glucagon and insulin [34] but also by SIRT1 mediated
deacetylation [15].
As discussed above, during fasting glucagon activate via cAMP, the CREB transcription factor,
an important regulator of PGC-1α gene expression [9]. In addition, glucocorticoids strongly
synergize with cAMP to induce PGC-1α levels. Under this state, of lower nutrient availability,
intracellular NAD+ levels increase which leads to the deacetylation of PGC-1α by SIRT1 [35].
The change in PGC-1α acetylation coincides with an increased activation of PGC-1α which
binds and co-activates different transcription factors such as HNF4α and FOXO1 and
glucocorticoid receptors (GR) to coordinate expression of gluconeogenic genes [33, 36]. Insulin,
a dominant-negative signal suppresses PGC-1α expression in liver (Figure 1.3) [34].
FOXO1 acts as a cellular sensor of insulin signaling via Akt. Akt phosphorylates FOXO1 and
induces cytoplasmic localization and degradation. PGC-1α requires FOXO1 to bind and localize
to the promoter chromatin region of gluconeogenic genes [33]. This mechanism, corresponds
with the re-feeding state were PGC-1α activity decreases.

8
Figure 1.3. Transcriptional regulation of hepatic gluconeogenesis by PGC-1 alpha.
Hepatic glucose production in the liver is tightly controlled by hormones. Glucagon and catecholamines
stimulate the cAMP pathway and CREB, which activates PGC-1α gene expression. PGC-1α is then
recruited to different transcription factors that bind to the promoter of gluconeogenic genes such as
PEPCK. Glucocorticoids induce a specific interaction between PGC-1α and GR-activating PEPCK. Insulin
represses cAMP activation on gluconeogenic genes, but how it blocks PGC-1α gene expression is
unknown. Adapted from Puigserver et al., 2003 [34].
9
1.2.4. FOXA2
A complex network functions to maintain whole body homeostasis of metabolites such as
glucose and amino acids. One group of such genes is FOXA (forkhead box A) family, also
known as hepatic nuclear factor 3 (HNF3) [32]. The mammalian FOXA family consists of three
members, FOXA 1, FOXA2 and FOXA3, which contribute to embryonic development [37] and to
hormonal control of gene expression [38]. FOXA proteins bind to similar recognition sequences
and the proteins are proposed to have redundant function in regulating some of their target
genes [39]. The Foxa genes appear to be involved in the protection of the organism from
hypoglycemia [40, 41]. However, each FOXA protein has distinct functions.
Foxa2 is involved in the mechanisms regulating fasting and amino acid deprivation.
In the liver, some Foxa target genes identified are involved in glucose homeostasis, particularly
in the response to fasting [42]. Examples include the gluconeogenic enzymes
phosphoenolpyruvate carboxykinase (Pepck), glucose-6-phosphatase (G6p) and tyrosine
aminotransferase (Tat) [39].
The role of Foxa2 in hepatic glucose homeostasis was evaluated by Zhang et al [42], by genetic
approach using a mouse model in which Foxa2 was deleted specifically from hepatocytes.
Although these mice were normoglycemic, they fail to fully activate Pepck and Tat in response
to fasting. Furthermore, this group suggested that Foxa2 mediates activation of guconeogenic
genes by enabling recruitment of CREB and glucocorticoid receptors to their target sites in
chromatin [42]. The results of this study suggest that Foxa2 is required for execution of hepatic
gluconeogenic program, by integrating the transcriptional response of the hepatocyte to
hormonal regulation during fasting.
Recent work from Wolfrum and colleagues [43, 44] has introduced a new concept regarding
Foxa2 in nutrient metabolism. They have shown that in cultured cells the transcriptional activity
of Foxa2 is blocked by treatment with insulin, and that this regulation requires an intact
phosphorylation site for the insulin-activated kinase of mouse Foxa2. This phosphorylation is
reported to result in nuclear exclusion of Foxa2, thereby providing an appealing molecular
model in which Foxa2’s gluconeogenic activity is blocked via feeding-induced insulin secretion
[43, 44].
The authors proposed a model in which Foxa2 is nuclear only in the starved state, during which
it activates multiple genes driving increased hepatic glucose utilization, fatty acid oxidation, and
ketogenesis.
10
Further, it was observed that under amino acid deprivation of HepG2 hepatoma cells
transcription of the Foxa2 gene was enhanced [45]. However, this activation did not required
activation of the transcription factor 4 (ATF4), a critical component of the conventional amino
acid response (AAR) pathway (this pathway will be discussed in ‘’Amino Acid deprivation”
section), but Foxa2 induction was partially dependent on CCAAT/enhancer-binding protein β
(which is induced upon amino acid deprivation) [45]. The results presented in this study
suggested that Foxa family of genes is differentially regulated by amino-acid availability.

11
1.3. Fatty Acid Signal Transduction Pathway
1.3.1. Fatty Acid Oxidation
In the transition from the fed to the fasted state the liver switches from an organ of carbohydrate
utilization and fatty acid synthesis to one of fatty acid oxidation and ketone body production. The
fasted state is associated with mobilization of stored lipid in white adipose tissue and increase in
fatty acid flux through the mitochondrial β-oxidation [46].
β-oxidation is the major process by which fatty acids are oxidized, thus providing a major source
of energy for the heart and skeletal muscle [47, 48]. β-oxidation is stimulated during starvation
or endurance exercise [6] .
Fatty Acids are Activated and Transported into Mitochondria
The β-oxidation of activated fatty acids occurs within the mitochondrial matrix and is catalyzed
by the sequential action of four enzyme families (acyl CoA dehydrogenase, enoyl-CoA
hydratase, 3-hydroxyacyl-CoA dehydrogenase and 3-ketoacyl- CoA thiolase) each with different
substrate specificity for short-, medium, and long-chain acyl-CoAs. Long-chain fatty acids are
activated on the mitochondrial outer membrane by the long-chain acyl-CoA synthetase (LCAS)
but the mitochondrial inner membrane is not permeable to these acyl-CoAs. The carnitine
dependent transport of these activated fatty acids precedes their β-oxidative chain shortening
[49].
This transport system consists of three proteins: carnitine palmitoytranferase I (CPT-I), carnitine
acylcarnitine translocase (CACT) and carnitine palmitoyltransferase II (CPT-II), each with a
different submitochondrial localization. As a first step, acyl CoAs formed by the catalytic action
of LCAS in the mitochondrial outer membrane are converted to acylcarnitines. This
transterification is catalyzed by CPT-I also localized in the mitochondrial outer membrane. The
reaction products, long-chain acylcarnitines, are then translocated into the mitochondrial matrix
in an exchange reaction catalyzed by CACT, an integral inner membrane protein. Within the
matrix the acylcarnitines are then reconverted to the respective acyl-CoAs by CPT-II, an
enzyme associated with the mitochondrial inner membrane (Figure 1.4) [50].
The carnitine-mediated entry process is the rate limiting step for oxidation of fatty acids in
mitochondria and it is an important point of regulation [5].

12
Oxidation of Fatty Acids
Mitochondial β-oxidation of fatty acids takes place in three stages. In the first stage (β-oxidation)
the fatty acids undergo oxidative removal of successive two carbon units in the form of acetyl-
CoA [50].
In the second stage of fatty acid oxidation, the acetyl groups of acetyl CoA are oxidized to CO2
in the citric cycle, which take place in the mitochondrial matrix. The first two stages of fatty acid
oxidation produce the reduced electron carriers NADH and FADH2, which in the third stage
donate electrons to the mitochondrial respiratory chain, through which the electrons pass to
oxygen with the concomitant phosphorylation of ADP to ATP. The energy released by fatty acid
oxidation is conserved as ATP [6].
Figure 1.4. Fatty acid entry into mitochondria via acyl carnitine/carnitine transporter.
After fatty acyl-carnitine is formed at the outer membrane in the intermembrane space, it moves into the
matrix by facilitated diffusion through the transporter in the inner membrane. In the matrix, the acyl group
is transferred to mitochondrial coenzyme A, freeing carnitine to return to the inter-membrane space
through the same transporter. Acyl transferase I is inhibited by malonyl CoA. This inhibition prevents the
simultaneous synthesis and degradation of fatty acids. Adapted from Lehninger, Principles of
Biochemistry 2005 [5].

13
Hepatic regulation of mitochondrial β-oxidation
Much of the control and regulation of the rate of hepatic mitochondrial β-oxidation appears to
reside at the level of the entry of acyl groups into mitochondria.
Malonyl-CoA is the first intermediate in the cytosolic biosynthesis of long-chain fatty acids from
acetyl-CoA, increases in concentration whenever the body is well supplied with carbohydrate;
excess glucose that cannot be oxidized or stored as glycogen is converted in the cytosol into
fatty acids for storage as triacylglycerol. The inhibition of CPT-I by malonyl CoA ensures that the
oxidation of fatty acids is inhibited in the fed state [6, 50].
1.3.2. Ketogenesis
Ketogenesis becomes significant under conditions of food (carbohydrate) deprivation. Provision
of peripheral tissues, such as skeletal muscle and heart, with ketone bodies as an alternative
fuel for energy production, results in glucose sparing for organs depending on glucose as an
energy source [51, 52]. The ketone bodies play an important role in this adaptation: starvation
induces an increase in plasma ketone bodies concentration and turnover serving as an
important fuel for the central nervous system [53].
In fasting conditions the liver needs to maintain the Krebs cycle for ATP production and
gluconeogenesis for supplying glucose for extrahepatic tissues. Since these two processes
require the same intermediates, having oxaloacetate as rate-limiting enzyme, both begin to slow
down. As a result acetyl CoA accumulates in the mitochondria [54]. Through a serie of
condensation reactions (Figure 1.5), ketone bodies (acetoacetate, β-hydroxybutyrate and
acetone) are produced [53].
The sum of these reactions is β-hydroxybutyrate, formed by the reduction of acetoacetate in the
mitochondrial matrix with the generation of NAD+ (Figure 1.5) [55].
14
Although fatty acids are by far the major carbon donors, for ketone body synthesis, the
catabolism of some (ketogenic) amino acids also provides carbon atoms for ketogenesis, either
via acetyl-CoA or directly by yielding acetoacetate [52].
Control of ketogenesis is exerted by transcriptional regulation of mitochondrial 3-hydroxy-3-
methylglutaryl-CoA (HMG-CoA) synthase 2 (HMGCS2) [51, 52, 56]. The transcriptional rate of
this rate-limiting enzyme increases in response to cAMP, starvation, fat feeding and diabetes
while insulin and refeeding repress it [57, 58]. Regarding to its transcriptional control, results of
this group suggested that HMGCS2 expression is affected by the PPARα-mediated response
and it is also involved in the induction of β-oxidation [59].
Figure 1.5. Formation of ketone bodies from acetyl-CoA. Adapted from Lehninger, Principles of Biochemistry 2005 [6].
15
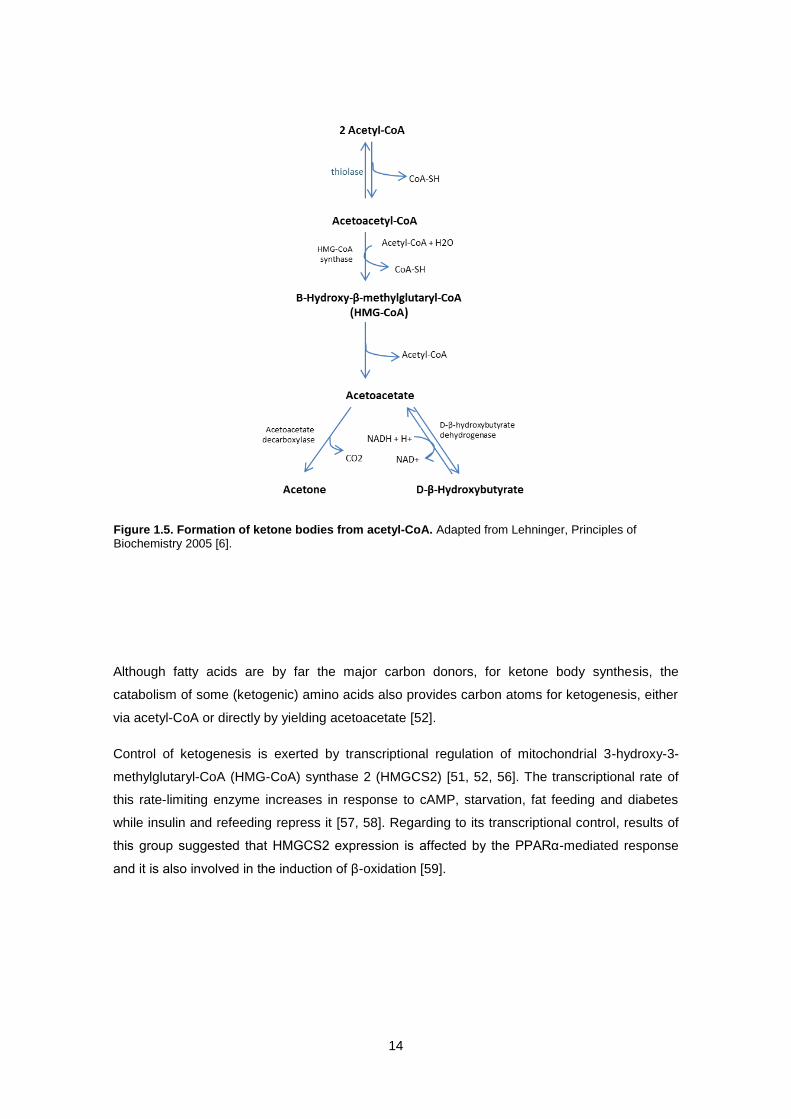
1.3.3. PPARs
Nutrient availability impact gene expression mainly by activating or suppressing specific
transcription factors [60]. The most important group of transcription factors involved in mediating
the effect of nutrients and their metabolites one gene transcription is the superfamily of nuclear
receptors [61]. Several studies have shown that a group of nuclear hormone receptors, the
peroxisome proliferator-activated receptors (PPARs), have an important role in fatty acid
metabolism [62].
Nuclear receptors govern gene expression via several distinct mechanisms that involve both
activation and repression of DNA transcription. PPARs are members of the nuclear hormone
superfamily. [63]. Transcriptional regulation by PPARs requires heterodimerization with the
retinoid X receptor (RXR) which is also part of the nuclear receptor superfamily. When activated
by a ligand, the PPAR/ RXR heterodimer stimulates transcription via binding to DNA response
elements – PPAR response elements (PPRE) – present in the promoter of target genes [64].
The PPAR family consists in three isotypes: α, δ and that can be distinguished and
characterized by different biological roles (Table 1.1) [65].
Table 1.1. Simplified overview of current understanding of the metabolic roles of the 3 PPAR
isoforms. Adapted from Semple et al. 2006 [66].
16
1.3.3.1. PPARα
PPARα plays a crucial role in the control of lipid metabolism in response to nutritional, hormonal
and environmental stimuli. It was described to be highly expressed in organs that carry out
significant catabolism of fatty acids such as the liver, brown adipose tissue, heart, intestine and
kidney [67, 68]. Therefore, identification of PPARα target genes has concentrated mainly on
cellular lipid metabolism in the context of the hepatocyte. Indeed, the first PPARα target gene
identified was acyl-coenzyme A oxidase [69] involved in fatty acid β-oxidation. Numerous genes
involved in hepatic fatty acid oxidation were shown to be induced by PPAR α. Results from this
group have been relevant for the identification and characterization of functional PPREs in key
regulatory genes such as HMGCS2 (rate-limiting enzyme of ketogenesis); CPT1 and CPT2
(involved in mitochondrial β-oxidation).
PPARα can be activated by at least 2 different mechanisms. First, during fasting, the expression
of PPARα in liver increases, an effect mediated by glucocorticoids that results in an increased
amount of PPARα protein. Second the fatty acids that are liberated from the adipose tissue and
travel to the liver may serve as ligands for PPARα. By means of such mechanism, the organism
assures that the enzymatic system of the liver responds appropriately to the increased demands
for fatty acid oxidation.
1.3.3.2. PPAR
PPAR is a master regulator for adipocyte differentiation [64, 70-72]. PPAR also regulates lipid
metabolism, insulin sensitivity, cardiovascular disease, inflammation, organ development and
tumor formation [73, 74]. PPAR has two isoforms, PPAR1 and PPAR2, which are created by
alternative splicing [75]. PPAR1 is expressed in several tissues including liver, whereas
PPAR2 is exclusively expressed in adipocytes, where it is key orchestrator of the cascade
underlying adipocyte differentiation along with the CCAAT enhancer binding protein (C/EBP)
[74]. The currently favored hypothesis is that C/EBP induces expression of PPAR, which
provides the initial trigger for the adipogenic program [74].
PPAR also plays a key role in the switch of adipose tissue lipid metabolism to nutritional state.
Its expression is highest postprandially [76] and its activation leads to the up-regulation of genes
that mediate fatty acid up-take [77, 78]. PPAR may also promote a futile cycling in adypocytes
between triglyceride esterification and de-esterification [79].
17
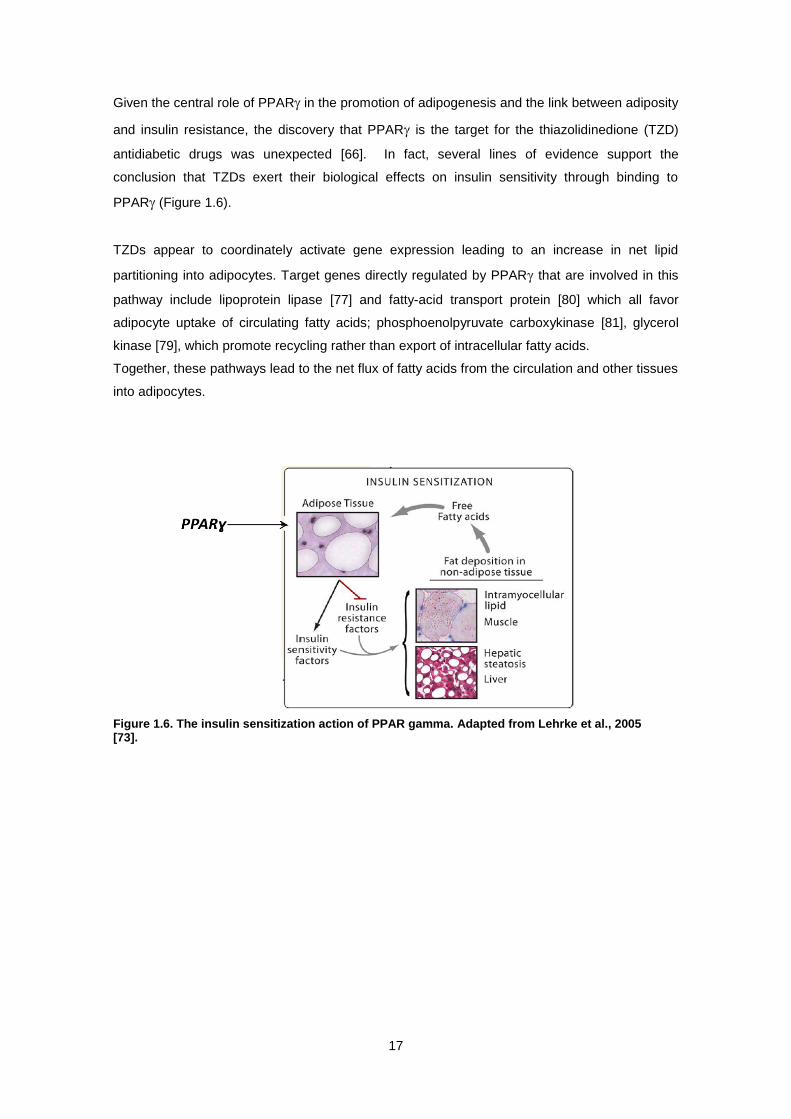
Given the central role of PPAR in the promotion of adipogenesis and the link between adiposity
and insulin resistance, the discovery that PPAR is the target for the thiazolidinedione (TZD)
antidiabetic drugs was unexpected [66]. In fact, several lines of evidence support the
conclusion that TZDs exert their biological effects on insulin sensitivity through binding to
PPAR (Figure 1.6).
TZDs appear to coordinately activate gene expression leading to an increase in net lipid
partitioning into adipocytes. Target genes directly regulated by PPAR that are involved in this
pathway include lipoprotein lipase [77] and fatty-acid transport protein [80] which all favor
adipocyte uptake of circulating fatty acids; phosphoenolpyruvate carboxykinase [81], glycerol
kinase [79], which promote recycling rather than export of intracellular fatty acids.
Together, these pathways lead to the net flux of fatty acids from the circulation and other tissues
into adipocytes.
Figure 1.6. The insulin sensitization action of PPAR gamma. Adapted from Lehrke et al., 2005 [73].
18
1.3.4. Fsp27/CIDEC
Fat specific protein 27 (FSP27) or cell death inducing DFF45-like effector C (CIDEC), the
human homologue of FSP27 belong to the CIDE family [82, 83]. FSP27/CIDEC was described
as an important regulator of energy homeostasis and its functions are closely linked to the
development of metabolic disorders including obesity, diabetes and liver steatosis [72, 84].
The CIDE family consists into three isoforms: CIDEA, CIDEB and FSP27/CIDEC. CIDEA is
highly expressed in brown adipose tissue and CIDEB in liver [82]. Regarding to the tissue
distribution of FSP27/CIDEC it was described that it was highly and specifically expressed in
brown and white adipose tissue [85]. Interestingly, FSP27 is also highly expressed in the fatty
liver of typical diabetes or obese model ob/ob mouse and in the high fat-inducible fatty liver.
In eukaryotic cells the excess of lipids are store in the white adipose tissue in lipid droplets.
FSP27/CIDEC was identified as a new lipid droplet associated protein that was shown to be
involved in the formation and modulation of the size of unicular lipid droplets through their
protection from lipolysis and it is required for the efficient accumulation of triacylglycerols in
mature adipocytes [85, 86].
The expression of many adipocyte specific genes is affected by diettary manipulation. It was
demonstrated that long-term intermittent fasting, significantly up-regulated FSP27 gene
expression in WAT [86] and that PPAR2, C/EBPα, and insulin could be involved in its
nutritional regulation.
The role of FSP27 in promoting lipid droplet formation is not restricted to adipocytes. In fact,
although FSP27/CIDEC is not expressed in normal liver, it was described to be highly
expressed during hepatic steatosis since the excess of lipids stimulate the expression of lipid
droplet associated proteins [72].
In hepatic steatosis, the expression of Fsp27/CIDEC is induced by proliferator-activated
receptor (PPAR). Serially deleted FSP27 luciferase reporter plasmids and chromatin
immunoprecipitatation (ChIP) assays revealed the presence of a functional PPAR response
element and direct binding of PPARto this element. Corroborating these findings, the
expression of the mouse promoter FSP27 was markedly increase by the treatment with
thiazolidinedione (TDZ), rosiglitazone – a specific ligand for PPAR. However, FSP27 was not
activated by specific ligands of PPARα or PPARδ [72].
Moreover, Matsusue and colleagues [72] have also demonstrated that repression of
mitochondrial β-oxidation activity was associated with an increase in FSP27 expression. These
data suggest that the accumulation of triglycerides and the increase of lipid droplets by FSP27
19
may be due to impaired β-oxidation activity and reduced triglyceride turnover. Whether how
FSP27 suppresses β-oxidation activity remains unclear, however it was proposed that since
FSP27 suppresses lipolysis there will be a lack of fatty acyl-CoA released from TG and this
event will in turn impair mitochondrial β-oxidation.
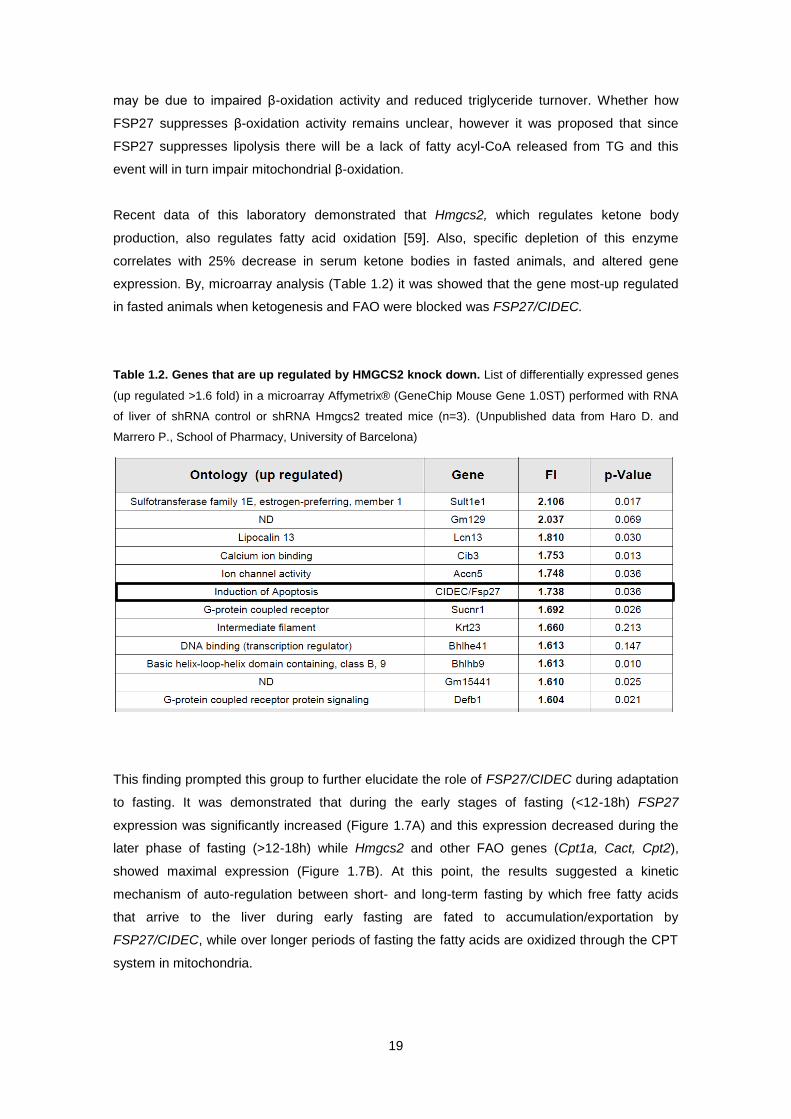
Recent data of this laboratory demonstrated that Hmgcs2, which regulates ketone body
production, also regulates fatty acid oxidation [59]. Also, specific depletion of this enzyme
correlates with 25% decrease in serum ketone bodies in fasted animals, and altered gene
expression. By, microarray analysis (Table 1.2) it was showed that the gene most-up regulated
in fasted animals when ketogenesis and FAO were blocked was FSP27/CIDEC.
Table 1.2. Genes that are up regulated by HMGCS2 knock down. List of differentially expressed genes
(up regulated >1.6 fold) in a microarray Affymetrix® (GeneChip Mouse Gene 1.0ST) performed with RNA
of liver of shRNA control or shRNA Hmgcs2 treated mice (n=3). (Unpublished data from Haro D. and
Marrero P., School of Pharmacy, University of Barcelona)
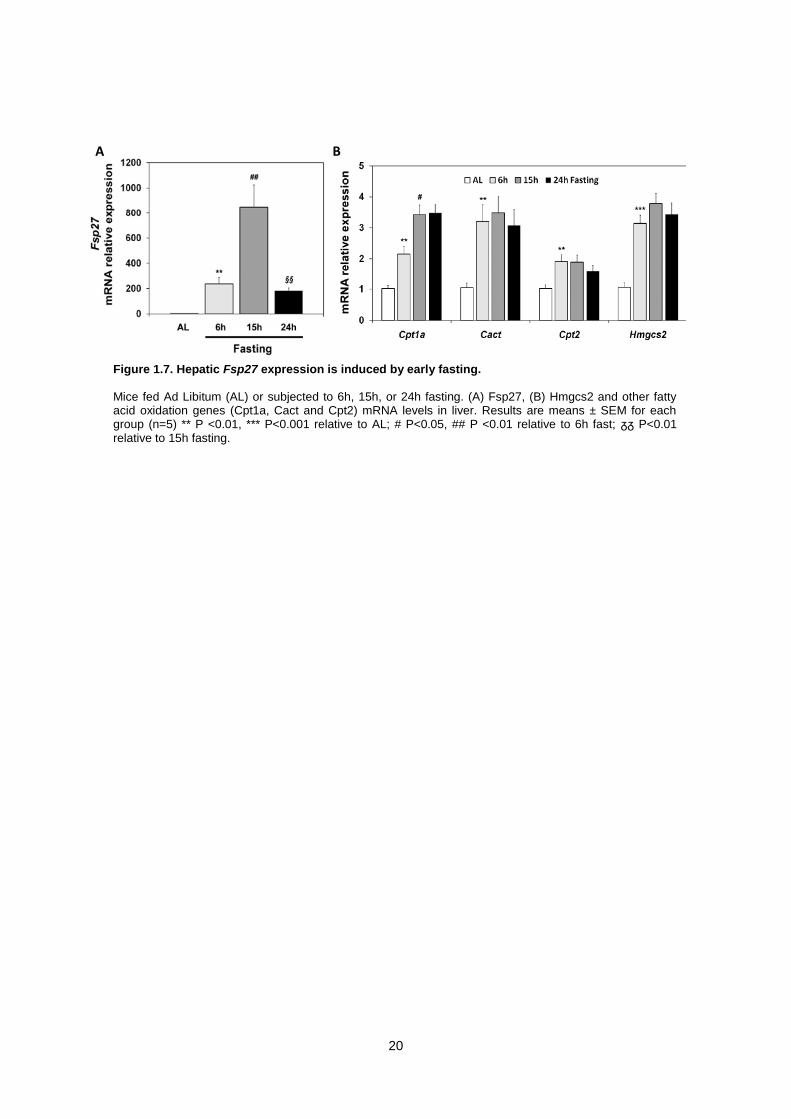
This finding prompted this group to further elucidate the role of FSP27/CIDEC during adaptation
to fasting. It was demonstrated that during the early stages of fasting (<12-18h) FSP27
expression was significantly increased (Figure 1.7A) and this expression decreased during the
later phase of fasting (>12-18h) while Hmgcs2 and other FAO genes (Cpt1a, Cact, Cpt2),
showed maximal expression (Figure 1.7B). At this point, the results suggested a kinetic
mechanism of auto-regulation between short- and long-term fasting by which free fatty acids
that arrive to the liver during early fasting are fated to accumulation/exportation by
FSP27/CIDEC, while over longer periods of fasting the fatty acids are oxidized through the CPT
system in mitochondria.
20
A B
Figure 1.7. Hepatic Fsp27 expression is induced by early fasting.
Mice fed Ad Libitum (AL) or subjected to 6h, 15h, or 24h fasting. (A) Fsp27, (B) Hmgcs2 and other fatty acid oxidation genes (Cpt1a, Cact and Cpt2) mRNA levels in liver. Results are means ± SEM for each group (n=5) ** P <0.01, *** P<0.001 relative to AL; # P<0.05, ## P <0.01 relative to 6h fast; ᵹᵹ P<0.01 relative to 15h fasting.
21
1.4. Amino acid deprivation
Mammals have evolved a wide range of adaptive mechanisms to detect and respond to
fluctuations in dietary protein nutrients. At the level of individual cells, dietary protein limitation is
manifested as amino acid deprivation, which activates an amino acid response (AAR) signal
transduction pathway. Amino acid limitation regulates numerous steps in gene expression
including chromatin structure, transcription start site, transcription rates, mRNA splicing and
RNA export, turnover and translation [87].
Amino acid response pathway
Limiting the extracellular supply of an essential amino acid or blocking the synthesis of an
otherwise nonessential one results in an increase in uncharged tRNA that binds to and activates
the general control nonderepressible protein 2 (GCN2) kinase. In this manner, the GCN2
protein serves as a sensor of amino acid insufficiency. Thus depletion at the cellular level of any
individual amino acid can trigger AAR. Once activated, GCN2 kinase phosphorylates the
translation factor eIF-2α that suppresses general protein synthesis but promotes a paradoxical
increase in translation of mRNA species. Among these are several activating transcription
factors such as ATF4. ATF4 triggers increased transcription by binding to (CCACT-enhancer
binding protein-activating transcription facto C/EBP-ATF response elements (CARE)), so named
because they are composed of a half-site for the C/EBP family and a half-site for the ATF family
transcription factors. The products of these CARE -containing genes modulate a wide spectrum
of cellular events designed to adapt to dietary stress [88].

22

23
2. THESIS GOAL
Currently, whereas the role of Fsp27/CIDEC begins to be better understood in adipose tissue,
little is known about its physiology in liver. As discussed above, previous results of this group
showed that the Fsp27/CIDEC gene expression is regulated in a time-dependent manner during
fasting in liver, being induced in the early steps of fasting and decreased after a longer period.
These previous results and the importance of Fsp27/CIDEC in regulating energy homeostasis,
including its modulation by FAO prompted the present study where we aimed to further explore
the physiologic role and to provide mechanistic insight of Fsp27/CIDEC regulation in adaptation
to fasting response in HepG2 cells. We aimed to specifically answer two questions: 1) Why
CIDEC expression decreases during prolonged fasting and 2) How FAO affects CIDEC
expression.
In the second part of the present study we aimed to elucidate if the mechanism by which Pgc-1α
becomes activated in response to prolonged fasting and amino acid deprivation is somehow
mediated by Foxa2. This notion is based in the suggestion that Foxa2 could be involved in the
regulation of metabolic adaptation to low nutrient conditions such as fasting and amino acid
deprivation in hepatocytes. This hypothesis, is further based in recent results of this group
demonstrated that in these particular nutrient restriction conditions, both Foxa2 and Pgc-1α
expression are increased in mice liver.

24
25
3. MATHERIALS AND METHODS
3.1. Plasmid DNA preparation
To obtain the plasmid DNA used in this study, the interest mouse promoters (Pgc-1α and
Fsp27) were amplified by PCR, with Taq polymerase (Biotools), dNTPS, specific primers (see
plasmid construct below) and mouse genomic DNA. The amplified product was run in an
agarose gel to verify the product size. The band of interest was cut from the gel and purified
with the Wizard SV Gel and PCR Clean System kit (Promega), according to the manufacturer’s
instructions.
After quantification of the purified product on NanoDrop-1000 (NanoDrop Technologies, Inc.
Thermo Scientific) the product was inserted in a pGEM-T vector, according to the
protocol pGEM-T and pGEM-T Easy Vector (Promega).
The plasmid DNA was transformed into competent cells E.coli DH5α, previously prepared by
salt washes (CaCl2) to permeabilize them, and frozen at -800C, and then plated on indicator
agar plates (AIX plates: 100 mg/L ampicillin, 8 mg/L IPTG, and 40 g/L XGal) for selection.
The plates were incubated overnight at 37ºC; recombinants were selected by blue/white
secreening on indicator plates. Positive white colonies are incapable to hydrolyze the substracte
X-Gal because the insert causes the loss of the β-galactosidase activity, while colonies that
have incorporated the empty vector (negative colonies) are blue due to the presence of the X-
Gal hydrolysis products. The white positive colonies were left to grow overnight in 3 mL LB
inoculums, with selection antibiotic (ampicillin).
The plasmid DNA from inoculums was obtained with a commercial kit PureYield Plasmid
Miniprep System (Promega). The plasmid DNA was sequenced (Macrogen sequencing
service).
After sequencing, the insert was released from pGEM-T, with restriction enzymes specific for
the sequence amplified (see plasmid construct below), and ran in an agarose gel. The bands
were purified (with the Wizard SV Gel and PCR Clean System kit (Promega)) and the insert was
subcloned into the pGL3b vector.
The plasmid DNA was transformed in competent cells E.coli DH5α and plated in agar plates
with the selection antibiotic for pGL3b (ampicillin). Selection of positive colonies was performed
through PCR screening. The DNA of the positive colonies selected was obtained with a
commercial kit PureLink HiPure Plasmid Filter Maxiprep Kit (Invitrogen).
26
3.2. Plasmid construct and site directed mutagenesis
3.2.1. Mouse PGC1-α promoter
The PGC-1α promoter (nt -2010/-51 to the relative transcription start site) was amplified by PCR
from mouse genomic DNA using Taq polymerase (Biotools) with the oligonucleotides forward
(DH1384) and reverse (DH1385) containing the sequence of the restriction sites MluI and XhoI
respectively (italicized and bolded in the primer sequence, see Primer Design, “Cloning” section
in Annex). The PCR products were cloned in the vector pGEM-T and sequenced (Macrogen
sequencing service). This plasmid was digested with MluI and XhoI and subcloned into the
promoter firefly luciferase reporter gene vector pGL3-Basic (Promega).
3.2.2. Mouse Fsp27 promoter
The Fsp27 promoter (nt -2054/+18 to the relative transcription start site) was amplified by PCR
from mouse genomic DNA using Taq polymerase (Biotools) with the oligonucleotides forward
(DH1303) and reverse (DH1304) containing the sequence of the restriction sites MluI and XhoI
respectively (italicized and bolded in the primer sequence see Primer Design, “Cloning” section
in Annex). The PCR products were cloned in the vector pGEM-T and sequenced (Macrogen
sequencing service). This plasmid was digested with MluI and XhoI and subcloned into the
promoter firefly luciferase reporter gene vector pGL3-Basic (Promega).
1.2.2.3. QuikChange™ Site-Directed Mutagenesis Kit
The mutations in the CREB identified sequences in the mouse Fsp27 promoter were generated
by site directed mutagenesis, carried out by a commercial kit - QuickChangeTM
Site-Directed
Mutagenesis (Stratagene) following the manufacturer’s instructions. The mutants were
generated by point mutations replacing the original sequences TGACTTCA (CRE1 site, -375/-
366) and CGTCA (CRE2 half site, -1792/-1787) by TGAGTATC and ATCGC respectively in
both sense and antisense orientations, following the manufacturer’s instructions (see primer
design, “Site direct mutagenesis” section in Annex).
The QuikChange site-directed mutagenesis kit is used to make point mutations, switch amino
acids, and delete or insert single or multiple amino acids. The QuikChange site-directed
mutagenesis method is performed using PfuTurbo™ DNA polymerase ll and a thermal
temperature cycler PfuTurbo DNA polymerase replicates both plasmid strands with high fidelity
and without displacing the mutant oligonucleotide primers. The basic procedure utilizes a
supercoiled double-stranded DNA (dsDNA) vector with an insert of interest and two synthetic
oligonucleotide primers containing the desired mutation. The oligonucleotide primers, each
27
complementary to opposite strands of the vector, are extended during temperature cycling by
using PfuTurbo DNA polymerase. Incorporation of the oligonucleotide primers generates a
mutated plasmid containing staggered nicks. Following temperature cycling, the product is
treated with Dpn I. The Dpn I endonuclease is specific for methylated and hemimethylated DNA
and is used to digest the parental DNA template and to select for mutation-containing
synthesized DNA.
3.2.3. Automatic sequenciation of DNA
The sequences and orientations of the constructions were verified by sequencing – Macrogen
Inc. (Macrogen sequencing service).
3.2.4. DNA oligonucleotide (primers)
All DNA oligos were synthesized by Sigma-Aldrich with technology ultra-high base coupling
efficiency, combined with optimized cartridge purification and 100% quality control by mass
spectrometry (Designed primer sequences are listed in the Annex).
3.3. Cell culture
Cell Line Description Reference
HepG2 Human liver carcinoma (Hommo sapiens) ATCC No. HB-8065
HepG2 are adherent, epithelial-like cells growing as monolayers and in small aggregates.
HepG2 cell line was derived from the liver tissue of fifteen year old male with differentiated
hepatocelullar carcinoma.
The human hepatocellular carcinoma cells HepG2 were cultured in Eagle's Minimum Essential
Medium (MEM) supplemented with 4 mM glutamine, 100 μg/ml streptomycin sulfate, 100
units/ml penicillin G, and 10% (v/v) fetal bovine serum (FBS). Cells were incubated at 37°C in
humidified atmosphere containing 5% CO2. Culture medium was discarded and changed every
2-3 days. To passage, cells were briefly washed twice with 1xPBS and 0.05% Trypsin-EDTA
solution was added. The cell layer dispersed at 37°C for 5 min, trypsin was deactivated by
adding complete growth medium. Cells were split 1:4 dilution every 5 days or counted (Trypan
Blue stain method) and plated according the final experiment. Cells were replenished with fresh
medium before all experiments. To induce the fasting response, cells were incubated for 16
hours in a serum-free medium – Opti-MEM (Invitrogen) and supplemented with or without 10
µM Etomoxir (6 hours); 10 µM Etomoxir plus 10 µM of GW9662 for 6 hours; 10 µM of Forskolin
28
(6 hours); 10 µM of Forskolin (6 hours) and pretreatment with 50 µM of H89 (1 hour); 10 µM of
Wy14643 (24 hours). In the controls of these experiments, cells were also incubated for 16h in
Opti-MEM (Invitrogen) and the vehicles (water or DMSO) of the specific reagents used in each
experiment were added – see “Reagents used in cell culture specific treatments” below.
3.4. Reagents
3.4.1. Reagents used in cell culture maintenance
Regent Reference
Minimum Essential Media (MEM) GIBCO, 61100-087 Fetal Bovine Serum (FBS) GIBCO, 10270-106
Pen Strep (Penicillin-Streptomycin) GIBCO, 15140-122 L-Glutamine 200mM GIBCO, 25030-024
Sodium bicarbonate solution 7.5% GIBCO, 15140-122 OPTI-MEM® I GIBCO, 31985-047
Tripsin-EDTA 10X GIBCO, 15400-054
3.4.2. Reagents used in cell culture specific treatments
Reagent Reference Description Vehicle
GW9662 Sigma M6191 PPAR antagonist Dissolved in DMSO to 10 mM.
ETOMOXIR Sigma E1905 CPT1 inhibitor Dissolved in water to 10 mM. FORSKOLIN
H89 Wy14643
Sigma F6886 Sigma B1427 Sigma C7081
cAMP agonist PKA inhibitor
PPARα agonist
Dissolved in DMSO to 10 mM. Dissolved in water to 10 mM. Dissolved in DMSO to 10 mM.
Following reconstitution stock solutions aliquots were stored at -20°C.
3.4.3. Reagents used in cell culture transfection
Reagent Reference
Lipofectamine LTX Reagent Invitrogen, 15338-100 DharmaFECT®4 Transfection Reagent Thermo Scientific, T-2004-01
3.5. Transient transfection and gene reporter assays
HepG2 cells were plated at a density of 1.5 x 10⁵
cells/well on 24-well plates and cultured for
24h in culture medium (MEM). Cells were transiently transfected using Lipofectamine LTX
(Invitrogen) at a ratio of 2.5 µl to 1 µg of DNA, following the manufacturer’s instructions. For
each transfection 0.4 μg of reporter gene construct (pGL3b-Fsp27 or pGL3b-Pgc-1α) and
different amounts of the transcription factors expression vectors (pcDNA3, CREB or FOXA2)
were co-transfected (indicated in the respective graphs). The plasmid pRL-CMV (10ng/well) was
included as an internal transfection control. The total amount of transfected DNA was kept
constant among experimental groups by the addition of pcDNA3 empty plasmid.

29
At approximately 48 h following transfection, cellular extracts were prepared for analysis of
luciferase activity, by washing the cells with phosphate-buffered saline (PBS 1x), and harvested
in 100 μl of 1x Passive lysis buffer (E194A, Promega). The lysates were collected and a 10 μl
aliquot was used for Firefly luciferase assays using the Dual-Luciferase Reporter Assay System
(E1960, Promega). Firefly and Renilla luciferase activities were dertermined in a Berthold Sirius
Luminometer. Relative luciferase activity was given as the ratio of relative luciferase unit/relative
Renilla unit.
3.6. siRNA Transfection
Specific human SIRT1 (T2004-01) and siControl nontargeting (D-001210-01) siRNAs were
purchased from Dharmacon (Thermo Fisher). HepG2 cells were seeded in 6 well plates at
density 4.5 x 10⁵
cell/well in MEM and grown for 24h. Transfection was performed according to
the instructions of Dharmacon using 5 µl of DharmaFECT®4 and 25 nM per well final siRNA
concentration. At 72h following transfection, cells were rinsed with PBS, and total RNA was
isolated and analyzed by real time PCR.
3.7. KCREB Transfection – Fluorescence assay
HepG2 cells were seeded in 6 well plates at density 4.5 x 10⁵
cell/well in MEM and grown for
24h. Cells were transiently transfected using Lipofectamine LTX (Invitrogen) at a ratio of 2.5 µl
to 1 µg of DNA, following the manufacturer’s instructions. The constructs GFP (500 ng) and
pcDNA3-KCREB (500 ng) were co-transfected. The experiment controls only contained the
GFP construct transfected. At 24h following transfection, cells were visualized and
photographed with a confocal laser microscope LEICA DMI 4000 B in order to access
transfection efficiency. Cells were then incubated for 16 hours (overnight) in a serum-free
medium – Opti-MEM (Invitrogen) and then treated for 6h with 10 µM of forskolin and controls
were supplemented with vehicle (DMSO). Following the 6h forskolin treatment, cells were rinsed
with PBS, and total RNA was isolated and analyzed by real time PCR.
3.8. Isolation and analysis of RNA
3.8.1. Isolation of total RNA
Total RNA was extracted from HepG2 cells using TRI Reagent Solution (Ambion) according to
manufacturer’s instructions. Cultured cells were washed twice with cold PBS 1x and isolated by
scrapping. TRI Reagent maintains the integrity of the RNA due to highly effective inhibition of
RNAse activity while disrupting cells and dissolving cell components during sample

30
homogenization. Furthermore, this reagent is free of protein and DNA contamination. However,
RNA was pretreated with DNaseI (Ambion) to eliminate genomic DNA contamination.
RNA was dissolved in DEPC-treated water (Sigma-Aldrich) and the concentration and purity of
each sample was obtained from A260/A280 and A260/230 measurements in a micro-volume
spectrophotometer NanoDrop-1000 (NanoDrop Technologies, Inc. Thermo Scientific).
3.8.2. RT-PCR
Reverse transcription polymerase chain reaction is used to synthetized cDNA from one
microgram of total RNA. Total RNA was reversed transcribed using random hexamers (Roche
Diagnostics), dNTPs (Attend Bio) and M-MLV reverse transcriptase (Invitrogen) following
manufacturer’s instructions.
3.8.3. Real time PCR
cDNA was subjected to real time PCR analysis using TaqMan universal PCR master mix
(Invitrogen) and the specific gene expression Taqman probes from Applied Biosystems and
normalized against those of 18S ribosomal RNA determined by Eukaryotic 18S rRNA
endogenous control (Applied Biosystems). The following human gene probes were used:
CIDEC Hs00535723_m1, PEPCK Hs00159918_m1, PGC-1α Mm00447181_m1, FOXA2.
Reactions were measured in duplicate. The reactions were performed in ABI PRISM® 7700
Sequence detection Systems (Applied Biosystems) in 96-well plates. The thermal cycling
conditions were, an initial activation step for 2 min at 50 °C and 10 min at 95 °C and 40 cycles
of melting ate 95 °C for 15 sec and annealing/extend for 1 min ate 60 °C [89].
Results were obtained by the comparative Ct method and expressed as fold of the experimental
control. The comparative CT (ΔΔCt) method [90] was used to determine the relative target
quantity in the samples.
3.9. Statistical analysis
Results are expressed as means ± standard error mean (SEM) from n=2 to n=6. The statistical
significance of differences found between groups was assessed by one-way analysis of
variance. An unpaired Student’s t test was use to compare the groups. P<0.05 was considered
as statistically significant difference.
31
3.10. Information technologic tools
Entrez-Pubmed, National Center for Biotechnology Information (NCBI, USA):
http://www.ncbi.nlm.nih.gov/pubmed/
TFSEARCH: Searching Transcription Factor Binding Sites:
http://www.cbrc.jp/research/db/TFSEARCH.html
3.11. Additional Information
Any missing information regarding the experimental procedures, which also cannot be found in
Annex, means that the procedure was performed according to the detailed information given by
“Molecular Cloning, a Laboratory Manual” (Sambrook, Fritsch and Maniatis), or following the
protocols provided in the instructions of the commercial kits used.

32
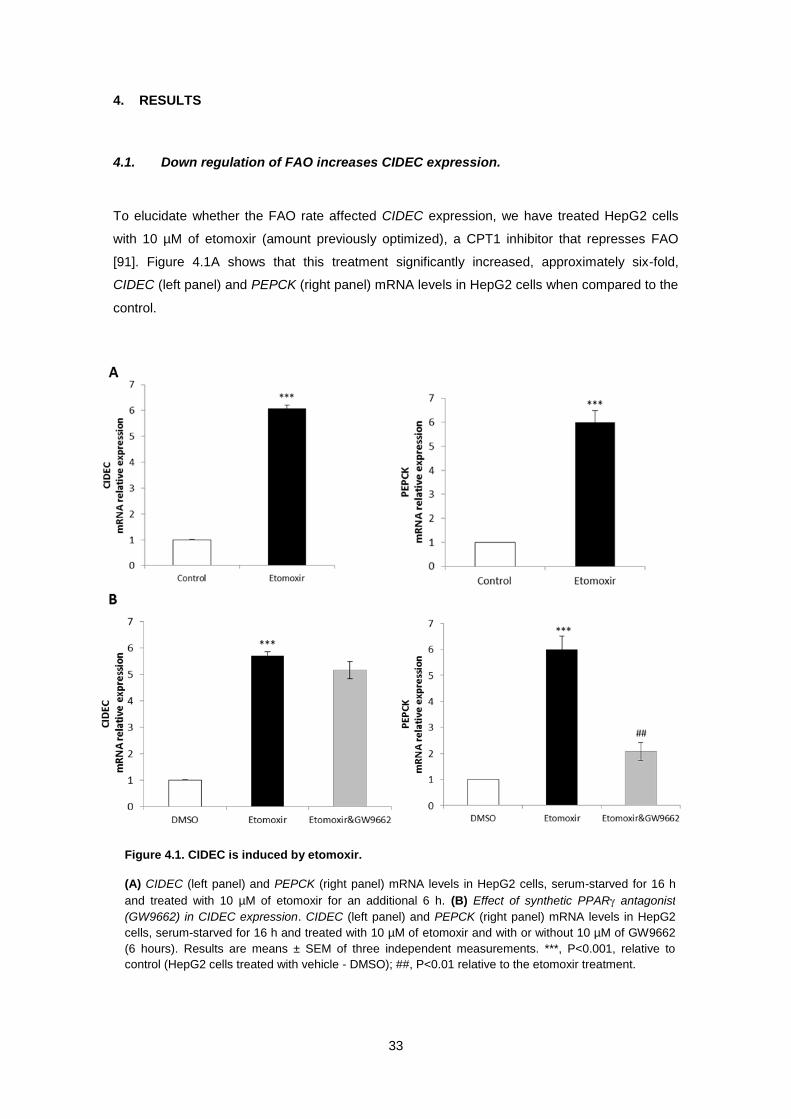
33
4. RESULTS
4.1. Down regulation of FAO increases CIDEC expression.
To elucidate whether the FAO rate affected CIDEC expression, we have treated HepG2 cells
with 10 µM of etomoxir (amount previously optimized), a CPT1 inhibitor that represses FAO
[91]. Figure 4.1A shows that this treatment significantly increased, approximately six-fold,
CIDEC (left panel) and PEPCK (right panel) mRNA levels in HepG2 cells when compared to the
control.
Figure 4.1. CIDEC is induced by etomoxir.
(A) CIDEC (left panel) and PEPCK (right panel) mRNA levels in HepG2 cells, serum-starved for 16 h
and treated with 10 µM of etomoxir for an additional 6 h. (B) Effect of synthetic PPAR antagonist
(GW9662) in CIDEC expression. CIDEC (left panel) and PEPCK (right panel) mRNA levels in HepG2
cells, serum-starved for 16 h and treated with 10 µM of etomoxir and with or without 10 µM of GW9662
(6 hours). Results are means ± SEM of three independent measurements. ***, P<0.001, relative to
control (HepG2 cells treated with vehicle - DMSO); ##, P<0.01 relative to the etomoxir treatment.
34
Previously it was suggested that impairment of FAO leads to triacylglyceride accumulation that
stimulates lipid droplet associated proteins like Fsp27/CIDEC and that this mechanism was
specifically mediated by PPAR[64, 72].
Having this into account and to further study whether PPARwas involved in Fsp27/CIDEC
expression changes affected by FAO rate, we used a specific PPARantagonist (GW9662). As
shown in Figure 4.1B, treatment of HepG2 cells with 10 µM of GW9662 had no effect on CIDEC
expression (left panel) while the same treatment resulted in a significant reduction of PEPCK
expression (right panel). PEPCK was used as a positive control for these experiments since it
has been described as a direct target of PPAR [92].
These data suggest that CIDEC expression is regulated by mitochondrial FAO rate, but the
mechanism by which CIDEC is upregulated when FAO is impaired is not mediated by PPAR.
4.2. The induction of CIDEC expression is not mediated by PPARα during fasting.
Under physiological conditions, the function of PPARα is mainly evoked during fasting, which is
associated with increased hepatic PPARα mRNA expression and increased FFA levels that are
natural ligands of PPARα [93]. Based on this data, we investigated whether it could be one of
the signals triggering the induction of CIDEC in fasting conditions. Figure 4.2 shows that CIDEC
expression (left panel) is unchanged upon treatment with 10 µM of specific PPARα ligand
Wy14643 (Sigma) while, under the same conditions, HMGCS2 mRNA levels (right panel) were
significantly increased in HepG2 cells, as expected, since HMGCS2 is a target gene of PPARα
[59].
These results suggest that the fasting expression pattern of CIDEC is not modulated by the
activity of PPARα in HepG2 cells.
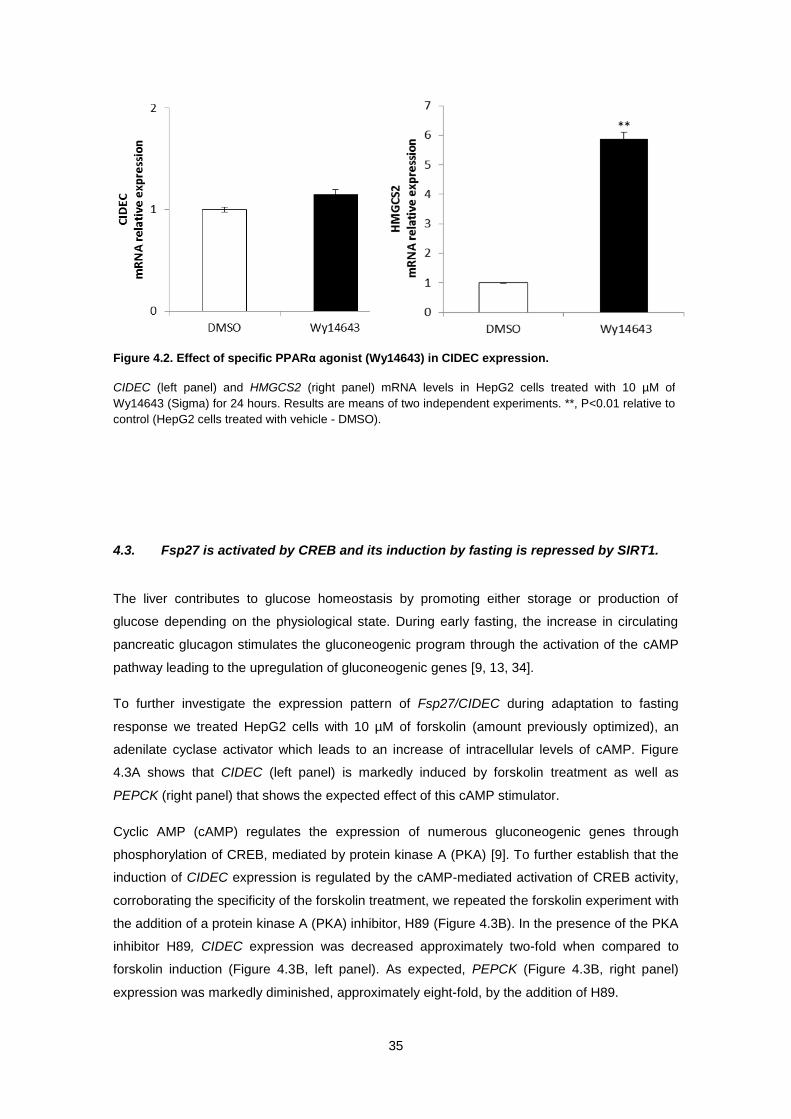
35
4.3. Fsp27 is activated by CREB and its induction by fasting is repressed by SIRT1.
The liver contributes to glucose homeostasis by promoting either storage or production of
glucose depending on the physiological state. During early fasting, the increase in circulating
pancreatic glucagon stimulates the gluconeogenic program through the activation of the cAMP
pathway leading to the upregulation of gluconeogenic genes [9, 13, 34].
To further investigate the expression pattern of Fsp27/CIDEC during adaptation to fasting
response we treated HepG2 cells with 10 µM of forskolin (amount previously optimized), an
adenilate cyclase activator which leads to an increase of intracellular levels of cAMP. Figure
4.3A shows that CIDEC (left panel) is markedly induced by forskolin treatment as well as
PEPCK (right panel) that shows the expected effect of this cAMP stimulator.
Cyclic AMP (cAMP) regulates the expression of numerous gluconeogenic genes through
phosphorylation of CREB, mediated by protein kinase A (PKA) [9]. To further establish that the
induction of CIDEC expression is regulated by the cAMP-mediated activation of CREB activity,
corroborating the specificity of the forskolin treatment, we repeated the forskolin experiment with
the addition of a protein kinase A (PKA) inhibitor, H89 (Figure 4.3B). In the presence of the PKA
inhibitor H89, CIDEC expression was decreased approximately two-fold when compared to
forskolin induction (Figure 4.3B, left panel). As expected, PEPCK (Figure 4.3B, right panel)
expression was markedly diminished, approximately eight-fold, by the addition of H89.
Figure 4.2. Effect of specific PPARα agonist (Wy14643) in CIDEC expression.
CIDEC (left panel) and HMGCS2 (right panel) mRNA levels in HepG2 cells treated with 10 µM of
Wy14643 (Sigma) for 24 hours. Results are means of two independent experiments. **, P<0.01 relative to
control (HepG2 cells treated with vehicle - DMSO).
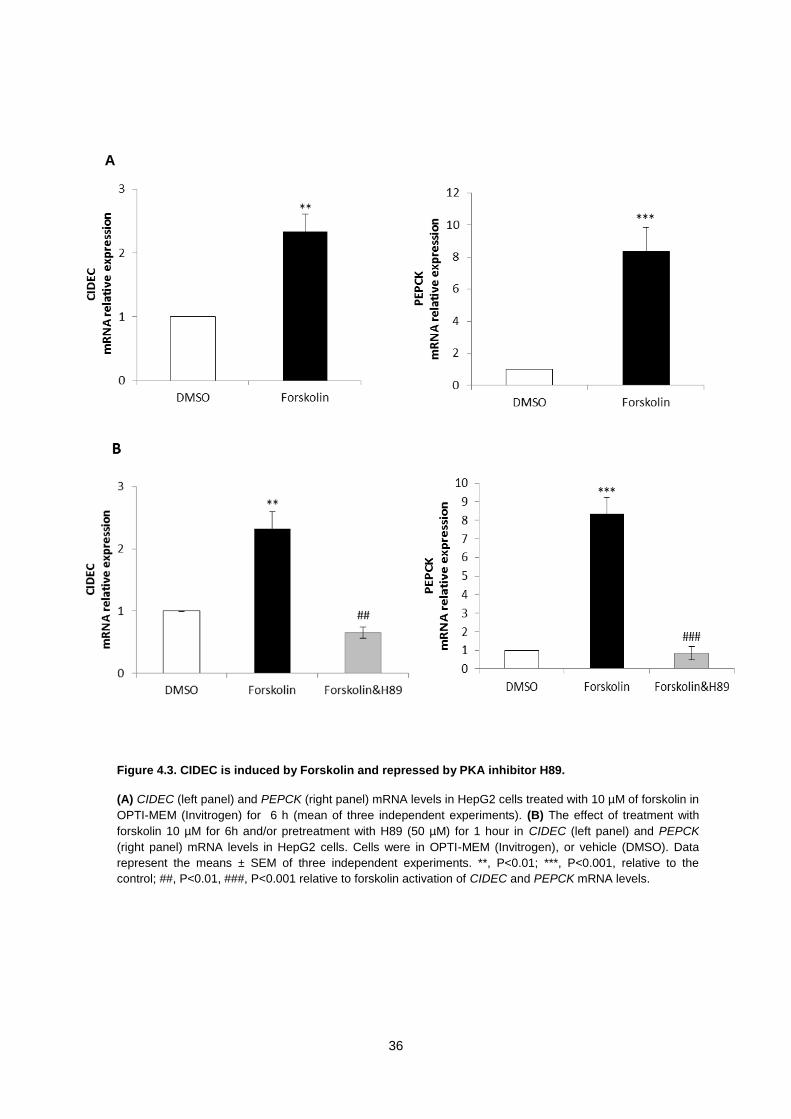
36
A
Figure 4.3. CIDEC is induced by Forskolin and repressed by PKA inhibitor H89.
(A) CIDEC (left panel) and PEPCK (right panel) mRNA levels in HepG2 cells treated with 10 µM of forskolin in
OPTI-MEM (Invitrogen) for 6 h (mean of three independent experiments). (B) The effect of treatment with
forskolin 10 µM for 6h and/or pretreatment with H89 (50 µM) for 1 hour in CIDEC (left panel) and PEPCK
(right panel) mRNA levels in HepG2 cells. Cells were in OPTI-MEM (Invitrogen), or vehicle (DMSO). Data
represent the means ± SEM of three independent experiments. **, P<0.01; ***, P<0.001, relative to the
control; ##, P<0.01, ###, P<0.001 relative to forskolin activation of CIDEC and PEPCK mRNA levels.
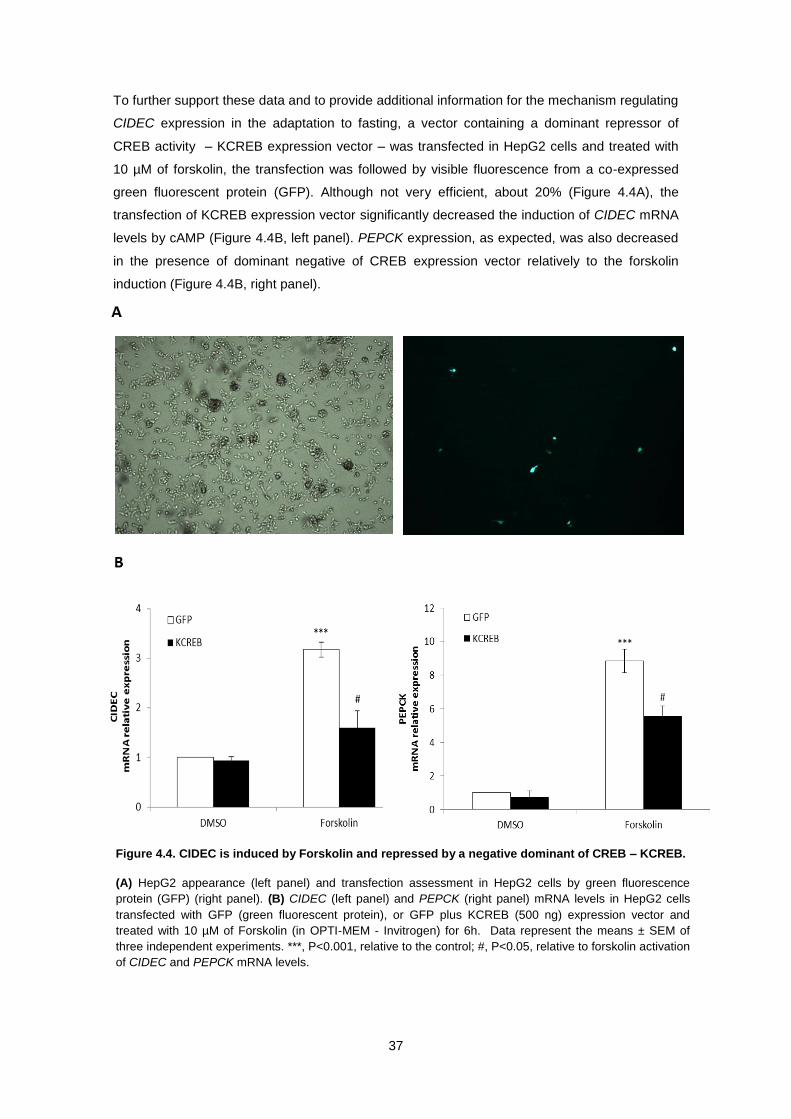
37
To further support these data and to provide additional information for the mechanism regulating
CIDEC expression in the adaptation to fasting, a vector containing a dominant repressor of
CREB activity – KCREB expression vector – was transfected in HepG2 cells and treated with
10 µM of forskolin, the transfection was followed by visible fluorescence from a co-expressed
green fluorescent protein (GFP). Although not very efficient, about 20% (Figure 4.4A), the
transfection of KCREB expression vector significantly decreased the induction of CIDEC mRNA
levels by cAMP (Figure 4.4B, left panel). PEPCK expression, as expected, was also decreased
in the presence of dominant negative of CREB expression vector relatively to the forskolin
induction (Figure 4.4B, right panel).
Figure 4.4. CIDEC is induced by Forskolin and repressed by a negative dominant of CREB – KCREB.
(A) HepG2 appearance (left panel) and transfection assessment in HepG2 cells by green fluorescence
protein (GFP) (right panel). (B) CIDEC (left panel) and PEPCK (right panel) mRNA levels in HepG2 cells
transfected with GFP (green fluorescent protein), or GFP plus KCREB (500 ng) expression vector and
treated with 10 µM of Forskolin (in OPTI-MEM - Invitrogen) for 6h. Data represent the means ± SEM of
three independent experiments. ***, P<0.001, relative to the control; #, P<0.05, relative to forskolin activation
of CIDEC and PEPCK mRNA levels.

38
To elucidate the molecular mechanism underlying Fsp27/CIDEC fasting mediated expression in
HepG2 cells and in liver, the transcriptional regulation of Fsp27 through CREB was
investigated.
By searching the TFSEARCH database (http://www.cbrc.jp), two putative CREB response
elements (CRE) in the 5’-flanking region of the mouse Fsp27 gene (nt -2054/+18 relative to the
transcriptional start site) were revealed at positions -1787/-1792 (CRE2) and -366/-375 (CRE1)
from the transcription start site (Figure 4.5A).
The upstream site (CRE2) is a conserved half-site motif (CGTCA) while the downstream site
(CRE1) is an eight-base-pair element (TGACTTCA) partially conserved from the canonical
palindrome (TGACGTCA).
To elucidate whether the Fsp27 gene was induced by CREB, reporter gene transfection studies
were carried out. Several constructs were produced with the luciferase gene as a reporter and
transfected in HepG2 cells (Figure 4.5B). The same cells were co-transfected with an
expression vector for CREB. Figure 4.5C, shows that CREB expression significantly induced
(thirty-fold) the wild type reporter and this induction was diminished when single CREs were
mutated (mut 1 or in a higher extend mut 2) or completely abolished, when both elements were
simultaneously mutated (mut x2). These results identify the sequences CRE1 and CRE2 as
CREB responsive elements in Fsp27 mouse gene.
Taken together, these data support that CIDEC is a direct target of CREB activity in
hepatocytes and this process is mediated by the cAMP axis activation during the early fasting
state.

39
CGTC
A
TGACTTCA
atcgc
TGAgTatc
TGACTTCA
TGAgTatc atcgc
CGTC
A
CGTCA TGACTTCA
-1792 -1787 - 375 - 366
-2054 +18
Figure 4.5. Fsp27 mouse promoter activity is induced by CREB transcription factor.
(A) 5’-flanking region of the mouse Fsp27 gene with the nucleotide sequences of the putative CREB sites
- CRE1 and CRE2. (B) The subsequent constructs have the correspondent mutated elements inside the
boxes bellow the wild type construct. The original sequence is shown as a line. (C) HepG2 cells
transfected for 48 h with Fsp27 promoter constructs cloned in pGL3basic and co-transfected with either
pcDNA3 or pcDNA3-CREB (150 ng) expression vectors. Results are represented by fold activation to the
WT promoter construct. pGL3basic activation was subtracted from each condition. Data represent the
means ± SEM of four independent experiments performed in duplicate. *, P<0.05; **, P<0.01; relative to wt
construct; #, P<0.05, ##; P<0.01 relative to CREB activation of WT promoter.
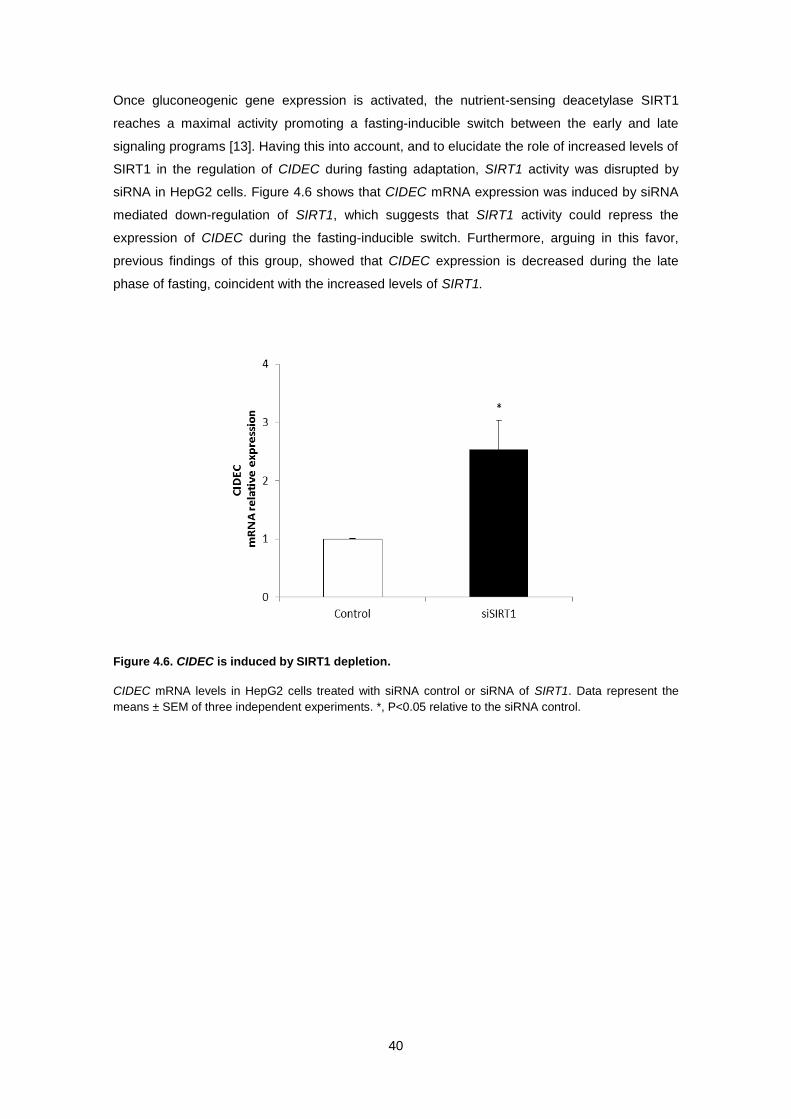
40
Once gluconeogenic gene expression is activated, the nutrient-sensing deacetylase SIRT1
reaches a maximal activity promoting a fasting-inducible switch between the early and late
signaling programs [13]. Having this into account, and to elucidate the role of increased levels of
SIRT1 in the regulation of CIDEC during fasting adaptation, SIRT1 activity was disrupted by
siRNA in HepG2 cells. Figure 4.6 shows that CIDEC mRNA expression was induced by siRNA
mediated down-regulation of SIRT1, which suggests that SIRT1 activity could repress the
expression of CIDEC during the fasting-inducible switch. Furthermore, arguing in this favor,
previous findings of this group, showed that CIDEC expression is decreased during the late
phase of fasting, coincident with the increased levels of SIRT1.
Figure 4.6. CIDEC is induced by SIRT1 depletion.
CIDEC mRNA levels in HepG2 cells treated with siRNA control or siRNA of SIRT1. Data represent the
means ± SEM of three independent experiments. *, P<0.05 relative to the siRNA control.
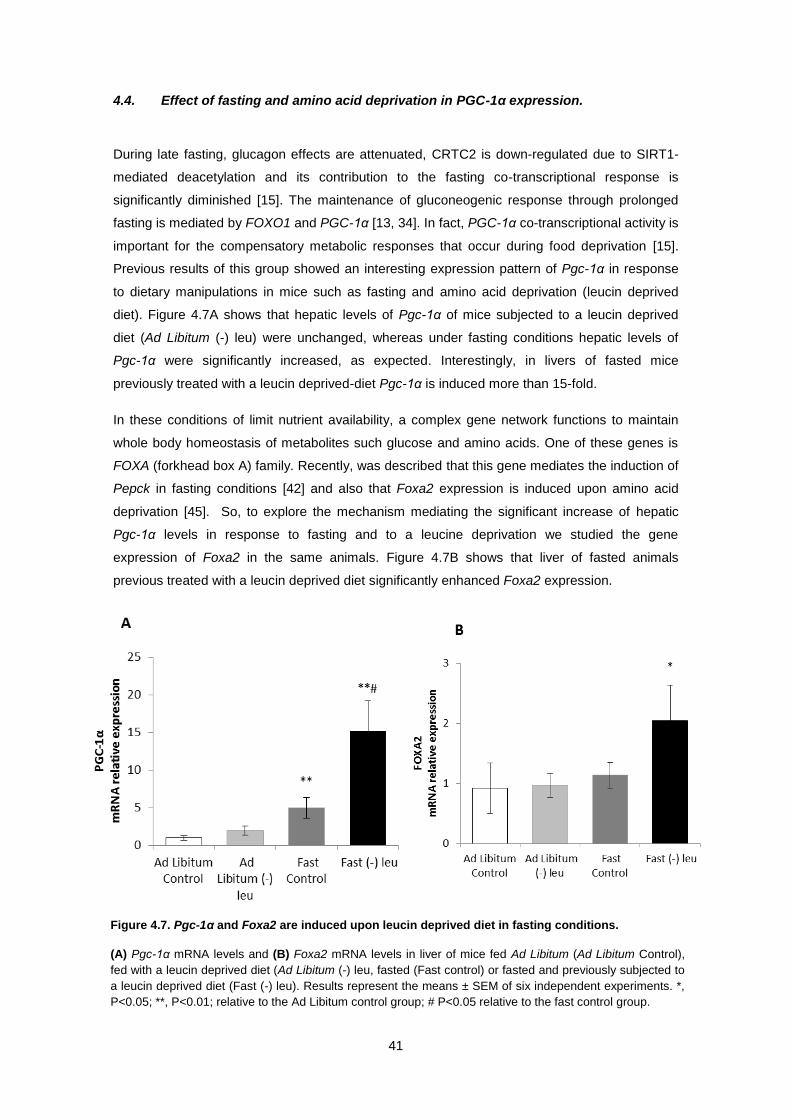
41
4.4. Effect of fasting and amino acid deprivation in PGC-1α expression.
During late fasting, glucagon effects are attenuated, CRTC2 is down-regulated due to SIRT1-
mediated deacetylation and its contribution to the fasting co-transcriptional response is
significantly diminished [15]. The maintenance of gluconeogenic response through prolonged
fasting is mediated by FOXO1 and PGC-1α [13, 34]. In fact, PGC-1α co-transcriptional activity is
important for the compensatory metabolic responses that occur during food deprivation [15].
Previous results of this group showed an interesting expression pattern of Pgc-1α in response
to dietary manipulations in mice such as fasting and amino acid deprivation (leucin deprived
diet). Figure 4.7A shows that hepatic levels of Pgc-1α of mice subjected to a leucin deprived
diet (Ad Libitum (-) leu) were unchanged, whereas under fasting conditions hepatic levels of
Pgc-1α were significantly increased, as expected. Interestingly, in livers of fasted mice
previously treated with a leucin deprived-diet Pgc-1α is induced more than 15-fold.
In these conditions of limit nutrient availability, a complex gene network functions to maintain
whole body homeostasis of metabolites such glucose and amino acids. One of these genes is
FOXA (forkhead box A) family. Recently, was described that this gene mediates the induction of
Pepck in fasting conditions [42] and also that Foxa2 expression is induced upon amino acid
deprivation [45]. So, to explore the mechanism mediating the significant increase of hepatic
Pgc-1α levels in response to fasting and to a leucine deprivation we studied the gene
expression of Foxa2 in the same animals. Figure 4.7B shows that liver of fasted animals
previous treated with a leucin deprived diet significantly enhanced Foxa2 expression.
Figure 4.7. Pgc-1α and Foxa2 are induced upon leucin deprived diet in fasting conditions.
(A) Pgc-1α mRNA levels and (B) Foxa2 mRNA levels in liver of mice fed Ad Libitum (Ad Libitum Control),
fed with a leucin deprived diet (Ad Libitum (-) leu, fasted (Fast control) or fasted and previously subjected to
a leucin deprived diet (Fast (-) leu). Results represent the means ± SEM of six independent experiments. *,
P<0.05; **, P<0.01; relative to the Ad Libitum control group; # P<0.05 relative to the fast control group.

42
These data, and previous findings suggesting that the genes that regulate hepatic response are
blunted in the absence of Foxa2 [42], prompted us to elucidate if Foxa2 was mediating the Pgc-
1α induction observed during fasting and amino acid deprivation (Figure 4.7A). Towards this
end, Pgc-1α mouse promoter was cloned (nt -2010/-51 to the relative transcription start site) in
a plasmid which drives the expression of a luciferase reporter gene (pGL3b) and, reporter gene
transfection studies were carried out. Since previous studies suggested that Foxa2 allows
chromatin access for hormone dependent transcription factors that are activated during food
deprivation [42], we transfected HepG2 cells with either Pepck or Pgc-1α promoters and
different concentrations of expression vectors for CREB and FOXA2 (indicated in the graph).
Figure 4.8 shows that CREB expression significantly induced both Pepck (left panel) and Pgc-
1α (right panel) promoters, while single addition of FOXA2 had no effect in the activity of the
promoters. Then, when co-tranfected with CREB and FOXA2 both Pepck and Pgc-1α promoter
activities were induced however in a lesser extend then the activation observed for CREB itself.
These results suggest that indeed Foxa2 plays a role in the hepatic response in the adaptation
to amino acid deprivation and fasting although the mechanism by which Foxa2 is mediating this
response is not by allowing CREB binding to both Pepck and Pgc-1α promoters in HepG2 cells.
Figure 4.8. Pgc-1α and Pepck promoter activities are induced by CREB but not by FOXA2 transcription factors.
Transient assay of HepG2 cells transfected for 48 h with pGL3b (control) or the Pgc-1α and Pepck promoters and co-transfected with either pcDNA3 and/or pcDNA3-CREB, pcDNA3 and/or pcDNA3-FOXA2 or pcDNA3-CREB plus pcDNA3-FOXA2 expression vectors, represented by fold activation to pGL3b. pGL3b activation was subtracted from each condition. Data represent the means ± SEM of three independent experiments performed in duplicate. **, P<0.01 relative to pcDNA3.
43
5. DISCUTION
Fat specific protein of 27 kDa (FSP27) or the cell death-inducing DNA fragmentation factor 45-
like effector C (CIDEC, the human homologue of FSP27) belong to the CIDE family [83, 84].
The FSP27 was previously reported to be a lipid droplet-associated protein [84-86], which is
expressed in white adipose tissue (WAT) [85, 86] or in steatotic liver [72]. Moreover, as previous
described, results of this group showed that Fsp27/CIDEC expression was induced in fasting
liver.
The previous findings prompted us to further investigate the mechanism by which Fsp27/CIDEC
is mediating fasting adaptation and regulated by FAO rate in liver. Towards this end, we use an
in vitro model – the assays were carried out in a human liver carcinoma cell line, HepG2 –
where the fasting condition was mimed by serum-starvation of cultured cells.
It was described that Fsp27 expression in hepatocytes significantly decreases the activity of
mitochondrial β-oxidation and reduces triglyceride turnover [72, 84]. The present study showed
that pharmacological inhibition of FAO (etomoxir, Figure 4.1A) in HepG2 cells induces CIDEC
expression. This data suggests a direct link between impaired FAO and CIDEC induced
expression. However, the mechanism mediating this link is not so clear.
Previously it was suggested that an impairment in FAO leads to triglyceride accumulation which
stimulates lipid droplet-associated proteins such as FSP27/CIDEC and also that this TG
accumulation mediated by Fsp27 gene is specifically regulated by PPAR and its specific
ligands [72, 75]. This data prompted us to speculate that the missing link between induction of
CIDEC and FAO inhibition could be mediated by PPAR. However, analysis of CIDEC mRNA
levels in HepG2 cells treated simultaneously with etomoxir and GW9662, an antagonist of
PPAR (Figure 4.1B) didn’t show any effect in CIDEC expression. This data suggests that
inhibition of FAO could alter gene expression through a different mechanism from that of
increased levels of free fatty acids, which are natural ligands of the PPARs.
Regarding, to the induction of Fsp27 during fasting, the data present in this study suggests that
PPARα, a master regulator of fasting liver [65], is not one of the signals triggering this induction
(Figure 4.2). In accordance with these findings, a previous report showed that Fsp27 promoter
is not activated by ligands of PPARα nor PPAR δ [72]. Also, these results are corroborated by a
preceding suggesting that induction of CIDEC was not mediated by PPARα [94].
Interestingly, CIDEC gene expression was up regulated by forskolin a cAMP agonist in HepG2
cells (Figure 4.3A). Consistently, mouse Fsp27 promoter was induced approximately 30-fold by
CREB. Indeed, the present study demonstrates two function CRE binding sites that directly
interact with CREB in vitro. These results suggest that Fsp27/CIDEC could be direct target of
hepatic CREB. To demonstrate additional evidence for this mechanism and to prove the
44
specificity of forskolin treatment we showed that impairment of PKA (by its inhibitor H89)
resulted in the decrease of CIDEC mRNA levels, suggesting that indeed forskolin is inducing
CREB activity and in turn CREB is activating CIDEC. Furthermore, the effect of KCREB
expression vector (Figure 4.4B) confirms that Fsp27/CIDEC is a direct target of CREB in HepG2
cells.
CIDEC mRNA levels were increased in HepG2 cells when SIRT1 activity was impaired by
siRNA. Recently, it has been suggested a switch from early gene activation via CRTC2 to late
activation of FOXO1 being critical for transcriptional regulation in fasting [13]. CRTC2 is a
coactivator responsible for CREB-mediated transcriptional activation of the hepatic
gluconeogenic program [11, 12]. However, it has also been proposed that the transcriptional
response to fasting is only transiently dependent on CRTC2 with the demonstration that it is
deacetylated by the NAD+ dependent enzyme SIRT1 which allows its ubiquitination and
degradation in proteasome after long term fasting, suppressing CREB-CRTC2 signaling [95].
These data, together with the previous results demonstrating that Fsp27 is induced in early
fasting, fit with the model suggested by Liu et al. [13] in which CREB mediated expression is
attenuated in long fasting periods.
Also, SIRT1 regulation seems to be the missing link that could explain the induced expression
of CIDEC when FAO is impaired (Figure 4.1). Recently SIRT1 has been suggested has a link
between protein acetylation and metabolism [17]. Vilà-Brau et al., [59] suggested a feed-forward
mechanism in which the oxidative metabolism (FAO and ketogenesis), through NADH and ATP
supply, would be expected to pull forward an anabolic process like gluconeogenesis, that would
in turn generate NAD+ and stimulate SIRT1 (a NAD
+ consuming enzyme) activity. Arguing in
favor of this hypothesis, and validating our model, it was described that inhibition of
mitochondrial fatty acid oxidation with etomoxir, the CPT1 inhibitor used in the experiments
present in this study, decreases the NAD+/NADH ratio [96]. Therefore, once Fsp27/CIDEC is a
gene that is repressed by SIRT1 (Figure 4.6) will be up regulated by an impaired FAO.
Our results argue for a model of temporal regulation of Fsp27/CIDEC expression in response to
fasting adaptation and FAO rate (Figure 5.1).
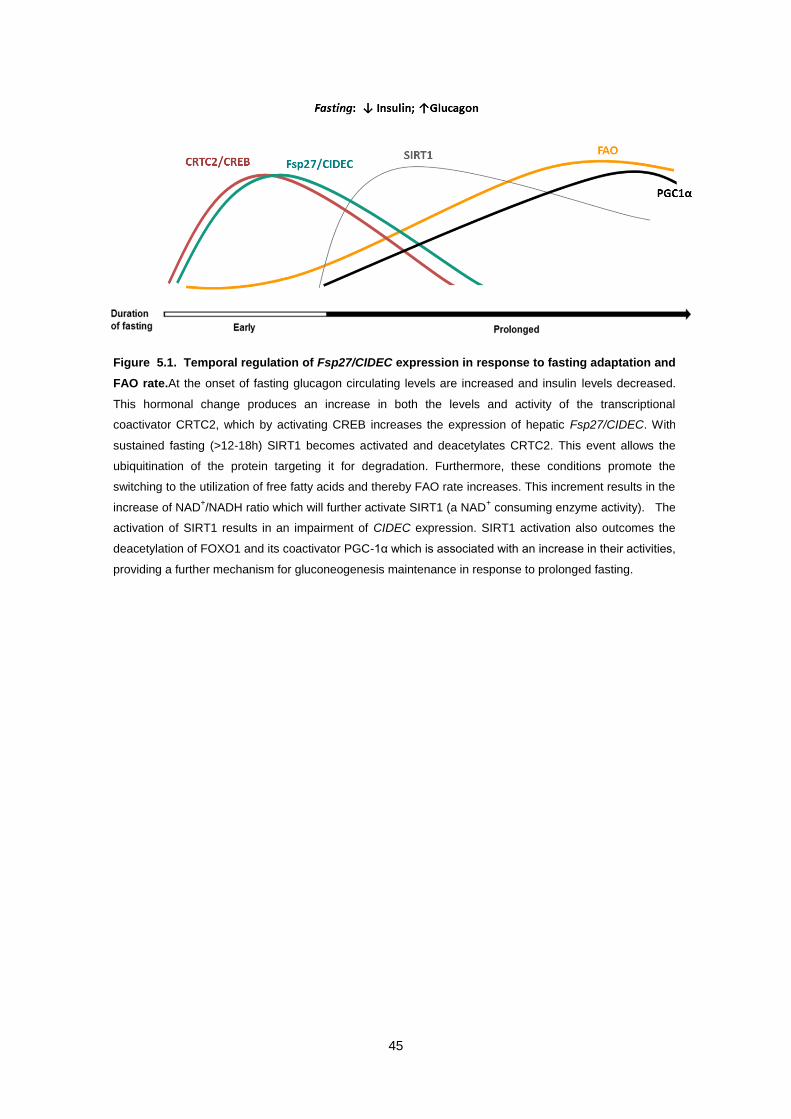
45
Figure 5.1. Temporal regulation of Fsp27/CIDEC expression in response to fasting adaptation and
FAO rate.At the onset of fasting glucagon circulating levels are increased and insulin levels decreased.
This hormonal change produces an increase in both the levels and activity of the transcriptional
coactivator CRTC2, which by activating CREB increases the expression of hepatic Fsp27/CIDEC. With
sustained fasting (>12-18h) SIRT1 becomes activated and deacetylates CRTC2. This event allows the
ubiquitination of the protein targeting it for degradation. Furthermore, these conditions promote the
switching to the utilization of free fatty acids and thereby FAO rate increases. This increment results in the
increase of NAD+/NADH ratio which will further activate SIRT1 (a NAD
+ consuming enzyme activity). The
activation of SIRT1 results in an impairment of CIDEC expression. SIRT1 activation also outcomes the
deacetylation of FOXO1 and its coactivator PGC-1α which is associated with an increase in their activities,
providing a further mechanism for gluconeogenesis maintenance in response to prolonged fasting.
46
Effect of fasting and amino acid deprivation in PGC-1α expression.
Survival during prolonged food deprivation depends on the activation of hepatic
gluconeogenesis which is mediated by the cAMP response element binding protein (CREB). As
discussed above, in the late fasting state, the maintenance of gluconeogenic response through
prolonged food deprivation conditions is mediated by FOXO1 and PGC-1α [13]. Accordingly,
Figure 4.7A shows that PGC-1α expression is increased in livers of mice subjected to prolonged
fasting conditions. Interestingly this increase is even higher (15-fold) when the same animals
are previously treated with a leucin deprived diet.
Also, these conditions induced Foxa2 mRNA levels (Figure 4.7B). It was previously suggested
that Foxa2 is required for activation of hepatic gluconeogenic program during fasting [42] by
cAMP and glucocorticoids once it allows chromatin access for hormone-dependent transcription
factors that are activated during the fasting response [42, 97, 98]. This notion is based on the
aforementioned proximity of Foxa2 binding sites to CREs and GREs in cis-regulatory elements
of several gluconeogenic genes [99, 100]. Also, it has been reported that Foxa2 increases the
efficacy of CREB binding to Pepck promoter [42].
Having this into account, and a previous report showing that Foxa2 expression was induced
upon amino acid restriction [45] we speculated that the induction of Pgc-1α expression
observed in both fasting and amino acid deprived conditions would be mediated by Foxa2
activity, since under these two dietary manipulations there were be more Foxa2 available which
would increase and facilitate the binding of CREB to the promoter.
The transient assays performed in HepG2 cells confirmed that both Pepck and Pgc-1α
promoters are indeed direct targets of CREB [9] but, when co-transfected along with FOXA2 the
induction was not significant (Figure 4.8) suggesting that Foxa2 is not facilitating the binding of
CREB to the promoters. These data did not confirm the previous findings described by Zhang et
al., [42] or other reports that identified a Foxa binding site in Pepck promoter [99, 101].
Contrarily, corroborating our results, Wolfrum et al., [43] reported that Foxa2 did not bind to the
conserve Hnf3/Foxa site in the Pepck promoter, suggesting that Pepck promoter is not a target
of Foxa2 in fasting conditions.
Our results of induction of Pgc-1α and Foxa2 gene expression in fasting and amino-acid
deprived conditions are supported by other findings implicating Pgc-1α and Foxa2 in the
adaptation of gluconeogenic genes during food deprivation conditions [15, 42, 45]. Still, the
transient assays in HepG2 cells suggested that Foxa2 is not mediating the CREB targeting to
the Pgc-1α neither the Pepck promoters. These results suggest that this is not the mechanism
by which Foxa2 is regulating the activation of the hepatic transcriptional program of
gluconeogenesis during adaptation to limit food supply.
47
6. CONCLUSIONS
To conclude, in the first part of this study we showed that a lipid droplet-associated protein,
Fsp27/CIDEC, was expressed in HepG2 cells in a physiological situation like fasting and that
this induction was not mediated by PPARα.
This study provides significant mechanistic advance for the regulation of Fsp27/CIDEC in
adaptation to fasting response in HepG2 cells, since we demonstrated that Fsp27/CIDEC is a
CREB target gene (positively regulated by the PKA-CREB-CRTC2 pathway) that could be up-
regulated when FAO is impaired and that the fluctuations in SIRT1 activity, in response to
nutrient availability, mediate this mechanism.
In the second part of this study, we showed that Pgc-1α and Foxa2 expression are increased in
livers of mice subjected to prolonged fasting and previously treated with a leucin deprived diet.
Further we show that under our experimental conditions the activation of the hepatic
transcriptional program of gluconeogenesis during adaptation to limit food supply (fasting and
amino acid deprivation) appears not to be regulated by the recruitment of CREB by Foxa2 for
the Pgc-1 or the Pepck promoters.

48

49
7. REFERENCES
[1] G. van den Berghe, "The role of the liver in metabolic homeostasis: implications for inborn errors of metabolism," J Inherit Metab Dis, vol. 14, pp. 407-20, 1991.
[2] L. Storlien, N. D. Oakes, and D. E. Kelley, "Metabolic flexibility," Proc Nutr Soc, vol. 63, pp. 363-8, May 2004.
[3] S. Eaton, K. Bartlett, and M. Pourfarzam, "Mammalian mitochondrial beta-oxidation," Biochem J, vol. 320 ( Pt 2), pp. 345-57, Dec 1996.
[4] S. J. Pilkis, M. R. el-Maghrabi, and T. H. Claus, "Hormonal regulation of hepatic gluconeogenesis and glycolysis," Annu Rev Biochem, vol. 57, pp. 755-83, 1988.
[5] D. Nelson and M. Cox, "Lehninger, Principles of Biochemistry," in Lehninger, Principles of Biochemistry, Freeman, Ed., 4th Edition ed: Sara Tenney, 2005, pp. 650-652.
[6] D. Nelson and M. Cox, "Lehninger, Principles of Biochemistry," in Lehninger, Principles of Biochemistry, Freeman, Ed., 4th Edition ed: Sara Tenney, 2005, pp. 902-910.
[7] P. Puigserver and B. M. Spiegelman, "Peroxisome proliferator-activated receptor-gamma coactivator 1 alpha (PGC-1 alpha): transcriptional coactivator and metabolic regulator," Endocr Rev, vol. 24, pp. 78-90, Feb 2003.
[8] D. Nelson and M. Cox, "Lehninger, Priciples of Biochemistry," in Lehninger, Priciples of Biochemistry, Freeman, Ed., 4th Edition ed: Sara Tenney, 2005, pp. 634-647.
[9] S. Herzig, F. Long, U. S. Jhala, S. Hedrick, R. Quinn, A. Bauer, et al., "CREB regulates hepatic gluconeogenesis through the coactivator PGC-1," Nature, vol. 413, pp. 179-83, Sep 2001.
[10] J. Y. Altarejos and M. Montminy, "CREB and the CRTC co-activators: sensors for hormonal and metabolic signals," Nat Rev Mol Cell Biol, vol. 12, pp. 141-51, Mar 2011.
[11] M. D. Conkright, G. Canettieri, R. Screaton, E. Guzman, L. Miraglia, J. B. Hogenesch, et al., "TORCs: transducers of regulated CREB activity," Mol Cell, vol. 12, pp. 413-23, Aug 2003.
[12] S. H. Koo, L. Flechner, L. Qi, X. Zhang, R. A. Screaton, S. Jeffries, et al., "The CREB coactivator TORC2 is a key regulator of fasting glucose metabolism," Nature, vol. 437, pp. 1109-11, Oct 2005.
[13] Y. Liu, R. Dentin, D. Chen, S. Hedrick, K. Ravnskjaer, S. Schenk, et al., "A fasting inducible switch modulates gluconeogenesis via activator/coactivator exchange," Nature, vol. 456, pp. 269-73, Nov 2008.
[14] R. Dentin, Y. Liu, S. H. Koo, S. Hedrick, T. Vargas, J. Heredia, et al., "Insulin modulates gluconeogenesis by inhibition of the coactivator TORC2," Nature, vol. 449, pp. 366-9, Sep 2007.
[15] J. E. Dominy, Y. Lee, Z. Gerhart-Hines, and P. Puigserver, "Nutrient-dependent regulation of PGC-1alpha's acetylation state and metabolic function through the enzymatic activities of Sirt1/GCN5," Biochim Biophys Acta, vol. 1804, pp. 1676-83, Aug 2010.
[16] J. T. Rodgers, C. Lerin, W. Haas, S. P. Gygi, B. M. Spiegelman, and P. Puigserver, "Nutrient control of glucose homeostasis through a complex of PGC-1alpha and SIRT1," Nature, vol. 434, pp. 113-8, Mar 2005.
[17] L. Guarente, "The logic linking protein acetylation and metabolism," Cell Metab, vol. 14, pp. 151-3, Aug 2011.
[18] M. Kaeberlein, M. McVey, and L. Guarente, "The SIR2/3/4 complex and SIR2 alone promote longevity in Saccharomyces cerevisiae by two different mechanisms," Genes Dev, vol. 13, pp. 2570-80, Oct 1999.
[19] H. A. Tissenbaum and L. Guarente, "Increased dosage of a sir-2 gene extends lifespan in Caenorhabditis elegans," Nature, vol. 410, pp. 227-30, Mar 2001.
[20] C. Cantó, L. Q. Jiang, A. S. Deshmukh, C. Mataki, A. Coste, M. Lagouge, et al., "Interdependence of AMPK and SIRT1 for metabolic adaptation to fasting and exercise in skeletal muscle," Cell Metab, vol. 11, pp. 213-9, Mar 2010.
[21] H. Vaziri, S. K. Dessain, E. Ng Eaton, S. I. Imai, R. A. Frye, T. K. Pandita, et al., "hSIR2(SIRT1) functions as an NAD-dependent p53 deacetylase," Cell, vol. 107, pp. 149-59, Oct 2001.
[22] A. Brunet, L. B. Sweeney, J. F. Sturgill, K. F. Chua, P. L. Greer, Y. Lin, et al., "Stress-dependent regulation of FOXO transcription factors by the SIRT1 deacetylase," Science, vol. 303, pp. 2011-5, Mar 2004.

50
[23] J. A. Baur, "Biochemical effects of SIRT1 activators," Biochim Biophys Acta, vol. 1804, pp. 1626-34, Aug 2010.
[24] S. Imai and L. Guarente, "Ten years of NAD-dependent SIR2 family deacetylases: implications for metabolic diseases," Trends Pharmacol Sci, vol. 31, pp. 212-20, May 2010.
[25] J. Luo, A. Y. Nikolaev, S. Imai, D. Chen, F. Su, A. Shiloh, et al., "Negative control of p53 by Sir2alpha promotes cell survival under stress," Cell, vol. 107, pp. 137-48, Oct 2001.
[26] M. C. Motta, N. Divecha, M. Lemieux, C. Kamel, D. Chen, W. Gu, et al., "Mammalian SIRT1 represses forkhead transcription factors," Cell, vol. 116, pp. 551-63, Feb 2004.
[27] P. Puigserver, Z. Wu, C. W. Park, R. Graves, M. Wright, and B. M. Spiegelman, "A cold-inducible coactivator of nuclear receptors linked to adaptive thermogenesis," Cell, vol. 92, pp. 829-39, Mar 1998.
[28] R. B. Vega, J. M. Huss, and D. P. Kelly, "The coactivator PGC-1 cooperates with peroxisome proliferator-activated receptor alpha in transcriptional control of nuclear genes encoding mitochondrial fatty acid oxidation enzymes," Mol Cell Biol, vol. 20, pp. 1868-76, Mar 2000.
[29] J. C. Yoon, P. Puigserver, G. Chen, J. Donovan, Z. Wu, J. Rhee, et al., "Control of hepatic gluconeogenesis through the transcriptional coactivator PGC-1," Nature, vol. 413, pp. 131-8, Sep 2001.
[30] P. Puigserver, G. Adelmant, Z. Wu, M. Fan, J. Xu, B. O'Malley, et al., "Activation of PPARgamma coactivator-1 through transcription factor docking," Science, vol. 286, pp. 1368-71, Nov 1999.
[31] T. C. Leone, J. J. Lehman, B. N. Finck, P. J. Schaeffer, A. R. Wende, S. Boudina, et al., "PGC-1alpha deficiency causes multi-system energy metabolic derangements: muscle dysfunction, abnormal weight control and hepatic steatosis," PLoS Biol, vol. 3, p. e101, Apr 2005.
[32] S. C. Burgess, T. C. Leone, A. R. Wende, M. A. Croce, Z. Chen, A. D. Sherry, et al., "Diminished hepatic gluconeogenesis via defects in tricarboxylic acid cycle flux in peroxisome proliferator-activated receptor gamma coactivator-1alpha (PGC-1alpha)-deficient mice," J Biol Chem, vol. 281, pp. 19000-8, Jul 2006.
[33] P. Puigserver, "Tissue-specific regulation of metabolic pathways through the transcriptional coactivator PGC1-alpha," Int J Obes (Lond), vol. 29 Suppl 1, pp. S5-9, Mar 2005.
[34] P. Puigserver, J. Rhee, J. Donovan, C. J. Walkey, J. C. Yoon, F. Oriente, et al., "Insulin-regulated hepatic gluconeogenesis through FOXO1-PGC-1alpha interaction," Nature,
vol. 423, pp. 550-5, May 2003. [35] J. Le Lay, G. Tuteja, P. White, R. Dhir, R. Ahima, and K. H. Kaestner, "CRTC2
(TORC2) contributes to the transcriptional response to fasting in the liver but is not required for the maintenance of glucose homeostasis," Cell Metab, vol. 10, pp. 55-62, Jul 2009.
[36] M. Matsumoto, A. Pocai, L. Rossetti, R. A. Depinho, and D. Accili, "Impaired regulation of hepatic glucose production in mice lacking the forkhead transcription factor Foxo1 in liver," Cell Metab, vol. 6, pp. 208-16, Sep 2007.
[37] A. P. Monaghan, K. H. Kaestner, E. Grau, and G. Schütz, "Postimplantation expression patterns indicate a role for the mouse forkhead/HNF-3 alpha, beta and gamma genes in determination of the definitive endoderm, chordamesoderm and neuroectoderm," Development, vol. 119, pp. 567-78, Nov 1993.
[38] K. H. Kaestner, "The hepatocyte nuclear factor 3 (HNF3 or FOXA) family in metabolism," Trends Endocrinol Metab, vol. 11, pp. 281-5, Sep 2000.
[39] J. R. Friedman and K. H. Kaestner, "The Foxa family of transcription factors in development and metabolism," Cell Mol Life Sci, vol. 63, pp. 2317-28, Oct 2006.
[40] W. Shen, L. M. Scearce, J. E. Brestelli, N. J. Sund, and K. H. Kaestner, "Foxa3 (hepatocyte nuclear factor 3gamma ) is required for the regulation of hepatic GLUT2 expression and the maintenance of glucose homeostasis during a prolonged fast," J Biol Chem, vol. 276, pp. 42812-7, Nov 2001.
[41] K. H. Kaestner, J. Katz, Y. Liu, D. J. Drucker, and G. Schütz, "Inactivation of the winged helix transcription factor HNF3alpha affects glucose homeostasis and islet glucagon gene expression in vivo," Genes Dev, vol. 13, pp. 495-504, Feb 1999.
51
[42] L. Zhang, N. E. Rubins, R. S. Ahima, L. E. Greenbaum, and K. H. Kaestner, "Foxa2 integrates the transcriptional response of the hepatocyte to fasting," Cell Metab, vol. 2, pp. 141-8, Aug 2005.
[43] C. Wolfrum, E. Asilmaz, E. Luca, J. M. Friedman, and M. Stoffel, "Foxa2 regulates lipid metabolism and ketogenesis in the liver during fasting and in diabetes," Nature, vol. 432, pp. 1027-32, Dec 2004.
[44] C. Wolfrum, D. Besser, E. Luca, and M. Stoffel, "Insulin regulates the activity of forkhead transcription factor Hnf-3beta/Foxa-2 by Akt-mediated phosphorylation and nuclear/cytosolic localization," Proc Natl Acad Sci U S A, vol. 100, pp. 11624-9, Sep 2003.
[45] N. Su, M. M. Thiaville, K. Awad, A. Gjymishka, J. O. Brant, T. P. Yang, et al., "Protein or amino acid deprivation differentially regulates the hepatic forkhead box protein A (FOXA) genes through an activating transcription factor-4-independent pathway," Hepatology, vol. 50, pp. 282-90, Jul 2009.
[46] T. Gulick, S. Cresci, T. Caira, D. D. Moore, and D. P. Kelly, "The peroxisome proliferator-activated receptor regulates mitochondrial fatty acid oxidative enzyme gene expression," Proc Natl Acad Sci U S A, vol. 91, pp. 11012-6, Nov 1994.
[47] J. R. Neely and H. E. Morgan, "Relationship between carbohydrate and lipid metabolism and the energy balance of heart muscle," Annu Rev Physiol, vol. 36, pp. 413-59, 1974.
[48] P. Felig and J. Wahren, "Fuel homeostasis in exercise," N Engl J Med, vol. 293, pp. 1078-84, Nov 1975.
[49] R. J. Wanders, J. P. Ruiter, L. IJLst, H. R. Waterham, and S. M. Houten, "The enzymology of mitochondrial fatty acid beta-oxidation and its application to follow-up analysis of positive neonatal screening results," J Inherit Metab Dis, vol. 33, pp. 479-94, Oct 2010.
[50] J. Kerner and C. Hoppel, "Fatty acid import into mitochondria," Biochim Biophys Acta, vol. 1486, pp. 1-17, Jun 2000.
[51] J. D. McGarry and D. W. Foster, "Regulation of hepatic fatty acid oxidation and ketone body production," Annu Rev Biochem, vol. 49, pp. 395-420, 1980.
[52] D. H. Williamson, "Mechanisms for the regulation of ketogenesis," Proc Nutr Soc, vol. 40, pp. 93-8, Jan 1981.
[53] O. E. Owen, A. P. Morgan, H. G. Kemp, J. M. Sullivan, M. G. Herrera, and G. F. Cahill, "Brain metabolism during fasting," J Clin Invest, vol. 46, pp. 1589-95, Oct 1967.
[54] M. R. Soeters, H. P. Sauerwein, L. Faas, M. Smeenge, M. Duran, R. J. Wanders, et al., "Effects of insulin on ketogenesis following fasting in lean and obese men," Obesity (Silver Spring), vol. 17, pp. 1326-31, Jul 2009.
[55] L. Stryer, B. Jeremy, and J. Tymoczo, "Biochemistry," in Biochemistry, Freeman, Ed., 5th Edition ed, 2005, p. 913.
[56] A. Nadal, P. F. Marrero, and D. Haro, "Down-regulation of the mitochondrial 3-hydroxy-3-methylglutaryl-CoA synthase gene by insulin: the role of the forkhead transcription factor FKHRL1," Biochem J, vol. 366, pp. 289-97, Aug 2002.
[57] F. G. Hegardt, "Transcriptional regulation of mitochondrial HMG-CoA synthase in the control of ketogenesis," Biochimie, vol. 80, pp. 803-6, Oct 1998.
[58] D. Serra, N. Casals, G. Asins, T. Royo, C. J. Ciudad, and F. G. Hegardt, "Regulation of mitochondrial 3-hydroxy-3-methylglutaryl-coenzyme A synthase protein by starvation, fat feeding, and diabetes," Arch Biochem Biophys, vol. 307, pp. 40-5, Nov 1993.
[59] A. Vilà-Brau, A. L. De Sousa-Coelho, C. Mayordomo, D. Haro, and P. F. Marrero, "Human HMGCS2 regulates mitochondrial fatty acid oxidation and FGF21 expression in HepG2 cell line," J Biol Chem, vol. 286, pp. 20423-30, Jun 2011.
[60] M. Müller and S. Kersten, "Nutrigenomics: goals and strategies," Nat Rev Genet, vol. 4, pp. 315-22, Apr 2003.
[61] Z. Zhang, P. E. Burch, A. J. Cooney, R. B. Lanz, F. A. Pereira, J. Wu, et al., "Genomic analysis of the nuclear receptor family: new insights into structure, regulation, and evolution from the rat genome," Genome Res, vol. 14, pp. 580-90, Apr 2004.
[62] B. Desvergne, A. IJpenberg, P. R. Devchand, and W. Wahli, "The peroxisome proliferator-activated receptors at the cross-road of diet and hormonal signalling," J Steroid Biochem Mol Biol, vol. 65, pp. 65-74, Apr 1998.
[63] H. Gronemeyer and V. Laudet, "Transcription factors 3: nuclear receptors," Protein Profile, vol. 2, pp. 1173-308, 1995.
52
[64] S. Yu, K. Matsusue, P. Kashireddy, W. Q. Cao, V. Yeldandi, A. V. Yeldandi, et al., "Adipocyte-specific gene expression and adipogenic steatosis in the mouse liver due to peroxisome proliferator-activated receptor gamma1 (PPARgamma1) overexpression," J Biol Chem, vol. 278, pp. 498-505, Jan 2003.
[65] M. Bünger, G. J. Hooiveld, S. Kersten, and M. Müller, "Exploration of PPAR functions by microarray technology--a paradigm for nutrigenomics," Biochim Biophys Acta, vol. 1771, pp. 1046-64, Aug 2007.
[66] R. K. Semple, V. K. Chatterjee, and S. O'Rahilly, "PPAR gamma and human metabolic disease," J Clin Invest, vol. 116, pp. 581-9, Mar 2006.
[67] W. Wahli, O. Braissant, and B. Desvergne, "Peroxisome proliferator activated receptors: transcriptional regulators of adipogenesis, lipid metabolism and more..." Chem Biol, vol. 2, pp. 261-6, May 1995.
[68] S. Mandard, M. Müller, and S. Kersten, "Peroxisome proliferator-activated receptor alpha target genes," Cell Mol Life Sci, vol. 61, pp. 393-416, Feb 2004.
[69] C. Dreyer, G. Krey, H. Keller, F. Givel, G. Helftenbein, and W. Wahli, "Control of the peroxisomal beta-oxidation pathway by a novel family of nuclear hormone receptors," Cell, vol. 68, pp. 879-87, Mar 1992.
[70] P. Tontonoz, E. Hu, and B. M. Spiegelman, "Stimulation of adipogenesis in fibroblasts by PPAR gamma 2, a lipid-activated transcription factor," Cell, vol. 79, pp. 1147-56, Dec 1994.
[71] E. D. Rosen, C. H. Hsu, X. Wang, S. Sakai, M. W. Freeman, F. J. Gonzalez, et al., "C/EBPalpha induces adipogenesis through PPARgamma: a unified pathway," Genes Dev, vol. 16, pp. 22-6, Jan 2002.
[72] K. Matsusue, T. Kusakabe, T. Noguchi, S. Takiguchi, T. Suzuki, S. Yamano, et al., "Hepatic steatosis in leptin-deficient mice is promoted by the PPARgamma target gene Fsp27," Cell Metab, vol. 7, pp. 302-11, Apr 2008.
[73] M. Lehrke and M. A. Lazar, "The many faces of PPARgamma," Cell, vol. 123, pp. 993-9, Dec 2005.
[74] K. Schoonjans, B. Staels, and J. Auwerx, "Role of the peroxisome proliferator-activated receptor (PPAR) in mediating the effects of fibrates and fatty acids on gene expression," J Lipid Res, vol. 37, pp. 907-25, May 1996.
[75] Y. J. Kim, S. Y. Cho, C. H. Yun, Y. S. Moon, T. R. Lee, and S. H. Kim, "Transcriptional activation of Cidec by PPARgamma2 in adipocyte," Biochem Biophys Res Commun, vol. 377, pp. 297-302, Dec 2008.
[76] A. Vidal-Puig, M. Jimenez-Liñan, B. B. Lowell, A. Hamann, E. Hu, B. Spiegelman, et al., "Regulation of PPAR gamma gene expression by nutrition and obesity in rodents," J Clin Invest, vol. 97, pp. 2553-61, Jun 1996.
[77] K. Schoonjans, J. Peinado-Onsurbe, A. M. Lefebvre, R. A. Heyman, M. Briggs, S. Deeb, et al., "PPARalpha and PPARgamma activators direct a distinct tissue-specific transcriptional response via a PPRE in the lipoprotein lipase gene," EMBO J, vol. 15, pp. 5336-48, Oct 1996.
[78] K. Motojima, P. Passilly, J. M. Peters, F. J. Gonzalez, and N. Latruffe, "Expression of putative fatty acid transporter genes are regulated by peroxisome proliferator-activated receptor alpha and gamma activators in a tissue- and inducer-specific manner," J Biol Chem, vol. 273, pp. 16710-4, Jul 1998.
[79] H. P. Guan, Y. Li, M. V. Jensen, C. B. Newgard, C. M. Steppan, and M. A. Lazar, "A futile metabolic cycle activated in adipocytes by antidiabetic agents," Nat Med, vol. 8, pp. 1122-8, Oct 2002.
[80] B. I. Frohnert, T. Y. Hui, and D. A. Bernlohr, "Identification of a functional peroxisome proliferator-responsive element in the murine fatty acid transport protein gene," J Biol Chem, vol. 274, pp. 3970-7, Feb 1999.
[81] L. Nagy, P. Tontonoz, J. G. Alvarez, H. Chen, and R. M. Evans, "Oxidized LDL regulates macrophage gene expression through ligand activation of PPARgamma," Cell, vol. 93, pp. 229-40, Apr 1998.
[82] N. Inohara, T. Koseki, S. Chen, X. Wu, and G. Núñez, "CIDE, a novel family of cell death activators with homology to the 45 kDa subunit of the DNA fragmentation factor," EMBO J, vol. 17, pp. 2526-33, May 1998.
[83] L. Liang, M. Zhao, Z. Xu, K. K. Yokoyama, and T. Li, "Molecular cloning and characterization of CIDE-3, a novel member of the cell-death-inducing DNA-
53
fragmentation-factor (DFF45)-like effector family," Biochem J, vol. 370, pp. 195-203, Feb 2003.
[84] K. Matsusue, "A physiological role for fat specific protein 27/cell death-inducing DFF45-like effector C in adipose and liver," Biol Pharm Bull, vol. 33, pp. 346-50, 2010.
[85] N. Nishino, Y. Tamori, S. Tateya, T. Kawaguchi, T. Shibakusa, W. Mizunoya, et al., "FSP27 contributes to efficient energy storage in murine white adipocytes by promoting the formation of unilocular lipid droplets," J Clin Invest, vol. 118, pp. 2808-21, Aug 2008.
[86] J. Karbowska and Z. Kochan, "Intermittent fasting up-regulates Fsp27/Cidec gene expression in white adipose tissue," Nutrition, vol. 28, pp. 294-9, Mar 2012.
[87] M. S. Kilberg, J. Shan, and N. Su, "ATF4-dependent transcription mediates signaling of amino acid limitation," Trends Endocrinol Metab, vol. 20, pp. 436-43, Nov 2009.
[88] M. S. Kilberg, Y. X. Pan, H. Chen, and V. Leung-Pineda, "Nutritional control of gene expression: how mammalian cells respond to amino acid limitation," Annu Rev Nutr, vol. 25, pp. 59-85, 2005.
[89] "Applied Biosystems StepOne™ and StepOnePlus™ Real-Time PCR Systems; Reagent Guide," A. Biosystems, Ed., ed.
[90] J. Winer, C. K. Jung, I. Shackel, and P. M. Williams, "Development and validation of real-time quantitative reverse transcriptase-polymerase chain reaction for monitoring gene expression in cardiac myocytes in vitro," Anal Biochem, vol. 270, pp. 41-9, May 1999.
[91] P. E. Declercq, J. R. Falck, M. Kuwajima, H. Tyminski, D. W. Foster, and J. D. McGarry, "Characterization of the mitochondrial carnitine palmitoyltransferase enzyme system. I. Use of inhibitors," J Biol Chem, vol. 262, pp. 9812-21, Jul 1987.
[92] P. Tontonoz, E. Hu, J. Devine, E. G. Beale, and B. M. Spiegelman, "PPAR gamma 2 regulates adipose expression of the phosphoenolpyruvate carboxykinase gene," Mol Cell Biol, vol. 15, pp. 351-7, Jan 1995.
[93] D. Patsouris, J. K. Reddy, M. Müller, and S. Kersten, "Peroxisome proliferator-activated receptor alpha mediates the effects of high-fat diet on hepatic gene expression," Endocrinology, vol. 147, pp. 1508-16, Mar 2006.
[94] M. Cherkaoui-Malki, K. Meyer, W. Q. Cao, N. Latruffe, A. V. Yeldandi, M. S. Rao, et al., "Identification of novel peroxisome proliferator-activated receptor alpha (PPARalpha) target genes in mouse liver using cDNA microarray analysis," Gene Expr, vol. 9, pp. 291-304, 2001.
[95] R. Dentin, S. Hedrick, J. Xie, J. Yates, and M. Montminy, "Hepatic glucose sensing via the CREB coactivator CRTC2," Science, vol. 319, pp. 1402-5, Mar 2008.
[96] C. Cantó, Z. Gerhart-Hines, J. N. Feige, M. Lagouge, L. Noriega, J. C. Milne, et al., "AMPK regulates energy expenditure by modulating NAD+ metabolism and SIRT1 activity," Nature, vol. 458, pp. 1056-60, Apr 2009.
[97] L. A. Cirillo, F. R. Lin, I. Cuesta, D. Friedman, M. Jarnik, and K. S. Zaret, "Opening of compacted chromatin by early developmental transcription factors HNF3 (FoxA) and GATA-4," Mol Cell, vol. 9, pp. 279-89, Feb 2002.
[98] R. Gualdi, P. Bossard, M. Zheng, Y. Hamada, J. R. Coleman, and K. S. Zaret, "Hepatic specification of the gut endoderm in vitro: cell signaling and transcriptional control," Genes Dev, vol. 10, pp. 1670-82, Jul 1996.
[99] J. C. Wang, J. M. Stafford, D. K. Scott, C. Sutherland, and D. K. Granner, "The molecular physiology of hepatic nuclear factor 3 in the regulation of gluconeogenesis," J Biol Chem, vol. 275, pp. 14717-21, May 2000.
[100] P. C. Lucas and D. K. Granner, "Hormone response domains in gene transcription," Annu Rev Biochem, vol. 61, pp. 1131-73, 1992.
[101] J. C. Wang, P. E. Strömstedt, R. M. O'Brien, and D. K. Granner, "Hepatic nuclear factor 3 is an accessory factor required for the stimulation of phosphoenolpyruvate carboxykinase gene transcription by glucocorticoids," Mol Endocrinol, vol. 10, pp. 794-800, Jul 1996.

54
55
8. ANNEX
8.1. Vectors
8.1.2. Cloning vectors
pGEM®-T Vector
The pGEM®-T Vector Systems are convenient systems for the cloning of PCR products.
T-overhangs for Easy PCR Cloning: This vector is a linearized vector with a single 3´-terminal
thymidine at both ends. The T-overhangs at the insertion site greatly improve the efficiency of
ligation of PCR products by preventing recircularization of the vector and providing a compatible
overhang for PCR products generated by certain thermostable polymerases.
Blue/White Selection of Recombinantes: T7 and SP6 RNA polymerase promoters flank a
multiple cloning region within the α-peptide coding region of the enzyme β-galactosidase.
Insertional inactivation of the α-peptide allows identification of recombinants by blue/white
screening on indicator plates (AIX plates: 100mg/L ampicilin, 8mg/L IPTG, and 40mg/L XGal).
Choice of Restriction Sites for Release of Insert: The pGEM®-T vector contains numerous
restriction sites within the multiple cloning region.
8.1.3. Promoter vectors
The Reporter Vectors provide a basis for the quantitative analysis of factors that potentially
regulate mammalian gene expression. The backbone of the Reporter Vectors is designed for
increased expression, and contains a modified coding region for firefly (Photinus pyralis)
luciferase that has been optimized for monitoring transcriptional activity in transfected
eukaryotic cells.
pGL3-Basic Vector The pGL3-Basic Vector (Promega, Ref. E1751) lacks eukaryotic promoter and enhancer
sequences, allowing maximum flexibility in cloning putative regulatory sequences. Expression of
luciferase activity in cells transfected with this plasmid depends on insertion and proper
orientation of a functional promoter upstream from luc+. Potential enhancer elements can also
be inserted upstream of the promoter or in the BamHI or SalI sites downstream of the luc+
gene.

56
pRL-CMV Vector
The pRL Reporter Vectors contain a cDNA (Rluc) encoding Renilla luciferase, which was
originally cloned from the marine organism Renilla reniformis. These vectors intended for use as
an internal control reporter vector and may be used in combination with any experimental
reporter vector to co-transfect mammalian cells. The pRL-CMV Vector (Promega, Ref.E2261)
was used in the transfection assays of this study. This vector contains the CMV enhancer and
immediate/early promoter elements to provide high-level expression of Renilla luciferase in co-
transfected mammalian cells.
8.1.4. Expression vectors
pcDNA3 – Eukaryotic expression empty vector.
pcDNA3-CREB - The pcDNA3-CREB expression plasmid was subcloned from pSVCREB in
pcDNA3 (Invitrogen) with HidIII/ XbaI restriction sites.
pcDNA3-KCREB – The pcDNA3-KCREB expression plasmid was subcloned from pSVKCREB
in pcDNA3 with HidIII/ XbaI restriction sites.
pcDNA3-FOXA2 – The pcDNA3-FOXA2 expression plasmid was subcloned from pSV-FOXA2
in pcDNA3 with HidIII/ BamHI restriction sites.
57
8.2. Primer Design (5’ - 3’)
8.2.1. Cloning
Mouse PGC1- α promoter constructs
Wild type (-2010;-51)
Forward (DH1384) 5’ - ACGCGTTGATCCCAGGGTTGTCTCTC - 3’ (-2010;-1990) Reverse (DH1385) 5’ - CTCGAGCACACAGCACACACTCATGC - 3’ (-71;-51)
Mouse Fsp27 promoter constructs
Wild type (-2054;+1)
Primer Forward (DH1303) 5’ – TTAACGCGTCTGCAACTCATTCTGTAGCCC - 3’ (-2054;-2075) Primer Reverse (DH1304) 5’ – TTACTCGAGGGCAATACCGCGTGGCCAG - 3’ (-27;+1)
8.2.2. Site Directed Mutagenesis
Mutagenic primers introduce specific experimental mutations. The mutagenic oligonucleotide primers must be designed individually according to the desired mutation. The following considerations should be made for designing mutagenic site and selection primers: 1. Both the mutagenic primers must contain the desired mutation and anneal to the same sequence on opposite strands of the plasmid. 2. Primers should be between 25 and 45 bases in length, and the melting temperature (Tm) of the primers should be greater than or equal to 78°C. The following formula is commonly used for estimating the Tm of primers:
Tm = 81.5 + 0.41(%GC) − 675 /N − % mismatch where N is the primer length in base pairs. 3. The desired mutation (deletion or insertion) should be in the middle of the primer with ~10–15 bases of correct sequence on both sides. 4. The primers optimally should have a minimum GC content of 40% and should terminate in one or more C or G bases.
58
5. Primers need not be 5´ phosphorylated but must be purified either by fast polynucleotide liquid chromatography (FPLC) or by polyacrylamide gel electrophoresis (PAGE). Failure to purify the primers results in a significant decrease in mutation efficiency. 6. It is important to keep primer concentration in excess.
CIDEC CREB site (mut1)
Wild type
5’- GCTCTGAGCCACCA TACCTGACTTCAA CATGAAC GTTACTCCTGAC - 3’
Primer Forward (DH1392)
5’ - GCTCTGAGCCACCA TACCTGAgTatcA CATGAAC GTTACTCCTGAC - 3’ (-384;-430)
Primer Reverse (DH1393)
5’ - CATTAGTAAC GTTCATG TgatAcTCAGGTA TGGTGGCTCAGAGC - 3’ (-384;-430)
CIDEC CREB half site (mut2)
Wild type
5’ – GGTGATGTTTGTGCGTCAGCCTCTGGAGGCTCCGGGTGAGAGAGAGGGG - 3’
Primer Forward (DH1394) (-1799;-1848)
5’ – GGTGATGTTTGTGatcgcGCCTCTGGAGGCTCCGGGTGAGAGAGAGGGG - 3’
Primer Reverse (DH1395) (-1799;-1848)
5’ - CCCCTCTCTCTCACCCGGAGCCTCCAGAGGCgcgatCACAAACATCACC - 3’