fsa report6
TRANSCRIPT

8/2/2019 FSA Report6
http://slidepdf.com/reader/full/fsa-report6 1/34
Pakistan
RefinaryLimited

8/2/2019 FSA Report6
http://slidepdf.com/reader/full/fsa-report6 2/34
VISION
The Vision of the Company is
“TO BE THE REFINERY OF FIRST CHOICE FOR ALL STAKEHOLDERS”
MISSIONThe Mission of the Company is
“PRL IS COMMITTED TO REMAINING A LEADER IN THE OIL REFINING
BUSINESS OF PAKISTAN BY PROVIDING VALUE ADDED PRODUCTS
THAT ARE ENVIRONMENTAL FRIENDLY, AND BY PROTECTING THE
INTEREST OF ALL STAKEHOLDERS IN A COMPETITIVE MARKET
THROUGH SUSTAINABLE DEVELOPMENT AND QUALITY HUMAN
RESOURCES”
COMPANY INTRODUCTION
Pakistan Refinery Limited was incorporated in Pakistan as a public limited company in May 1960 and is
quoted on the Karachi and Lahore Stock Exchanges. The Refinery is situated on the coastal belt of
Karachi, Pakistan. PRL is a hydro skimming refinery designed to process various imported and local
crude oil to meet the strategic and domestic fuel requirements of the country. The Refinery has a
capacity of processing 47,000 barrels per day of crude oil into a variety of distilled petroleum products
such as Furnace Oil, High Speed Diesel, Kerosene oil, Jet fuel and Motor gasoline etc.
The Refinery is operating at two locations. Main processing facility is located at Korangi Creek with
supporting crude berthing and storage facility at Keamari. Initially, the design capacity of the Refinery
was to process 1 million tons of crude oil annually, which was subsequently expanded to 2.1 million tons
per annum.
Pakistan Refinery Limited (PRL) since inception has been the principal manufacturer and supplier of
petroleum products to the domestic market and Pakistan defense forces. It continues to serve the energy
needs of the country with professional excellence and high degree of commitment. PRL takes pride in
the edge it enjoys over its competitors in respect of efficiency, lower operating cost, high quality human
resources, reliability and introduction of newer generation technologies.
The operations of the Company are managed by the Refinery Leadership Team which is led by the
Managing Director of the Company and is responsible for ensuring that the policies and strategies as
approved by the Board are implemented whilst maintaining a culture of openness, integrity,
accountability and commitment to the Company’s principles.
History
The foundation stone of refinery was laid by the then Minister for Fuel, Power and Natural Resources in
late 1950s. Within 4 months the silhouette of the Refinery could be seen as it appears today. In addition

8/2/2019 FSA Report6
http://slidepdf.com/reader/full/fsa-report6 3/34
to this construction at Korangi, a Tank Farm at Keamari has been built to facilitate the storage and
transfer the crude oil from Karachi port to the Refinery.
The plant came into operation in October 1962, two months ahead of schedule. The official opening of
the Refinery was commemorated byField Marshal Muhammad Ayub Khan, the then President of
Pakistan on November 14, 1962. The design capacity of the Refinery was 1 million tons of crude oil per
annum, but was increased to 2.1 million tons per annum later.

8/2/2019 FSA Report6
http://slidepdf.com/reader/full/fsa-report6 4/34
ORGANIZATIONAL CHART

8/2/2019 FSA Report6
http://slidepdf.com/reader/full/fsa-report6 5/34

8/2/2019 FSA Report6
http://slidepdf.com/reader/full/fsa-report6 6/34
Company Information & Profile
8/2/2019 FSA Report6
http://slidepdf.com/reader/full/fsa-report6 7/34
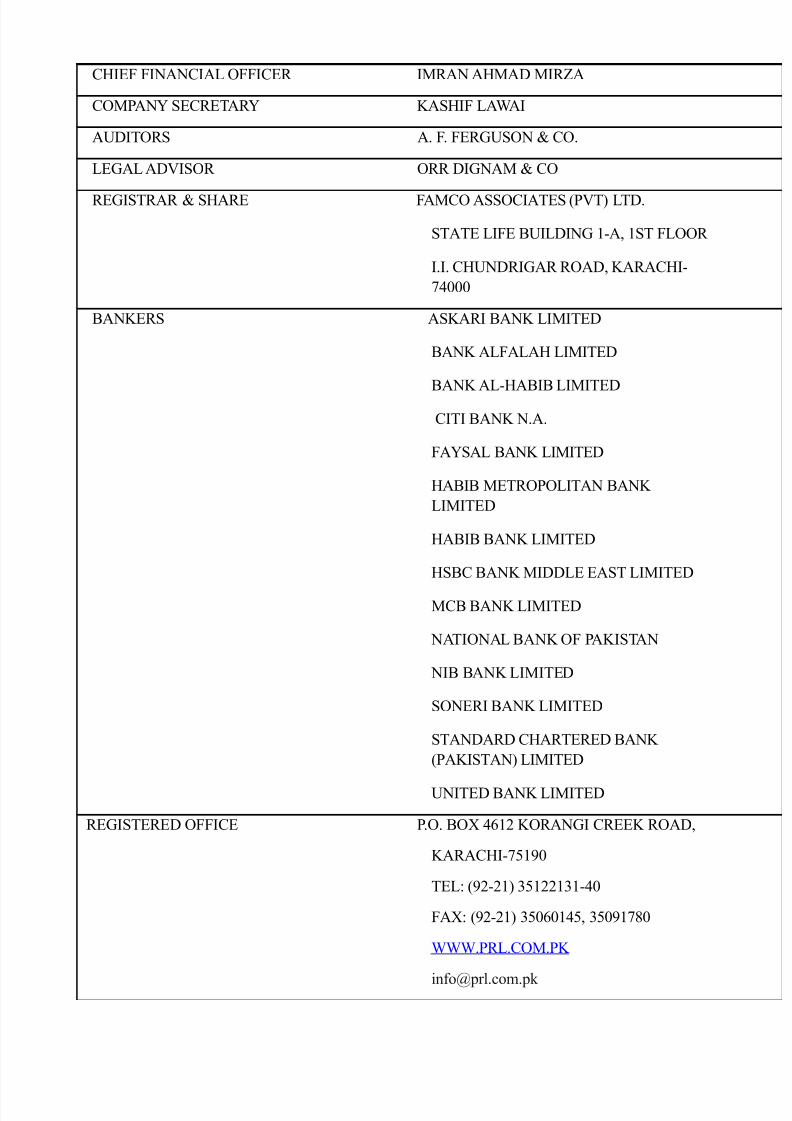
CHIEF FINANCIAL OFFICER IMRAN AHMAD MIRZA
COMPANY SECRETARY KASHIF LAWAI
AUDITORS A. F. FERGUSON & CO.
LEGAL ADVISOR ORR DIGNAM & CO
REGISTRAR & SHARE FAMCO ASSOCIATES (PVT) LTD.
STATE LIFE BUILDING 1-A, 1ST FLOOR
I.I. CHUNDRIGAR ROAD, KARACHI-
74000
BANKERS ASKARI BANK LIMITED
BANK ALFALAH LIMITED
BANK AL-HABIB LIMITED
CITI BANK N.A.
FAYSAL BANK LIMITED
HABIB METROPOLITAN BANK
LIMITED
HABIB BANK LIMITED
HSBC BANK MIDDLE EAST LIMITED
MCB BANK LIMITED
NATIONAL BANK OF PAKISTAN
NIB BANK LIMITED
SONERI BANK LIMITED
STANDARD CHARTERED BANK
(PAKISTAN) LIMITED
UNITED BANK LIMITED
REGISTERED OFFICE P.O. BOX 4612 KORANGI CREEK ROAD,
KARACHI-75190
TEL: (92-21) 35122131-40
FAX: (92-21) 35060145, 35091780
WWW.PRL.COM.PK

8/2/2019 FSA Report6
http://slidepdf.com/reader/full/fsa-report6 8/34
BOARD OF DIRECTORSMr. Farooq Rahmatullah Chairman
Mr. Aftab Husain Managing Director &CEO
Mr. Chang Sern Ee Director
Mr. Jehangir Ali Shah DirectorMr. Khawaja Nimr Majeed Director
Mr. Mohammad Zubair Director
Mr. Muqtadar A. Quraishi Director
Mr. Rafi Haroon Basheer Director
Mr. Sabar Hussain Director
Mr. Saleem Butt Director
Mr. Sarim Sheikh Director
Refinery Leadership Team
Mr. Ijaz Ali Khan Managing Director & CEOMr. Aftab Husain Deputy Managing Director Mr. Kashif Lawai Company SecretaryMr. Imran Ahmad Mirza Chief Financial Officer Mr. Khalid Junejo General Manager Human ResourceMr. Naman Shah General Manager Technology & InspectionMr. Muhammad Azhar General Manager OperationsMr. Muhammad Ali Mirza General Manager Supply & Oil
OpertationsMr. Asad Hasan Senior Manager ProjectsMr. Mohammad Khalid Senior Manager MaintenanceMr. Shehrzad Aminullah Chief Internal Auditor
8/2/2019 FSA Report6
http://slidepdf.com/reader/full/fsa-report6 9/34
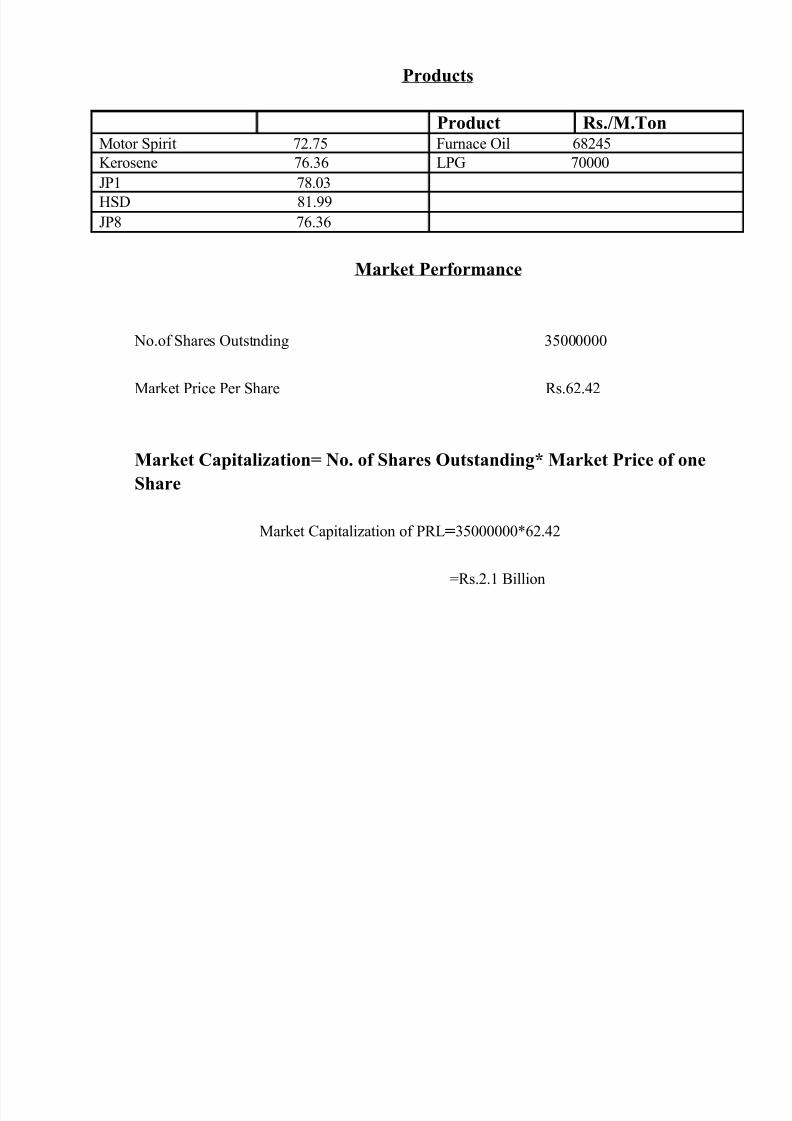
Products
Product Rs./M.TonMotor Spirit 72.75 Furnace Oil 68245
Kerosene 76.36 LPG 70000
JP1 78.03
HSD 81.99
JP8 76.36
Market Performance
No.of Shares Outstnding 35000000
Market Price Per Share Rs.62.42
Market Capitalization= No. of Shares Outstanding* Market Price of one
Share
Market Capitalization of PRL=35000000*62.42
=Rs.2.1 Billion

8/2/2019 FSA Report6
http://slidepdf.com/reader/full/fsa-report6 10/34
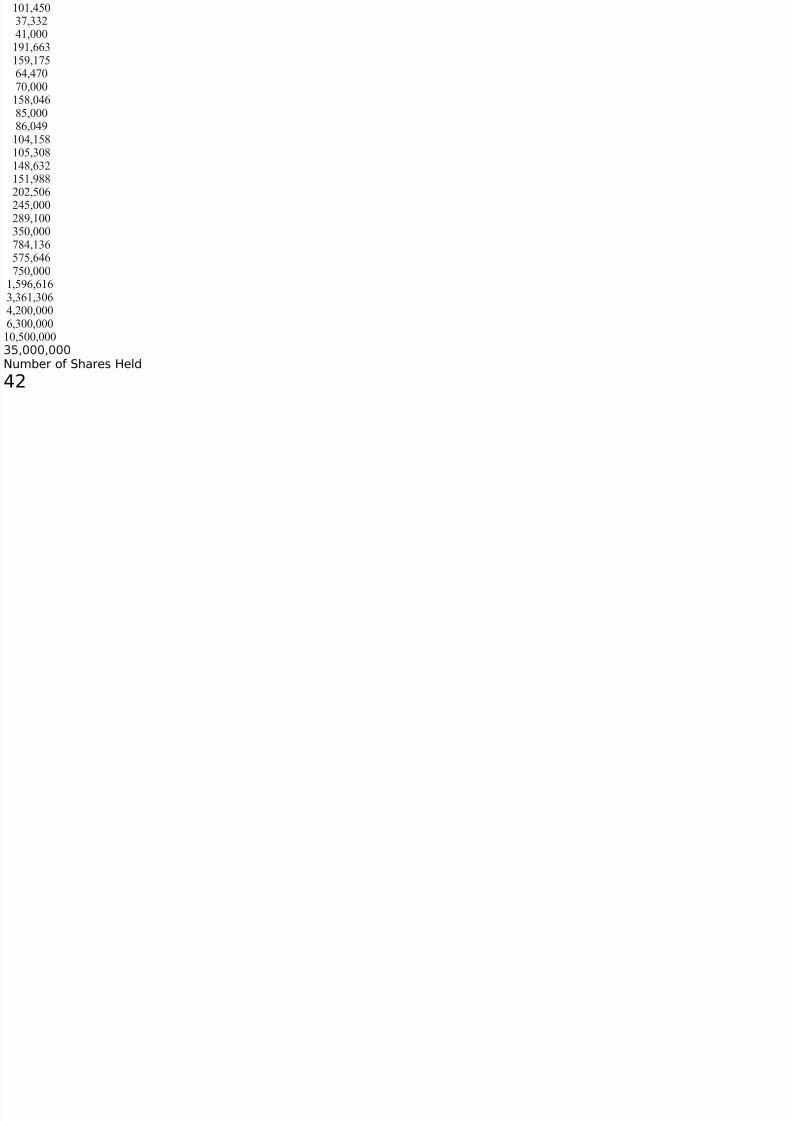
tern of ShareholdingJune 30, 2011ber of Shareholders
1
01
010101001001001001001001001001001001001001
001001001001001001001001001001001001001,001,001
,001,0015,001

8/2/2019 FSA Report6
http://slidepdf.com/reader/full/fsa-report6 11/34
eholding
00000000000000000000000
000000000000000000000000000000000000000000000
000000000000000000,000,000,000,0000,000191907856,054
360928190711222
8/2/2019 FSA Report6
http://slidepdf.com/reader/full/fsa-report6 12/34
450332000663175470000046000049158308632988
506000100000136646000,616,306,000,0000,00000,000ber of Shares Held

8/2/2019 FSA Report6
http://slidepdf.com/reader/full/fsa-report6 13/34
Shareholders

8/2/2019 FSA Report6
http://slidepdf.com/reader/full/fsa-report6 14/34
ANCE SHEETJune 30, 2011
TS-current assetsed assetsstment in associateg-term loans and advancesg-term depositserred taxation
ent assetses, spares and chemicalsk-in-tradee debts
s and advancesued mark-upe deposits and short-term prepaymentsr receivablestion - payments less provisionefunds due from government - sales taxand bank balances
2010es in thousand)
064761300
453888,172,708
07500901,886620
640,3148,76700740)8)11)92886863427320266353,9700,819478
776,088411
965903,4509,716000

8/2/2019 FSA Report6
http://slidepdf.com/reader/full/fsa-report6 15/34
47,096)66)115)928
TYcapital
vesmulated lossalue reserve
PLUS ON REVALUATION OFED ASSETSLITIES-current liabilities
ferred taxationirement benefit obligations
ent liabilitiese and other payablest-term borrowingsued mark-upble to government - sales tax
75
0,080,1287062713,1851,850
8,917,710138
9,7650,903
an Refinery Limited
Report 2011
ngencies and commitments
8,7679,716nnexed notes 1 - 41 form an integral part of these financial statements.
oq Rahmatullahhairman
Ali KhanExecutive

8/2/2019 FSA Report6
http://slidepdf.com/reader/full/fsa-report6 16/34
FIT AND LOSS ACCOUNThe year ended June 30, 2011
2010es in thousand)
f salesprofit / (loss)
bution costnistrative expensesoperating expensesincometing profit / (loss)ce cost
of income of associate/ (Loss) before taxationon/ (Loss) after taxationcomprehensive incomee in fair value of available for sale investmentsociateed tax relating to fair value change of ble for sale investments of associate
0,5452,891)6548,272
9,144)72)94)73)
0356),272)
5,433),782),215)
85)53),262)
9044
09)
22
66)56
)
,457).01)
an Refinery Limited
comprehensive income / (loss)ngs / (Loss) per share
040
nnexed notes 1 - 41 form an integral part of these financial statements.
oq Rahmatullahhairman
Ali KhanExecutive
Report 2011

8/2/2019 FSA Report6
http://slidepdf.com/reader/full/fsa-report6 17/34
H FLOW STATEMENThe year ended June 30, 2011
2010es in thousand)
H FLOW FROM OPERATING ACTIVITIESgenerated from / (used in) operationsup paide tax paidbution to defined benefit retirement plansase in long-term loans and advancesase) / Decrease in long-term depositssh generated from / (used in) operating activities
H FLOW FROM INVESTING ACTIVITIES
ase of property, plant and equipmenteds from sale of property, plant and equipmentn on depositsend receivedsh used in investing activities
H FLOW FROM FINANCING ACTIVITIESpayment of short-term borrowingsend paidsh used in financing activitiescrease in cash and cash equivalents
and cash equivalents at the beginning of the year and cash equivalents at the end of the year an Refinery Limited
896
59)50))
037,809)13),721)1)
,971)64)
35514)02)
91
19),036)
,103),880)84)
,964)
,783)
,827),917)83384)
nnexed notes 1 - 41 form an integral part of these financial statements.Report 2011
oq Rahmatullahhairman
Ali KhanExecutive

8/2/2019 FSA Report6
http://slidepdf.com/reader/full/fsa-report6 18/34
STATEMENT OF CHANGES IN EQUITYfor the year ended June 30, 2011SHARE
CAPITALCAPITALExchange
equalisationreserve
RESERVESREVENUESPECIAL FAIR VALUE
GeneralUnappropriated RESERVERESERVEreserveprofit /note 18.1
(Accumulatedloss)
(Rupees in thousand) TOTALBalance as at July 1, 2009Loss for the year 2010Other comprehensive incomeTotal recognised loss for theyear 2010
Loss for the year transferred tospecial reserve
Balance as at June 30, 2010Profit for the year 2011Other comprehensive incomeTotal recognised profit for theyear 2011
Balance as at June 30, 2011350,000
--897--1,050--19,698(2,975,215)-1,814,421--(6,724)-7582,179,342(2,975,215)758--
-(2,975,215)-758(2,974,457)-350,000---897---1,050--1,814,421(1,141,096)223,956-(1,814,421)----(5,966)-4,148-(795,115)223,9564,148-350,000-897-1,050223,956(917,140)-

8/2/2019 FSA Report6
http://slidepdf.com/reader/full/fsa-report6 19/34
-4,148(1,818)228,104(567,011)
The annexed notes 1 - 41 form an integral part of these financial statements.Pakistan Refinery Limited
Farooq Rahmatullah
ChairmanIjaz Ali Khan
Chief Executive

8/2/2019 FSA Report6
http://slidepdf.com/reader/full/fsa-report6 20/34
Ratios Calculation and Analysis
Liquidity Ratios:
Current ratio:
Current ratio=Current Assets/Current Liabilities
Year Current
Assets
Current
Liabilities
Ratio Calculation Ratio
2011 20,530,31
4
22,383,18
5
20,530,314/22,383,
185
0.92
2010 25,163,450
28,509,765
25,163,450/28,509,765
0.88
2009 29153909 30383131 29153909/3038313
1
0.96
2008 22686853 16919051 22686853/1691905
1
1.34
2007 13598413 9887374 13598413/9887374 1.37
Comments
Quick / Acid test ratio:
Quick ratio=Cash Equivalents +Marketable Securities+Net
Receivables/Current Liabilities

8/2/2019 FSA Report6
http://slidepdf.com/reader/full/fsa-report6 21/34
Year Cash
Equivalents
Marketable
Securities
Net
ReceivablesCurrent
Liabilities
Ratio Calculation Ratio
2011 7,164 _ 9,979,708 22,383,1
85
(7,164+9,979,708)/22,383,
185
0.45
2010 9,590 _ 16,120,819 28,509,7
65
(9,590+16,120,819)/28,50
9,765
0.57
2009 3909833 _ 14431063 3038313
1
(3909833+14431063)/30
383131
0.60
2008 2646115 _ 10427821 16919051
(2646115+10427821)/16919051
0.77
2007 1698277 _ 4789762 9887374 (1698277+4789762)/98
87374
0.66
Comments:
Cash Ratio:
Cash Ratio= Cash Equivalents +Marketable Securities /Current Liabilities
Year CashEquivalents
MarketableSecurities
CurrentLiabilities
Ratio Calculation Ratio
2011 7,164 - 22,383,185 7,164/22,383,185 0.0003
2010 9,590 - 28,509,765 9,590/28,509,765 0.0003
2009 3909833 - 30383131 3909833/30383131 0.12
2008 2646115 - 16919051 2646115/16919051 0.16

8/2/2019 FSA Report6
http://slidepdf.com/reader/full/fsa-report6 22/34
2007 1698277 - 9887374 1698277/9887374 0.17
Comments:
Accounts Receivable Turnover:
55Annual Report 2011
Accounts Receivable Turnover=Net Sales/Average Receivables
Year Net Sales Oppening
Receivables
Ending
Receivables
Average Receivables Ratio Calculation Ratio
2011 96,450,545 16,120,819 9,979,708 (16,120,819+9,979,708)/2 96,450,545/13268893 7.39
2010 76,658,272 14431063 16,120,819 (14431063+16,120,819)/2 76,658,272/15275941 5.02
2009 76861057 10427821 14431063 (10427821+14431063)/2 76861057/12429442 6.18
2008 95564006 4789762 10427821 (4789762+10427821)/2 95564006/7608791.5 12.56
2007 57404065 - 4789762 4789762 57404065/4789762 11.98
Comments:
Accounts Receivable Turnover in Days:
Accounts Receivable Turnover in Days=365/ Accounts Receivable Turnover
Year Accounts ReceivableTurnover
Ratio Calculation Days
2011 7.39 365/7.39 49.39
2010 5.02 365/5.02 72.71
2009 6.18 365/6.18 59.06
2008 12.56 365/12.56 29.06
2007 11.98 365/11.98 30.47

8/2/2019 FSA Report6
http://slidepdf.com/reader/full/fsa-report6 23/34
Comments:
Inventory Turnover:
Inventory Turnover=Cost of Goods Sold/Average Inventory
Year CGS OpeningInventory
EndingInventory
Average Inventory Calculation times
2011 94,032,891 6810970 9054172 (6810970+9054172)/2 94,032,891/7932571 11.85
2010 77,289,144 8367282 6810970 (8367282+6810970)/2 77,289,144/7589126 10.18
2009 79874195 9102109 8367282 (9102109+8367282)/2 79874195/8734695.5 9.14
2008 91232240 5107781 9102109 (5107781+9102109)/2 91232240/7104945 12.84
2007 56626114 - 5107781 5107781 56626114/5107781 11.09
Comments:
Inventory Turnover in Days:
Inventory Turnover in Days=365/ Inventory Turnover
Year Inventory Turnover Ratio Calculation Days
2011 11.85 365/11.85 30.81
2010 10.18 365/10.18 35.85
2009 9.14 364/9.14 39.93
2008 12.84 365/12.84 28.43

8/2/2019 FSA Report6
http://slidepdf.com/reader/full/fsa-report6 24/34
2007 11.09 365/11.09 32.91
Comments:
Working Capital:
Working Capital=Current Assets-Current Liabilities
Year Current Assets Current Liabilities Calculation Rupees
2011 20,530,31
4
22,383,185 20,530,314-
22,383,185
(1852871)
2010 25,163,45
0
28,509,765 25,163,450-28509765
(3346315)
2009 29153909 30383131 29153909-30383131
(1229222)
2008 22686853 16919051 22686853-
16919051
5767802
2007 13598413 9887374 13598413-9887374 3711039
Comments:
Operating Cycle:

8/2/2019 FSA Report6
http://slidepdf.com/reader/full/fsa-report6 25/34
Operating Cycle= Inventory Turnover in Days + Accounts Receivable Turnover in Days
Year InventoryTurnover in Days
AccountsReceivableTurnover in Days
Calculation Days
2011 30.81 49.39 30.81+49.39 80.2
2010 35.85 72.71 35.85+72.71 108.56
2009 39.93 59.06 39.93+59.06 98.99
2008 28.43 29.06 28.43+29.06 57.49
2007 32.91 30.47 32.91+30.47 63.38
Comments:
Sales to Working Capital:
Sales to Working Capital=Sales/ Working Capital
Year Sales Working Capital Calculation Times
2011 57404065 (1852871) 57404065/(1852871) (30.98)
2010 95564006 (3346315) 95564006/(3346315) (28.56)
2009 76861057 (1229222) 76861057/(1229222) (62.53)
2008 76658272 5767802 76658272/5767802 13.29
2007 96450545 3711039 96450545/3711039 25.99
Comments:

8/2/2019 FSA Report6
http://slidepdf.com/reader/full/fsa-report6 26/34
Long Term Debt Paying Ability
Times Interest Earned:
Times Interest Earned=Recurring Earning Excluding Interest and Tax expense, Equity and Minority
Earnings/ Interest expense, Including Capitalized Interest
Year RecurringEarning
Interest expense Calculation Times
2011 20,530,314 22,383,185
2010 25,163,450 28,509,765
2009
2008
2007
Comments:
Debt Ratio:
Debt Ratio=Total Liabilities/Total Assets
Year Total Assets Total Liabilities Calculation Times
2011 24978767 22401850 22401850/24978767 0.90
2010 30859716 28510903 28510903/30859716 0.92
2009 32566845 30387503 30387503/32566845 0.93
2008 23772076 16966171 16966171/23772076 0.71
2007 14696830 9891747 9891747/14696830 0.67

8/2/2019 FSA Report6
http://slidepdf.com/reader/full/fsa-report6 27/34
Comments:
Debt Equity Ratio:
Debt Equity Ratio=Total Liabilities/Shareholders Equity
Year Total Liabilities Shareholders Equity Calculation Ratio
2011 22401850 (567011) 22401850/(567011) (39.5)
2010 28510903 (795115) 28510903/(795115) (35.9)
2009 30387503 2179342 30387503/2179342 13.9
2008 16966171 6805905 16966171/6805905 2.5
2007 9891747 4805083 9891747/4805083 2.1
Comments:
Profitability:
Net Profit Margin=Net Income Before Minority Share of Earnings and Nonrecurring Items/Net Sales
Year Net Income Net Sales Calculation Ratio
2011 215369 57404065 215369/57404065
2010 (2989810) 95564006 (2989810)/ 95564006
2009 (4586326) 76861057 (4586326)/ 76861057
2008 2086022 76658272 2086022/76658272

8/2/2019 FSA Report6
http://slidepdf.com/reader/full/fsa-report6 28/34
2007 243865 96450545 243865/96450545
Comments:
Total Asset Turnover:
Total Asset Turnover=Net Sales/Average Total Assets
Year Net Sales OpeningTotalAssets
EndingTotalAssets
Average Total Assets Calculation times
2011 94,032,891 16,120,819 9,979,708 (16,120,819+9,979,708)/2 96,450,545/13050263.5 7.39
2010 77,289,144 - 16,120,819 9,590/28,509,765
2009
2008
2007
Comments:
Return on Total Assets:
Return on Total Assets= Net Income Before Minority Share of Earnings and Nonrecurring Items/
Average Total Assets
Year Net Income Average TotalAssets
Calculation Ratio
2011 96,450,545

8/2/2019 FSA Report6
http://slidepdf.com/reader/full/fsa-report6 29/34
2010 25,163,450 76,658,272
2009
2008
2007
Comments:
Horizontal Analysis of Balance Sheet
Balance Sheet Items Years2011 2010 2009 2008 2007
ASSETSNon-current assets
Fixed assets 468.4 601.6 251.0 104.8 100.0
Investment in associate 130.5 123.3 105.9 107.7 100.0
Long-term loans and advances 45.8 79.9 150.5 124.2 100.0
Long-term deposits 478.0 473.6 485.3 485.3 100.0
Deferred taxation - 21.6 2535.4 - 100.0
Retirement benefit obligations - prepayments
- - 10.5 23.9 100.0
Total non-current assets 404.9 518.6 310.7 98.8 100.0
Current assets
Stores, spares and chemicals 110.7 98.7 104.5 101.8 100.0
Stock-in-trade 177.2 133.3 163.8 178.2 100.0
Trade debts 208.4 336.6 301.3 217.7 100.0

8/2/2019 FSA Report6
http://slidepdf.com/reader/full/fsa-report6 30/34
Loans and advances 116.2 104.6 64.1 83.8 100.0
Accrued mark-up 11.6 - 170.3 0.6 100.0
Trade deposits and short-term prepayments 97.6 95.3 17.4 99.5 100.0
Other receivables 7173.2 8728.8 12394.5 133.3 100.0
Taxation - payments less provision 18.2 100 - - 100.0
Tax refunds due from Government - Salestax
- 28.8 13.6 12.4 100.0
Investments - - - 0.2 100.0
Cash and bank balances 0.4 0.6 230.2 155.9 100.0
Total current assets 150.9 185.1 214.4 166.9 100.0
Total assets 169.9 209.9 221.6 161.7 100.0
EQUITY AND LIABILITIES 100.0
Share capital 116.7 116.7 116.7 116.7 100.0
Reserves 1.5 1.5 1399.9 53.8 100.0
Special reserve - - - 145.9 100.0
Total equity (11.8) (16.5) 45.4 141.6 100.0
SURPLUS ON REVALUATION OFPROPERTY,PLANT AND EQUIPMENT
100 100 - - 100.0
LIABILITIES 100.0
Non-current liabilities 100.0
Retirement benefit obligations 275.0 26.0 99.9 161.9 100.0
Deferred taxation - - - - -
Total non-current liabilities 426.8 26.0 99.9 1077.5 100.0
Current liabilities
Trade and other payables 210.4 265.2 266.1 166.8 100.0
Short-term borrowings / running finance - - - - -

8/2/2019 FSA Report6
http://slidepdf.com/reader/full/fsa-report6 31/34
Accrued interest / mark-up 1141.6 2470.5 - 3899.3 100.0
Taxation - provision less payments 168.1 - 258.5 269.1 100.0
Payable to government - Sales tax - - - - -
Total current liabilities 226.4 288.3 307.3 171.1 100.0
Total liabilities 226.5 288.3 307.2 171.5 100.0
Total equity and liabilities 169.9 209.9 221.6 161.7 100.0
Vertical Analysis of Balance Sheet
(as a percentage of total assets)
Balance Sheet Items Years2011 2010 2009 2008 2007
ASSETSNon-current assets
Fixed assets 17.5 18.1 7.2 4.2 6.5
Investment in associate 0.3 0.2 0.2 0.2 0.4
Long-term loans and advances 0.0 0.0 0.1 0.1 0.1
Long-term deposits 0.1 0.0 0.0 0.1 0.0
Deferred taxation - 0.0 3.0 - 0.3
Retirement benefit obligations - prepayments - - 0.0 0.0 0.3
Total non-current assets 17.8 18.5 10.5 4.6 7.5
Current assets
Stores, spares and chemicals 1.0 0.7 0.7 1.0 1.6
Stock-in-trade 36.2 22.1 25.7 38.3 34.8
Trade debts 40.0 52.2 44.3 39.8 32.6
Loans and advances 0.1 0.1 0.0 0.1 0.2
Accrued mark-up 0.0 - 0.0 0.0 0.1
Trade deposits and short-term prepayments 0.2 0.2 0.0 0.2 0.3
8/2/2019 FSA Report6
http://slidepdf.com/reader/full/fsa-report6 32/34
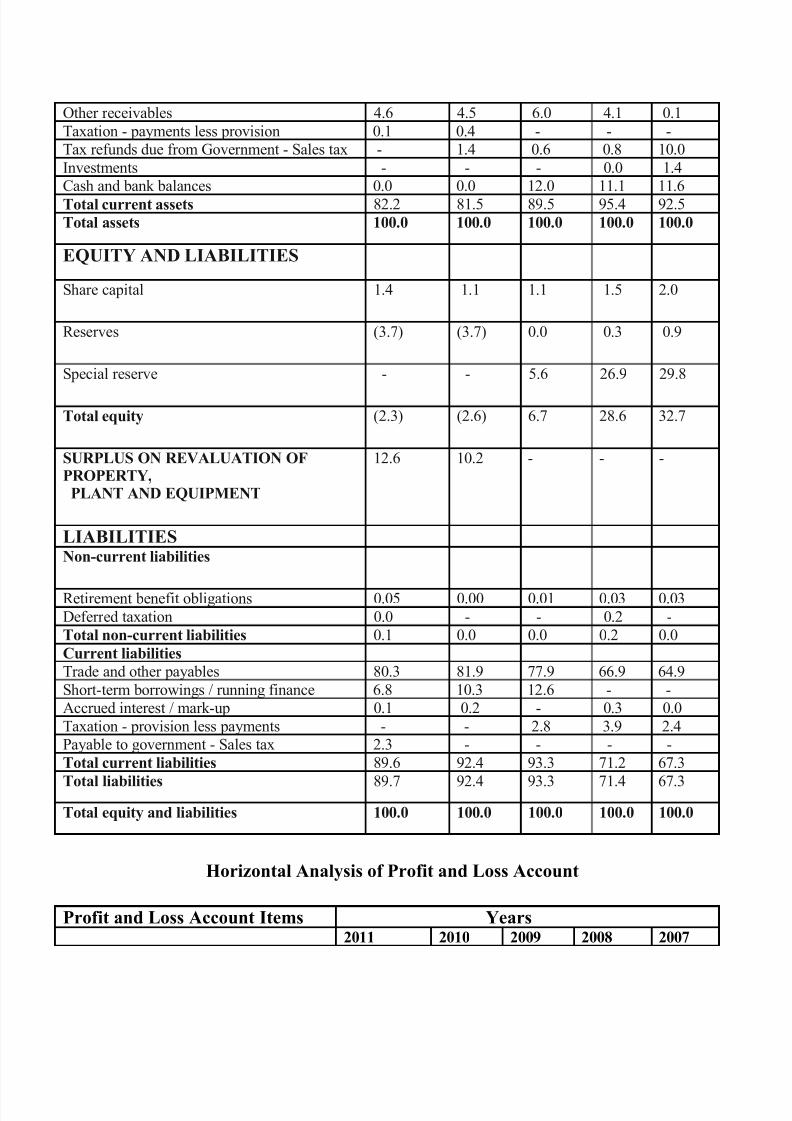
Other receivables 4.6 4.5 6.0 4.1 0.1
Taxation - payments less provision 0.1 0.4 - - -
Tax refunds due from Government - Sales tax - 1.4 0.6 0.8 10.0
Investments - - - 0.0 1.4
Cash and bank balances 0.0 0.0 12.0 11.1 11.6
Total current assets 82.2 81.5 89.5 95.4 92.5
Total assets 100.0 100.0 100.0 100.0 100.0
EQUITY AND LIABILITIES
Share capital 1.4 1.1 1.1 1.5 2.0
Reserves (3.7) (3.7) 0.0 0.3 0.9
Special reserve - - 5.6 26.9 29.8
Total equity (2.3) (2.6) 6.7 28.6 32.7
SURPLUS ON REVALUATION OFPROPERTY,PLANT AND EQUIPMENT
12.6 10.2 - - -
LIABILITIESNon-current liabilities
Retirement benefit obligations 0.05 0.00 0.01 0.03 0.03
Deferred taxation 0.0 - - 0.2 -
Total non-current liabilities 0.1 0.0 0.0 0.2 0.0
Current liabilities
Trade and other payables 80.3 81.9 77.9 66.9 64.9
Short-term borrowings / running finance 6.8 10.3 12.6 - -
Accrued interest / mark-up 0.1 0.2 - 0.3 0.0
Taxation - provision less payments - - 2.8 3.9 2.4
Payable to government - Sales tax 2.3 - - - -
Total current liabilities 89.6 92.4 93.3 71.2 67.3
Total liabilities 89.7 92.4 93.3 71.4 67.3
Total equity and liabilities 100.0 100.0 100.0 100.0 100.0
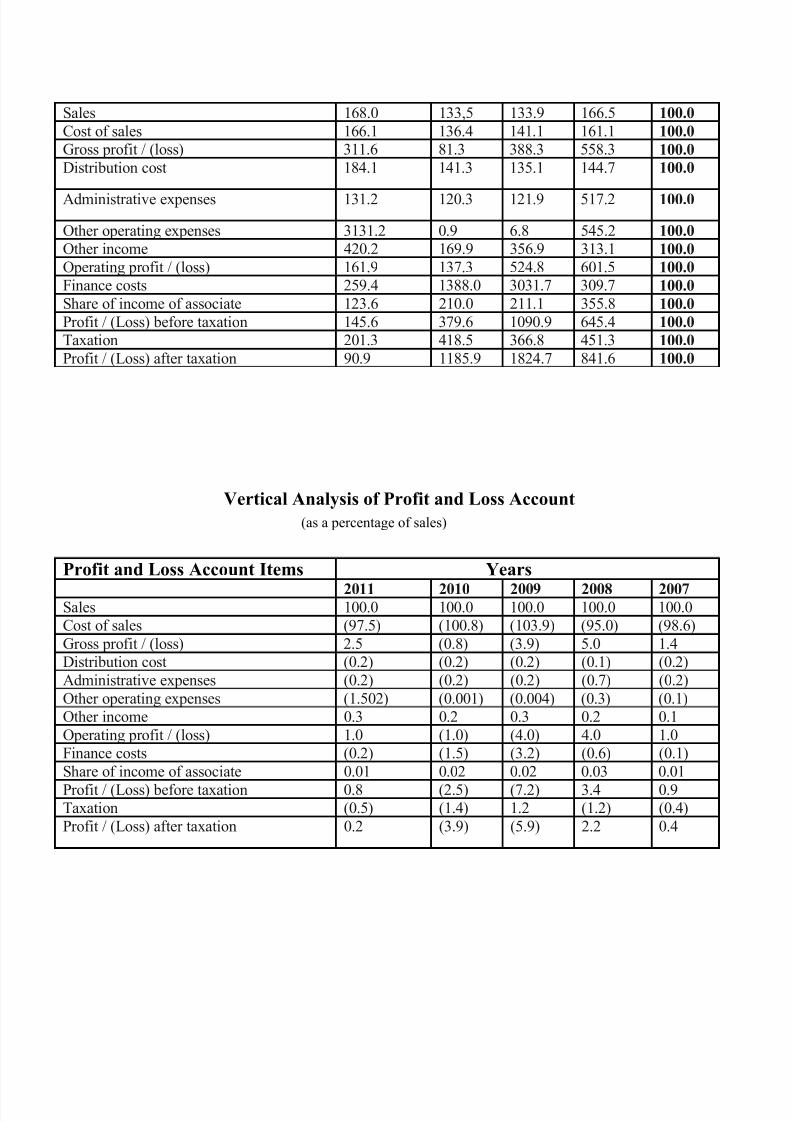
Horizontal Analysis of Profit and Loss Account
Profit and Loss Account Items Years2011 2010 2009 2008 2007
8/2/2019 FSA Report6
http://slidepdf.com/reader/full/fsa-report6 33/34
Sales 168.0 133,5 133.9 166.5 100.0
Cost of sales 166.1 136.4 141.1 161.1 100.0
Gross profit / (loss) 311.6 81.3 388.3 558.3 100.0
Distribution cost 184.1 141.3 135.1 144.7 100.0
Administrative expenses 131.2 120.3 121.9 517.2 100.0
Other operating expenses 3131.2 0.9 6.8 545.2 100.0
Other income 420.2 169.9 356.9 313.1 100.0
Operating profit / (loss) 161.9 137.3 524.8 601.5 100.0
Finance costs 259.4 1388.0 3031.7 309.7 100.0
Share of income of associate 123.6 210.0 211.1 355.8 100.0
Profit / (Loss) before taxation 145.6 379.6 1090.9 645.4 100.0
Taxation 201.3 418.5 366.8 451.3 100.0
Profit / (Loss) after taxation 90.9 1185.9 1824.7 841.6 100.0
Vertical Analysis of Profit and Loss Account
(as a percentage of sales)
Profit and Loss Account Items Years
2011 2010 2009 2008 2007Sales 100.0 100.0 100.0 100.0 100.0
Cost of sales (97.5) (100.8) (103.9) (95.0) (98.6)
Gross profit / (loss) 2.5 (0.8) (3.9) 5.0 1.4
Distribution cost (0.2) (0.2) (0.2) (0.1) (0.2)
Administrative expenses (0.2) (0.2) (0.2) (0.7) (0.2)
Other operating expenses (1.502) (0.001) (0.004) (0.3) (0.1)
Other income 0.3 0.2 0.3 0.2 0.1
Operating profit / (loss) 1.0 (1.0) (4.0) 4.0 1.0
Finance costs (0.2) (1.5) (3.2) (0.6) (0.1)
Share of income of associate 0.01 0.02 0.02 0.03 0.01
Profit / (Loss) before taxation 0.8 (2.5) (7.2) 3.4 0.9Taxation (0.5) (1.4) 1.2 (1.2) (0.4)
Profit / (Loss) after taxation 0.2 (3.9) (5.9) 2.2 0.4

8/2/2019 FSA Report6
http://slidepdf.com/reader/full/fsa-report6 34/34