fruit senescence and decay simulation
TRANSCRIPT

University of Pennsylvania University of Pennsylvania
ScholarlyCommons ScholarlyCommons
Departmental Papers (CIS) Department of Computer & Information Science
4-2011
Fruit Senescence and Decay Simulation Fruit Senescence and Decay Simulation
Joseph T. Kider Jr. University of Pennsylvania, [email protected]
Samantha Raja University of Pennsylvania
Norman I. Badler University of Pennsylvania, [email protected]
Follow this and additional works at: https://repository.upenn.edu/cis_papers
Part of the Computer Sciences Commons
Recommended Citation Recommended Citation Joseph T. Kider Jr., Samantha Raja, and Norman I. Badler, "Fruit Senescence and Decay Simulation", . April 2011.
Kider, J., Raja, S., & Badler, N., Fruit Senescence and Decay Simulation, Eurographics 2011, doi: 10.1111/j.1467-8659.2011.01857.x
This paper is posted at ScholarlyCommons. https://repository.upenn.edu/cis_papers/578 For more information, please contact [email protected].

Fruit Senescence and Decay Simulation Fruit Senescence and Decay Simulation
Abstract Abstract Aging and imperfections provide important visual cues for realism. We present a novel physically-based approach for simulating the biological aging and decay process in fruits. This method simulates interactions between multiple processes. Our biologically-derived, reaction-diffusion model generates growth patterns for areas of fungal and bacterial infection. Fungal colony spread and propagation is affected by both bacterial growth and nutrient depletion. This process changes the physical properties of the surface of the fruit as well as its internal volume substrate. The fruit is physically simulated with parameters such as skin thickness and porosity, water content, flesh rigidity, ambient temperature, humidity, and proximity to other surfaces. Our model produces a simulation that closely mirrors the progression of decay in real fruits under similar parameterized conditions. Additionally, we provide a tool that allows artists to customize the input of the program to produce generalized fruit simulations.
Disciplines Disciplines Computer Sciences
Comments Comments Kider, J., Raja, S., & Badler, N., Fruit Senescence and Decay Simulation, Eurographics 2011, doi: 10.1111/j.1467-8659.2011.01857.x
This conference paper is available at ScholarlyCommons: https://repository.upenn.edu/cis_papers/578

EUROGRAPHICS 2011 / M. Chen and O. Deussen(Guest Editors)
Volume 30 (2011), Number 2
Fruit Senescence and Decay Simulation
Joseph T. Kider Jr., Samantha Raja, and Norman I. Badler
University of Pennsylvania
Abstract
Aging and imperfections provide important visual cues for realism. We present a novel physically-based approach
for simulating the biological aging and decay process in fruits. This method simulates interactions between mul-
tiple processes. Our biologically-derived, reaction-diffusion model generates growth patterns for areas of fungal
and bacterial infection. Fungal colony spread and propagation is affected by both bacterial growth and nutrient
depletion. This process changes the physical properties of the surface of the fruit as well as its internal volume
substrate. The fruit is physically simulated with parameters such as skin thickness and porosity, water content,
flesh rigidity, ambient temperature, humidity, and proximity to other surfaces. Our model produces a simulation
that closely mirrors the progression of decay in real fruits under similar parameterized conditions. Additionally,
we provide a tool that allows artists to customize the input of the program to produce generalized fruit simulations.
Categories and Subject Descriptors (according to ACM CCS): I.3.7 [Computer Graphics]: Three-DimensionalGraphics and Realism—
Keywords: Appearance Modeling, Natural Phenomena, Physical Simulation, Senescence
1. Introduction
As objects age, their appearance changes over time. Theseshifts in appearance give important visual age cues that canenhance the realism of a synthetic scene. We attempt to ad-dress the rather unexplored area of organic decomposition,a fundamental step in a fruit’s life-cycle. The visual simu-lation of the fruit aging process requires attention not onlyto aesthetic changes, but also to the underlying biology ofsenescence and decay. While artists can add visual imperfec-tions to their models and environments through traditionaltexture mapping and physics-based modeling methods, thesemay be based on observation, intuition, and artistic skill.Parameterized procedural decay methods built on scientificprinciples could be useful to make artistic rendering moreprecise. Several surveys [DRS07, MG08] summarize agingand weathering phenomena in computer graphics. However,these methods neither directly include, nor can they be read-ily extended to, the complex biological processes associatedwith decomposition.
While there has been some significant work in the anima-tion industry revolving around the creation of realistic com-puter generated food, there has been little emphasis on thereproduction of natural decay processes. Traditional surface
texture imperfection and aging techniques are visually sat-isfying, but they do not take into account the effect of moldand other microorganisms on environments in a way that isbiologically accurate.
Figure 1: An illustration of a simulated tomato decaying.
Here multiple mold and rot processes affect the fruit.
We present a novel, parameterized method to simulatefruit senescence and decay that is grounded in scientific re-search. As real fruits age, their physical structures becomecompromised and vulnerable to attack by infectious agents.Our model replicates these interactions between multiple bi-ological processes. We generate growth patterns for areas
c© 2010 The Author(s)Journal compilation c© 2010 The Eurographics Association and Blackwell Publishing Ltd.Published by Blackwell Publishing, 9600 Garsington Road, Oxford OX4 2DQ, UK and350 Main Street, Malden, MA 02148, USA.

J.T.Kider Jr. & S. Raja & N.I.Badler / Fruit Senescence and Decay Simulation
of fungal and bacterial infection with a reaction-diffusionmodel. As nutrients deplete, the fungal colony spread de-creases. Additionally, the internal fruit substrate is affectedby soft bacterial rot and the volume decreases over time toreflect water loss due to transpiration. Our work is one of thefirst simulations to link rot growth and transpiration in onemodel.
Our model changes both the overall shape and the appear-ance properties of the fruit’s anatomy. First, the fungus andbacteria are grown on the fruit’s exocarp, or outer skin. Thisprocess is directly affected by moisture, temperature, andnutrient concentration at each point on the surface. Second,we address the gradual collapse and shrinking of the inter-nal structure. Because water accounts for a large percentageof a fruit’s mesocarp (interior), water transpiration is a pri-mary factor in the way a fruit decays and loses internal mass.Additionally, rot makes areas of the substrate soft and moreprone to collapse.
The simulation is based on user-defined parameters forskin thickness and porosity, water content, flesh rigidity, am-bient temperature, humidity, and proximity to other surfaces.These parameters allow direct control of the simulation anda broad range of results. We demonstrate visually accuratesimulations on three fruits: a tomato, apple and orange. Weprovide a variety of fruit presets and parameters to automat-ically produce proper fungal growth and rot for the selectedfruit. Additionally, we provide a tool that allows an artist todirect the simulation. This generalizes our simulation to avariety of fruits, real or imaginary, and even other geometry,allowing artists to produce decay simulations based on theirproduction requirements. To the best of our knowledge, thisis the first paper to describe a visual simulation of fruit de-cay.
1.1. Related Work
Early work on creating imperfections focused on procedu-ral texture synthesis [BB90, WNH97]. This work manipu-lated surface features to simulate blemishes. These methodsused simple distribution models. γ-ton tracing [CXW∗05]is a recent rule-based approach to simulate weathering.Rather than a probabilistic approach, we use a reaction-diffusion system to produce decay phenomena on multipletexture and mesh layers. As nutrients diminish, mold growthstops. This would be difficult to recreate with γ-ton tracing.Turk [Tur91] and Witkin and Kass [WK91] proposed usingreaction-diffusion for texture synthesis. Reaction-diffusiontextures come from a biochemically inspired set of partialdifferential equations. This non-linear interaction processcreates natural patterns, such as stripes and spots. In our ap-proach, we also use a reaction-diffusion model, but applythis mathematical approach to complex biological processes,such as growth of fungus and bacteria, colony formation,and soft rot. Fungal colonies diffuse radially, interacting witheach other and the nutrients on the fruit surface. The decay
affects both the surface and internal substrate of the fruit.Our model parameters for decaying fruit are biologically-derived and present a novel visual simulation method thathas not been covered in previous approaches.
Several researchers have attempted physically-based sim-ulation methods to automate the creation of realistic agingand imperfections. Dorsey and Hanrahan [DH96] modeledand rendered a metallic patina. This work showed the pati-nation process heavily depends on environmental factors.They integrated these parameters into their phenomenologi-cal model to produce a variety of results. Several other cor-rosion models have been proposed that extend this work tomore general conditions [CS00, MDG01]. Hsu and Wong[HW95] integrated surface properties such as inclination andstickiness to simulate dust accumulation. Paquette and Dret-takis [PPD02] simulated paint cracking and peeling and sur-face aging by impacts [PPD01]. Bosch and his colleagues[BPMG04] simulated the formation of scratches and ren-dered their visual behavior. Cracks and fractures play animportant role in aging solid structures [DGA05, GC01].Other researchers proposed methods to simulate appearance-changing flows [DPH96], to weathered stone [DEJ∗99], andto perform multiple weathering effects on fur [JW09].
Data-driven simulation techniques rely on carefully cap-tured images and measurements to produce time-varyingsurface imperfections. Wang et al. [WTL∗06] use a sin-gle image to construct an appearance manifold and Xue etal. [XWT∗08] improve the transfer of weathering from themanifold between images. Our work differs from the ap-pearance manifold approach since fruit decays in complexstages. One image will not capture the dynamics of the en-tire decay. Our technique models multiple types of appear-ance change on the surface and alters the underlying geome-try. Lu et al. [LGG∗07] captured and transferred weatheringeffects from real to synthetic shapes using a context awaretexturing approach. Gu et al. [GTR∗06] acquired a databaseof time-varying images using a multi-camera/light device.Their work looked at apples and banana skin captures. How-ever, their approach simulates only the visual effect of thefruits’ aging over time and not the biological factors behindthe process. In addition, a data-driven approach for simu-lating decay is not practical given the numerous significantparameters (including the geometric context), and the chal-lenges and time investment in acquiring the data. Fruit de-cays over the course of multiple weeks.
Biologically-inspired techniques attempt to simulate nat-ural scenery. Yin and his colleagues [YFCT08] proposeda model for wood aging based on biological deterioration.Boissieux et al. [BKMTK00] simulated skin aging and wrin-kles based on insight from cosmetics. Also, lichen [DGA04]and moss [OMC03] growth create realistic outdoor worlds.
c© 2010 The Author(s)Journal compilation c© 2010 The Eurographics Association and Blackwell Publishing Ltd.

J.T.Kider Jr. & S. Raja & N.I.Badler / Fruit Senescence and Decay Simulation
Figure 2: Photographs of real fruit decay. (a) Penicillium digitatum formation on an orange. (b) Neofabraea formation on an
apple. (c) Rhizopus formation on a tomato. (d)-(f) Time lapse of fungal growth on the bottom point of contact between a tomato
and a glass platform.
1.2. Overview
The remainder of the paper is organized as follows: First, wedescribe the biological basis of fruit senescence and decay.Second, we describe our fruit decay pipeline and provide de-tails for the mathematical model for our simulation. Finally,we present our results and describe how our method can begeneralized by our user interface.
2. Biological Background of Fruit Decay
Decay is an essential step in the reproductive process offruiting plants - the decomposition of flesh frees and feedsthe seeds of the fruit to grow into a new plant. While diseasecan strike a fruit at any stage of life, fruit naturally becomesmore vulnerable to disease over time. We exclusively inves-tigate post-harvest rot in a typical home environment. Foodscientists and biologists recognize fruit decay as a seriousproblem in the shipping and storage of produce. The shortripening and post-harvest life-cycle of fruit influences theirvalue.
Prasanna et al. [PPT07] and Pech et al. [PBL08] studiedfactors in the fruit ripening process. Numerical approacheswere developed to predict morphological patterns of bacte-rial colonies [MM93, OMM92]. Post-harvest disease is typ-ically initiated when a point on the fruit’s surface is com-promised, either due to injury or structural vulnerabilities.One major wound is the stem puncture where the fruit waspicked. Once an initial infectious agent like bacteria has at-tacked, it further weakens the surface and leaves it suscep-tible to infection by other organisms. This is the reason thatmold often forms in areas already infiltrated by bacteria. Thesoft rot serves as an entry point for fungal spores.
Fungal Growth. Various reaction-diffusion processes havebeen proposed to better predict fungal growth based on a va-riety of parameters [MGL93, ESRA10, IM09]. Bacteria andfungi thrive on the nutrient-rich surface of a ripened fruit.However, nutrient levels deplete over time as colonies use upresources, slowing down the growth process. Environmen-tal factors such as temperature and humidity greatly affectmold and bacterial growth [Blo53]. Warmer temperatureslead to more rapid proliferation, while colder temperaturesretard growth. Our model incorporates the interaction be-tween these different factors to determine the concentrationof bacteria and fungi at each point on the fruit surface.
Mold. Various types of mold affect fruit. Andersen andFrisvad [AF04] showed Penicillium and Rhizopus were twospecies present in moldy tomatoes. Rhizopus is a whitethread-like Mucoralean mold that infects tomatoes. Erwinia
carotovora is a type of soft rot that affects the internal sub-strate, making the fruit collapse in the infected regions. Thespecies of mold that most commonly attacks apples is Peni-
cillium expansum. Apples are also often infected by the or-ganism Neofabraea, which causes a soft spot. This infectedregion appears as a growing and darkening brown spot onthe surface. Penicillium digitatum primarily affects oranges.These colonies have a gray-blue center and are white alongthe edges.
Figure 2 provides three photographed examples of Peni-
cillium digitatum, Penicillium expansum, and Rhizopus moldon an orange, apple and tomato. Additionally, Figure 2shows three time lapse images of a tomato photographedfrom the bottom through a piece of glass. Mold starts to format the points of contact with the glass. This occurs becausethe flesh weakens under the pressure of the weight of thefruit, providing entry points for pathological agents.
FruitFood Water
% Water KWeight (g) Weight (g)
Apple 138 116 84 0.17Orange 140 122 87 8.48Peach 87 76 88 14.1Pear 166 139 84 0.68Tomato 123 115 94 0.9
Table 1: This table provides the weight, water content,
and the transpiration coefficient rates (K) for several fruits.
[BH94, CRBG88].
Transpiration. Fruits have high water content in proportionto their weight [BH94, HD97, PUTV04]. Table 1 relates theweight of the fruit to the water content. Moisture loss dueto transpiration is a major factor in fruit decay and is oneof the main factors that drive changes in the internal struc-ture [CG85,SB83,CRBG88,LBG00]. As water continuouslytranspires from a fruit, it loses mass and shrinks. The rate ofthis process largely depends on the structure and the prop-erties of the fruit skin. Certain fruit skins are porous, whileothers are less permeable. A fruit exhibits a hydrostatic pres-
c© 2010 The Author(s)Journal compilation c© 2010 The Eurographics Association and Blackwell Publishing Ltd.

J.T.Kider Jr. & S. Raja & N.I.Badler / Fruit Senescence and Decay Simulation
Chooseinternal volume mesh
Chooseexternal skin mesh
User Parameters
Deformable bodysimulation
Cloth simulation
Reaction-diffusiongrowth model
RenderChange maps
Figure 3: The system framework highlighting the important steps in our fruit decay pipeline. The user provides the input mesh
and parameters to the system. Our model calculates the growth and decay and then renders the final image.
sure as it sits. Transpiration also depends on the physical en-vironment. Temperature and water vapor pressure, as well asthe size and shape of the fruit, are accounted for when calcu-lating transpiration rate. Our model utilizes transpiration asthe main factor for internal volume loss.
Factors not discussed. Fruit decay is a complex natural phe-nomenon that is driven by innumerable conditions in addi-tion to those we have discussed. We do not consider elementssuch as nutrient deficiency or poor fertilization while grow-ing. Our mathematical model can be generalized to differenttypes of fruits and infectious agents based on the input pa-rameterization.
3. Fruit Senescence and Decay Pipeline
In this section, we provide details about our model structureand a set of parameters to generalize the decay process. Fig-ure 3 shows the pipeline of our simulation using the plug-intool we created. First, the user sets both the skin and inter-nal substrate meshes. Next, the user either selects fruit, mold,and environmental presets, or sets custom values for each pa-rameter. These input parameters drive the reaction-diffusionand transpiration mathematical models described in detailbelow. We use a cloth-like simulation as the external skinmodel. Then, the user selects contact points, which will serveas initial seed points for the bacterial soft rot map. Finally,the user runs the simulation. The program output includesa series of maps representing distributions of fungus, bacte-
ria, and nutrients for each frame of the simulation. It alsoincludes a vertex cache which is automatically applied to theinternal substrate mesh. The alpha maps shade the differentlayers of the fruit-fresh surface, bacterial soft rot, and mold.We will describe our particular rendering approach later.
3.1. Maps
The results of the reaction diffusion processes that drive thesurface component of our simulation are visualized as a se-quence of time-varying maps. Our maps range X between [0... 1], with white representing a maximum density of 1, andblack representing a density of 0. We use three different mapsequences: the nutrient map, the fungal map, and the soft rot
map. The nutrient map represents the distribution of nutri-ents over the surface of the fruit, and serves as a distributionmap for fungal growth. We show in Figure 4 (a) how the nu-trients deplete over time as the active fungus grows. Next,
the fungal maps track the areas of fungal colony formation.These grow over time based on our reaction-diffusion model.The soft rot map represents the areas of bacterial growth thatform on fruit. This map serves as a probability map for thepropagation of new fungal colonies. Mold grows primarilyon areas that have already been infected by the bacteria. Anew set of maps is generated and stored at each frame. Forour implementation, the maps were sized at 512× 512 pix-els.
3.2. Internal Volume
The volume of the fruit is modeled as a deformable object.The shape and volume of this mesocarp changes based on theforces of rot and transpiration derived from our mathemati-cal model. We use a mass-spring system that utilizes a set ofpoint masses connected by elastic links. Each mass node cor-responds to a specific vertex of the object. Initial spring con-stants are determined by the user-defined firmness parame-ter (Ks = f irmness), which varies across different fruits. Forexample, tomatoes have high water content and are softerthan apples. The spring constants and resting lengths (rLen)are governed by a pressure map, which may change at everytime-step.
As the soft rot map changes the outer appearance fromthe reaction-diffusion growth, springs at the same locationsin the pressure map decrease in stiffness and length, affect-ing the internal volume. This represents areas of soft bacte-rial rot where the fruit is softer. Therefore certain areas maycollapse faster based on the level of infection. At each timestep of the simulation, spring constants and resting lengthsare decreased at a rate proportional to water content and thecalculated transpiration rate.
Transpiration coefficients for various common fruit types,including those that we used in our simulation, are givenin Table 1. The volume is proportional to the cube of thespring resting lengths. Since we know the proportion of thefruit’s volume, which is water (waterContent), and the rateat which water volume is lost (tRate), the percent total vol-ume we would want the fruit to lose at each time-step is:tRate · waterContent · volume. Therefore, change in rest-ing length at each time step is given in equation 1:
∆rLen =−c · rLen · 3√
tRate · waterContent (1)
Where c is a weighting factor. In addition, we wanted thesprings to lose tightness over time to reflect the softening that
c© 2010 The Author(s)Journal compilation c© 2010 The Eurographics Association and Blackwell Publishing Ltd.

J.T.Kider Jr. & S. Raja & N.I.Badler / Fruit Senescence and Decay Simulation
0 100 200 300 400 500N
utri
entM
ap(a
)F
unga
lMap
(b)
Sof
tRot
Map
(c)
Fin
alR
ende
r(d
)
Figure 4: Results of the final maps: Values range between {0 ... 1} for the phenomenon concentration values. These processes
change the physical properties of the surface and internal volume substrate. (a) Shows nutrient depletion, (b) Fungal colony
growth, (c) Soft rot spread, (d) Final rendered frames.
occurs due to water loss and decrease in structural integrityof the internal fibers. The change in Ks at each time-step isgiven by: ∆ks = c · waterContent · tRate · Ks, where c is aweighting factor.
3.3. External Skin
We found that the dynamic properties of fruit skin can bemodeled in much the same way as cloth. First, we bound theskin to the internal volume mesh with point constraints. Asthe internal mesh started to collapse, it naturally producedthe effects that occur during decay, such as wrinkling andshriveling. The simulation parameters of the cloth were de-termined by user-defined thickness (St ). See Table 2 for oursettings. The fruit skin layer was simulated using the nCloth
cloth solver in Maya.
3.4. Presets and Parameters
We provide a set of fruit, mold, and environmental presetsand parameters to effect the decay of fruit in our simulation.Fruit presets include tomato, orange and apple. Environmentpresets include tropical, cold desert, hot desert, and temper-ate climates.
To generalize the simulation, our custom parameters al-low a variety of effects to be created. Surface parameters
Apple Orange Tomato
Porosity 25 60 40Thickness (St ) 30 60 20
Firmness 80 40 50Growth Rate 20 50 75
Propagation rate 5 3 1
Table 2: This table provides the input parameters for the
different fruits in our results. The temperature was set to 72
degrees and humidity to 50%.
include the thickness and porosity of the exocarp. Internalparameters include water content, transpiration coefficientand firmness. Table 1 provided values for only fruit typesfound in our examples. Many researchers have conductedstudies to accurately determine these values for other typesof fruit [BH94, CRBG88]. Mold parameters, such as growthrate, propagation rate, and color allow for different moldgrowth patterns. Table 3 provides our preset parameters. Itoand Mizuno [IM09] specify other growth settings for moremold types. Environmental factors, such as temperature andhumidity, also influence the simulation. Lastly, we allow theuser to specify initial areas of rot by selecting vertices on theinput mesh. By default, the simulation begins to rot at thepoints of contact with other surfaces and at the stem. How-
c© 2010 The Author(s)Journal compilation c© 2010 The Eurographics Association and Blackwell Publishing Ltd.

J.T.Kider Jr. & S. Raja & N.I.Badler / Fruit Senescence and Decay Simulation
ever, a user can specify new wound points on the pressure
map as desired, to get "directable" simulations.
Figure 5: A composite image of a cross-section view of our
fruit’s anatomy. (Right) shows a final rendered frame. (Left)
shows the skin and deformable body of our substrate.
3.5. Rendering
In order to give our fruits a realistic look and feel, we mod-eled and rendered our results in Autodesk Maya 2010. Thecolor and polygonal structure of each fruit were empiricallyderived by observing and photographing real fruit (Figure 2).However, a more complex capture process [GTR∗06] canalso be used. We used sub-surface scattering shaders to cre-ate the effect of translucency in the fruit flesh, and modifiedspecularity and color to match the captured image data. Weused a layered shading system, applying the map sequenceacquired from our simulation as alpha maps for the decaylayers. The fruit color changes based on the maps. We col-ored the soft rot layer brown and decreased specularity, andused the fungal map as a length and baldness map for Maya
Fur to simulate hair-like mold fibers. Our results were ren-dered with Mental Ray for Maya.
4. Simulation Framework
We simulate both fungal colony and mold growth on the ex-ocarp, and soft rot formation and transpiration on the meso-carp. We present mathematical models that tie together thesetime-varying biological processes on the multiple layers.
4.1. Implementation Overview
We utilize numerical reaction-diffusion equations to formfungal and bacterial colonies, and a transpiration model todrive the volume collapse. These calculations affect the un-derlying maps and substrate meshes as the fruit decays.Since the soft rot, nutrient, and fungal maps interact, we sim-ulate all three processes, the internal deformable body, skin,and output the maps simultaneously.
The following actions are performed at each time step:
Step 1. We spawn new colonies in the fungal and soft
rot maps to simulate the effect of individual cells spread-ing from the existing mold or bacterial colonies and takingroot in nearby areas of the fruit’s surface. For each exist-ing colony, we create a seed point in a randomly selected
location within some radius r with a probability given by1/(10 − propagationRate), with propagationRate’s rangebetween [0 ... 9].
Step 2. We form additional new colonies in the fungal map
in areas of the surface affected by bacterial soft rot. The soft
rot map serves as a probability map, with more concentratedareas of bacteria containing higher probabilities of spawninga new colony.
Step 3. We calculate the reaction diffusion step. The fun-
gal and bacterial maps follow similar reaction diffusion pro-cesses, with differences in equation parameters, while thenutrient map undergoes a separate nutrient diffusion process.
a) The fungal and bacterial concentrations at each cell(corresponding to a pixel on the map) are calculated fromknown concentrations at the previous time step and based onEquation 2, where u is the active fungal density at the cell inthe previous time step.
b) The diffusion term is determined as an average of theimmediate neighboring cells, each with a contribution givenby Equation 4 and offset by a stochastic element determinedby Equation 5 to represent random movement.
c) The reaction term is computed in Equation 7 based ondensity at the corresponding cell in the nutrient map duringthe previous time step.
d) We calculate the nutrient reaction-diffusion process,which is defined in Equation 9.
e) We update the maps by writing the new concentrationvalues at each fungal, rot, and nutrient cells.
Step 4. We integrate the deformable body at each time stepusing the explicit fourth order Runge-Kutta scheme. A timestep size of 6 milliseconds was found to be sufficiently smallto guarantee numerical stability, although for more complexpolygonal meshes, an implicit scheme may be preferred.
4.2. Algorithm Details
Fungal and Bacterial Growth. Multiple researchers havemodeled fungal proliferation and morphological colony for-mation based on a non-linear reaction-diffusion process[MGL93, ESRA10, IM09]. In our model, the fungus is sep-arates into two states, active and inactive. As active fungigrow and proliferate, they deplete the underlying nutrientconcentration defined in our nutrient map. As values in thenutrient map approach 0, the fungi at that point become in-active and cease to spread. We calculate the concentrationof both active and inactive fungi by the following reaction-diffusion equations describing the fungal movement:
δu
δt=∇· (Dc∇u)+θ f (u,n)−a(u,n)u (2)
δv
δt= a(u,n)u (3)
c© 2010 The Author(s)Journal compilation c© 2010 The Eurographics Association and Blackwell Publishing Ltd.
J.T.Kider Jr. & S. Raja & N.I.Badler / Fruit Senescence and Decay Simulation
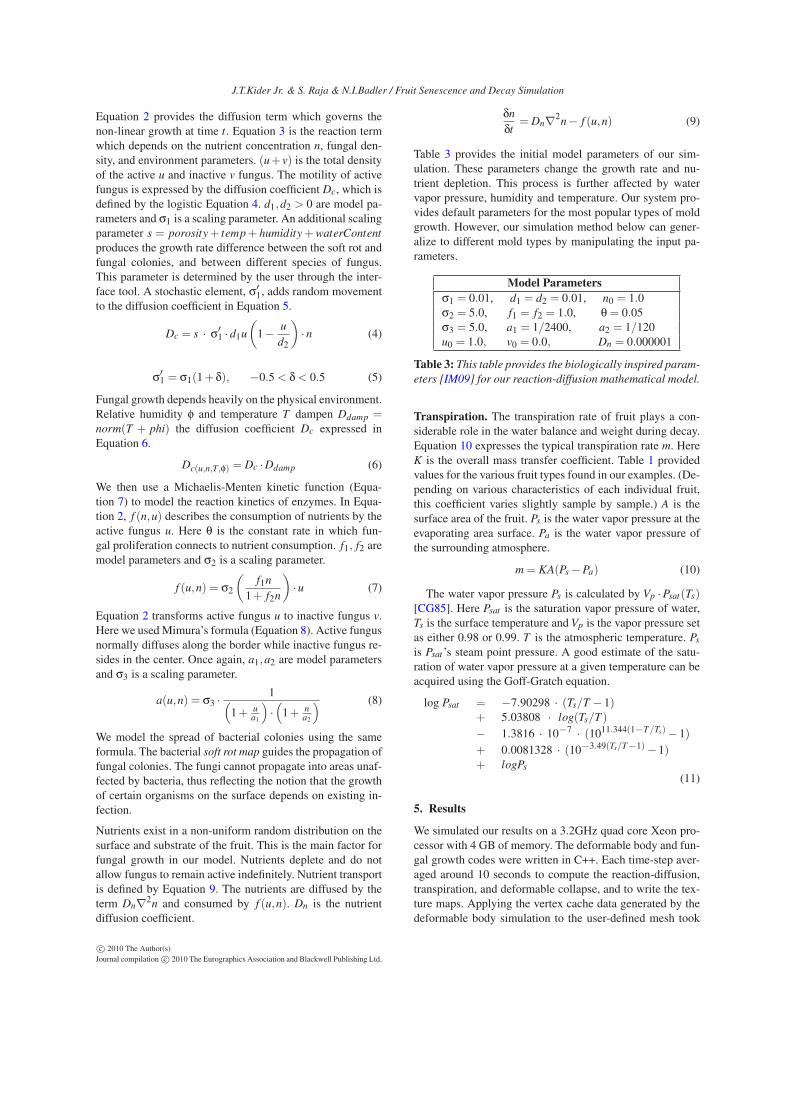
Equation 2 provides the diffusion term which governs thenon-linear growth at time t. Equation 3 is the reaction termwhich depends on the nutrient concentration n, fungal den-sity, and environment parameters. (u+ v) is the total densityof the active u and inactive v fungus. The motility of activefungus is expressed by the diffusion coefficient Dc, which isdefined by the logistic Equation 4. d1,d2 > 0 are model pa-rameters and σ1 is a scaling parameter. An additional scalingparameter s = porosity+ temp+ humidity+waterContent
produces the growth rate difference between the soft rot andfungal colonies, and between different species of fungus.This parameter is determined by the user through the inter-face tool. A stochastic element, σ′
1, adds random movementto the diffusion coefficient in Equation 5.
Dc = s · σ′
1 ·d1u
(
1− u
d2
)
·n (4)
σ′
1 = σ1(1+δ), −0.5 < δ < 0.5 (5)
Fungal growth depends heavily on the physical environment.Relative humidity φ and temperature T dampen Ddamp =norm(T + phi) the diffusion coefficient Dc expressed inEquation 6.
Dc(u,n,T,φ) = Dc ·Ddamp (6)
We then use a Michaelis-Menten kinetic function (Equa-tion 7) to model the reaction kinetics of enzymes. In Equa-tion 2, f (n,u) describes the consumption of nutrients by theactive fungus u. Here θ is the constant rate in which fun-gal proliferation connects to nutrient consumption. f1, f2 aremodel parameters and σ2 is a scaling parameter.
f (u,n) = σ2
(
f1n
1+ f2n
)
·u (7)
Equation 2 transforms active fungus u to inactive fungus v.Here we used Mimura’s formula (Equation 8). Active fungusnormally diffuses along the border while inactive fungus re-sides in the center. Once again, a1,a2 are model parametersand σ3 is a scaling parameter.
a(u,n) = σ3 ·1
(
1+ ua1
)
·(
1+ na2
) (8)
We model the spread of bacterial colonies using the sameformula. The bacterial soft rot map guides the propagation offungal colonies. The fungi cannot propagate into areas unaf-fected by bacteria, thus reflecting the notion that the growthof certain organisms on the surface depends on existing in-fection.
Nutrients exist in a non-uniform random distribution on thesurface and substrate of the fruit. This is the main factor forfungal growth in our model. Nutrients deplete and do notallow fungus to remain active indefinitely. Nutrient transportis defined by Equation 9. The nutrients are diffused by theterm Dn∇2n and consumed by f (u,n). Dn is the nutrientdiffusion coefficient.
δn
δt= Dn∇2
n− f (u,n) (9)
Table 3 provides the initial model parameters of our sim-ulation. These parameters change the growth rate and nu-trient depletion. This process is further affected by watervapor pressure, humidity and temperature. Our system pro-vides default parameters for the most popular types of moldgrowth. However, our simulation method below can gener-alize to different mold types by manipulating the input pa-rameters.
Model Parameters
σ1 = 0.01, d1 = d2 = 0.01, n0 = 1.0σ2 = 5.0, f1 = f2 = 1.0, θ = 0.05σ3 = 5.0, a1 = 1/2400, a2 = 1/120u0 = 1.0, v0 = 0.0, Dn = 0.000001
Table 3: This table provides the biologically inspired param-
eters [IM09] for our reaction-diffusion mathematical model.
Transpiration. The transpiration rate of fruit plays a con-siderable role in the water balance and weight during decay.Equation 10 expresses the typical transpiration rate m. HereK is the overall mass transfer coefficient. Table 1 providedvalues for the various fruit types found in our examples. (De-pending on various characteristics of each individual fruit,this coefficient varies slightly sample by sample.) A is thesurface area of the fruit. Ps is the water vapor pressure at theevaporating area surface. Pa is the water vapor pressure ofthe surrounding atmosphere.
m = KA(Ps −Pa) (10)
The water vapor pressure Ps is calculated by Vp ·Psat(Ts)[CG85]. Here Psat is the saturation vapor pressure of water,Ts is the surface temperature and Vp is the vapor pressure setas either 0.98 or 0.99. T is the atmospheric temperature. Ps
is Psat ’s steam point pressure. A good estimate of the satu-ration of water vapor pressure at a given temperature can beacquired using the Goff-Gratch equation.
log Psat = −7.90298 · (Ts/T −1)+ 5.03808 · log(Ts/T )
− 1.3816 · 10−7 · (1011.344(1−T/Ts)−1)+ 0.0081328 · (10−3.49(Ts/T−1)−1)+ logPs
(11)
5. Results
We simulated our results on a 3.2GHz quad core Xeon pro-cessor with 4 GB of memory. The deformable body and fun-gal growth codes were written in C++. Each time-step aver-aged around 10 seconds to compute the reaction-diffusion,transpiration, and deformable collapse, and to write the tex-ture maps. Applying the vertex cache data generated by thedeformable body simulation to the user-defined mesh took
c© 2010 The Author(s)Journal compilation c© 2010 The Eurographics Association and Blackwell Publishing Ltd.

J.T.Kider Jr. & S. Raja & N.I.Badler / Fruit Senescence and Decay Simulation
Figure 6: A comparison of real photographs (right), and our
simulation results (left) of a tomato and orange.
1.5 seconds per frame. Rendering time was approximately10 minutes per frame with our scene lighting.
In this paper, we have provided final renders for threetypes of fruit: an apple, an orange, and a tomato. We demon-strate that we can simulate a variety of fruits and fungi.Figure 9 shows a final rendered sequence of an orange andtomato. Figure 4 displays the apple sequence.
Figure 7: A screen shot of our user interface tool in Au-
todesk’s Maya. Our plug-in tool allows users to choose pre-
sets and parameterize the simulation to generalize output.
The user imported her own geometry and is currently dis-
playing the nutrient map on the object.
5.1. User Interface Tool
We have designed and developed an authoring tool that inte-grates our simulation into a plug-in to Autodesk Maya 2010.Our user-interface is scripted in MEL and uses the Mayaplug-in API to develop features to allow the user to createand parameterize our simulation. Figure 7 shows the vari-ous features our tool provides the user. The designer selectsmeshes to use, and customizes the simulation. The user mayalso visualize the various fungal, soft rot, and nutrient maps
on the mesh using the button on the top of the tool. Addi-tionally, the user may select pressure points that allow new
fungus to begin to grow and the fruit to begin collapse ondirected input.
5.2. True Life Comparison
In Figure 6 we compare our final rendered frames to realphotographs. We demonstrate that our method produces sim-ilar effects. A key feature of our system is that the biologi-cally derived models simulate perceptually equivalent andindistinguishable results. Every individual piece of fruit hasits own unique decay since it will have some random varia-tion and growth. However, our simulation produces similardecay patterns to the real data.
Figure 8: Here we simulate a group of fruit. Mold begins
to form at the main contact areas where the oranges are
grouped.
5.3. Multiple Fruit
We have demonstrated our simulation on a group of oranges.Figure 8 shows a final rendered result. In this example, thereare more contact points between the multiple pieces of fruit.These contact points provide more pressure to the fruit skincausing wounds and locally high humidity. When a fruit be-comes damaged, fungus begins to appear at these locationsdue to the increase in nutrient concentration. Since our sim-ulation is parameterized on pressure points, it was straight-forward to show the results of mutual contacts among thegrouped fruits, demonstrating the full power of our method.
6. Conclusions
We describe a system for simulating fruit senescence anddecay. Our approach is perceptually similar to real pho-tographs and time-lapse videos. The system takes advantageof a biologically-derived reaction-diffusion model to creategrowth patterns for areas of fungal and bacterial infection.We simulate interactions between multiple phenomena act-ing on both the surface and internal substrate. Additionally,we provide presets and parameters that allow a user to sim-ulate a variety of novel effects. We demonstrate our methodon three fruits: an apple, orange, and tomato. To demonstrateour method’s generalization to any user-defined object, we
c© 2010 The Author(s)Journal compilation c© 2010 The Eurographics Association and Blackwell Publishing Ltd.

J.T.Kider Jr. & S. Raja & N.I.Badler / Fruit Senescence and Decay Simulation
imported a unique mesh into our user interface and simu-lated the decay processes based on user parameterization.Our model simulates a complex class of time-varying agingeffects. In utilizing common production tools to render ourimages, we show that our final product has straightforwardindustry applications in movie and production pipelines thatrequire images or animations of decomposing fruit.
Though our model attempts to create a wide range of ef-fects, it still does not demonstrate every single process. Wedo not consider factors such as calcium deficiency, infectionwhile on the vine, and poor fertilization. Nor do we considerif the fruit was sliced, and we also do not take into accountany liquid phase losses from the fruit. Certain fruits, whenwounded, tend to leak volume from a tear in the surface asthey decay. Lastly, we do not consider the effects of macro-scopic organisms such as worms or flies.
In the future, we wish to extend our model to othergrowth and decay time-varying phenomena. Adding evenmore complex wrinkling and color changes are easy exten-sions to our model. Additionally, we wish to look at ways todevelop our simulation to cooking and roasting food. An-other possible extension would be to use real input pho-tographs and movies to seed the simulation.
7. Acknowledgments
The authors would like to thank NVIDIA for the donationof the graphics hardware, and Autodesk for their donationof Maya. The authors wish to acknowledge Michelle Chen’spreliminary artistic studies on this topic, and Alla Safonovafor all our helpful discussions.
References
[AF04] ANDERSEN B., FRISVAD J. C.: Natural occurrence offungi and fungal metabolites in moldy tomatoes. Journal of Agri-cultural and Food Chemistry 52, 25 (2004), 7507–7513. PMID:15675796.
[BB90] BECKET W., BADLER N. I.: Imperfection for realisticimage synthesis. In Journal of Visualization and Computer Ani-mation (Aug 1990), pp. 26–32.
[BH94] BASTIN S., HENKEN K.: Water content of fruits and veg-etables. http://www.ca.uky.edu/enri/pubs/enri129.pdf (1994).
[BKMTK00] BOISSIEUX L., KISS G., MAGNENAT-THALMANN
N., KALRA P.: Simulation of skin aging and wrinkles with cos-metics insight. Computer Animation and Simulation (2000), 15–27.
[Blo53] BLOCK S.: Humidity requirements for mold growth. Ap-plied and Environmental Microbiology 6 (1953), 287–293.
[BPMG04] BOSCH C., PUEYO X., MÉRILLOU S., GHAZAN-FARPOUR D.: A physically-based model for rendering realisticscratches. Computer Graphics Forum 23, 3 (Sept. 2004), 361–370.
[CG85] CHAU K., GAFFNEY J.: A mathematical model for thetranspiration for fruits and vegetables. American Society of Agri-cultural Engineers No. 85-6005 (1985).
[CRBG88] CHAU K., ROMERO R., BAIRD C., GAFFNEY J.:
Transpiration coefficients for certain fruits and vegetables. Trans-actions of American Society of Heating, Refrigerating and Air-Conditioning Engineers 94 (1988), 1553 – 1559.
[CS00] CHANG Y.-X., SHIH Z.-C.: Physically-based patina-tion for underground objects. Computer Graphics Forum 19, 3(2000).
[CXW∗05] CHEN Y., XIA L., WONG T.-T., TONG X., BAO H.,GUO B., SHUM H.-Y.: Visual simulation of weathering by γ-tontracing. In SIGGRAPH (2005), pp. 1127–1133.
[DEJ∗99] DORSEY J., EDELMAN A., JENSEN H. W., LEGAKIS
J., PEDERSEN H. K.: Modeling and rendering of weatheredstone. In SIGGRAPH (1999), ACM Press/Addison-Wesley Pub-lishing Co., pp. 225–234.
[DGA04] DESBENOIT B., GALIN E., AKKOUCHE S.: Simulat-ing and modeling lichen growth. Computer Graphics Forum 23,3 (2004), 341–350.
[DGA05] DESBENOIT B., GALIN E., AKKOUCHE S.: Modelingcracks and fractures. The Visual Computer 21, 8-10 (2005), 717–726.
[DH96] DORSEY J., HANRAHAN P.: Modeling and rendering ofmetallic patinas. In SIGGRAPH (1996), pp. 387–396.
[DPH96] DORSEY J., PEDERSEN H. K., HANRAHAN P.: Flowand changes in appearance. In SIGGRAPH (1996), pp. 411–420.
[DRS07] DORSEY J., RUSHMEIER H., SILLION F.: Digital Mod-eling of Material Appearance. Morgan Kaufmann PublishersInc., San Francisco, CA, USA, 2007.
[ESRA10] EL-SAYED A. M. A., RIDA S. Z., ARAFA A. A. M.:On the solutions of the generalized reaction-diffusion model forbacterial colony. Acta Applicandae Mathematicae 110 (2010),1501–1511.
[GC01] GOBRON S., CHIBA N.: Crack pattern simulation basedon 3d surface cellular automata. The Visual Computer 17 (2001),287–309.
[GTR∗06] GU J., TU C.-I., RAMAMOORTHI R., BELHUMEUR
P., MATUSIK W., NAYAR S.: Time-varying surface appearance:acquisition, modeling and rendering. In SIGGRAPH (2006),pp. 762–771.
[HD97] HALOUAT A. E., DEBEVERE J. M.: Effect of water ac-tivity, modified atmosphere packaging and storage temperatureon spore germination of moulds isolated from prunes. Interna-tional Journal of Food Microbiology 35, 1 (1997), 41 – 48.
[HW95] HSU S.-C., WONG T.-T.: Simulating dust accumulation.IEEE Computer Graphics $ Applications 15, 1 (1995), 18–22.
[IM09] ITO K., MIZUNO Y.: Numerical morphological analysisof fungal growth based on a reaction diffusion model. BiocontrolScience 14, 1 (2009), 21–30.
[JW09] JIAO S., WU E.: Simulation of weathering fur. In 8thInternational Conference on Virtual Reality Continuum and itsApplications in Industry (2009), pp. 35–40.
[LBG00] LEONARDI C., BAILLE A., GUICHARD S.: Predict-ing transpiration of shaded and non-shaded tomato fruits undergreenhouse environments. Scientia Horticulturae 84, 3-4 (2000),297 – 307.
[LGG∗07] LU J., GEORGHIADES A. S., GLASER A., WU H.,WEI L.-Y., GUO B., DORSEY J., RUSHMEIER H.: Context-aware textures. ACM Transactions on Graphics 26 (January2007).
[MDG01] MERILLOU S., DISCHLER J.-M., GHAZANFARPOUR
D.: Corrosion: simulating and rendering. In Graphics Inter-face (Toronto, Ont., Canada, Canada, 2001), Canadian Informa-tion Processing Society, pp. 167–174.
c© 2010 The Author(s)Journal compilation c© 2010 The Eurographics Association and Blackwell Publishing Ltd.

J.T.Kider Jr. & S. Raja & N.I.Badler / Fruit Senescence and Decay Simulation
0 100 200 300 400 500To
mat
oS
imul
atio
n(a
)S
imul
atio
n(b
)S
imul
atio
n(c
)
Figure 9: Simulation results of a tomato and an orange under three different parameter settings set by three users from our
user interface. Simulation (a) and (b) set two different pressure points and produce different results. (c) changes parameters in
the mold growth to simulate different growth rates.
[MG08] MÉRILLOU S., GHAZANFARPOUR D.: Technical sec-tion: A survey of aging and weathering phenomena in computergraphics. Computer & Graphics 32 (April 2008), 159–174.
[MGL93] MOLIN P., GERVAIS P., LEMIERE J. P.: A computermodel based on reaction-diffusion equations for the growth offilamentous fungi on solid substrate. Biotechnology Progress 9,4 (1993), 385–393.
[MM93] MATSUYAMA T., MATSUSHITA M.: Fractal morpho-genesis by a bacterial cell population. Critical Reviews in Micro-biology 19, 2 (1993), 117–135.
[OMC03] OGASAWARA Y., MURAOKA K., CHIBA N.: Visualsimulation of moss taking into account local environment on tem-perature and humidity. The Journal of the Society for Art andScience 2 (2003), 31–39.
[OMM92] OHGIWARI M., MATSUSHITA M., MATSUYAMA T.:Morphological changes in growth phenomena of bacterial colonypatterns. Journal of the Physical Society of Japan 61, 3 (1992),816–822.
[PBL08] PECH J., BOUZAYEN M., LATCHÉ A.: Climactericfruit ripening: Ethylene-dependent and independent regulation ofripening pathways in melon fruit. Plant Science 175, 1-2 (2008),114 – 120.
[PPD01] PAQUETTE E., POULIN P., DRETTAKIS G.: Surface ag-ing by impacts. In Graphics Interface (2001), Canadian Informa-tion Processing Society, pp. 175–182.
[PPD02] PAQUETTE E., POULIN P., DRETTAKIS G.: The sim-ulation of paint cracking and peeling. In Graphics Interface(2002), Canadian Information Processing Society, pp. 59–68.
[PPT07] PRASANNA V., PRABHA T. N., THARANATHAN R. N.:
Fruit ripening phenomena-an overview. Critical Reviews in FoodScience and Nutrition 47, 1 (2007), 1–19.
[PUTV04] PLAZA P., USALL J., TEIXIDÓ N., VIÑAS I.: Ef-fect of water activity and temperature on competing abilities ofcommon postharvest citrus fungi. International Journal of FoodMicrobiology 90, 1 (2004), 75 – 82.
[SB83] SASTRY S., BUFFINGTON D.: Transpiration rates ofstored perishable commodities: a mathematical model and exper-iments on tomatoes. International Journal of Refrigeration 6, 2(1983), 84 – 96.
[Tur91] TURK G.: Generating textures on arbitrary surfaces usingreaction-diffusion. In SIGGRAPH (1991), pp. 289–298.
[WK91] WITKIN A., KASS M.: Reaction-diffusion textures.SIGGRAPH 25, 3 (1991), 299–308.
[WNH97] WONG T.-T., NG W.-Y., HENG P.-A.: A geometrydependent texture generation framework for simulating surfaceimperfections. In Eurographics Workshop on Rendering Tech-niques ’97 (London, UK, 1997), Springer-Verlag, pp. 139–150.
[WTL∗06] WANG J., TONG X., LIN S., PAN M., WANG C.,BAO H., GUO B., SHUM H.-Y.: Appearance manifolds for mod-eling time-variant appearance of materials. ACM Transactions onGraphics 25, 3 (2006), 754–761.
[XWT∗08] XUE S., WANG J., TONG X., DAI Q., GUO B.:Image-based material weathering. Computer Graphics Forum(April 2008), 617–626.
[YFCT08] YIN X., FUJIMOTO T., CHIBA N., TANAKA H. T.:Modeling of wood aging caused by biological deterioration.JACIII 12, 2 (2008), 125–131.
c© 2010 The Author(s)Journal compilation c© 2010 The Eurographics Association and Blackwell Publishing Ltd.