fructooligosaccharides production from sucrose by(2 adobe) · fructooligosaccharides production...
TRANSCRIPT

Fructooligosaccharides production from sucrose by Aspergillus sp. N74 in a hybrid bioreactorProceedings of European Congress of Chemical Engineering (ECCE-6)Copenhagen, 16-20 September 2007
Fructooligosaccharides production from sucrose by Aspergillus sp.N74 in a hybrid bioreactor
Sánchez Oscara, Guío Felipea, García Dianaa, Silva Edelbertob, Caicedo Luisa
a Department of Chemical Engineering,Universidad Nacional de Colombia, Cra 30 Calle 45, Bogotá, Colombia.bDepartment of Chemical Pharmaceutics,Universidad Nacional de Colombia, Cra 30 Calle 45, Bogotá, Colombia.
Abstract
Batch fructooligosacharides (FOS) production by fructosyltransferase from Aspergillus sp. N74using whole cells was studied. The biomass production and enzymatic reaction were carried outin a hybrid reactor (airlift mechanically agitated). To evaluate the fructosyltransferase activitytwo biomass concentrations (6 and 9.5 g L-1) of Aspergillus sp N74 mycelia were used. Thereaction conditions were pH 5,5, 60 ºC and a initial sucrose concentration of 70% (w/v); in thereactor the superficial air velocity and impeller speed were 0.012 m s-1 and 450 r.p.m,respectively. For each biomass concentration the reaction time for the batch operation was 26h.FOS yield in batch operation for 6 g L-1 biomass concentration was 69%, while the highest FOSyield was 76% for 9.5 g L-1 biomass concentration in the first 4h of reaction. Results showed thedesign reactor and the native strain Aspergillus sp. N74 as an industrial alternative for thefructooligosaccharides production.
Keywords: Fructosyltransferase, Fructooligosaccharides, Aspergillus sp., Hybrid reactor
1. Introduction
Fructooligosaccharides (FOS) are oligosaccharides of fructose containing a single glucosemoiety, they are produced by the action of fructosyl transferase (FTase, E.C. 2.4.1.9) from manyplants and microorganisms. The FOS formed contains fructosyl units bounded at the β-2,1position of sucrose, they are mainly composed by 1-kestose, nystose and 1-β-fructofuranosylnystose (Sangeetha et. al., 2005b; Kaplan and Hutkins, 2000; Yun, 1996; Hidaka et al., 1988).Among FOS, the ones with low polymeric grade show better therapeutic properties than thosewith a high polymeric degree; they are about 0.4 and 0.6 times as sweet as sucrose and have beenused in the pharmaceutical industry as a functional sweetener (Sangeetha et al., 2005b;Biedrzycka and Bielecka, 2004; Heyer and Wendenduerg, 2001; Yun, 1996; Kühbauch, 1972).FOS present properties such as low caloric values, non-cariogenic properties, decrease levels ofphospholipids, triglycerides and cholesterol, help gut absorption of calcium and magnesium, areuseful for diabetic products and are used as prebiotics to stimulate the bifidobacteria growth in

Sánchez Oscar at al.,
the human colon (Sangeetha et al., 2005b; Biedrzycka and Bielecka, 2004; Roberfroid andDelzenne, 1998; Yun, 1996; Crittenden and Playne, 1996; Yamashita et al., 1984).
FOS are industrially produced from sucrose by microbial enzymes with transfructosylatingactivity. Most of these enzymes have been found in fungi such as Aspergillus, Aureobasidum,Arthrobacter and Fusarium (Sangeetha et al., 2005a-b; Yun, 1996). Nevertheless, commercialFOS may contain glucose, fructose and sucrose in more than 500 g per kg of total FOS dryweight. Thus, the pursue of new potent transfructosylating–enzyme producers with their bestreaction conditions are desirable in order to scale-up the process; in this study, the batch-FOSproduction from sucrose by whole cells of Aspergillus sp N74 in a mechanically agitated airliftreactor was evaluated at bench scale.
2. Materials and methods
2.1. Chemicals
1-Kestose, nystose, and 1-β-fructofuranosyl nystose used for standard in product analysis werepurchased from Wako Pure Chemical Industries (Osaka, Japan). The sucrose was food–gradecommercial products, while other chemicals were analytical grade.
2.2. Microorganism and spore production
The fungus Aspergillus sp. N74 was isolated from a sugar cane crop in La Peña (Colombia). In aprevious study (Sánchez, 2006), this strain showed a high transfructosylating activity and the bestsugar-bioconversion conditions were pH 5.5, 60ºC and sugar concentrations higher than 55%(w/v). The strain was cultivated on malt extract agar (MEA) plates at 30±1ºC for 7 days. Toprepare spore suspensions, spores were scraped down from the MEA plates with a sterilizedtensoactive solution (15% w/v glycerol, 0.1% w/v Tween 80 and acetate buffer 0.1M (pH 6.0) for100 mL), diluted to a concentration of about 1x10⁷ spores ml-1 with sterilized water. The sporesuspensions were kept at –20±1ºC and subcultured once a month.
2.3. Reactor description
The mycelium growth and the sucrose bioconversion were made in a concentric membrane–draft–tube bioreactor. The membrane was made in stainless steel with pore size of 20 μm andformed a filtration module with an irregular geometry that held the mycelium pellets in thefermentation vessel (Fig. 1). The total filtration surface was 1620 cm2 for an area–operationvolume ratio of 360 cm2 L-1.
At the centerline of the membrane–draft–tube the agitation and aeration system were placed.Agitation was made with two Rushton turbines and aeration was made through a perforated pipesparger, the vertical distance between the lower turbine and the sparger was 3.5 cm (Cts). The 6-

Sánchez Oscar at al.,
bleaded Rushton turbines were 7.5 cm in diameter (di) and every blade was 1.5 cm wide (w), fora w/di relation of 1/5. The vertical distance between the turbines was 5.0 cm (sc) and the lowerturbine was located 8.5 cm from the vessel bottom (C), for a sc /di relation of 2/3. The bioreactorvessel was 16 cm in internal diameter (D) and 32 cm in overall height (H) with round bottom.The membrane–draft–tube, 15 cm length (hm), was located 5.0 cm above the bottom of the vessel(Cl) and the raiser and downcomer relation area were 0.83 (Ar/Ad). The working volume and theoverall bioreactor volume were 4.5 and 7 L, respectively. The initial static liquid height was 22.0cm (hL) and the clearance between the upper shape membrane–draft–tube and the liquid surfacewas 2.2 cm (Cu). Fig. 2 shows the reactor dimensions.
Fig. 1 Upper (a) and lower (b) cross view and axial view (c) of the design filtration module.
hm =
15
D = 16
H = 3
2.0
Cl =
5
di = 7.5
Sc =
5
w = 1
.5
hL =
22
Cts =
3.5
Cu =
2.2C
= 8.5
Fig. 2 Reactor dimensions (in centimeters).

Sánchez Oscar at al.,
2.4. Biomass Production
For every fermentation, a pre–inoculus was made in a 1L Erlenmeyer flask with 500 mL ofculture medium (11% sucrose, 0.84% K2HPO4, 0.102% MgSO4.7H2O, 0.088% KCl, 0.007%FeSO4.7H2O, 0.085% NaNO3.4H2O, 2.0% yeast extract, 0.136% CaCO3, adjust to pH 5.5±0.1with HNO3) inoculated with 600 μL of 1x10⁷ spores ml-1 shaken for 12h at 30±1ºC and 250r.p.m. (New Brunswick C76). The inoculated culture medium (pH 5.5 and total volume 4.5L)was cultured for 24 or 48h, under the following conditions: 30ºC, 300 r.p.m and superficialaeration rate (UGr), 0.008 m s-1. At the end of the growing time (24 or 48h), the culture mediumwas pumped out through the filtration module and the held biomass was washed several timeswith phosphate buffer (50 mM, pH 5.5) in order to remove the culture medium remnant. Thebiomass concentration was determinated at the end of the enzymatic reaction, after being washedwith phosphate buffer (50 mM, pH 5.5) and dried for 48 h at 80°C.
To see the effect of the membrane filtration module over the biomass production, fermentationsin the same reactor but without the membrane module under the same culture conditions andmedium were made. Since, fermentations in submerged membrane bioreactors (MBRs) are usedto get high cell density cultures (HCDC) (Chang et al., 1994).
2.4.1 Morphological characterization
During the culture, samples were taken for the fungal pellet morphology. It was characterizedusing image analysis (Casas López et al., 2005; Paul and Thomas, 1998). Prior to imaging, eachsample was filtered and washed twice with 10 mL of distilled water. For each sample, 50 pelletswere analyzed and measured the total pellet core diameter as the one-dimensional projected area.The image was captured with a CMOS camera (Evolution LC Color; Media Cybernetics Inc.,Silver Spring, MD, USA) mounted on an inverted microscope (Leica DMIL) that used a 40xmagnification.
2.5. Enzymatic Reaction
The enzymatic reaction was performed for both biomass concentrations in the hybrid reactor. Thereaction volume and conditions were: 4.5 L, initial sucrose concentration 70% (w
/v), pH 5.5, 60ºC,350 r.p.m and superficial aeration rate, 0.012 m s-1. The reactor was operated in batch for 26h;during the reaction were taken samples for the analysis of enzymatic activity and carbohydrates.
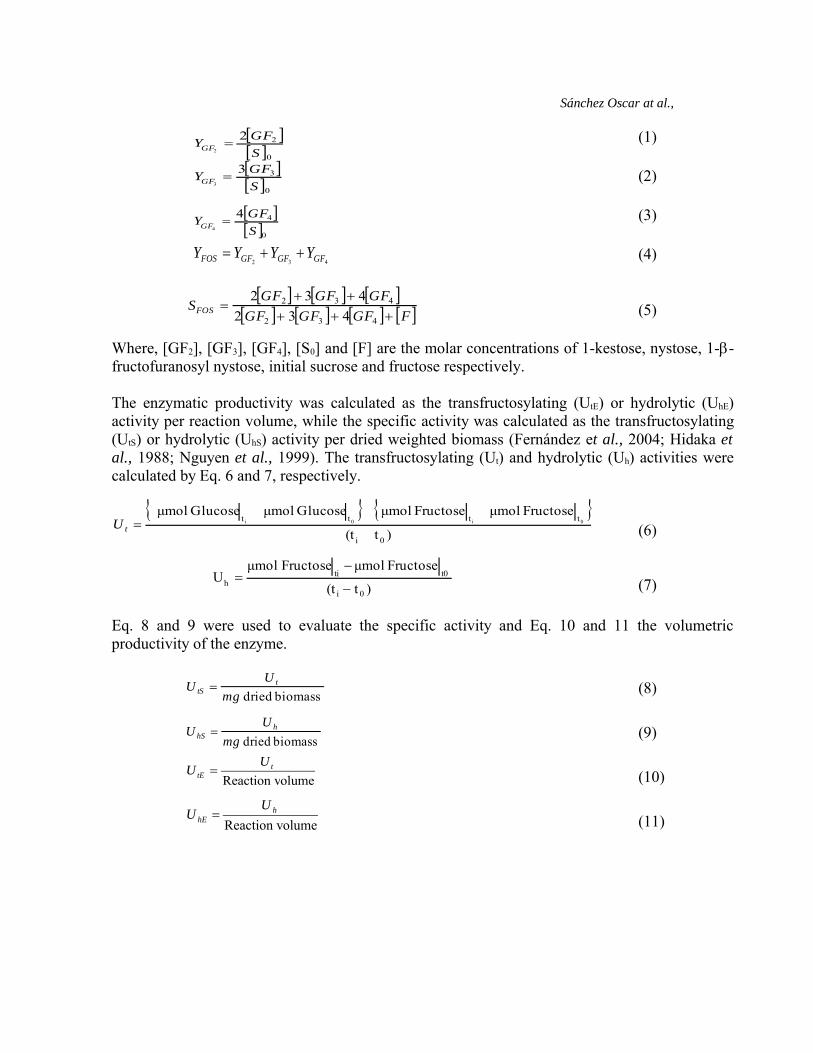
The enzymatic activity was determinated by the total yield of fructooligosaccharides (YFOS)(Madlová et al., 1999), which was calculated from the yield of 1-kestose (YGF2) nystose (YGF3)and 1-β-fructofuranosyl nystose (YGF4). While the selectivity was calculated by Eq. 5.
Sánchez Oscar at al.,
(1)
(2)
(3)
(4)
(5)
Where, [GF2], [GF3], [GF4], [S0] and [F] are the molar concentrations of 1-kestose, nystose, 1-β-fructofuranosyl nystose, initial sucrose and fructose respectively.
The enzymatic productivity was calculated as the transfructosylating (UtE) or hydrolytic (UhE)activity per reaction volume, while the specific activity was calculated as the transfructosylating(UtS) or hydrolytic (UhS) activity per dried weighted biomass (Fernández et al., 2004; Hidaka etal., 1988; Nguyen et al., 1999). The transfructosylating (Ut) and hydrolytic (Uh) activities werecalculated by Eq. 6 and 7, respectively.
(6)
(7)
Eq. 8 and 9 were used to evaluate the specific activity and Eq. 10 and 11 the volumetricproductivity of the enzyme.
(8)
(9)
(10)
(11)
[ ][ ] 2
0
22 S
GFYGF =
[ ][ ]0
333 S
GFYGF =
[ ][ ] 4
0
44 S
GFYGF =
432 GFGFGFFOS YYYY ++=
[ ] [ ] [ ][ ] [ ] [ ] [ ] 432
432
432
432
FGFGFGFGFGFGF
SFOS +++++
=
biomass dried mg
UU t
tS =
biomass dried mgU
U hhS =
olumeReaction v
ttE
UU =
olumeReaction v
hhE
UU =
{ } { }
)t(t
Fructose μmolFructose μmol Glucose μmolGlucose μmol
0i
tttt 0i0i=tU
)t(t
Fructose μmolFructose μmolU
0i
t0tih −
−=

Sánchez Oscar at al.,
2.6. Analysis of sugars
The analysis of sugars was performed by high performance liquid chromatography (HPLC). TheHPLC equipment consisted of a pump Waters 515 with an on line degasser, a refractive index(RI) detector Waters 410 and an injection valve with a 20 μL loop.
A Sugar-PakTM (Waters) column was used for sucrose, glucose and fructose identification andquantification. The chromatographic conditions were: column temperature, 84°C; mobile phase,water at a flow rate of 0.4 cm3 min−1 and RI detector temperature, 40°C (Sánchez, 2006).
A Shodex® column was used for 1-kestose, nystose and 1-β-fructofuranosyl nystoseidentification and quantification. The chromatographic conditions were: column temperature, 65°C; mobile phase, water-acetonitrile (72:28) at a flow rate of 1.0 cm3 min−1 and RI detectortemperature, 45°C (Sánchez, 2006).
3. Results and discussions
3.1 Biomass production and enzyme activity
The dried biomass produced in the agitated membrane airlift reactor at 24 and 48h were 27 and43g, respectively; ∼45% higher than the dried weighted biomass gotten in the same reactor butwithout the membrane filtration module. This increase in the biomass weight could be due to thefact the internal cell retention that allows it to increase (Chang et al., 1994).
Fig. 3 illustrates pH, dissolved oxygen (D.O), dried biomass concentration and apparent viscosityduring the 48h microorganism culture in the hybrid reactor. The D.O and biomass profiles showa common behaviour for aerobic fermentations, where the oxygen tension falls down while thebiomass concentration increases. In the same way, the apparent viscosity increased with thebiomass concentration; a similar behaviour was reported for a submerged culture of filamentousfungi (Aspergillus terreus) by Rodríguez-Porcel et al. (2005) and Casas López et al. (2005). ThepH profile was kept in the range of 5.50±0.06.
It was noticed that for the culture conditions (stirring rate 300 r.p.m and superficial gas velocity0.008 m s-1), the pellet size after the first 6 hours of cultured kept a mean core diameter of2200±100 μm (Fig. 4). Similar behaviour and pellet size were gotten by Casas López et al.(2005) whom worked the morphological and rheology characterization of Aspergillus terreuscultures at the same stirring rate.

Sánchez Oscar at al.,
Fig. 3 pH, D.O., apparent viscosity and dried weight biomass profiles during the fungi culture.
Fig. 4 Pellet formation sequence at the first 6h of culture (a.1-a.6). Pellet core size follow–up during the culture time:6h (a-6), 18h (b), 30h (c) and 48h (d) (40x magnification).
2200μm
0
2
4
6
8
10
12
0 10 20 30 40 50
Time (h)
pH -
Bio
mas
s (g
L-1)
0
10
20
30
40
50
60
70
80
90
100
O.D
- μap
p. x
10-2
(cP
)
Biomass pH
O.D μ
2200μm
(b) (c) (d)
(a.4) (a.5) (a.6)
(a.1) (a.2) (a.3)
Sánchez Oscar at al.,
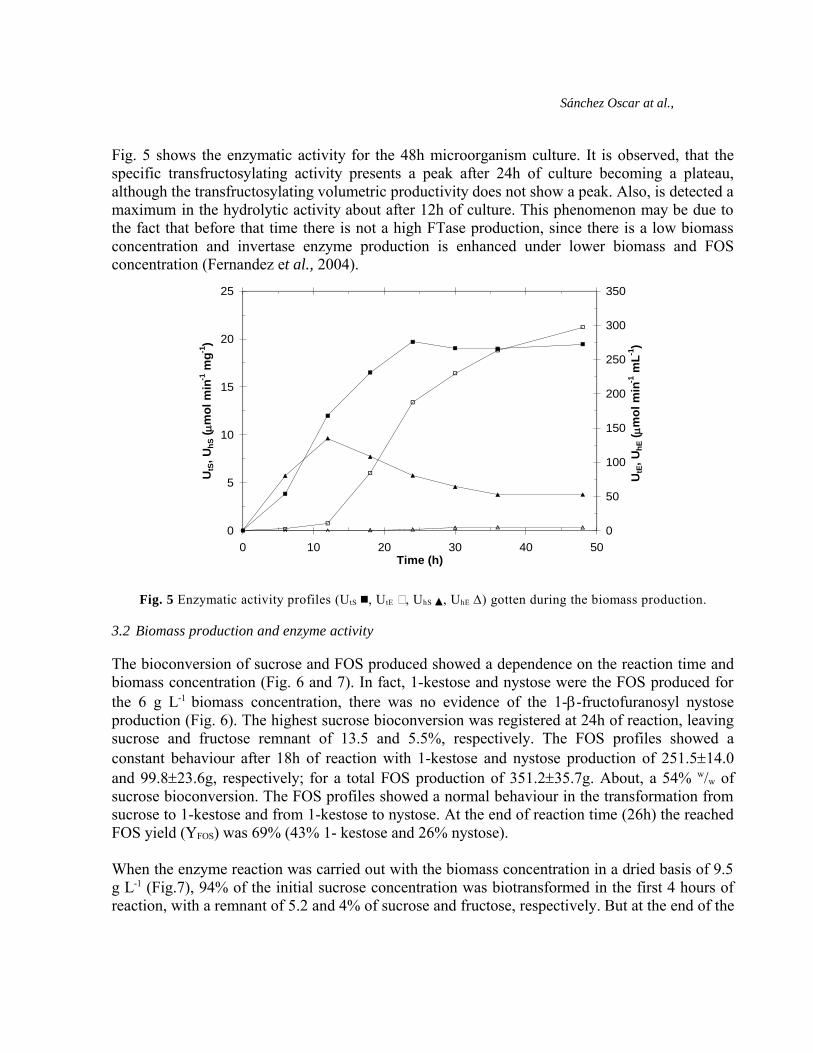
Fig. 5 shows the enzymatic activity for the 48h microorganism culture. It is observed, that thespecific transfructosylating activity presents a peak after 24h of culture becoming a plateau,although the transfructosylating volumetric productivity does not show a peak. Also, is detected amaximum in the hydrolytic activity about after 12h of culture. This phenomenon may be due tothe fact that before that time there is not a high FTase production, since there is a low biomassconcentration and invertase enzyme production is enhanced under lower biomass and FOSconcentration (Fernandez et al., 2004).
Fig. 5 Enzymatic activity profiles (UtS , UtE , UhS , UhE Δ) gotten during the biomass production.
3.2 Biomass production and enzyme activity
The bioconversion of sucrose and FOS produced showed a dependence on the reaction time andbiomass concentration (Fig. 6 and 7). In fact, 1-kestose and nystose were the FOS produced forthe 6 g L-1 biomass concentration, there was no evidence of the 1-β-fructofuranosyl nystoseproduction (Fig. 6). The highest sucrose bioconversion was registered at 24h of reaction, leavingsucrose and fructose remnant of 13.5 and 5.5%, respectively. The FOS profiles showed aconstant behaviour after 18h of reaction with 1-kestose and nystose production of 251.5±14.0and 99.8±23.6g, respectively; for a total FOS production of 351.2±35.7g. About, a 54% w/w ofsucrose bioconversion. The FOS profiles showed a normal behaviour in the transformation fromsucrose to 1-kestose and from 1-kestose to nystose. At the end of reaction time (26h) the reachedFOS yield (YFOS) was 69% (43% 1- kestose and 26% nystose).
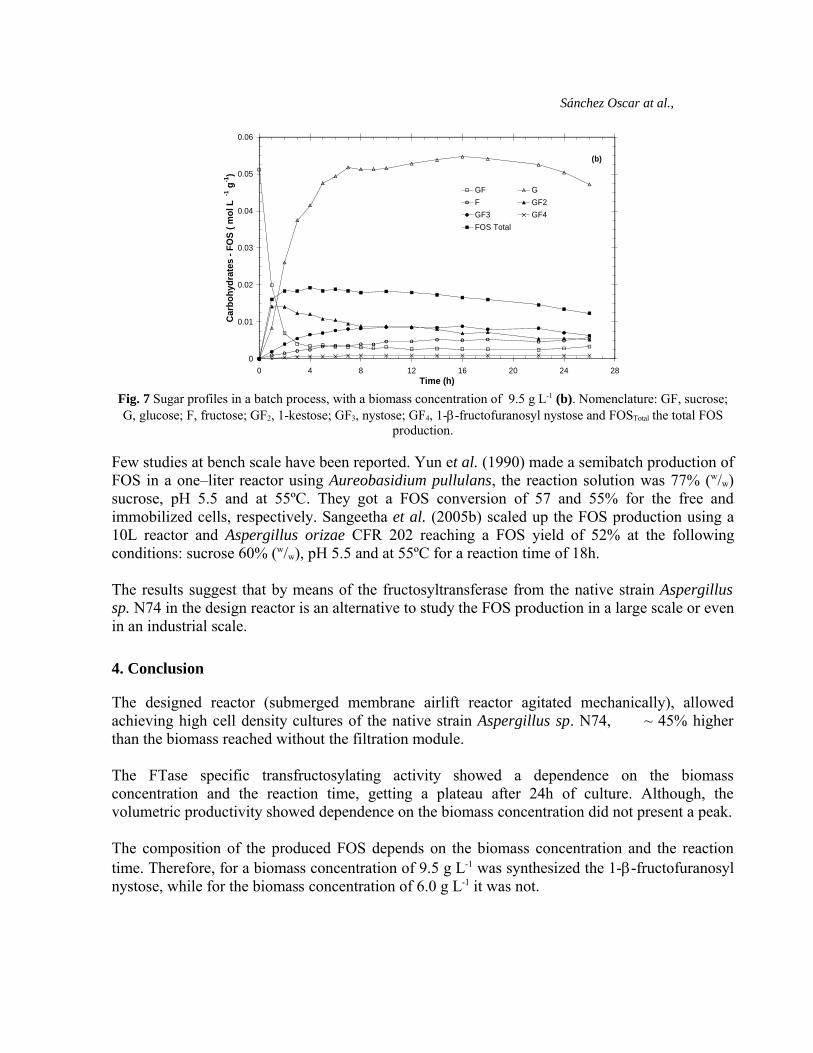
When the enzyme reaction was carried out with the biomass concentration in a dried basis of 9.5g L-1 (Fig.7), 94% of the initial sucrose concentration was biotransformed in the first 4 hours ofreaction, with a remnant of 5.2 and 4% of sucrose and fructose, respectively. But at the end of the
0
5
10
15
20
25
0 10 20 30 40 50Time (h)
UtS
, UhS
( μm
ol m
in-1
mg-1
)
0
50
100
150
200
250
300
350
UtE
, UhE
( μm
ol m
in-1
mL-1
)

Sánchez Oscar at al.,
reaction time (26h), the sucrose and fructose remnant was 8.2 and 10.1%, respectively. Thisbehaviour could be due to the fact that the fructosyltransferase enzyme has a Ping-pongmechanism, which can produce sucrose from FOS (Crittenden and Playne, 1996; Yun, 1996).Among the FOS produced at this biomass concentration was the 1-β-fructofuranosyl nystose.The FOS profiles showed a high biotransformation of nystose from 1-kestose in the second hour,nevertheless the biotransformation of 1-β-fructofuranosyl nystose from nystose was not high andkept constant. In the first 4 hours of reaction, the YFOS was 76% (43% 1-kestose, 29% nystose and4% 1-β-fructorianosyl nystose), while at the end of the reaction time the YFOS was 57% (18% 1-kestose, 33% nystose and 6% 1-β-fructofuranosyl nystose). The FOS yield decayed possibly bythe fact that after the first 4 hours of reaction the high glucose concentration in the mediuminactivated the FTase increasing the hydrolytic activity over the FOS produced, this behaviourled to an increase in the free fructose and sucrose concentration in the medium (Hirayama et al.,1989; Song and Jacques, 1999). It is noticed, that at 9.5 g L-1 biomass concentration is importantto control reaction time, in order to get a considerable sucrose bioconversion to FOS and tohandle their composition.
0.00
0.01
0.02
0.03
0.04
0.05
0.06
0.07
0.08
0.09
0 4 8 12 16 20 24 28Time (h)
Car
bohy
drat
es -
FOS
( m
ol L-1
g-1)
GF G
F GF2
GF3 FOS Total
(a)
Fig. 6 Sugar profiles in a batch process, with a biomass concentration of 6.0 g L-1. Nomenclature: GF, sucrose; G,glucose; F, fructose; GF2, 1-kestose; GF3, nystose; GF4, 1-β-fructofuranosyl nystose and FOSTotal the total FOS
production.
Sánchez Oscar at al.,
0
0.01
0.02
0.03
0.04
0.05
0.06
0 4 8 12 16 20 24 28Time (h)
Car
bohy
drat
es -
FOS
( mol
L-1
g-1
)
GF GF GF2GF3 GF4FOS Total
(b)
Fig. 7 Sugar profiles in a batch process, with a biomass concentration of 9.5 g L-1 (b). Nomenclature: GF, sucrose;G, glucose; F, fructose; GF2, 1-kestose; GF3, nystose; GF4, 1-β-fructofuranosyl nystose and FOSTotal the total FOS
production.
Few studies at bench scale have been reported. Yun et al. (1990) made a semibatch production ofFOS in a one–liter reactor using Aureobasidium pullulans, the reaction solution was 77% (w/w)sucrose, pH 5.5 and at 55ºC. They got a FOS conversion of 57 and 55% for the free andimmobilized cells, respectively. Sangeetha et al. (2005b) scaled up the FOS production using a10L reactor and Aspergillus orizae CFR 202 reaching a FOS yield of 52% at the followingconditions: sucrose 60% (w/w), pH 5.5 and at 55ºC for a reaction time of 18h.
The results suggest that by means of the fructosyltransferase from the native strain Aspergillussp. N74 in the design reactor is an alternative to study the FOS production in a large scale or evenin an industrial scale.
4. Conclusion
The designed reactor (submerged membrane airlift reactor agitated mechanically), allowedachieving high cell density cultures of the native strain Aspergillus sp. N74, ~ 45% higherthan the biomass reached without the filtration module.
The FTase specific transfructosylating activity showed a dependence on the biomassconcentration and the reaction time, getting a plateau after 24h of culture. Although, thevolumetric productivity showed dependence on the biomass concentration did not present a peak.
The composition of the produced FOS depends on the biomass concentration and the reactiontime. Therefore, for a biomass concentration of 9.5 g L-1 was synthesized the 1-β-fructofuranosylnystose, while for the biomass concentration of 6.0 g L-1 it was not.

Sánchez Oscar at al.,
The best reaction time for the bath FOS production with a biomass concentration of 6.0 and 9.5 gL-1 was 24 and 4h, respectively. For each case the FOS concentration was 378 and 427 g L-1,respectively.
The designed reactor and fructosyltransferase from the native strain Aspergillus sp. N74 can beconsidered as an industrial alternative for the fructooligosaccharides production.
References
Biedrzycka, E. and Bielecka, M. (2004). Prebiotic Effectiveness Of Fructans Of Different Degrees OfPolymerization. Trends Food Sci. Technol. 15:170–175Casas López, J.L., Sánchez Pérez, J.A., Fernández Sevilla, J.M., Rodríguez Porcel, E.M. and Chisti, Y.(2005). Pellet morphology, culture rheology and lovastatin production in cultures of Aspergillus terreus.J. Biotechnol. 116:61–77.
Chang, H., Yoo, I. and Kim, B. (1994). High density cell culture by membrane-based cell recycle.Biotechnol. Adv. 12:467–487
Crittenden, R.G. and Playne M.J. (1996). Production, properties and applications of food-gradeoligosaccharides. Trends Food Sci. Technol. 7:353–361
Fernández, R.C., Guilarte, B., Juárez, A. and Martinez, J. (2004). Production of fructooligosaccharidesby β-fructofuranosidase from Aspergillus sp 27H. J. Chem. Technol. Biotechnol. 79:268–272.
Heyer, A.G. and Wendenduerg, R. (2001). Gene cloning and functional characterization by heterologousexpression of the fructosyltranferase of Aspergillus sydowy IAM 2544. Appl. Environ. Microbiol.67:363–370
Hidaka, H., Hirayama, M. and Sumi, N. (1988). A fructooligosaccharide-producing enzyme fromAspergillus niger ATCC 20611. Agric. Biol. Chem. 52:1181–1187
Hirayama, M., Sumi, N. & Hidaka, H. (1989) Purification and properties of fructo-oligosaccharidesproducing beta-fructofuranosidase from Aspergillus niger ATCC 20611. Agric. Biol. Chem.53:667–673.Kaplan, H. and Hutkins, R.W. (2000). Fermentation of fructooligosaccharides by lactic acid bacteria andbifidobacteria. Appl Environ Microbiol, 66:2682–2684
Kühbauch, W. (1972). Veränderungen der Gehalte an Glucose, Fructose, Saccharose und Fructosansowie des Polymerisationsgrades von Fructosanmolekülen in Blättern und Stengeln einigerKnaulgrassorten während des Wachstums. Landwirtsch. Forsch. 26, 2:173–181
Madlová, A., Antosová, M., Baráthová, M., Polakoviè, M., Stefuca, V. and Báles, V. (1999). Screeningof microorganisms for transfructosylating activity and optimization of biotransformation of sucrose tofructooligosaccharides. Chem. Papers. 53(6):366–369
Sánchez Oscar at al.,
Nguyen, Q.D., Mattes, F., Hoschke, Á., Rezessy-Szabó, J. and Bhat, M.K. (1999). Production,purification and identification of fructooligosaccharides produced by β-fructofuranosidase fromAspergillus niger IMI 303386. Biotechnol. Lett. 21:183–186
Paul, G.C. and Thomas, C.R. (1998). Characterisation of mycelial morphology using image analysis.Adv. Biochem. Eng. 60, 1–59.
Rodríguez-Porcel, E.M., Casas-López, J.L., Sánchez-Pérez, J.A., Fernández-Sevilla, J.M. and Chisti, Y.(2005). Effects of pellet morphology on broth rheology in fermentations of Aspergillus terreus. Biochem.Eng. J. 26:139-144.
Roberfroid, M.B. and Delzenne, N.M. (1998). Dietary fructans. Annu. Rev. Nutr. 18:117–143Sánchez, O.F. Estudio De La Producción De Fructosiltransferasa Mediante Un Aislado Nativo DeAspergilllus sp. A Partir De Sacarosa En Un Reactor De Membrana A Escala Banco. M.Sc. ChemicalEngineering Thesis, Universidad Nacional de Colombia, Sede Bogotá, 2006.
Sangeetha, P.T., Ramesh, M.N. and Prapulla, S.G. (2005a). Fructooligosaccharide production usingfructosyl transferase obtained from recycling culture of Aspergillus oryzae CFR 202. Process Biochem.40:1085–1088
Sangeetha, P.T., Ramesh, M.N. and Prapulla, S.G. (2005b). Maximization of fructooligosaccharideproduction by two stage continuous process and its scale up. J. Food Eng. 68:57–64
Song, D.D. and Jacques, N.A. (1999). Purification and enzymic properties of the fructosyltransferase ofStreptococcus salivarius ATCC 25975. Biochem. J., 341:285–291
Yamashita, K., Kawai, K. and Itakura M. (1984). Effects of fructooligosaccharides on blood glucose andserum lipids in diabetic subjects. Nutr. Res. 4:961–966
Yun J.W., Jung, K.H., Oh, J.W. and Lee, J.H. (1990). Semibatch production of fructo-oligosaccharidesfrom sucrose by immobilized cells of Aureobasidium pullulans. Appl. Biochem. Biotechnol. 24/25:299–308
Yun, J.W. (1996). Fructooligosaccharides – occurrence, preparation, and application. Enzyme Microb.Technol. 19:10–117