front cover - cooper energy · 1 cooper energy finds, develops and commercialises oil and gas. we...
TRANSCRIPT


Front cover:
The Sole and Manta gas fields in the Gippsland Basin offshore Victoria hold 2C Contingent Resources totalling 317 PJ of gas, offering eastern Australian gas customers a competitive supply source from 2019. Cooper Energy is working to commercialise these fields for supply via the Orbost Gas Plant in which it holds a 50% interest.
Cooper Energy Limited ABN 93 096 170 295
Reporting Period, Terms and Abbreviations
Annual ReportThis document has been prepared to provide shareholders with an overview of Cooper Energy Limited’s performance for the 2015 financial year and its outlook. The Annual Report is mailed to shareholders who elect to receive a copy and is available free of charge on request (see Shareholder Information printed in this Report).
The Annual Report and other information about the company can be accessed via the Company’s website at www.cooperenergy.com.au
Notice of MeetingThe 2015 Annual General Meeting of Cooper Energy Limited ABN 93 096 170 295 (Company) will be held at 10.30 am (Australian Central Daylight Saving Time) on Thursday, 12 November 2015 in the PwC Building, Level 11, 70 Franklin Street, Adelaide, South Australia.
A formal Notice of Meeting has been mailed to shareholders. Additional copies can be obtained from the Company’s registered office or downloaded from its website at www.cooperenergy.com.au
Abbreviations and termsThis report uses terms and abbreviations relevant to the company, its accounts and the petroleum industry.
The terms “the company” and “Cooper Energy ”and “the Group” are used in this report to refer to Cooper Energy Limited and/or its subsidiaries. The terms “2015”, FY15 or “2015 financial year” refer to the 12 months ended 30 June 2015 unless otherwise stated. References to “2014”, FY14 or other years refer to the 12 months ended 30 June of that year.
Other abbreviationsbbl: barrels of oil
boe: barrels of oil equivalent
bopd: barrels of oil per day
$: Australian dollars
FEED: Front End Engineering & Design
FID: Final Investment Decision
FTE: Full Time Equivalent
km: kilometres
P & A: plugged & abandoned
PJ: petajoules
1C: Low Estimate
2C: Best Estimate
3C: High Estimate
1P: Proved Reserves
2P Reserves: Proved & Probable Reserves
3P: Proved, Probable & Possible Reserves
MMbbl: million barrels of oil
MMboe: million barrels of oil equivalent
Reserves and resources Cooper Energy reports its reserves and resources according to the SPE (Society of Petroleum Engineers) Petroleum Resources Management System guidelines (PRMS).
Reserves are those quantities of petroleum anticipated to be commercially recoverable by application of development projects to known accumulations from a given date forward under defined conditions.
Contingent Resources are those quantities of petroleum estimated, as of a given date, to be potentially recoverable from known accumulations but the applied project(s) are not yet considered mature enough for commercial development due to one or more contingencies.
In PRMS, the range of uncertainty is characterised by three specific scenarios reflecting low, best and high case outcomes from the project. The terminology is different depending on which class is appropriate for the project, but the underlying principle is the same regardless of the level of maturity. In summary, if the project satisfies all the criteria for Reserves, the low, best and high estimates are designated as Proved (1P), Proved plus Probable (2P) and Proved plus Probable plus Possible (3P), respectively. The equivalent terms for Contingent Resources are 1C, 2C and 3C.
RoundingNumbers in this report have been rounded. As a result, some figures may differ insignificantly due to rounding and totals reported may differ insignificantly from arithmetic addition of the rounded numbers presented.
1
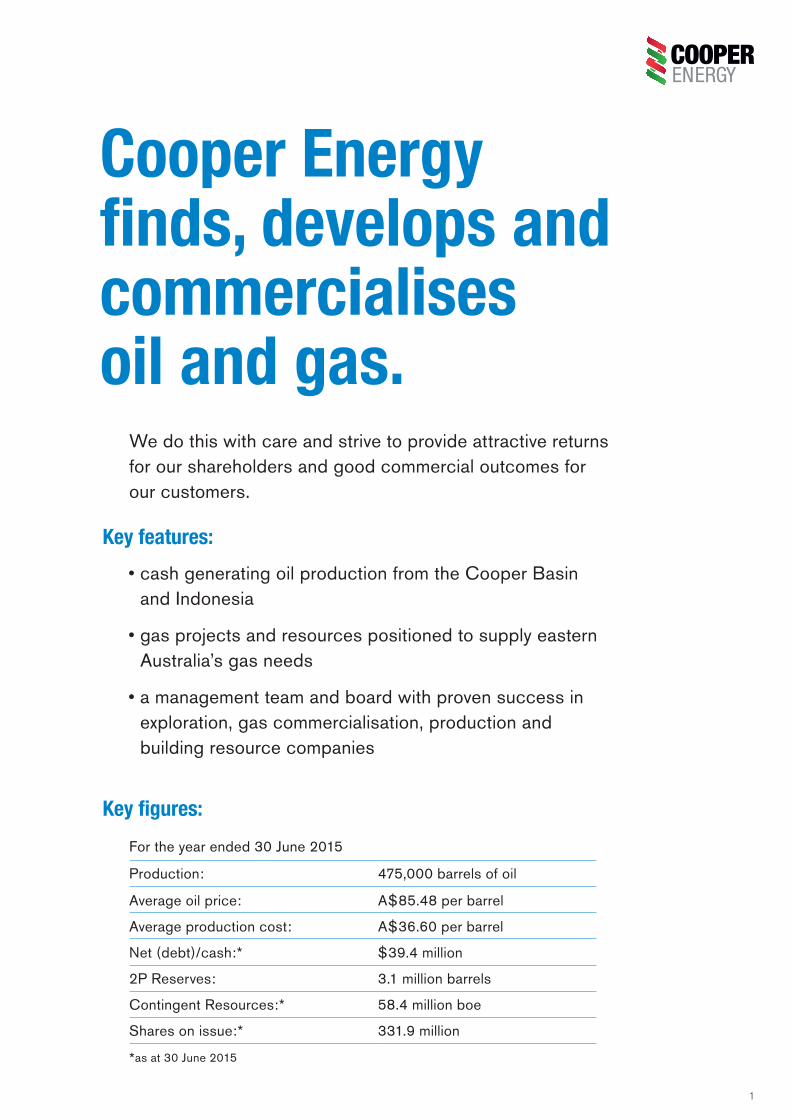
Cooper Energy finds, develops and commercialises oil and gas.
We do this with care and strive to provide attractive returns for our shareholders and good commercial outcomes for our customers.
Key features:
• cash generating oil production from the Cooper Basin and Indonesia
• gas projects and resources positioned to supply eastern Australia’s gas needs
• a management team and board with proven success in exploration, gas commercialisation, production and building resource companies
Key figures:
For the year ended 30 June 2015
Production: 475,000 barrels of oil
Average oil price: A$85.48 per barrel
Average production cost: A$36.60 per barrel
Net (debt)/cash:* $39.4 million
2P Reserves: 3.1 million barrels
Contingent Resources:* 58.4 million boe
Shares on issue:* 331.9 million
*as at 30 June 2015

2
A statutory loss after tax of $(63.5) million.Revenue and balance sheet valuations were affected by a 31% drop in average oil price.
2P Reserves increased 53% and 2C Contingent Resources increased 66%.Proved and Probable Reserves of 3.1 million barrels and 2C Contingent Resources of 58 million boe are the company’s highest yet.
The foundation for a gas business was put in place.Gas resources and processing plant were acquired, heads of agreement for gas supply negotiated and project engineering and design commenced.
Our key results for 2015 were:
3
2P Reserves million barrels of oil
2014 2015
2.0
3.1
2C Contingent Resources million boe
2014 2015
35.1
58.4
Sales Revenue $ million
72.3
39.1
2014 2015
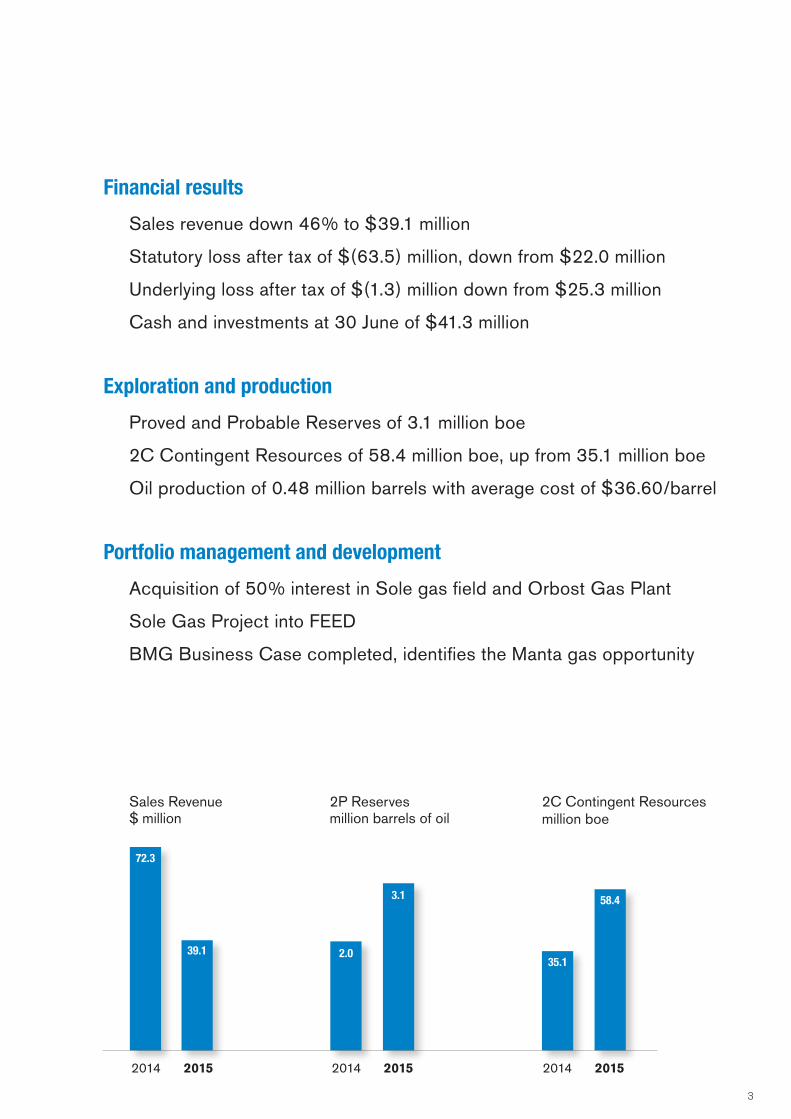
Financial results
Sales revenue down 46% to $39.1 million
Statutory loss after tax of $(63.5) million, down from $22.0 million
Underlying loss after tax of $(1.3) million down from $25.3 million
Cash and investments at 30 June of $41.3 million
Exploration and production
Proved and Probable Reserves of 3.1 million boe
2C Contingent Resources of 58.4 million boe, up from 35.1 million boe
Oil production of 0.48 million barrels with average cost of $36.60/barrel
Portfolio management and development
Acquisition of 50% interest in Sole gas field and Orbost Gas Plant
Sole Gas Project into FEED
BMG Business Case completed, identifies the Manta gas opportunity

4
Chairman’s ReportJohn Conde AO
On one hand, the year-end Reserves and Resources are the highest ever recorded by Cooper Energy. Oil reserves are 53% higher than at the beginning of the year and the company has increased its 2C Contingent Resource of gas 62% from 78 PJ to 204 PJ. In contrast, the profit and total shareholder return are the lowest recorded by the company and market capitalisation at year-end of $81 million was just under half the corresponding figure of $166 million twelve months earlier.
In presenting the 2015 Annual Report, I would like to address this disconnect between the year’s financial results and market valuation of your company and its Reserves, Resources and opportunities.
Cooper Energy’s 2015 financial results, like its peers, bear witness to the impact of the year’s lower oil price on revenue, profit and balance sheet valuations.
Price volatility is an inherent feature of commodity markets and variation between periods is the norm. However, in 2015 oil prices were not only the lowest for several years, but the price movement was particularly severe. Cooper Energy’s average price of A$85.48 per barrel was the lowest received by the company in 9 years. Moreover, this price was 31% lower than the previous year’s figure, the largest annual decline in the company’s 13 year history. This substantial price change brought substantial adjustments to profitability, balance sheet valuations and investor sentiment across the oil and gas sector.
In Cooper Energy’s case, the statutory loss of $(63.5) million for the 12 months to June 2015 was recorded after significant items of
$(62.2) million. The underlying loss prior to significant items of $(1.3) million compares to the previous year’s underlying profit after tax of $25.3 million.
It is relevant to note that operations are still cash positive; not only at the oil prices that prevailed in 2015 but also at the lower prices recorded since year end. This reinforces the merit of the company’s strategy to focus on production assets at the low end of the cost curve. The surplus being generated by our oil operations is being applied to the company’s strategy of identifying and developing additional low cost oil reserves and establishing a gas business supplying eastern Australia.
Both of these strategic objectives were met in 2015. The growth in reserves and progress in establishing the gas business were the highlights and the most significant outcomes of the year. Put simply, these outcomes mean Cooper Energy has substantially increased its stock of physical resources for future revenue and profit generation.
The resources in hand, and their associated development plans, provide the opportunity to increase production and revenue several times current levels in the coming four to six years. Furthermore, the addition of the stable, long term cash flows typically generated by gas contracts will mitigate the impact of oil price shocks such as was experienced in 2015.
The Managing Director has outlined the initiatives taken and the assets involved to build this position in his report.
The results and year-end position documented in this report are typical of the juxtaposition of short term returns and sustainable value creation that often occurs in growing resource companies and can try the patience of shareholders.

5
This position has been achieved with relatively low capital outlay to date, through a combination of long term vision, assiduous analysis, patient execution and a respect for shareholder capital.
Fulfilment of the company’s strategy will, as the Managing Director outlines, require further expenditure. The company has evaluated the range of funding options available to meet these future commitments. The selection of funding options and timing will be driven by the shareholder value imperative that has informed its gas strategy execution to date.
Ongoing review and management of the company’s portfolio will remain an essential element of this process so that resources and efforts are concentrated on those assets that are consistent with strategy and offer the most attractive long term return on shareholder funds.
The board has no doubt that the resources in place, and projects in train, can deliver a substantial and attractive return to shareholders. Whilst first income from the Gippsland Gas Projects could occur from January 2019, it is expected that equity market interest and valuation of the project will rise as project milestones are met in the intervening period.
Safety is an area where the year-on-year trend was disappointing. It is the view of your board that safety is an absolute, not a relative, value: it is not acceptable for a single person to be exposed to injuries as a result of company operations. We believe we have strengthened our processes and safety systems to support this.
The increased recordable case frequency rates in 2015 came at the same time as an increased investment in management and reporting of safety, particularly in Indonesia where the large majority of ‘man-hours’ occur. Industry history shows that a rise in reportable cases is a common corollary of lifting awareness of safety and improving the accessibility and effectiveness of reporting systems. Nevertheless, improved awareness must be translated into improved results and the board is resolved this be realised.
Your company has concluded 2015 with a much stronger asset base, and with promising opportunities, notwithstanding the impact of the oil price on financial results and equity market valuations. The progression of those opportunities through the milestones of project definition, investment decision, financing and commissioning represent an exciting future for Cooper Energy and its shareholders over the next few years. I am confident that under the leadership of David Maxwell, and with our senior management team, we will be successful in these opportunities. Your board is determined that this position is translated into the best value outcome for shareholders.
On behalf of shareholders I would like to thank my fellow directors and all employees for their service and contribution to the company.
John Conde AO
Chairman
Orbost Gas Plant, Gippsland Basin, Victoria

6
Managing Director’s ReportDavid Maxwell
At the time, the new strategy was a profound change for a company which had no Australian gas resources and had been applying the cash flow from its Cooper Basin oil operations to fund international exploration in diverse locations. Apart from the restructuring of the portfolio this necessitated, the change brought a heightened emphasis on commercial and technical fundamentals and sustainable total shareholder returns, saw the relocation of the corporate office and employment of a new management team and the reconstitution of the board of directors.
Our focus on conventional gas resources that were then uneconomic, but located close to existing gas operations, was somewhat out of step with market trends at the time. Large unconventional gas resources were attracting funding and enthusiastic investor interest. This meant that Cooper Energy, equipped with the advantage of being an ‘early-mover’, was able to secure the gas assets it had targeted at good value for our shareholders.
Market context and strategyAs this report documents, the company’s strategy execution has aligned with market trends, which are transpiring as expected. Contracted supply of gas to eastern Australia remains well below forecast demand in the region for the period from 2019 onwards. Customer demand and price forecasts continue to be supportive of the strategy and in line with our forecasts. In this context, the company has secured the gas resources, gas plant and first Heads of Agreement for sales to establish a gas business to meet the market opportunity. Our strategic focus has now shifted from resource acquisition to project maturation, development and delivery.
Pleasingly, this has been achieved without compromising the historical ‘engine room’ of the business, our cash generating oil production. Our production of 475,000 barrels in 2015 was comparable with the company’s average for the past 5 years and year-end oil reserves are the highest yet for Cooper Energy.
The lower oil prices experienced since September 2014 have been the major influence on the financial results documented in this report and, by far, the principal reason for the year’s lower revenue, earnings, cash flow and asset value impairments.
Cooper Energy’s oil production is cash generating at current prices, with anticipated FY16 operating costs, including transport and royalties, of $A38 per barrel. Our efforts to reduce production costs and all other costs in our business without compromising our health, safety, community and environmental standards are ongoing. Low cost, cash generating, oil production is a critical element of our business model and the protection of this is discussed further under the heading ‘2016 outlook’ at the conclusion of this report.
CareThe company has two key requirements for all of its activities and plans: that they deliver sustainable, acceptable shareholder return and that they be performed with due care for the people, environments and communities who may be affected. A report on the key sustainability related elements of our operations is provided on page 21 of this report.
It is disappointing to report that one lost time injury and a small number of recordable incidents occurred in the financial year.
This is the third annual report since Cooper Energy adopted a new strategy whereby cash generated from its oil production would be invested to establish a gas business so shareholders could participate in the value creation anticipated from meeting supply opportunities foreseen in eastern Australia from 2016 onwards.

7
The company has been proactive in analysing the root causes and implications of these incidents to help avoid reoccurrence. Investment has been increased in the establishment of culture and continuous improvement systems that will support our ultimate objective of zero incident-zero injury operations.
Financial resultsAnalysis and discussion of the financial results for the year is provided in the Operating and Financial Review which commences on page 28. In essence, the 2015 profit comprises two elements.
1. A statutory loss of $(63.5) million which includes significant non-operating items of $(62.2) million.
As detailed in the Operating and Financial Review, the significant non-operating items principally relate to: adjustments of $(47.6) million before tax made to the valuation of the Tunisian assets which are the subject of a divestment process; and impairments of $(14.6) million to the carrying value of PPL 207, an oil producing asset in the Cooper Basin and non-core acreage in the Otway Basin.
2. An underlying (ie exclusive of significant non-operating items) loss of $(1.3) million. The year’s lower oil prices and volumes reduced gross profit, which was $14.1 million compared with $46.2 million in 2014. Expenditure incurred to support the development of the gas business resulted in the small loss.
Balance sheet and financeDetailed discussion on the balance sheet, cash generation and movements for the year are provided in the Operating and Financial Review. As at 30 June the company held cash and financial assets of $41.3 million. Financial assets are supplemented by financial facilities of $40 million, which are subject to conditions.
Reserves and explorationA report on the year’s exploration and development activities and Reserves and Resources, has been provided by the Executive Director – Exploration & Production, Hector Gordon, commencing on page 12.
There are a number of items of significance I highlight and comment upon.
First, action taken by the company to preserve cash in the low oil price environment resulted in the number of wells drilled and capital expenditure being substantially below guidance at the start of the year. Cooper Energy participated in 9 wells and committed capital expenditure of $27.4 million for the year, which compares to the plan of 18 wells and capital expenditure guidance of $40 million originally announced.
Second, notwithstanding reduced capital expenditure, the company recorded its highest year-end Reserves and Resources results. Proved and Probable Reserves rose by 53% and 2C Contingent Resources rose by 66%.
The increase in Proved and Probable Reserves is largely the outcome of low-risk drilling which targeted potential identified in well-established producing fields.
In Indonesia, the company continued its appraisal and development program to address potential identified in the Tangai-Sukananti KSO. Whilst this program has delivered incremental gains in previous years, the results of Bunian-3 during the year were transformational for the Indonesian operations, leading to: reserves in the Tangai-Sukananti KSO more than trebling; a 147% rise in daily production; and the identification of further potential. The assessment of some of that potential was addressed after year-end with the Bunian-4 appraisal/development well. Results of the well, which was completed as an oil producer, are currently being assessed.
In the Cooper Basin, a number of existing fields have continued to outperform expectations. The implications of this, and the successful development drilling at Callawonga, resulted in additions to reserves which replaced 120% of the year’s production from its main producing area, PRLs 85-104. This was offset in part by performance-based writedowns to the Worrior field in PPL 207. Worrior accounted for 6% of the company’s production from the Cooper Basin for the year.

8
Gippsland Basin gas projectsThe progress of the company’s gas strategy during the year means it is now positioned to deliver on the objective of establishing a significant gas business supplying eastern Australian customers in the foreseeable future.
These events and achievements included:
- the acquisition of a 50% interest in the Sole gas field in VIC RL/3 offshore Victoria. Sole is an undeveloped gas field with marketable quantities of gas that are assessed to be economic at forecast gas prices. Santos Limited is the Operator and other interest holder in VIC RL/3. The Sole gas field was assessed to hold gross Contingent Resources of 211 PJ (2C) of gas.
- the acquisition of a 50% interest in the Orbost Gas Plant, an onshore gas processing plant connected to the Eastern Gas Pipeline which links Victoria and New South Wales. The plant, commissioned in 2003, previously processed gas from the Patricia-Baleen and Longtom gas fields. Santos Limited is the Operator and other interest holder in the Orbost Gas Plant.
- commitment of the Sole Gas Project to Front End Engineering and Design (FEED) for a Final Investment Decision (FID) during the September quarter of 2016. The FEED process is focussing on a stand-alone development, with gas transported by sub-sea pipeline to the Orbost Gas Plant.
- completion of the BMG Business Case, with the identification of an economic opportunity for development of the Manta gas field, with gas produced being exported to the Orbost Gas Plant. Subsequent to year end, the VIC/L26, L27 and L28 joint venture agreed to progress appraisal planning and further feasibility studies.
- subsequent to year-end, the signing of the first sales agreement for gas from Sole, a Heads of Agreement with O-I Australia.
In essence, the progress made means Cooper Energy has two marketable and competitive gas resources, Sole and Manta, plus equity in a gas plant ideally placed to process gas from these or other offshore Gippsland Basin fields, at a time when gas supply to eastern Australia is forecast to tighten and gas prices forecast to rise.
Successful passage through the stages of project design and definition, construction and
development could see Sole producing gas from the January quarter of 2019 and Manta from the middle of the 2021 calendar year.
The immediate focus in the twelve months to June 2016 will be the completion of Sole FEED, securing further gas sales contracts and the completion of feasibility studies and appraisal well planning for the Manta gas opportunity.
Negotiation of heads of agreement for further gas sales is currently in progress. It is expected that this process will result in the large majority of Cooper Energy’s share of Sole gas being the subject of bankable contracts prior to FID.
Bank sourced project finance enabled by these contracts is one of a number of funding options expected to be available to Cooper Energy. A detailed analysis of the funding options and combinations available was completed during the year and has provided the basis of a project funding plan which is ready for implementation.
The company expects to announce definitive estimates of project cost and proposed funding structures for the Sole project prior to the FID in the September quarter of 2016.
PortfolioManagement of the company’s portfolio is an ongoing process to ensure it is exposed to, and directing its resources to, those opportunities expected to provide the best risk-weighted return for shareholders. This is a long term, ongoing process due to the time involved in bidding for, and divesting, licences and the discipline required for the protection of shareholder funds.
In Cooper Energy’s case, this has meant researching and acquiring assets that offer competitive gas supply to eastern Australia and the divesting or withdrawal from acreage that does not align with our strategy.
In 2015, the addition of the Gippsland Basin acreage VIC RL/3 and the Orbost Gas Plant was the most significant change in the company’s portfolio. These assets, when combined with the nearby VIC /L26, L27, and L28 acquired in 2014 mean that the company is now one of the larger interest holders in the region. In addition, the company is the major shareholder in Bass Strait Oil Company Limited (with a 22.6% interest) which holds acreage adjacent to Cooper Energy’s interests.
Managing Director’s ReportDavid Maxwell

9
Cooper Energy was not able to complete the divestment of Tunisian acreage foreshadowed in the previous year’s annual report. The collapse in oil prices during the year effectively deferred interest in offshore oil exploration acreage transactions, a situation which was subsequently compounded by geopolitical events in the region. The divestment process has yet to generate acceptable offers.
The company has been seeking to defer and limit further capital expenditure on non-core assets wherever feasible. Accordingly, Cooper Energy did not extend the Nabeul permit which has now expired and is continuing efforts to divest and reduce commitments in the Bargou and Hammamet permits as soon as practicable.
Human ResourcesThe company’s workforce is developing in line with the needs of its strategy and asset base.
At year-end Cooper Energy employed 22 full time equivalent (FTE) employees in Australia and a further 50 persons internationally, principally Indonesia, compared to 21 FTE in Australia and 47 internationally at the beginning of the year.
2016 OutlookPrevailing oil prices are continuing to challenge the returns of the petroleum exploration and production sector and the interest and sentiment it is afforded by the investment community. Moreover, the flow-on effects of this on the broader oil and gas sector’s capital expenditure can also be expected to compromise the availability of new projects to drive its growth in the longer term.
Your company, however, is well placed to endure these conditions and to emerge from the 2016 year with growth projects underway.
Cooper Energy has entered the new financial year in a strong position, expecting stable or slightly higher production and the achievement of milestones which significantly advance its gas business. Gas market conditions and developments have continued to reinforce the merits of the company’s strategy and the prospects of its gas projects.
The company’s efforts in 2016 will essentially be directed towards 3 broad objectives:
1) maintaining and optimising the returns from near term production.
It is expected that production for the year will fall within the range of 450,000 to 550,000 barrels, in line with historical trends. This will include the drilling of exploration and development wells in the Cooper Basin.
2) progressing the Gippsland Gas Projects.
For Sole, the completion of FEED and the securing of gas contracts will enable project definition for a Final Investment Decision in the first half of the 2017 financial year, and the finalisation of the most suitable funding arrangements. The Manta gas project will be conducting further feasibility studies and analysis and planning for appraisal drilling that may be required.
3) ensuring the company’s costs and expenditure are ‘right-sized’ for a lower oil price environment while retaining the capacity to execute our longer term growth projects and exploration programs.
While the company’s cash operating cost is within current prices, prudent management dictates that our structures be ‘sea-worthy’ for greater volatility and lower prices.
All costs and activities are being reviewed on an ongoing basis. Costs and staffing levels are subject to ongoing review and refinement for appropriateness for prevailing oil prices whilst ensuring that the resources necessary for excellent project delivery are in place and applied most efficiently.
The company maintains a hedging program to manage downside exposure to oil price volatility. Hedging is reviewed on an ongoing basis and reported in our quarterly reports to the ASX and other company announcements.
Cooper Energy is now very well placed to deliver on the opportunities we have before us to safely build sustainable shareholder returns.
David Maxwell Managing Director

10
Cooper Energy’s 2P Reserves as at 30 June 2015 are assessed to be 3.1 million barrels of oil (MMbbl). This represents an increase of 1.1 MMbbl from 30 June 2014, driven by reserve increases in the Bunian and Callawonga fields, offset by production and a reduction of assessed reserves in the Patchawarra Formation in the Worrior Field.
Petroleum Reserves at 30 June 2015 (MMbbl)
Category Proved (1P)
Proved & Probable (2P)
Proved, Probable & Possible (3P)
Australia Indonesia Total Australia Indonesia Total Australia Indonesia Total
Developed 0.84 0.62 1.46 1.16 1.02 2.18 1.48 1.61 3.09
Undeveloped 0.22 0.30 0.52 0.22 0.68 0.90 0.26 1.47 1.73
Total 1.06 0.92 1.97 1.38 1.70 3.08 1.74 3.08 4.82
Year-on-year movement in Petroleum Reserves (MMbbl)
Category Proved (1P)
Proved & Probable (2P)
Proved, Probable & Possible (3P)
Reserves at 30 June 2014 0.85 2.01 3.42
FY15 Production 0.48 0.48 0.48
Revisions 1.60 1.54 1.87
Reserves at 30 June 2015 1.97 3.08 4.82
Contingent Resources2C Contingent Resources at 30 June 2015 are assessed to be 58.4 MMboe. This represents a 66% increase of 23.3 MMboe from 30 June 2014. The key revisions are the acquisition of the Sole field and the re-evaluation of the Manta field that have added 20.4 MMboe in the Gippsland Basin to 30 June 2015.
Contingent Resources at 30 June 2015 (MMboe)
Category 1C 2C 3C
Gas Oil Total Gas Oil Total Gas Oil Total
PJ MMbbl MMboe PJ MMbbl MMboe PJ MMbbl MMboe
Australia 129.7 2.7 25.0 197.0 5.2 38.8 259.3 8.5 53.0
Indonesia 0.9 1.1 1.3 1.7 2.3 2.6 3.4 4.8 5.4
Tunisia 1.7 8.6 8.9 5.6 16.1 17.0 18.5 36.3 39.5
Total 132.3 12.5 35.2 204.3 23.6 58.4 281.2 49.6 97.9
Year-on-year movement in 2C Contingent Resources (MMboe)
Category Australia Indonesia Tunisia Total
Resource at 30 June 2014 18.0 0.0 17.0 35.1
Revisions 20.7 2.6 0.0 23.3
Resource at 30 June 2015 38.8 2.6 17.0 58.4
Reserves & Resources

11
Notes on calculation of Reserves and Resources
Calculation of reserves and resources
- The approach for all reserve and resource calculations is consistent with the definitions and guidelines in the Society of Petroleum Engineers (SPE) 2007 Petroleum Resources Management System (PRMS). The resource estimate methodologies incorporate a range of uncertainty relating to each of the key reservoir input parameters to predict the likely range of outcomes. Project and field totals are aggregated by arithmetic and probabilistic summation. Aggregated 1P and 1C may be a conservative estimate and aggregated 3P and 3C may be an optimistic estimate due to the effects of arithmetic summation. Totals may not exactly reflect arithmetic addition due to rounding.
Reserves
- The Cooper Basin totals comprise the probabilistically aggregated PEL 92 project fields and the arithmetic summation of the Worrior project reserves. The total includes 0.05 MMbbl oil reserves used for field fuel. The Indonesia totals include removal of non-shareable oil (NSO) and comprise the probabilistically aggregated Tangai-Sukananti KSO project fields. Totals are derived by arithmetic summation.
Contingent Resources
- The Contingent Resource assessment includes resources in the Gippsland Basin, in PRLs 85-104 and PEL 90K in the Cooper Basin, the Tangai-Sukananti KSO, Indonesia and in the Hammamet West field in the Bargou Permit and Tazerka field in the Hammamet Permit, offshore Tunisia. The following assessments have been released to the ASX: Basker field on 18 August 2014, Manta field on 16 July 2015, Sole field on 25 May 2015 and Hammamet West field on 28 April 2014. Cooper Energy is not aware of any new information or data that materially affects the information provided in those releases, and all material assumptions and technical parameters underpinning the estimates provided in the releases continue to apply.
- Contingent Resource in the Sole field in VIC/RL3, Gippsland Basin, offshore Victoria, have been assessed by Santos Limited as Operator and documented in the Operator’s Preliminary Field Development Plan (2013) and refreshed in May 2015 as part of the pre-FEED process. The Contingent Resources have been assessed using probabilistic simulation modelling for the Kingfish Formation at the Sole Field. The conversion factor of 1 PJ = 0.172 MMboe has been used to convert from Sales Gas (PJ) to Oil Equivalent (MMboe).
- Contingent Resources in the Basker field in VIC/L26 and VIC/L28, Gippsland Basin, offshore Victoria, have been assessed using deterministic simulation modelling for the Intra-Latrobe Group. Contingent Resources for the Basker field reservoirs have been aggregated by probabilistic summation. The conversion factor of 1 PJ = 0.172 MMboe has been used to convert from Sales Gas (PJ) to Oil Equivalent (MMboe).
- Contingent Resources in the Manta field in VIC/L26, VIC/L27 and VIC/L28 Gippsland Basin, offshore Victoria, have been assessed using deterministic simulation modelling and probabilistic resource estimation for the Intra-Latrobe and Golden Beach Sub-Group. Contingent Resources for the Manta field reservoirs have been aggregated by probabilistic summation. The conversion factor of 1 PJ = 0.172 MMboe has been used to convert from Sales Gas (PJ) to Oil Equivalent (MMboe).
- Contingent Resources in the Hammamet West field in the Bargou permit, offshore Tunisia, have been assessed using probabilistic Monte Carlo statistical methods. Conversion factors for the Hammamet West field are 1 boe = 5,620 scf.
Qualified petroleum reserves and resources evaluator The information on Cooper Energy’s petroleum reserves and resources assessment is based on and fairly represents information and supporting documentation reviewed by Mr Andrew Thomas who is a full-time employee of Cooper Energy Limited holding the position of Exploration Manager, holds a Bachelor of Science (Hons), is a member of the American Association of Petroleum Geologists and the Society of Petroleum Engineers, and is qualified in accordance with ASX listing rule 5.41 and has consented to the inclusion of this information in the form and context in which it appears.

12
Review of OperationsHector Gordon
Hector Gordon Executive Director – Exploration & Production
Cooper Energy’s operations primarily comprise:
• Oil production in the Cooper Basin (onshore Australia) and the South Sumatra Basin (onshore Indonesia);
• Pre-development activities associated with the Sole and Manta gas fields in the offshore Gippsland Basin;
• Exploration for oil and gas in the Cooper, Otway, Gippsland and South Sumatra basins.
Highlights of the year’s activities were:
• Acquisition of 50% in interest in Sole gas field and Orbost Gas Plant (Gippsland Basin);
• Completion of the BMG Business Case indicating that development of Manta gas resource is economically feasible;
• Bunian-3 results increased reserves by 1.2 MMbbl in the Bunian oil field, Sumatra.Callawonga oil field, Cooper
Basin, South Australia

13
DrillingCooper Energy participated in the drilling of nine wells during the year, comprising four exploration wells and five appraisal/development wells. None of the exploration wells were successful, although one well, Akela-1, was cased and suspended to allow further evaluation and possible testing. Three of the five appraisal/development wells were successful and included the discovery of a new oil pool in the “K” Sandstone in the Bunian field and a significant reserves addition to the southern flank of the Callawonga field.
Type Area Tenement Well Result
Exploration Cooper Basin ex PEL 92 Shelly-1 P&A
ex PEL 92 Sensation-1 P&A
PEL 100 Jenners-1 P&A
PEL 110 Akela-1 Cased & Suspended 1
Appraisal Cooper Basin PPL 247 Perlubie-3 P&A
PPL 249 Elliston-2 P&A
Development Cooper Basin PPL 220 Callawonga-10 Oil Well 2
PPL 220 Callawonga-11 Oil Well 2
South Sumatra Tangai-Sukananti KSO Bunian-3 ST2 Oil Well 2
1. Cased and suspended for potential further testing
2. Cased and suspended and subsequently completed as an oil production well
Production MMbbl
2015 2014
Cooper Basin, Australia 0.40 0.54
South Sumatra, Indonesia 0.08 0.05
Total 0.48 0.59
Production Cooper Energy’s oil production for the year totalled 0.48 MMbbl, 83% of which was derived from the company’s Cooper Basin tenements. This is a 19% decrease on the previous year, primarily as a result of natural decline from the company’s Cooper Basin fields, partially offset by increased production from Indonesia arising from the success of the Bunian-3 development well.

14
Co
op
er
C
reek
100
101
102
104103
85
86
86
87
87
88
90 89 85
91
90
91
92
92
9393
94
95
96
97
97
98
9899
99
100 101
-27°40'
139°20' 139°40'
-28°
kilometres
200
Parsons
Butlers
Perlubie
Germein
Christies
Silver Sands
Callawonga
Windmill
Rincon
Rincon North
Sellicks
Lycium Hub
Callawonga-10
Sensation-1
Shelly-1
Elliston-2
Perlubie-3
Callawonga-11
PEL 93 (30%)
PRLs 85 to 104 (25%) (ex ‘PEL 92’)
Cooper_58AR1558AR15
TAS
Plan area
39 0
Cooper Energy tenement
Other tenements
Oil field
Gas field
Oil pipeline
Gas pipeline
Oil well
Plugged and abandoned well
Review of Operations
Cooper Basin Cooper Energy holds interests in four exploration licenses, twenty retention licences and eleven production licences in the South Australian Cooper Basin.
The company’s activities are primarily focussed on tenements held by the PEL 92 Joint Venture* (‘PEL 92’) on the western flank of the basin, which provided approximately 79% of Cooper Energy’s total production in FY15. Oil exploration is also being undertaken in the company’s tenements along the northern flank of the basin (PELs 90K, 100 & 110).
Cooper Energy’s share of oil production from its Cooper Basin tenements during the year totalled 0.40 MMbbl, 26% below that achieved in the previous year.
Four oil exploration wells were drilled in the Cooper Basin during the year, three of which did not encounter significant hydrocarbons and were plugged and abandoned. Akela-1 (PEL 110, Cooper Energy 20%) encountered oil shows in the Birkhead Formation, however poor hole conditions prevented testing or sampling of reservoir fluids. The well was cased and suspended to allow further evaluation and potential testing.
Four oil appraisal/development wells were drilled in the Perlubie, Elliston and Callawonga oil fields (PEL 92, Cooper Energy 25%). Perlubie-3 and Elliston-2 were both plugged and abandoned after encountering sub-commercial oil columns while Callawonga-10 and Callawonga-11 were both successful and, subsequent to the end of the year, were completed for oil production from the Namur Sandstone.
* The PEL 92 Joint Venture (Cooper Energy 25%) holds twenty Petroleum Production Licences and twenty Petroleum Retention Licenses (PRLs 85-104), all of which were originally licenced as PEL 92.

15
-28°20'
139°30' 139°40' 139°50'
-28°30'
-28°40'
kilometres
0 20
Worrior
139°30'
PPL 2071 kilometre
Inset
Worrior
Worrior-8
Worrior-10
See inset
PEL 93 (30%)
PEL 93 (30%)COOPER B
ASINWorrior-8
Worrior-10
Cooper_44AR
Cooper Energy tenement
Other tenements
Oil field
Gas field
Oil pipeline
Gas pipeline
Oil well
Oil show
kilometres
0 10 20
-27°00'
-27°
00'
140°20' 140°40'
Kiwi
Cleansweep
Keleary
Tarragon
Telopea
Dundinna 3D seismic
survey
PEL 110 (20%)
PEL 90K (25%)
PEL 100 (19.17%)
Jenners-1
Akela-1
Cooper_45AR
Cooper Energy tenement
Other tenements
Oil field
Gas field
Oil pipeline
Gas pipeline
3D seismic survey
Plugged and abandoned well
Results from the Callawonga wells contributed to an increase in the EUR (estimated ultimate recovery) for that field which has been incorporated in Cooper Energy’s year-end reserve statement.
Extended production testing of the Patchawarra Formation in Worrior-10 and Worrior-8 was undertaken during the year. The results indicated a smaller oil pool than previously interpreted and caused a reduction in Cooper Energy’s assessment of reserves in that formation. The future appraisal and development strategy of the Patchawarra Formation at Worrior will be re-assessed in FY16.
In Cooper Energy’s western flank acreage of the Cooper Basin, the PEL 92 Joint Venture merged and reprocessed the Neritus, Modiolus and Calpurnus 3D seismic surveys (590 km2). Seismic inversion of 164 km2 of the Caseolus 3D seismic survey data was also undertaken in PEL 92. In PPL 207 (Cooper Energy 30%), the Worrior field 3D (52 km2) seismic data were reprocessed.
The northern Cooper Basin permits PEL 90K (Cooper Energy 25%), PEL 100 (Cooper Energy 19.165%) and PEL 110 (Cooper Energy 20%) were the focus of the Dundinna 3D seismic survey conducted in FY14. Processing of the survey data was completed during FY15 and a seismic inversion project commenced over 595 km2 of this survey.

16
0 20
kilometres
Cooper Energy tenement
Gas field
Oil field
Gas well
Gas pipeline
Oil pipeline
Potential gas pipeline
VICTORIA
Gippsland_28AR15
Lakes Entrance
Orbost
Gummy
Patricia-Baleen
Longtom
Flounder BaskerManta
Chimaera
Fortescue
Kingfish
Tuna Kipper
Sole
MarlinSnapper
Sole-1Sole-2
VIC/L27 (65%)
VIC/L26 (65%)
VIC/RL3 (50%)
VIC/L28 (65%)
Orbost Gas Plant (50%)
Melbourne
Sydney
EASTERN GAS P
IPELINE
TAS
Plan area
Gippsland Basin Cooper Energy’s interests in the Gippsland Basins comprise:
- a 50% interest in VIC/RL3 which holds the Sole gas field;
- a 65% interest in, and Operatorship of, VIC/L26, VIC/L27 and VIC/L28 which contain the Basker and Manta oil and gas fields (“BMG”). These fields, previously developed for oil production, are currently shut-in, pending potential development for gas; and
- a 50% interest in the Orbost Gas Plant, onshore Victoria.
Sole Gas Project and Orbost Gas Plant
The company’s acquisition of a 50% interest in the Sole gas field and Orbost Gas Plant was completed on 22 May 2015. The acquisition was achieved through an initial cash payment of $2.5 million and a commitment to fund 100% of the initial $50 million of future project costs.
The Sole field is an undeveloped offshore gas resource located approximately 65km from the Orbost Gas Plant, which is connected to the Victorian and New South Wales gas markets via the Eastern Gas Pipeline. Cooper Energy assesses the Sole field to contain a Contingent Resource (2C) of 211 PJ of sales gas (100% Joint Venture).
Front End Engineering and Design (FEED) for the development of the Sole resource commenced in May and is expected to lead to a Final Investment Decision (FID) in the September quarter 2016. Development of the field is expected to comprise a single vertical subsea well and pipeline to the Orbost Gas Plant for gas supply of approximately 25 PJ per annum over 8 years commencing from early 2019.
Review of Operations
800805
805
810815
790780785
745 750
755
755760
760
765770775780785790
795
800
805
805
800
795 795
Gas well
Depth contour metres subsea (5m interval)
Fault window
GWC
Sole
Sole-1Sole-2
VIC/RL3 (50%)Inset
Gippsland 29_AR15
Sole-2
Sole-1
VIC/RL3 (50%)
0 1
kilometres
Sole Field, Latrobe Group, Top Kingfish structure map
17
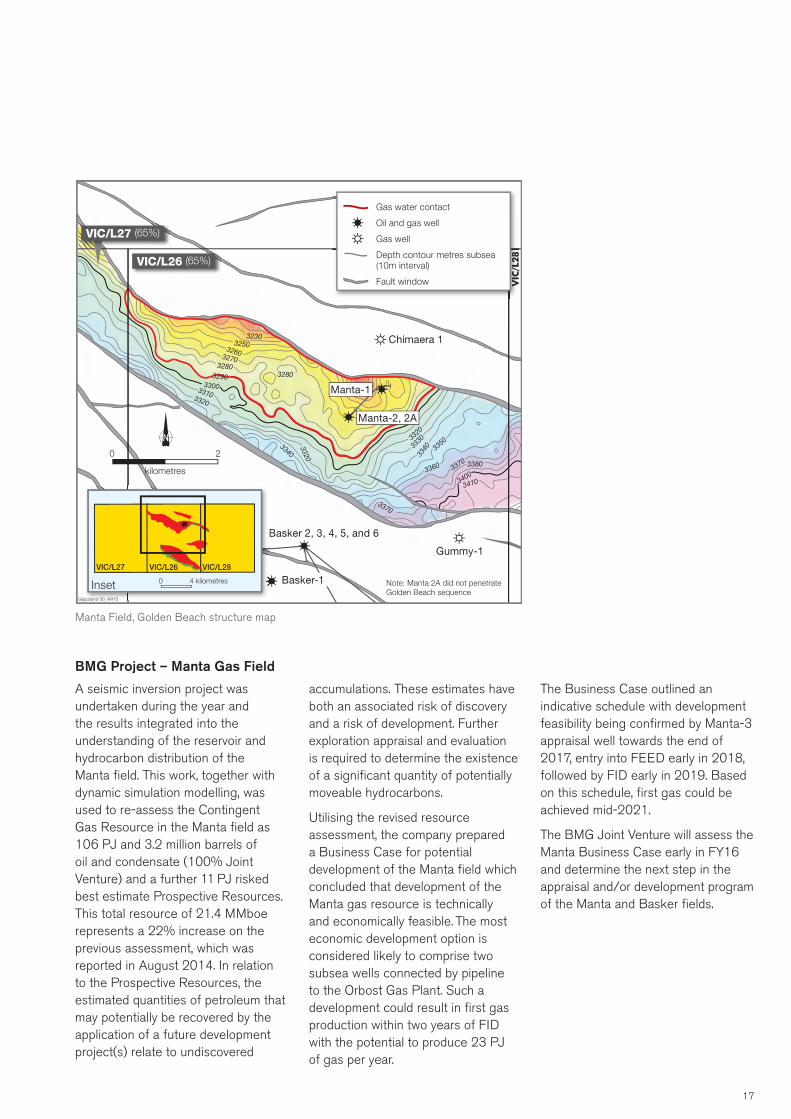
BMG Project – Manta Gas Field
A seismic inversion project was undertaken during the year and the results integrated into the understanding of the reservoir and hydrocarbon distribution of the Manta field. This work, together with dynamic simulation modelling, was used to re-assess the Contingent Gas Resource in the Manta field as 106 PJ and 3.2 million barrels of oil and condensate (100% Joint Venture) and a further 11 PJ risked best estimate Prospective Resources. This total resource of 21.4 MMboe represents a 22% increase on the previous assessment, which was reported in August 2014. In relation to the Prospective Resources, the estimated quantities of petroleum that may potentially be recovered by the application of a future development project(s) relate to undiscovered
3310
32303250
3280
3300
3320
3290
32603270
3280
3330
3320
3340 3340 33
50
3360 337
0
3370
3380
3400
3410
3320
0 2
kilometres
Basker-1
Chimaera 1
Basker 2, 3, 4, 5, and 6
Gummy-1
Manta-1
Manta-2, 2A
Gas water contact
Oil and gas well
Gas well
Depth contour metres subsea (10m interval)
Fault window
B
Inset
VIC/L26VIC/L27 VIC/L28
0 4 kilometres
Gippsland 30_AR15
VIC/L28
Note: Manta 2A did not penetrate Golden Beach sequence
VIC/L27 (65%)
VIC/L26 (65%)
accumulations. These estimates have both an associated risk of discovery and a risk of development. Further exploration appraisal and evaluation is required to determine the existence of a significant quantity of potentially moveable hydrocarbons.
Utilising the revised resource assessment, the company prepared a Business Case for potential development of the Manta field which concluded that development of the Manta gas resource is technically and economically feasible. The most economic development option is considered likely to comprise two subsea wells connected by pipeline to the Orbost Gas Plant. Such a development could result in first gas production within two years of FID with the potential to produce 23 PJ of gas per year.
Manta Field, Golden Beach structure map
The Business Case outlined an indicative schedule with development feasibility being confirmed by Manta-3 appraisal well towards the end of 2017, entry into FEED early in 2018, followed by FID early in 2019. Based on this schedule, first gas could be achieved mid-2021.
The BMG Joint Venture will assess the Manta Business Case early in FY16 and determine the next step in the appraisal and/or development program of the Manta and Basker fields.

18
Otway Basin Cooper Energy holds interests in 8* exploration licences in the onshore Otway Basin covering a total area of 10,145 sq km. The company’s primary focus in this region is exploration for oil and gas plays associated with the Casterton and Sawpit formations, primarily within the Penola Trough.
Analysis of data from Jolly-1 and Bungaloo-1, which were drilled in FY14 within the South Australian portion of the basin, was completed. The results have assisted with the identification of a number of opportunities for future evaluation of the deep plays in the Penola Trough.
Reprocessing and interpretation of the Haselgrove 3D seismic survey (146 km2) and 222 km of 2D seismic data in PEL 495 was undertaken.
Applications to consolidate PELs 494 and 495 into a single licence and to renew for an additional five-year term were submitted to the South Australian regulatory authority. In accordance with regulatory requirements, the renewal application incorporates relinquishment of 50% of the combined licence area.
Applications to suspend and extend PEPs 150, 151, 168 and 171 for a further 12 months due to the ongoing moratorium on gas production operations were submitted to the Victorian regulatory authority.
0 20 40
kilometres
TROUGH
ARDONACHIE TROUGH
Kingston SE
Naracoorte
Beachport
Millicent
Mount Gambier
Portland
Warrnambool
Hamilton
Cobden
ROBE TROUGH
ST CLAIR TROUGH
SOUTH AUSTRALIA
VICTORIARobe
Katnook
PENOLAPenola
Nangwarry
PEL 186 (33.33%) PEL 495 (30%)
PEP 151 (75%)
PEP 171 (25%)
PEP 150 (20%)
PEP 168 (50%)
PRL 32 (30%)
PEL 494 (30%)
Jolly-1Bungaloo-1
Otway 31AR15
Hamilton
Withdrawn
Cooper Energy tenement
Relinquishment application
Gas field
Gas pipeline
Depositional trough
Plugged and abandoned well
Well with gas show
TAS
Plan area
Review of Operations
* Cooper Energy withdrew from the PEP 151 Joint Venture during the year and ministerial approval of the transfer of the company’s interest in the tenement to the continuing Joint Venture party is expected early in FY16.
Indonesia Cooper Energy holds interests and operates three tenements in the onshore South Sumatra Basin.
Tangai-Sukananti KSO (55% interest & Operator)
Operations in the Tangai-Sukananti KSO are focussed on the Bunian oil field, which was discovered in 1998. To date, the field has produced over 1 million barrels of oil, predominately from the TRM3 Sand in Bunian-1, which, prior to commencement of production from Bunian-3 in May 2015, was the only producing zone in the field. Oil production in the KSO is also derived from two wells in the nearby Tangai oil field.
Two operations were undertaken to increase production from the KSO: a workover of Tangai-3 and drilling of the Bunian-3 development well.
The workover of Tangai-3 was undertaken in July 2014 and resulted in the well re-commencing production in that month. Tangai-3 produced at an average rate of 21 bopd during FY15.
Bunian-3 spudded in December 2015. Operational issues necessitated two sidetracks, with the second sidetrack (Bunian-3 ST2) intersecting the TRM3 reservoir sand 18.5 metres higher than at Bunian-1 and recording a stabilised flow rate equivalent to 1,742 bopd and 1.25 MMcfd of gas through a 12/64 inch choke in production testing of the TRM3.
A new oil pool discovery was also made by Bunian-3 ST2 in the deeper K1 Sandstone.

19
kilometres
0 25 50
103° 00' E 104° 00' E
4° 00' S
3° 00' S
Kaliberau
Piano
Gambang
Meruap
Tampi
Suban
Palembang
Sungai Gerong
Plaju Refinery
INDONESIA
Merangin III PSC (100%)
Tangai-Sukananti KSO (55%)
Sumbagsel PSC (100%)
Indonesia_116AR154° 00' S
Cooper Energy permit
Oil field
Gas field
Pipeline
E
INDIAN OCEAN
JAVA SEA
SOUTH CHINA SEA
MALAYSIA
SumartaI N DONES I A
South Sumatra Basin
The K1 Sand flowed on test at a rate equivalent to 1,590 bopd and 1.8 MMcfd of gas through a 1/8 inch choke.
The well’s results were the key factors in an increase in 2P oil reserves in the Bunian field at 30 June 2015 to 1.53 MMbbl (Cooper Energy share), which is an increase of 1.20 MMbbl from the 2P Reserves of 0.33 MMbbl at 30 June 2014.
Bunian-3ST2 was completed as an oil producer from the TRM3 and K1 Sands and was brought online in May 2015.
In July-August 2015, although constrained by trucking and handling capacity, total production from the KSO averaged 760 bopd, significantly
-3°35'
104°55'
0 2
kilometres
Cooper Energy permit
Oil field
Oil well
Abandoned oil well
Dry well
INDONESIA
Tangai-Sukananti KSO
Indonesia_117_AR15
Tangai-4
Kupang-1
Bunian-1
Bunian-4
Bunian-3ST1
Bunian-3ST2
TMB-06
Sukananti-1
Bunian-2
Tangai-3
Tangai-2Tangai-1
Tangai
BunianTanjung Miring
Barat
Sumbagsel PSC (100% interest & Operator)
The Sumbagsel PSC lies on the eastern flank of the South Sumatra Basin and contains a wide prospect inventory of shallow oil and deeper gas prospects and leads.
Interpretation of 265 km of 2D seismic was undertaken. Acquisition of 3D seismic is planned for the 2016 calendar year.
An application to relinquish 15% of the original contract area was submitted to SKKMigas, in accordance with the conditions of the PSC.
Merangin III PSC (100% interest & Operator)
The Merangin III PSC lies in the central portion of the South Sumatra Basin and contains a wide prospect inventory of shallow oil and deeper gas prospects and leads.
Interpretation of over 3,000km of 2D seismic data from the PSC was completed during the year, with the objective of maturing targets for 2D seismic acquisition in the 2016 calendar year.
higher than the average rate of approximately 320 bopd being achieved prior to Bunian-3 commencing production.
Studies will be undertaken to optimise further development of Bunian, which is likely to lead to drilling and installation of increased export capacity in the 2016 calendar year.

20
Review of Operations
10°E 11°E
36°N
37°N
12°E 13°E
kilometres
0 50
Neopolis
Baraka SEBaraka South
Sbeitla
Dougga
Lambouka
Fushia
LotusEl Mediouni
Tafernine
Aster
TazerkaBirsa
CosmosBaraka
Maamoura
Yasmin
Zibibbo
OudnaZelfa
Halk El MenzelSousse
Monastir
Pantelleria Island(Italy)
Tunis
TUNISIA
Nabeul Permit (85%)
Hammamet Permit (35%)
Bargou Permit (30%)
Hammamet West-3
Tunisia_35AR15
13°E
TUNISIA
MEDITERRANEAN SEA
Map area
Cooper Energy tenement
Oil field
Gas field
Gas pipeline
Oil well
Tunisia Efforts to divest the company’s entire Tunisian portfolio continued but were hindered by the downturn in oil prices and industry sentiment. Accordingly the focus during the year was to negotiate as far as possible the deferment and/or reduction of work obligations, particularly in the Bargou and Nabeul permits.
Bargou Permit (30% interest & Operator)
Activity in the Bargou permit during the year consisted of reprocessing of the Hammamet West 3D seismic survey. Plans for further drilling on the Hammamet West oil discovery were postponed indefinitely.
Subsequent to year-end an application to remove this well commitment and to amend the remaining work obligations in the Bargou permit to 600km of 3D seismic was approved by the Tunisian government authority.
Acquisition of this seismic program and the abandonment of Hammamet West-3 may be undertaken during FY16.
Nabeul Permit (Cooper 85% & Operator)
No activity was undertaken in the Nabeul permit.
During the year the company elected to not extend the tenure of its interest in the Nabeul permit. The terms to finalise the exit from the permit are to be agreed with the Tunisian Government.
Hammamet Permit (Cooper 35%)
There was no significant activity during the year in the Hammamet permit.

21
Health Safety Environment and CommunityA core Cooper Energy value is Care: prioritising safety; health; the environment; and community.
• 957,000 hours worked with one Lost Time Injury
• Zero Lost Time Injuries during onshore drilling activities in South Sumatra
• Offshore subsea inspection campaign successfully carried out at Basker-Manta with excellent safety performance and no recordable incidents
• Community participation via ‘Making a Difference’ program
Health and SafetyCooper Energy staff and contractors worked a total of 957,000 hours during the year with just one Lost Time Injury (LTI), resulting in a Lost Time Injury Frequency Rate (LTIFR) of 1.04 incidents per million hours worked, against a target rate of below 0.80. The LTI occurred during a downhole fluid sampling operation in South Sumatra and was attributed to workshop misassembly of the equipment that caused unexpected release of trapped pressure during deployment at the wellsite.
Cooper Energy also monitors and measures Total Recordable Cases (TRCs), a broader standard safety performance metric. TRCs include LTIs, alternate duties injuries and incidents requiring any medical treatment greater than simple first aid. In total, four incidents were recorded during the year resulting in a Total Recordable Case Frequency Rate (TRCFR) of 4.2 incidents per million hours worked.
Lessons from all incidents and near misses have been incorporated into improved operational procedures.
A safety highlight was the 11-day subsea inspection campaign carried out on the Basker and Manta fields, offshore Victoria, using a Remote Operated Vehicle (ROV) deployed from the Bass Trek vessel. Despite the inherent risks of working in the harsh Bass Strait environment, a thorough pre-campaign risk assessment, together with detailed planning and preparation followed by diligent execution resulted in the operation being completed ahead of schedule and under budget with no recordable safety incidents.
The Care value encompasses support of staff and Cooper Energy formally encourages staff health through the incorporation of health and well-being targets in individual objectives.
EnvironmentNo recordable environmental incidents occurred in Cooper Energy operations during the year.
Cooper Energy takes a proactive stance with respect to its environmental responsibilities. Although the company is below the reporting threshold required by the National Greenhouse and Energy Reporting Act, it has commenced recording and reporting its Australian emissions and energy use in order to establish a baseline in preparation for the commencement of gas production from its offshore gas projects in Victoria.
CommunityCooper Energy chooses to participate in, and contribute to, the communities in which it operates. This is carried out via the organisation’s ‘Making a Difference’ program through which the company provides both financial and ‘hands-on’ assistance from the time and efforts of its staff and contractors to selected not-for-profit organisations addressing social, environmental and community needs.
Organisations assisted directly by the program during the year included; Fred’s Van (an initiative of St Vincent de Paul), Hutt St Centre for the Homeless, Foodbank, Juvenile Diabetes Research Fund, The Hospital Research Foundation, KickStart for Kids and the Nature Foundation SA Revegetation program. More than 80% of Australian office staff has taken part in at least one event as part of the program.
Our CommitmentCooper Energy is committed to pursuing industry leading HSEC performance, via a range of initiatives. For a smaller company working a limited number of hours it is important an appropriate balance is maintained whilst doing all reasonably possible to ensure leading HSEC performance. Low accident statistics are ultimately a key objective of the safety outcomes achieved. However, these historical statistics have limited utility as a predictive tool for identifying the most effective concentration of future efforts. It is similar for our efforts in health, environment and community.
Accordingly, the company is broadening its perspective to examine a selection of relevant incidents and High Potential Near Misses from the wider industry and working to implement lessons from this analysis across its operations. This work is being integrated into a framework based around the principles of continuous improvement and mindfulness.

22
Portfolio Exploration and Production Tenements
Region: Australia
Cooper Basin
State Tenement Interest Location Area (km2) Operator Activities
South Australia PPL 204 (Sellicks) 25% Onshore 2.0 Beach Energy Production
PPL 205 (Christies /Silver Sands) 25% Onshore 4.3 Beach Energy Production
PPL 207 (Worrior) 30% Onshore 6.4 Senex Energy Production
PPL 220 (Callawonga) 25% Onshore 5.5 Beach Energy Production
PPL 224 (Parsons) 25% Onshore 1.8 Beach Energy Production
PPL 245 (Butlers) 25% Onshore 2.1 Beach Energy Production
PPL 246 (Germein) 25% Onshore 0.1 Beach Energy Production
PPL 247 (Perlubie) 25% Onshore 1.5 Beach Energy Production
PPL 248 (Rincon) 25% Onshore 2.0 Beach Energy Production
PPL 249 (Elliston) 25% Onshore 0.8 Beach Energy Production
PPL 250 (Windmill) 25% Onshore 0.6 Beach Energy Production
PEL 90 (Kiwi sub-block) 25% Onshore 144.6 Senex Energy Exploration
PRL 85-104 25% Onshore 1,889.3 Beach Energy Exploration
PEL 93 30% Onshore 621.8 Senex Energy Exploration
PEL 100 19.17% Onshore 296.5 Senex Energy Exploration
PEL 110 20% Onshore 727.5 Senex Energy Exploration
Otway Basin
State Tenement Interest Location Area (km2) Operator Activities
South Australia PEL 186 33% Onshore 709.1 Cooper Energy Exploration
PEL 494 30% Onshore 2,488.8 Beach Energy Exploration
PRL 32 30% Onshore 36.9 Beach Energy Exploration
Victoria PEP 150 20% Onshore 3,212.0 Beach Energy Exploration
PEP 1511 75% Onshore 859.0 Bridgeport Energy Exploration
PEP 168 50% Onshore 795.0 Beach Energy Exploration
PEP 171 25% Onshore 1,974.0 Beach Energy Exploration
Gippsland Basin
State Tenement Interest Location Area (km2) Operator Activities
Victoria VIC/L26 65% Offshore 67.0 Cooper Energy Production
VIC/L27 65% Offshore 67.0 Cooper Energy Production
VIC/L28 65% Offshore 67.0 Cooper Energy Production
VIC/RL3 50% Offshore 201.0 Santos Retention

23
Region: Indonesia
South Sumatra Basin
Tenement Interest Location Area (km2) Operator Activities
Tangai-Sukananti KSO 55% Onshore 18.3 Cooper Energy Production
Sumbagsel PSC 100% Onshore 1,304 Cooper Energy Exploration
Merangin III PSC 100% Onshore 1,488 Cooper Energy Exploration
Region: Tunisia
Gulf of Hammamet
Tenement Interest Location Area (km2) Operator Activities
Bargou 30% Offshore 4,616 Cooper Energy Exploration
Hammamet 35% Offshore 4,676 Storm Ventures International Exploration
Nabeul 85% Offshore 3,352 Cooper Energy Exploration
1. During the year Cooper Energy withdrew from the PEP 151 Joint Venture. Ministerial approval of the transfer of the company’s interest in the tenement to the continuing Joint Venture party had not occurred by 30 June 2015 but is expected in the first half of the 2016 financial year.
Orbost Gas Plant, Gippsland Basin, Victoria

24
Board of Directors
Independent Non-Executive DirectorMs Alice J. M. Williams B.Com, FAICD, FCPA, CFA
Appointed 28 August 2013
Experience and expertise Mr Conde has extensive experience in business and commerce and in chairing high profile business, arts and sporting organisations.
Previous positions include, a Director of BHP Billiton, Chairman of Pacific Power (the Electricity Commission of NSW), Chairman of Events NSW, President of the National Heart Foundation and Chairman of the Pymble Ladies’ College Council.
Current and other directorships in the last 3 years Mr Conde is currently Chairman of Bupa Australia (since 2008) and The McGrath Foundation (since 2013 and Director since 2012).
Independent Non-Executive DirectorMr Jeffrey W. Schneider B.Com
Appointed 12 October 2011
He is President of the Commonwealth Remuneration Tribunal (since 2003) and a director of Dexus Property Group ASX: DXS (since 2009). He is Deputy Chairman of Whitehaven Coal Limited ASX: WHC (since 2007).
Mr Conde is a former Chairman of Destination NSW (2011 – 2014) and the Sydney Symphony Orchestra (2007 – 2015) and is a former director of AFC Asian Cup (2015) (2012 – 2015).
Special Responsibilities Mr Conde is a member of the Remuneration and Nomination Committee and the Audit and Risk Committee.
Special Responsibilities Mr Schneider is Chairman of the Remuneration and Nomination Committees and member of the Audit and Risk Committee.
Current and other directorships in the last 3 years Ms Williams is a non-executive Director of Djerriwarrh Investments Ltd ASX: DJW (since 2010), Equity Trustees Ltd ASX: EQT (since 2007), Barristers Chambers Ltd (since 2015), the Foreign Investment Review Board (since 2015), Guild Group, Defence Health and Port of Melbourne Corporation. Ms Williams is also a Council member of the Cancer Council of Victoria. Ms Williams is a former director of Victorian Funds Management Corporation (2008 – 2015).
Special Responsibilities Ms Williams is Chairman of the Audit and Risk Committee and a member of the Remuneration and Nomination Committee.
Chairman Mr John C. Conde AO B.Sc. B.E(Hons), MBA
Independent Non-Executive Director
Appointed 25 February 2013
Experience and expertise Mr Schneider has over 30 years of experience in senior management roles in the oil and gas industry, including 24 years with Woodside Petroleum Limited. He has extensive corporate governance and board experience as both a non-executive director and chairman in resources companies.
Current and other directorships in the last 3 years Mr Schneider is a former director of Comet Ridge Limited ASX: COI (2003 – 2014) and Green Rock Energy Limited ASX: GRK (2010 – 2013).
Experience and expertise Ms Williams has over 25 years of senior management and Board level experience in corporate, investment banking and Government sectors.
Ms Williams has been a consultant to major Australian and international corporations as a corporate advisor on strategic and financial assignments. Ms Williams has also been engaged by Federal and State based Government organisations to undertake reviews of competition policy and regulation. Prior appointments include Director of Airservices Australia, Telstra Sale Company, V/Line Passenger Corporation, State Trustees, Western Health and the Australian Accounting Standards Board.

25
Managing Director Mr David P. Maxwell M.Tech, FAICD
Appointed 12 October 2011
Executive Director Mr Hector M. Gordon B.Sc. (Hons). FAICD
Appointed 26 June 2012
Experience and expertise
Mr Maxwell is a leading oil and gas industry executive with more than 25 years in senior executive roles with companies such as BG Group, Woodside Petroleum Limited and Santos Limited. Mr Maxwell has very successfully led many large commercial, marketing and business development projects.
Prior to joining Cooper Energy Mr Maxwell worked with the BG Group, where he was responsible for all commercial, exploration, business development, strategy and marketing activities in Australia and led BG Group’s entry into Australia including a number of material acquisitions.
Mr Maxwell has served on a number of industry association boards, government advisory groups and public company boards. He was a member of the Australia Federal Government Energy White Paper Reference Group in 2011.
Current and other directorships in the last 3 years Mr Maxwell is a director of wholly owned subsidiaries of Cooper Energy Ltd.
Special Responsibilities Mr Maxwell is responsible for the day to day leadership of Cooper Energy. He is the leader of the management team.
Experience and expertise Mr Gordon is a very successful geologist with over 35 years of experience in the petroleum industry. Mr Gordon was previously Managing Director of Somerton Energy until it was acquired by Cooper Energy in 2012. Previously he was an Executive Director with Beach Energy Limited where he was employed for more than 16 years. In this time Beach Energy experienced significant growth and Mr Gordon held a number of roles including Exploration Manager, Chief Operating Officer and, ultimately, Chief Executive Officer. Mr Gordon’s previous employers also include Santos Limited, AGL Petroleum, TMOC Resources, Esso Australia and Delhi Petroleum Pty Ltd.
Current and other directorships in the last 3 years Mr Gordon is a director of Bass Strait Oil Company Ltd ASX: BAS (since 2014) and various wholly owned subsidiaries of the Company. He is a former director of ERO Mining Limited (2011-2013).
Special Responsibilities As a part time executive of the Company, Mr Gordon is responsible for reviewing exploration and production activities and providing technical expertise in these areas. He is also Chairman of the HSEC Management Committee and the Indonesian Management Committee.
Managing Director David Maxwell M.Tech, FAICD
Executive Director – Exploration & Production Hector M. GordonBSc (Hons), FAICD
Operations ManagerIain MacDougallBSc (Hons)
Exploration Manager Andrew ThomasBSc (Hons)
Executive Management teamCommercial & Business Development Manager Eddy GlavasB.Acc., CPA, MBA
Chief Financial Officer, Company Secretary Jason de RossB.Ec., ACA, MBA, F Fin, GAICD
Company Secretary and Legal Counsel Alison Evans B.A., LLB

26
Key Performance Indicators
Operational12 months to 30 June 2008 2009 2010 2011 2012 2013 2014 2015
Annual production MMbbl 0.38 0.49 0.47 0.41 0.52 0.49 0.59 0.48
Proved & Probable Reserves MMbbl 1.44 1.91 2.00 2.47 1.88 2.16 2.01 3.08
Wells drilled number 13 7 4 12 10 13 11 9
Exploration wells spudded number 6 5 4 6 6 8 5 4
Exploration success rate percent 17% 60% 0% 0% 50% 25% 0% 0%
Cumulative exploration success rate percent 21% 30% 27% 23% 27% 26% 24% 22%
Reserve Replacement Ratio 206% 198% 119% 215% (14)% 157% 75% 323%
Financial
Oil sales revenue $ million 45.0 41.6 40.0 39.1 59.6 53.4 72.3 39.1
Other revenue $ million 3.7 4.2 4.3 5.1 4.7 2.3 2.8 1.9
EBITDA $ million 15.8 5.2 8.0 (6.0) 9.1 22.3 36.9 (58.4)
Profit before tax $ million 15.8 5.0 7.2 (5.5) 21.0 18.3 31.2 (18.8)
Profit after tax $ million 6.4 (2.8) 1.2 (10.3) 8.4 1.3 22.0 (63.5)
Cash & term deposits $ million 64.6 93.4 92.5 72.4 61.5 47.9 49.1 39.4
Investments $ million - - - - 13.2 20.2 26.0 1.9
Working capital $ million 73.6 96.5 95.4 79.5 53.4 51.7 41.2 43.0
Accumulated profit $ million 26.0 23.2 24.4 14.1 22.5 23.8 45.7 (17.7)
Cumulative franking credits $ million 9.3 17.7 25.7 31.4 37.0 39.0 38.7 43.7
Shareholders equity $ million 115.5 123.3 125.1 114.9 136.9 137.2 167.8 103.9
Earnings per share cents 2.9 (1.0) 0.4 (3.5) 2.8 0.4 6.4 (19.2)
Return on shareholders funds percent 5.5% (2.3)% 1.0% (8.6)% 6.7% 0.9% 14.4% (61.1)%
Total shareholder return percent (41.1)% (3.2)% (17.8)% (2.7)% 25.0% (16.7)% 34.7% (51.5)%
Average oil price A$/bbl 118.46 86.76 87.02 95.42 114.63 112.31 124.08 85.48
Capital as at 30 June
Share price $ per share 0.465 0.45 0.37 0.36 0.45 0.375 0.505 0.245
Issued shares million 252.3 291.9 292.6 292.6 327.3 329.1 329.2 331.9
Market capitalisation $ million 117.3 131.4 108.3 105.3 147.3 123.4 166.3 81.4
Shareholders number 7,345 7,596 6,537 5,573 5,485 5,284 5,122 5,103

27
Operating and Financial Review 28
Directors’ Statutory Report 34
Consolidated Statement of Comprehensive Income 54
Consolidated Statement of Financial Position 55
Consolidated Statement of Changes In Equity 56
Consolidated Statement of Cash Flows 57
Notes To Financial Statements 58
1. Corporate Information 58
2. Summary of Significant Accounting Policies 58
3. Segment Reporting 72
4. Revenues and Expenses 75
5. Income Tax 76
6. Earnings Per Share 78
7. Cash and Cash Equivalents and Term Deposits 79
8. Trade and Other Receivables (Current) 81
9. Prepayments (Current) 81
10. Exploration Assets Held for Sale and Discontinued Operations 81
11. Available for Sale Investment (Non-Current) 82
12. Investments in Associate (Non-Current) 82
13. Oil Properties (Non-Current) 83
14. Impairment 84
15. Other Property, Plant & Equipment (Non-Current) 85
16. Exploration and Evaluation (Non-Current) 86
17. Trade and Other Payables (Current) 87
18. Provisions 87
19. Financial Liabilities (Non-Current) 88
20. Contributed Equity and Reserves 88
21. Financial Risk Management Objectives and Policies 90
22. Commitments and Contingencies 93
23. Interests in Joint Arrangements 94
24. Related Parties 95
25. Share Based Payment Plans 97
26. Auditors’ Remuneration 99
27. Parent Entity Information 99
28. Events After the Reporting Period 100
Directors’ Declaration 101
Independent Audit Report 102
Auditors’ Independence Declaration 104
Securities Exchange And Shareholder Information 105
Corporate Directory Inside back cover
Cooper Energy Limited and its controlled entities
Financial ReportFor the year ended 30 June 2015 ABN 93 096 170 295

28
Cooper Energy completed the financial year with the company’s highest level of reserves and resources on record and significant progress on executing its value enhancing gas strategy. However, the substantial decline in the world oil price during the period has had a significant effect on Cooper Energy’s reported financial results in two principal areas – first, reduced revenues from operations have resulted in a loss and, secondly, the Board has resolved to make impairment (non-operating) adjustments to the Tunisian portfolio and other assets. These non-operating items have affected adversely the reported loss after tax by $62.2 million. Further details of the financial performance and the impairment adjustments are presented later in this Report.
Operations
Overview
Cooper Energy is a petroleum exploration and production company which seeks to create shareholder value through cash generating hydrocarbon production and the creation of a gas supply business which is focussed particularly on eastern Australia.
Revenue is generated from the discovery, development and sale of oil from licences held in the Cooper Basin, Australia and the South Sumatra Basin, Indonesia. The company held proved and probable reserves of 3.1 million barrels of oil in these regions as at 30 June 2015.
The emerging gas business includes Contingent Resources (2C) of 196.5PJ1 in the Gippsland Basin, offshore Victoria, Australia and a 50% interest in the Orbost Gas Plant, onshore Gippsland Basin. Cooper Energy is working towards commercialisation and development of these resources, which are scheduled to commence revenue generation from as early as January 2019. Gas exploration acreage is also held in the onshore Otway Basin.
A portfolio of offshore Tunisian acreage is currently subject to a divestment process, the status of which is discussed under the heading “Business Strategies and Prospects” later in this report.
Production
Cooper Energy produced a total of 0.48 million barrels of oil in 2015, 84% of which was sourced from the Cooper Basin, with the balance from Indonesia. The production result compares to 0.59 million barrels in the preceding year, with the movement incorporating natural decline of Cooper Basin fields and increased, and record, output from the Indonesian operations.
Cooper Basin production for the year was 0.40 million barrels, down from 0.54 million barrels in the prior year.
Indonesian production benefited from a successful workover and development drilling campaign conducted in the Sukananti KSO, most particularly the Bunian-3 well completed in May 2015. The company’s share of production from Sukananti for the 12 months to 30 June 2015 was 0.075 million barrels compared with 0.055 million barrels in the previous year. The commencement of production in May from Bunian-3 took production from the Sukananti KSO to the limit permitted by existing storage and transportation.
Project and portfolio development
In 2012 the company identified an opportunity for value creation in the gas supply opportunities it foresaw as emerging in eastern Australia as existing supply contracts ran down and demand escalated with the commencement of Liquefied Natural Gas (LNG) production in Gladstone.
The company continues to implement a strategy to realise this opportunity, through creating a market focussed, portfolio-style gas supply business. Core to this strategy is the accumulation of gas resources with the technical and commercial characteristics to be among the most cost competitive and available in the market and a portfolio of gas supply contracts.
1 BMG contingent resource initially disclosed to the market on 18 August 2014, Sole contingent resources disclosed on 25 May 2015 and an update to Manta resources announced on 16 July 2015. Cooper Energy is not aware of any new information or data that materially affects the information provided in those releases and all material assumptions and technical parameters underpinning the assessment in the announcements continue to apply.
Operating and Financial ReviewFor the year ended 30 June 2015

29
The results achieved in 2015 have seen the company establish the gas resource, infrastructure interests and, subsequent to year-end, the first commercial agreements for the gas business envisaged by the strategy. The key developments in the strategy that led to this position are:
- the acquisition of a 50% interest in the Sole gas field (Gippsland Basin- VIC/RL3) and a 50% interest in the Orbost Gas Plant;
- recognition of Contingent Resources (2C)of 105.5 PJ2 of gas in the Sole field (Cooper Energy share);
- the Sole Gas Project entering into Front End Engineering and Design (FEED) for a gas development to supply eastern Australia via the Orbost Gas Plant from January 2019;
- an upgrade to resources of the Manta gas field in VIC/L26 and VIC/L27. The Manta field is now assessed to hold Contingent Resources (2C) of 106.0PJ of gas and 3.2 million barrels of oil and condensate (total joint venture volume, Cooper Energy interest is 65%);
- completion of the Cooper Energy Business Case analysis for the Basker-Manta-Gummy gas and liquids resource in VIC/L26, VIC/L27 and VIC/L28. The Business Case identified an opportunity for development of a gas project at the Manta gas field to supply gas to eastern Australia, via the Orbost Gas Plant, from mid 2021; and
- negotiation with gas buyers, which resulted in the announcement of the first Heads of Agreement for supply of gas from Sole.
Discussion of the ongoing execution of the gas strategy is provided under the heading Business Strategies and Prospects below.
In Indonesia the company is pursuing a strategy which adds value through adding low risk production and reserve increments with limited recourse to capital. As noted under the headings Exploration and development and Reserves and resources this strategy has been successful, to the point where a new range of field appraisal and development opportunities have emerged, with the capacity to add significantly to production rates in the coming years. The company is presently assessing the potential and shareholder value offered by these opportunities in the context of its capital management and growth plans.
Exploration and development
Cooper Energy has interests in petroleum exploration tenements in the Cooper, Otway and Gippsland Basins in Australia, the South Sumatra Basin in Indonesia and the Pelagian Basin offshore Tunisia. As noted, above the Tunisian acreage is the subject of a divestment process.
Exploration and development activity during the period included the drilling of 9 wells. In the Cooper Basin, 4 exploration, 2 appraisal wells and 2 development wells were drilled. The Callawonga-10 development well and Callawonga-11 appraisal wells were successful. In Indonesia, the Bunian-3 development well was successful, leading to increased reserves and production from the field and identifying further potential to be addressed by subsequent drilling.
Reserves and resources
Reserves and Resources were increased substantially during the year and at 30 June 2015 were the highest yet recorded by Cooper Energy. Proved and probable reserves of 3.1million barrels of oil were 53% higher than the corresponding figure of 2.0 million barrels at the beginning of the year. The increase is attributable to Indonesia, where the successful Bunian-3 well resulted in a major upgrade to reserves in the Sukananti KSO, additions arising from drilling at the Callawonga field and better than forecast performance from some of the existing Cooper Basin production wells. Proved and probable reserves additions in the Cooper Basin PEL 92 fields were sufficient to replace 120% of the permit’s yearly production.
Contingent Resources (2C)of 58.4 million boe were 66% higher than at the start of the year, with nearly all of the increment being attributable to the Gippsland Basin, where an initial resource booking was made for the Sole gas field acquired on 25 May and the assessment for the Manta field upgraded. Gippsland Basin resources account for 38.4 million boe of 2C Contingent Resources, with the balance being accounted for by Tunisia (17.0 million boe and unchanged), Indonesia (2.6 million boe, previously zero) and Cooper Basin (0.4 million boe).
2 As disclosed to the ASX on 25 May 2015. Cooper Energy is not aware of any new information or data that materially affects the information provided in those releases and all material assumptions and technical parameters underpinning the assessment in the announcements continue to apply.
Operating and Financial ReviewFor the year ended 30 June 2015

30
Operating and Financial ReviewFor the year ended 30 June 2015
Financial Performance
Financial Performance FY15 FY14 Change %
Production volume MMbbl 0.48 0.59 -0.11 -18%
Sales volume MMbbl 0.46 0.58 -0.12 -21%
Sales revenue $million 39.1 72.3 -33.2 -46%
Average oil price $/bbl 85.48 124.10 -38.62 -31%
Gross profit $million 14.1 46.2 -32.1 -69%
Gross profit / Sales revenue % 36.0 64.0 -28.0 -44%
Operating cash flow $million 2.0 50.3 -48.3 -96%
Reported NPAT / (loss) $million -63.5 22.0 -85.5 -389%
Underlying NPAT / (loss) $million -1.3 25.3 -26.6 -105%
Underlying EBITDA* $million 8.2 40.2 -32.0 -80%
* Earnings before interest, tax, depreciation and amortisation
Calculation of underlying NPAT / loss by adjusting for items unrelated to the ongoing operating performance is considered to provide meaningful comparison of results between periods. Underlying NPAT / loss and Underlying EBITDA are not defined measures under International Financial Reporting Standards and are not audited. Reconciliations of NPAT / loss and Underlying NPAT / loss and Underlying EBITDA are included at the end of this review.
Cooper Energy recorded a statutory loss after tax of $63.5 million for the 30 June 2015 financial year which compares with the profit after tax of $22.0 million recorded in the 2014 financial year. The 2015 statutory loss included a number of non-operating items which adversely affected profit after tax by $62.2 million. These items which principally comprise impairment in respect of the Tunisian discontinued operations are detailed in the reconciliation for NPAT to Underlying NPAT at the end of this review.
Underlying loss exclusive of these items was $1.3 million, compared with the previous year underlying NPAT of $25.3 million, with the movement being attributable to:
• significantly lower oil prices. The average oil price of A$85.48/bbl was 31% lower than the 2014 average of $124.10 /bbl. This difference was responsible for a $22.5 million reduction in sales revenue;
• lower sales volumes, due to lower production. Sales volumes were 21% lower than in 2014, resulting in a $10.7 million reduction in sales revenue;
• amortisation of costs in areas under production rose $1.5 million due to revised estimated development expenditure on undeveloped reserves; and
• lower other revenue, $1.0 million, with lower joint venture fees.
These factors were offset in part by:
• lower tax expense by $12.0 million, mainly due to the lower underlying profit before tax; and
• lower royalties by $3.2 million due to lower oil prices and production.
Financial Position
Financial Position FY15 FY14 Change %
Total assets $million 174.0 248.3 -74.3 -30%
Total liabilities $million 70.1 80.5 -10.4 -13%
Total equity $million 103.9 167.8 -63.9 -38%
Assets
Total assets decreased by $74.3 million from $248.3 million to $174.0 million.
Cooper Energy has a strong balance sheet. As at 30 June the company held cash and deposit balances of $39.4 million, investments of $1.9 million and no debt.
Total financial assets declined by $33.9 million over the period after funding exploration and development of $27.4 million. As illustrated below, operating net cash was $2.0 million after net working capital movements of $10.7 million including income tax of $5.9 million relating to 2014.

31
Financial Position continued
Exploration and evaluation assets (including those held for sale at 30 June 2014) decreased $36.1 million from $141.5 million to $105.4 million primarily as a result of the impairment of $47.5 million on the Tunisian discontinued operations partially offset by exploration expenditure during the period, including the acquisition of Sole and the Orbost Gas Plant.
Oil properties decreased by $6.4 million from $18.3 million to $11.9 million mainly due to an impairment of $7.5 million for PEL 93 (refer to note 14) and amortisation, partially offset by capital expenditure during the period.
Total Liabilities
Total liabilities decreased by $10.4 million from $80.5 million to $70.1 million.
Trade and other payables decreased $3.4 million from $12.3 million to $8.9 million mainly due to the timing of payments to suppliers with FY14 payables being high relative to a three year average.
Income tax payable decreased by $5.0 million to nil due to payment of tax made in the period. Subsequent to year end the FY14 income tax return was amended for a research and development claim of $0.8 million which is shown as income tax receivable as at 30 June 2015. No income tax is payable at 30 June 2015.
Net deferred tax liabilities decreased by $3.4 million from $14.4 million to $11.0 million mainly due to the impairment losses recognised in respect of exploration and evaluation.
Financial liabilities decreased by $0.9 million from $4.0 million to $3.1 million due to a reset of assumptions relating to the BMG success fee liability.
Provisions increased by $5.2 million from $41.9 million to $47.1 million mainly due to the acquisition of the Sole field and Orbost Gas Plant with abandonment provisions of $8.1 million, partially offset by a decrease in the Basker-Manta-Gummy rehabilitation provision as a result of a reset of assumptions.
Total Equity
Total equity has decreased by $64.0 million from $167.8 million to $103.8 million. In comparing equity for the period to the prior corresponding period the key movements were:
• higher accumulated losses due to the total loss for the year of $63.5 million;
• lower reserves of $1.3 million mainly due to fair value adjustments on investments available for sale in addition to a sale of investments; and
• higher contributed equity of $0.8 million due to vesting of performance rights into shares.
Investments(at fair value)
Cash &deposits
Investments(at fair value)
Cash &deposits
$ million
Total cash &investments$75.1
Total cash &investments $41.3
Investing, Financing & FX
-$11.7m
Operating +$2.0m
June 14 Operations General Net Working Interest Operating E & D Other Financing June 15 Admin Capital Investment & FX Movement
51.1
26.0
49.1
22.5 -11.3
-10.7
1.5 -27.4
15.4
1.9
39.40.3
Operating and Financial ReviewFor the year ended 30 June 2015

32
Business Strategies and Prospects
The company’s strategy has three key elements:
- cash generating production, both from existing operations and from new sources in Australia;
- retention of a strong financial position and balance sheet; and
- development of a gas business supplying eastern Australia.
The company will apply its resources to these key elements with the objectives of generating optimal shareholder value, on those opportunities which satisfy fundamental, commercial and technical merit criteria whilst taking due care for safety, the environment and communities in which we operate.
The company’s oil production on the western flank of the Cooper Basin features low direct operating costs, including transport and royalties, averaging A$35/bbl in 2015. The operating costs for the Indonesian operations are reducing as its production increases, and averaged A$45/bbl for the full year. These existing production operations are considered to be viable at current and anticipated Australian dollar oil prices.
Production from existing Cooper Basin and Indonesian interests will be optimised to continue to maximize cash flow and support the company’s clear growth plans. Low risk exploration and appraisal drilling will continue in the Cooper Basin and Indonesia with the intention of maintaining production of approximately 500,000 barrels of oil per annum. Additional production opportunities will also be considered where they add value consistent with the company’s strategy.
The establishment of a gas business supplying eastern Australia is now well underway with both the Sole and Manta projects being advanced, albeit at different stages of maturity. Marketing activities have confirmed there is demand for gas from Sole and Manta and that price expectations are comfortably within that required for an economic project.
Ongoing execution of the gas strategy will now focus on:
- progression of the Sole project through FEED for a Final Investment Decision ( FID) likely in the September 2016 quarter;
- joint venture review of the Manta opportunity concurrent with planning of appraisal activity;
- negotiation of additional gas sales agreements prior to FID for the Sole project; and
- determination and implementation of the most suitable funding arrangements.
The company has previously announced its intention to divest its Tunisian portfolio in order to concentrate its resources on assets consistent with its strategy. The divestment process is yet to generate acceptable offers. Current market conditions and sentiment mean that exit from Tunisia through a transaction of the portfolio is not presently foreseeable. Cooper Energy is seeking to defer and limit further capital expenditure and accordingly has advised the Tunisian Government of its intention to not extend or renew the Nabeul permit and is continuing efforts to divest and reduce commitments in the Bargou and Hammamet permits as soon as practicable.
2016 Outlook
Cooper Energy expects production for the twelve months to 30 June of between 0.45 million to 0.55 million barrels of oil from the Cooper Basin and Indonesia with the range of expectations reflecting the potential impact of drilling results and the timing of well connections.
Increased production from Indonesian operations is forecast to offset natural decline from current Cooper Basin wells. Indonesia is forecast to broadly account for 35% of the year’s production. Direct operating costs, including transport and royalties, are forecast to approximate A$38/barrel for total production.
Capital expenditure is being primarily directed to the company’s growth projects, whilst maintaining investment in production from existing operations. Total capital expenditure of approximately $39 million is planned, with more than half of this attributable to the Gippsland gas projects.
Exploration and development activity for the year is expected to include:
• the drilling of 2 exploration wells and 2 development wells by the PEL92 Joint Venture and interpretation of 3D seismic data reprocessed in the previous year;
• the drilling of the Bunian-4 development well and establishment of additional production capacity in the Sukananti KSO;
• data processing of seismic information acquired in the northern Cooper Basin permits PEL 90K, 100 and 110; and
• reprocessing of 3D seismic information acquired in the Otway Basin.
Contingent activity not included in the firm capital expenditure plan includes 3 development wells in the Cooper Basin (PEL 92 Joint Venture: 2 contingent wells; and PEL93 Joint Venture 1 contingent well), and a contingent exploration well in the Otway Basin.
Progression of the Sole Gas Project through FEED to an affirmative FID stands as the most significant opportunity for value accretion in the year. To achieve this important milestone requires completion of the necessary engineering and commercial analysis, securing the required government approvals, finalising gas sales contracts and determining the most appropriate funding arrangements. Achievement of these outcomes will result in the translation of the field’s gas resources to proven and probable reserves, which on 2C Contingent Resource current estimates represents an uplift of 18 million boe.
Cooper Energy expects to secure satisfactorily priced gas contracts and FEED in the coming 12 months.
Operating and Financial ReviewFor the year ended 30 June 2015

33
Funding and Capital Management
As at 30 June 2015 the company had cash, deposits, and investments of $41.3 million. The company currently has $40 million in bank facilities which are subject to conditions and are currently being restructured from corporate to reserve based lending. The company considers its funding to be adequate for capital expenditure anticipated in the 2016 financial year.
The company has conducted and completed a comprehensive analysis of funding requirements and options available, especially in view of the capital expenditure requirements anticipated for the development of the company’s gas projects in the Gippsland Basin. The analysis confirmed a range of funding alternatives is likely to be available to provide coverage of the funding requirements anticipated for these projects and the Company’s participation in them. The determination of the most suitable combination of these options and timing is a matter of ongoing deliberation.
Risk Management
The company manages risks in accordance with its risk management policy with the objective of ensuring all risks facing the business are identified, measured and then managed or kept as low as reasonably practicable. The Management Team perform risk assessments on a regular basis and a summary is reported to the Audit and Risk Committee. The Audit and Risk Committee approves and oversees an internal audit program undertaken by an external tier 1 accounting firm.
Key risks which may materially impact the execution and achievement of the business strategies and prospects for Cooper Energy in future financial years are risks inherent in the oil and gas industry including technical, economic, commercial, operational, environmental and political risks. This should not be taken to be a complete or exhaustive list of risks. Many of the risks are outside the control of the company and its officers.
Appropriate policies and procedures are continually being developed and updated to help manage the risks.
Reconciliations for NPAT to Underlying NPAT and Underlying EBITDA
Reconciliation to Underlying (loss) / NPAT FY15 FY14 Change %
Net (loss) / profit after income tax (NPAT) $million -63.5 22.0 -85.5 389%
Adjusted for:
Discontinued operations $million 47.6 0.2 47.4 23700%
Impairment of oil properties $million 7.5 0.0 7.5 100%
Impairment of exploration and evaluation $million 7.2 0.0 7.2 100%
Impairment of financial assets AFS $million 7.5 3.1 4.4 142%
Impairment of investment in associate $million 0.5 0.0 0.5 100%
Fair value movement on disposal on investments $million -3.6 0.0 -3.6 -100%
Accounting gain on acquisition of associate investment $million -0.3 0.0 -0.3 -100%
Unrealised fair value movement on derivatives $million 0.2 0.0 0.2 100%
Tax impact of above changes $million -4.4 0.0 -4.4 -100%
Underlying (loss) / NPAT $million -1.3 25.3 -26.6 -105%
Reconciliation to Underlying EBITDA*
Underlying NPAT $million -1.3 25.3 -26.6 -105%
Add back:
Interest revenue $million -1.2 -1.4 0.2 -14%
Accretion expense $million 0.5 0.0 0.5 100%
Tax expense / (benefit) $million 1.4 9.0 -7.6 -84%
Depreciation $million 0.5 0.5 0.0 0%
Amortisation $million 8.3 6.8 1.5 22%
Underlying EBITDA* $million 8.2 40.2 -32.0 -80%
* Earnings before interest, tax, depreciation and amortisation
Operating and Financial ReviewFor the year ended 30 June 2015

34
The Directors present their report together with the consolidated financial report of the Group, being Cooper Energy Limited (the “parent entity” or “Cooper Energy” or “Company”) and its controlled entities, for the financial year ended 30 June 2015, and the independent auditor’s report thereon.
1. Directors
The Directors of the parent entity at any time during or since the end of the financial year are:
Mr John C. Conde AO B.Sc. B.E(Hons), MBA
Chairman Independent Non-Executive Director
Appointed 25 February 2013
Experience and expertise
Mr Conde has extensive experience in business and commerce and in chairing high profile business, arts and sporting organisations.
Previous positions include, a Director of BHP Billiton, Chairman of Pacific Power (the Electricity Commission of NSW), Chairman of Events NSW, President of the National Heart Foundation and Chairman of the Pymble Ladies’ College Council.
Current and other directorships in the last 3 years
Mr Conde is currently Chairman of Bupa Australia (since 2008) and The McGrath Foundation (since 2013 and Director since 2012). He is President of the Commonwealth Remuneration Tribunal (since 2003) and a director of Dexus Property Group ASX: DXS (since 2009). He is Deputy Chairman of Whitehaven Coal Limited ASX: WHC (since 2007).
Mr Conde is a former Chairman of Destination NSW (2011 – 2014) and the Sydney Symphony Orchestra (2007 – 2015) and is a former director of AFC Asian Cup (2015) (2012 – 2015).
Special Responsibilities
Mr Conde is a member of the Remuneration and Nomination Committee and the Audit and Risk Committee.
Mr David P. Maxwell M.Tech, FAICD
Managing Director
Appointed 12 October 2011
Experience and expertise
Mr Maxwell is a leading oil and gas industry executive with more than 25 years in senior executive roles with companies such as BG Group, Woodside Petroleum Limited and Santos Limited. Mr Maxwell has very successfully led many large commercial, marketing and business development projects.
Prior to joining Cooper Energy Mr Maxwell worked with the BG Group, where he was responsible for all commercial, exploration, business development, strategy and marketing activities in Australia and led BG Group’s entry into Australia including a number of material acquisitions.
Mr Maxwell has served on a number of industry association boards, government advisory groups and public company boards. He was a member of the Australia Federal Government Energy White Paper Reference Group in 2011.
Current and other directorships in the last 3 years
Mr Maxwell is a director of wholly owned subsidiaries of Cooper Energy Ltd.
Special Responsibilities
Mr Maxwell is responsible for the day to day leadership of Cooper Energy. He is the leader of the management team.
Directors’ Statutory ReportFor the year ended 30 June 2015

35
Mr Hector M. Gordon B.Sc. (Hons). FAICD
Executive Director
Appointed 26 June 2012
Experience and expertise
Mr Gordon is a very successful geologist with over 35 years of experience in the petroleum industry. Mr Gordon was previously Managing Director of Somerton Energy until it was acquired by Cooper Energy in 2012. Previously he was an Executive Director with Beach Energy Limited where he was employed for more than 16 years. In this time Beach Energy experienced significant growth and Mr Gordon held a number of roles including Exploration Manager, Chief Operating Officer and, ultimately, Chief Executive Officer. Mr Gordon’s previous employers also include Santos Limited, AGL Petroleum, TMOC Resources, Esso Australia and Delhi Petroleum Pty Ltd.
Current and other directorships in the last 3 years
Mr Gordon is a director of Bass Strait Oil Company Ltd ASX: BAS (since 2014) and various wholly owned subsidiaries of the Company. He is a former director of ERO Mining Limited (2011-2013).
Special Responsibilities
As a part time executive of the Company, Mr Gordon is responsible for reviewing exploration and production activities and providing technical expertise in these areas. He is also Chairman of the HSEC Management Committee and the Indonesian Management Committee.
Mr Jeffrey W. Schneider B.Com
Independent Non-Executive Director
Appointed 12 October 2011
Experience and expertise
Mr Schneider has over 30 years of experience in senior management roles in the oil and gas industry, including 24 years with Woodside Petroleum Limited. He has extensive corporate governance and board experience as both a non-executive director and chairman in resources companies.
Current and other directorships in the last 3 years
Mr Schneider is a former director of Comet Ridge Limited ASX: COI (2003 – 2014) and Green Rock Energy Limited ASX: GRK (2010 – 2013).
Special Responsibilities
Mr Schneider is Chairman of the Remuneration and Nomination Committees and member of the Audit and Risk Committee.
Ms Alice J. M. Williams B.Com, FAICD, FCPA, CFA
Independent Non-Executive Director
Appointed 28 August 2013
Experience and expertise
Ms Williams has over 25 years of senior management and Board level experience in corporate, investment banking and Government sectors.
Ms Williams has been a consultant to major Australian and international corporations as a corporate advisor on strategic and financial assignments. Ms Williams has also been engaged by Federal and State based Government organisations to undertake reviews of competition policy and regulation. Prior appointments include Director of Airservices Australia, Telstra Sale Company, V/Line Passenger Corporation, State Trustees, Western Health and the Australian Accounting Standards Board.
Current and other directorships in the last 3 years
Ms Williams is a non-executive Director of Djerriwarrh Investments Ltd ASX: DJW (since 2010), Equity Trustees Ltd ASX: EQT (since 2007), Barristers Chambers Ltd (since 2015), the Foreign Investment Review Board (since 2015), Guild Group, Defence Health and Port of Melbourne Corporation. Ms Williams is also a Council member of the Cancer Council of Victoria. Ms Williams is a former director of Victorian Funds Management Corporation (2008 – 2015).
Special Responsibilities
Ms Williams is Chairman of the Audit and Risk Committee and a member of the Remuneration and Nomination Committee.
2. Company secretaries
Ms Alison Evans B.A., LLB was appointed to the position of Company Secretary and Legal Counsel on 25 February 2013. Ms Evans is an experienced company secretary and corporate legal counsel with extensive knowledge of corporate and commercial law in the resources and energy sectors. Ms Evans has held Company Secretary and Legal Counsel roles in a number of minerals and energy companies including Centrex Metals, GTL Energy and AGL. Ms Evans’ public company experience is supported by her work at leading corporate law firms.
Mr Jason de Ross was appointed to the position of Company Secretary on 25 November 2013. Mr de Ross has over 20 years’ experience in finance, treasury, strategy and commercial management, mostly in the construction and resources sectors. Prior to joining Cooper Energy as CFO he was employed by OZ Minerals as Group Manager Commercial Operations and was previously Group Commercial Manager and Treasurer with the Futuris/Elders Group.
Directors’ Statutory Report For the year ended 30 June 2015
1. Directors continued

36
3. Directors’ meetings
The number of Directors’ meetings (including meetings of committees of Directors) and number of meetings attended by each of the Directors of the parent entity during the financial year are:
Director Board Meetings Audit & Risk Committee Meetings
Remuneration and Nomination Committee Meetings
A B A B A B
Mr J. Conde AO 8 8 2 2 3 3
Mr D. Maxwell 8 8 - - - -
Mr H. Gordon 8 8 - - - -
Mr J. Schneider 8 8 2 2 3 3
Ms A. Williams 8 8 2 2 3 3
A = Number of meetings attended.
B = Number of meetings held during the time the Director held office, or was a member of the committee, during the year
4. Remuneration report (Audited)
This Remuneration Report sets out information about the remuneration of the Company’s key management personnel for the financial year ended 30 June 2015. The information in this Report has been audited as required by the Corporations Act 2001 (Cth) and forms part of the Directors’ Report.
4.1 Key Management Personnel (KMP)
The following were KMP of the Group during the reporting period and, unless indicated otherwise, for the whole of the reporting period:
Non-Executive Directors Executive Directors
Mr J. Conde AO (Chairman) Mr D. Maxwell (Managing Director)
Mr J. Schneider Mr H. Gordon (Executive Director Production and Exploration)
Ms A. Williams
Executives
Mr J. de Ross (Chief Financial Officer and Company Secretary)
Ms A. Evans (Company Secretary and Legal Counsel)
Mr A. Thomas (Exploration Manager)
Mr I. MacDougall (Operations Manager)
Mr E. Glavas (Commercial and Business Development Manager)1
1 Appointed 4 August 2014
4.2 Remuneration Philosophy and Objectives
The Company is committed to a remuneration philosophy that rewards consistent and sustainable individual performance and superior corporate performance.
Cooper Energy’s approach towards remuneration aims to ensure that an appropriate balance is achieved between:
• maximising sustainable shareholder returns;
• operational and strategic requirements; and
• providing attractive and appropriate remuneration packages to management and employees.
The primary objectives of the Company’s remuneration policy are to:
• attract and retain high-calibre people;
• ensure that remuneration is fair and competitive with both peers and competitor employers;
• provide significant incentive to deliver superior performance (when compared to peers) against Cooper Energy’s strategy and key business goals;
• achieve the most effective returns (employee productivity) for total employee spend; and
• ensure transparency and credibility for all employees and in particular for Executive remuneration.
Directors’ Statutory Report For the year ended 30 June 2015

37
4. Remuneration Report (Audited) continued
4.2 Remuneration Philosophy and Objectives continued
It is the Company’s policy to pay fixed remuneration at the median level of the market and supplement this with the opportunity to earn performance based remuneration. This is intended to bring the overall total remuneration package to the upper quartile of the market only when top level performance is achieved.
4.3 Remuneration Framework
Remuneration for Non-Executive Directors consists of Directors fees and statutory superannuation only, and for employees (including Executive Directors) consists of base salary, statutory superannuation, short term incentives, other short term benefits and long term incentives.
Remuneration is determined by reference to market conditions and comparisons (e.g. benchmark reports). It is determined in conjunction with an annual review of the performance of Executive Directors, Executives and other employees of the Company. Performance of the Directors of the Company, including the Managing Director, is evaluated by the Board, who may be assisted by the Remuneration & Nomination Committee. The Managing Director reviews the performance of Executives with the assistance of the Remuneration & Nomination Committee. These evaluations take into account criteria such as the contribution toward the Company’s performance benchmarks and the achievement of individual performance objectives.
During the reporting period, the Board obtained and used independent Australian hydrocarbon industry remuneration data to benchmark remuneration rates for all employees (see also Section 4.11).
4.4 Remuneration & Nomination Committee
The Company’s Remuneration & Nomination Committee (comprised during the reporting period of 3 Non-Executive Directors, all of whom are independent) makes recommendations to the Board regarding remuneration strategies and policies in relation to KMP. The Committee assesses annually the nature and amount of KMP remuneration by reference to relevant employment market conditions and third party remuneration benchmark reports. The Committee determines remuneration arrangements in conjunction with the annual performance
reviews of KMP.
4.5 Nature and amount of Non-Executive Director remuneration
Non-Executive Directors are remunerated solely by way of fees and statutory superannuation and their remuneration is reviewed annually to ensure that the fees reflect the demands on, and responsibilities of, such Directors. Non-Executive Directors do not receive any performance related remuneration. Non-Executive Director remuneration was last increased in February 2013. After reviewing the Non-executive Directors’ fees, the Board has determined that, given the current market conditions, there would be no increase in Non-Executive Directors fees for the 2016 financial year.
Remuneration paid to the Non-Executive Directors for the reporting period, and for the previous reporting period, is shown in the table in Section 4.14.
The maximum aggregate remuneration pool for Non-Executive Directors, as approved by shareholders at the Company’s 2014 Annual General Meeting, is $750,000 per annum. This pool is not currently fully utilised. It allows for fair and competitive remuneration of additional well-credentialed directors as may be appointed in the future to assist the Company to achieve its strategic goals.
The Company has entered into written letters of appointment with its Non-Executive Directors. The term of the appointment of a Non-Executive Director is determined in accordance with the Company’s Constitution and is subject to the provisions of the Constitution dealing with retirement, re-election and removal of Non-Executive Directors. The Constitution provides that all Non-Executive Directors of the Company are subject to re-election by shareholders by rotation every three years during their term.
The Company has entered into deeds of indemnity, insurance and access with each of the Non-Executive Directors under which the Company will, on the terms set out in the deed, provide an indemnity, maintain an appropriate level of Directors’ & Officers’ indemnity insurance and provide access to Company records.
4.6 Nature and amount of Executive (including Executive Director) remuneration
Executive remuneration during the reporting period consisted of:
• base salary including statutory superannuation;
• short term incentive plan (being performance based cash bonuses);
• other short term benefits; and
• long term incentive plan (being the award of performance rights under the Company’s employee performance rights plan).
Remuneration payable to the Executive Directors, and the Executives, for the reporting period, and for the previous reporting period, is shown in the tables in Sections 4.14 and 4.15 (respectively), and each of the above remuneration components is discussed further below.
Directors’ Statutory Report For the year ended 30 June 2015

38
4. Remuneration Report (Audited) continued
4.6 Nature and amount of Executive (including Executive Director) remuneration continued
Fixed Remuneration - Base salary and superannuation
Base salary is paid in cash and is not at risk (other than by termination). The Company pays statutory superannuation contributions on behalf of the Executives.
Executives are paid base salaries which are competitive in the markets in which the Company operates and consistent with the remuneration philosophy. Individual base salary is set each year based on job description, competitive market salary information sourced by the Company and overall competence of the Executive in fulfilling the requirements of the particular role.
The Company benchmarks Executive base salaries against hydrocarbon industry market surveys which are published annually. Additionally, the pay levels of Executive positions in the Company may be benchmarked against national market executive remuneration surveys. It is the Company’s policy to position itself at the median level of the market when benchmarking base salary.
The Company’s base salary review process is performed annually and takes into consideration factors such as market benchmark increases, changes in individual responsibility, individual performance, the performance of the Company and relevant economic indicators. Overall increases will typically reflect market benchmark increases, with individual increases varying according to an assessment of individual performance.
The Board reviewed the base salaries for the Managing Director and Executive Director – Production & Exploration in August 2015. Following this review, the Board determined that given current market conditions, there would be no increase to their base salaries as a result of this annual review.
Short term incentive plan (STIP)
The short term incentive plan (STIP) award is made by way of a cash bonus.
All performance criteria under the STIP are relevant to the Company’s strategic objectives and designed to incentivise Executives to meet goals which enhance shareholder value. Performance criteria are challenging and maximum award opportunities are only achieved by outstanding performance. Each year the Board reviews and approves the performance criteria for the year ahead.
The maximum short term incentive award opportunities for Executives are as follows:
Position Maximum opportunity as percentage of base salary (including superannuation)
Managing Director 100%
Executive Director 75%
Executives 50%
The relative weighting of Company and individual performance varies dependant on the level of the Executive and is as follows:
Position Company Performance Individual Performance
Managing Director 80% 20%
Executive Director 75% 25%
Executives 70% 30%
The measurement of Company performance is based on the achievement of key performance indicators (KPIs) set out in a Company scorecard. The KPIs focus on the core elements the Board believes are needed to successfully deliver Company strategy and maximise sustainable shareholder returns. Personal performance is measured against performance criteria agreed between the Executive and Cooper Energy each year.
Directors’ Statutory Report For the year ended 30 June 2015
39
4. Remuneration Report (Audited) continued
4.6 Nature and amount of Executive (including Executive Director) remuneration continued
In the financial year 2015, the scorecard KPIs and their relative weightings were as follows:
STIP Key Performance Indicators % Rationale for choosing KPI
HSEC performance20
Care is a core value for Cooper Energy - prioritising safety, health the environment and community.
Increased production from existing assets25
Oil production generates cash flow for the Company which underpins its other activities
Growth in reserves and resources40
Growth in oil and gas reserves and production are at the heart of Cooper Energy’s business. Growth in Cooper Energy’s gas portfolio is a key element of the Company’s eastern states gas strategy
Key gas strategy milestones
Cost management
15
These are enablers to support the Company’s other key drivers in an efficient and cost effective way. By including risk management KPIs, it is made clear to employees that excessive risk taking is not rewarded or encouraged when pursuing incentive awards.
Processes and Risk Management
Stakeholder Relationships
For each KPI in the scorecard, a base or threshold performance level is established the measure for which will be articulated in the scorecard as well as a target, stretch target and super stretch target performance level. The measures will be set in accordance with the following objectives:
Threshold Measure STIP Award as % of maximum opportunity
Base Level of performance that is expected to be achieved and is nearly at target level (ie a near miss)
0 %
Target This is a challenging and achievable level of performance 50%
Stretch Excellent performance - doing better than target and consistent with leading peers
75%
Super stretch Outstanding performance - doing better than, or best in class, when compared to peers
100%
The Board assesses performance against the scorecard each year. Average weighted performance of the total scorecard is the sum of the performance assessed for each item multiplied by the weighting for each item.
In the event of a change in control event such as the Company merging or being taken over, the scorecard may be assessed and/or re-set at the discretion of the Board. The Board may determine to make STIP payments to employees in the instance where the change in control event occurs prior to the completion of the relevant performance year, in which case the STIP will be prorated in accordance with the portion of the year worked.
An employee must have been with the Company for 3 months to qualify for any STIP. If the employee is with the Company for 3 months but less than the full year the STIP is prorated according to the period of time the employee has been with the Company.
If an employee leaves the Company during a year (other than for retirement or due to redundancy) no STIP is payable. If the employee retires or is made redundant then the STIP is prorated in accordance with the portion of the year worked.
STIP payments, if any, are made in October each year. Therefore any STIP payments for the year ended 30 June 2015 will be paid in October 2015. Irrespective of the scorecard outcome, payment of any STIP is entirely at the discretion of the Board.
STIP payments made to Executive Directors, and Executives, during the reporting period, and during the previous reporting period, are shown in the tables in Sections 4.14 and 4.15 (respectively).
Directors’ Statutory Report For the year ended 30 June 2015

40
4. Remuneration Report (Audited) continued
4.6 Nature and amount of Executive (including Executive Director) remuneration continued
Other short term benefits
Other short term benefits for Executives include fringe benefits on car parking, accommodation and other benefits as set out in the table in Section 4.15.
Long term incentive plan
The Company believes that encouraging its employees, including Executives, to become shareholders is the best way of aligning their interests with those of the Company’s shareholders. Having a long term incentive plan is also intended to be a retention incentive for employees (with a vesting period of at least 3 years before securities under the plan are available to employees).
The Company’s current long term incentive plan has been in operation since 2011 (2011 Plan). Following feedback from shareholders at the Company’s 2014 Annual General Meeting, the directors conducted a review of the 2011 Plan including seeking independent advice on the plan, as noted in Section 4.11. Following that review, the Company proposes to implement a new equity incentive plan to address shareholder feedback and better align the Company’s long term incentive plan with its current strategy and objectives and current peer group market practice (New EIP). Shareholders will be asked to approve the new plan at the 2015 Annual General Meeting.
In this reporting period, grants of performance rights were made under the 2011 Plan. Subject to shareholders approving the New EIP, for the next reporting period, it is expected that future grants will be made under the New EIP. The key features of the current 2011 Plan and the offer the Board proposes to make under the New EIP are set out in the following table.
Plan Feature Current 2011 Plan Proposed offer - New EIP
Vehicle Performance Rights A combination of Performance Rights, Share Appreciation Rights (SARs) and/or Options (as determined by the board).3
Rationale for change: This gives the Board flexibility to use the vehicle appropriate to the Company’s objectives at the time of grant. The Board expects to issue 50% SARs and 50% Performance Rights in 2015
Maximum award opportunity for Executives (% of fixed annual remuneration)
Managing Director 120%
Executive Director 95%
Executives 70%
Senior technical employee 50%
Staff 30%
Managing Director 120%
Executive Director 95%
Executives 70%
Senior technical employee 50%
Staff will not participate in long term incentive plan
Performance Period 33% 1 year
33% 2 years
33% 3 years
100% 3 - 4 years (3 years plus 1 retest at 4 years – see below).
Rationale for change: A longer measurement period reflects the Company’s desire to create consistent and sustained shareholder returns over the measurement period.
Vesting Period 3 years 3 – 4 years (3 years plus 1 retest at 4 years – see below).
3 Performance right – a right granted for nil consideration which, on vesting, will result in the employee being entitled to one share in the Company (for nil consideration) or the cash equivalent.
Share Appreciation Right (SAR) – a right granted for nil consideration which, on vesting, will result in the employee being entitled to an amount equal to the difference in value in the Company share price between the grant date and vesting date, settled in cash or shares in the Company (for nil consideration).
Option – a right granted for nil consideration which, on vesting and subject to exercise of the option (including payment of any applicable exercise price), will result in the employee being entitled to one share in the Company for each option exercised (for nil consideration) or the cash equivalent.
Directors’ Statutory Report For the year ended 30 June 2015

41
Plan Feature Current 2011 Plan Proposed offer - New EIP
Performance measures (Non-market)
None (incorporated in STIP) None (incorporated in STIP)
Performance Measures (Market) and Vesting criteria
25%Absolute TSR
< 5% zero vests
=5% 25% vests
=15% 50% vests
> 25%, 100% vests
0% Absolute TSR however no SARs will be exercisable unless the share price appreciates over the measurement period.
75% Relative TSR
Ranked out of 9:
<5 zero vests
5, 50% vests
3 or 4 partial vesting, 1 or 2, 100% vests
(this is equivalent to 75th percentile 100% vests)
100% Relative TSR
<50th percentile = 0% vesting
= 50th percentile = 30% vesting
>50th percentile and < 90th percentile = pro rata vesting
= or >90th percentile = 100% vesting
Rationale for change: Absolute shareholder returns measures can be influenced by factors over which the Company has no control such as the volatility in oil price. Relative measures ensure that incentives are only achieved if Cooper Energy’s performance exceeds that of its peers.
Relative TSR peer group 8 peer group companies: Beach Energy Limited; Senex Energy Limited; Drillsearch Energy Limited; Tap Oil Limited; Cue Energy Resources Limited; Central Petroleum Limited, AWE Limited and Icon Energy Limited.
12 peer group companies: Beach Energy Limited; Senex Energy Limited; Drillsearch Energy Limited; Tap Oil Limited; Central Petroleum Limited, AWE Limited, Icon Energy Limited, Buru Energy Limited, Carnarvon Petroleum Limited, Strike Energy Limited, Empire Oil & Gas NL and Horizon Oil Limited.
Rationale for change: Comparable peers for Cooper Energy are limited, however independent advice to the Company was that an extended peer group was more appropriate.
Re-testing Annually following initial test up until 3 years. 1 retest only 12 months after original 3 year test date
Rationale for change: A retest has been retained but in the context of a longer measurement and vesting period. A re-test is considered to be justified because the Company’s growth is dependent on development of projects that will take greater than 3 years from conception to start-up.
Vesting Vesting to the extent applicable performance criteria are met.
Vesting to the extent applicable performance criteria are met.
Clawback Any unvested rights will not vest if the Board determines that the employee has acted fraudulently, dishonestly or in breach of the Employee's obligations.
Any unvested rights will not vest if the Board determines that the employee has acted fraudulently, dishonestly or in breach of the Employee’s obligations.
Grant frequency Annual Annual
Change of control provisions Board discretion. Pro rata vesting based on service and performance.
4. Remuneration Report (Audited) continued
4.6 Nature and amount of Executive (including Executive Director) remuneration continued
Directors’ Statutory Report For the year ended 30 June 2015

42
Plan Feature Current 2011 Plan Proposed offer - New EIP
Eligibility to participate All employees Management and senior technical staff
Rationale for change: Decisions regarding longer term Company growth are more relevant for management and senior employees. Staff taken out of the LTIP will be given the opportunity to become shareholders by receiving a deferred component of a STIP which will be paid in equity.
Dilution 2% for each tranche
5% total on issue (excluding KMP).
5% total on issue (excluding KMP).
Rationale for change: 5% is the required threshold under ASIC Class Order disclosure relief relating to employee incentive schemes.
4.7 Relationship between remuneration framework and Company performance
The Company’s remuneration policy seeks to encourage alignment between the performance of the Company and the remuneration of Executives.
It is the Company’s policy that the performance based (or at risk) pay of Executives forms a significant portion of their total remuneration. In addition, within performance based pay, an appropriate balance is targeted between rewarding long-term sustainable performance (through the long term incentive plan) and rewarding operational performance (through the short term incentive cash bonuses).
The oil and gas industry is a specialised industry in which highly skilled workers are usually both mobile and highly sought after in Australia and overseas. The Company competes for talent with much larger organisations, often able to pay higher base salaries. It is important that the Company attracts people motivated and aligned to doing all they can to deliver top level performance whilst being mindful of effective employee cost management. In order to attract, motivate, reward and retain the right employees, it is the Company’s policy to pay fixed remuneration at the median level of the market, and supplement this with the opportunity to earn performance based remuneration to bring the overall total remuneration package to the upper quartile level of the market only when top level performance is achieved.
The Company’s remuneration profile for Executives is as follows:
Remuneration Element
Expressed as percentage of total remuneration at target level performance
Expressed as percentage of total remuneration at maximum (super stretch) level performance
Managing Director
Executive Director
Executives Managing Director
Executive Director
Executives
Base 52% 56% 57% 31% 37% 45%
STI 24% 23% 27% 31% 28% 23%
LTI 24% 21% 16% 38% 35% 32%
Total 100% 100% 100% 100% 100% 100%
4. Remuneration Report (Audited) continued
4.6 Nature and amount of Executive (including Executive Director) remuneration continued
Directors’ Statutory Report For the year ended 30 June 2015
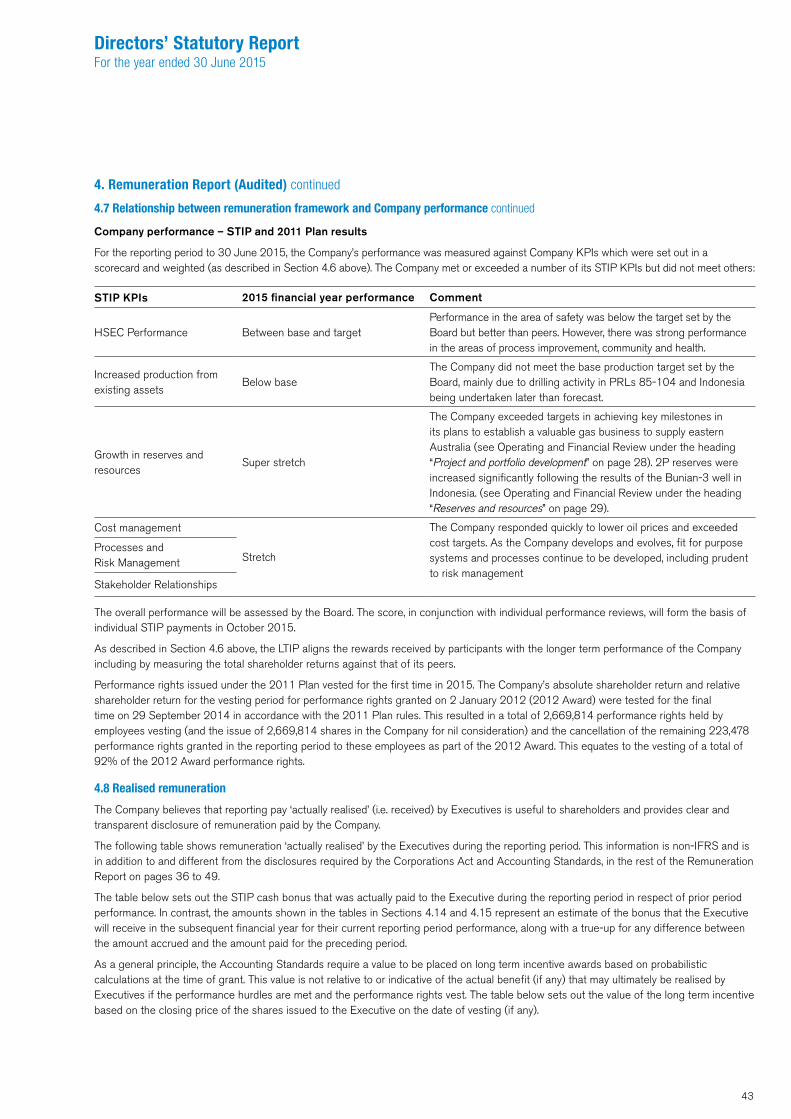
43
4. Remuneration Report (Audited) continued
4.7 Relationship between remuneration framework and Company performance continued
Company performance – STIP and 2011 Plan results
For the reporting period to 30 June 2015, the Company’s performance was measured against Company KPIs which were set out in a scorecard and weighted (as described in Section 4.6 above). The Company met or exceeded a number of its STIP KPIs but did not meet others:
STIP KPIs 2015 financial year performance Comment
HSEC Performance Between base and targetPerformance in the area of safety was below the target set by the Board but better than peers. However, there was strong performance in the areas of process improvement, community and health.
Increased production from existing assets
Below baseThe Company did not meet the base production target set by the Board, mainly due to drilling activity in PRLs 85-104 and Indonesia being undertaken later than forecast.
Growth in reserves and resources
Super stretch
The Company exceeded targets in achieving key milestones in its plans to establish a valuable gas business to supply eastern Australia (see Operating and Financial Review under the heading “Project and portfolio development” on page 28). 2P reserves were increased significantly following the results of the Bunian-3 well in Indonesia. (see Operating and Financial Review under the heading “Reserves and resources” on page 29).
Cost management
Stretch
The Company responded quickly to lower oil prices and exceeded cost targets. As the Company develops and evolves, fit for purpose systems and processes continue to be developed, including prudent to risk management
Processes and Risk Management
Stakeholder Relationships
The overall performance will be assessed by the Board. The score, in conjunction with individual performance reviews, will form the basis of individual STIP payments in October 2015.
As described in Section 4.6 above, the LTIP aligns the rewards received by participants with the longer term performance of the Company including by measuring the total shareholder returns against that of its peers.
Performance rights issued under the 2011 Plan vested for the first time in 2015. The Company’s absolute shareholder return and relative shareholder return for the vesting period for performance rights granted on 2 January 2012 (2012 Award) were tested for the final time on 29 September 2014 in accordance with the 2011 Plan rules. This resulted in a total of 2,669,814 performance rights held by employees vesting (and the issue of 2,669,814 shares in the Company for nil consideration) and the cancellation of the remaining 223,478 performance rights granted in the reporting period to these employees as part of the 2012 Award. This equates to the vesting of a total of 92% of the 2012 Award performance rights.
4.8 Realised remuneration
The Company believes that reporting pay ‘actually realised’ (i.e. received) by Executives is useful to shareholders and provides clear and transparent disclosure of remuneration paid by the Company.
The following table shows remuneration ‘actually realised’ by the Executives during the reporting period. This information is non-IFRS and is in addition to and different from the disclosures required by the Corporations Act and Accounting Standards, in the rest of the Remuneration Report on pages 36 to 49.
The table below sets out the STIP cash bonus that was actually paid to the Executive during the reporting period in respect of prior period performance. In contrast, the amounts shown in the tables in Sections 4.14 and 4.15 represent an estimate of the bonus that the Executive will receive in the subsequent financial year for their current reporting period performance, along with a true-up for any difference between the amount accrued and the amount paid for the preceding period.
As a general principle, the Accounting Standards require a value to be placed on long term incentive awards based on probabilistic calculations at the time of grant. This value is not relative to or indicative of the actual benefit (if any) that may ultimately be realised by Executives if the performance hurdles are met and the performance rights vest. The table below sets out the value of the long term incentive based on the closing price of the shares issued to the Executive on the date of vesting (if any).
Directors’ Statutory Report For the year ended 30 June 2015

44
4. Remuneration Report (Audited) continued
4.8 Realised remuneration continued
Subsequent to this the price of the shares may rise or fall.
Name Year Fixed Remuneration1
$
STIP2
$
LTIP3
$
Other4
$
Total
$
Executive Directors
Mr D. Maxwell 2015 645,000 422,100 465,480 82,810 1,615,390
2014 630,000 280,350 - 68,367 978,717
Mr H. Gordon5 2015 223,736 180,370 - 6,134 410,240
2014 385,000 146,850 - 6,101 537,951
Executives
Mr A. Thomas 2015 396,408 112,283 - 6,248 514,939
2014 390,550 91,341 - 5,568 487,459
Mr J. de Ross 2015 351,719 110,559 - 6,025 468,303
2014 343,350 80,252 - 5,992 429,594
Ms A. Evans6 2015 187,024 55,989 - 6,025 249,038
2014 167,670 11,342 - 5,992 185,004
Mr I. MacDougall 2015 379,019 48,277 - 6,114 433,410
2014 145,661 - - 1,957 147,618
Mr E. Glavas7 2015 241,902 5,000 - 5,112 252,014
2014 - - - - -
1 ‘Fixed Remuneration’ comprises base salary and superannuation.
2 ‘STIP’ is the amount of the STIP cash bonus that was actually paid to the Executive during the 2015 financial year in respect of performance in the 2014 financial year. For the value of the STIP calculated in accordance with the Accounting Standards, see the tables in Section 4.14 and Section 4.15.
3 The figures in this ‘LTIP’ column show the pre-tax vested value of performance rights which vested during the reporting period, calculated based on the share price on the date the performance rights were vested.
4 ‘Other’ short term benefits include fringe benefits on accommodation, car parking and other benefits.
5 Mr Gordon works part time (0.5 full time equivalent – from 1 March 2014) and accordingly his entitlements are prorated.
6 Ms Evans works part time (0.7 full time equivalent) and accordingly her entitlements are prorated.
7 Mr Glavas was appointed on 4 August 2014.
4.9 Options
No options were issued (or forfeited) during the year.
Directors’ Statutory Report For the year ended 30 June 2015

45
4. Remuneration Report (Audited) continued
4.10 Employment contracts
Mr David Maxwell – Managing Director
Mr Maxwell commenced as Managing Director on 12 October 2011 under a contract of employment. The initial term of the Managing Director’s contract expired on 10 October 2014 and was renewed to now end on 10 October 2017.
The Company may terminate the contract by providing twelve months written notice or payment in lieu of notice. The Company may also terminate the contract immediately for cause. Mr Maxwell may terminate the contract by providing 6 months’ written notice.
Mr Hector Gordon – Executive Director Exploration and Production
Mr Gordon commenced as Executive Director Exploration and Production on 26 June 2012 under a contract of employment. The initial term of Mr Gordon’s contract expire on 24 June 2015 and was renewed to now end on 24 June 2017. From 1 March 2014, Mr Gordon’s role has been part-time (0.5 full time equivalent). Mr Gordon continues to provide oversight of the exploration and production business.
Mr Gordon or the Company may terminate the contract by providing six months written notice or payment in lieu of notice. The Company may also terminate the contract immediately for cause.
Deeds of indemnity
The Company also entered into deeds of indemnity, insurance and access with each of the Executive Directors under which the Company will, on the terms set out in the deed, provide an indemnity, maintain an appropriate level of Directors’ & Officers’ indemnity insurance and provide access to Company records.
Executives
The Company has entered into a contract of employment with each Executive. The term of each contract continues until termination. The Company may terminate the contract by providing six months’ notice or payment in lieu of notice. The Company may also terminate the contract immediately for cause. The Executive may terminate the contract by providing 3 months’ written notice.
4.11 External remuneration advisers
During the reporting period, the Remuneration & Nomination Committee engaged Strategic Human Resources Pty Ltd (SHR) to benchmark salaries for all employees, including Executives. This involved the review and application of remuneration data sourced from National Rewards Group Inc. Fees payable to SHR for services to 30 June 2015 totalled $558. Annual membership fees payable to National Rewards Group were $4,785.
In addition, the Remuneration & Nomination Committee engaged Guerdon Associates to provide advice to the Board regarding the Company’s new equity incentive plan. Fees payable to Guerdon Associates for services to 30 June 2015 totalled $12,081.
Egan Associates was engaged by the Remuneration and Nomination Committee to provide advice regarding the terms of renewal of the Managing Director’s contract of employment, including benchmarking of his remuneration package. Fees payable to Egan Associates for this work totalled $14,784.
The Board is satisfied that all remuneration advice received was provided free from undue influence by any KMP to whom the advice related.
4.12 Accounting for performance rights
The value of the performance rights issued under the 2011 Plan is recognised as Share Based Payments in the Company’s statement of comprehensive income and amortised over the vesting period.
Performance rights were granted on 1 December 2014. The performance rights were granted for no consideration and the employee received no cash benefit at the time of receiving the rights. The cash benefit will be received by the employee following the sale of the resultant shares, which can only be achieved after the rights have been vested and the shares are issued.
Performance rights granted under the 2011 Plan were valued by an independent consultant who applied the Monte Carlo simulation model to determine the probability of achievement of the absolute shareholder total return (ASTR), and relative shareholder total return (RSTR), performance conditions (as described in Section 4.6 above).
Directors’ Statutory Report For the year ended 30 June 2015

46
4. Remuneration Report (Audited) continued
4.12 Accounting for performance rights continued
The value of performance rights shown in the tables below are the accounting fair values for grants in the reporting period:
Recipient of rights granted under the 2011 Plan during the reporting period
No. of rights granted during
reporting period
Fair value of rights at grant date
No. of rights under 2011 Plan vested
during reporting period
% of rights under 2011 Plan vested
to 30 June 2015
Executive Directors
Mr D. Maxwell 1,448,737 $281,055 1,483,712 25%
Mr H. Gordon 419,825 $81,446 Nil 0%
Executives
Mr A. Thomas 517,929 $100,478 Nil 0%
Mr J. de Ross 460,914 $89,417 Nil 0%
Ms A. Evans 239,634 $46,489 Nil 0%
Mr I. MacDougall 496,689 $96,358 Nil 0%
Mr E. Glavas 338,039 $65,580 Nil 0%
The vesting date of the performance rights granted on 1 December 2014 is 1 October 2017. The fair value of these rights is $0.194 per right. These performance rights have a commencement date of 30 September 2014.
4.13 Additional remuneration disclosures
Movement in performance rights
The movement during the reporting period in the number of performance rights granted but not exercisable over ordinary shares in Cooper Energy held, directly, indirectly or beneficially, by each KMP, including their related parties, is as follows:
Held at 1 July 2014
Granted Lapsed Vested Held at 30 June 2015
Executive Directors
Mr D. Maxwell 4,430,269 1,448,737 164,001 1,483,712 4,231,293
Mr H. Gordon 1,578,992 419,825 - - 1,998,817
Executives
Mr A. Thomas 1,228,028 517,929 - - 1,745,957
Mr J. de Ross 864,668 460,914 - - 1,325,582
Ms A. Evans 389,577 239,634 - - 629,211
Mr I. MacDougall 312,033 496,689 - - 808,722
Mr E. Glavas - 338,039 - - 338,039
Directors’ Statutory Report For the year ended 30 June 2015

47
4. Remuneration Report (Audited) continued
4.13 Additional remuneration disclosures continued
Held at 1 July 2013
Granted Lapsed Vested Held at 30 June 2014
Executive Directors
Mr D. Maxwell 2,965,705 1,464,564 - - 4,430,269
Mr H. Gordon 728,731 850,261 - - 1,578,992
Executives
Mr A. Thomas 698,412 529,616 - - 1,228,028
Mr J. de Ross 399,059 465,609 - - 864,668
Ms A. Evans 153,782 235,795 - - 389,577
Mr I. MacDougall - 312,033 - - 312,033
Movement in shares
The movement during the reporting period in the number of ordinary shares in Cooper Energy held, directly, indirectly or beneficially, by each KMP, including their related parties, is as follows:
Held at 1 July 2014
Purchases Received on vesting of performance rights
Sales Held at 30 June 2015
Directors
Mr J. Conde AO 250,000 - - - 250,000
Mr D. Maxwell 1,263,190 - 1,483,712 - 2,746,902
Mr H. Gordon 173,608 - - - 173,608
Mr J. Schneider 300,000 - - - 300,000
Ms A. Williams - 30,000 - - 30,000
Executives
Mr J. de Ross 200,000 - - - 200,000
Held at 1 July 2013
Purchases Received on vesting of performance
rights
Sales Held at 30 June 2014
Directors
Mr J. Conde AO - 250,000 - - 250,000
Mr L. J. Shervington 405,933 - - - Resigned
Mr D. Maxwell 1,013,190 250,000 - - 1,263,190
Mr H. Gordon 173,608 - - - 173,608
Mr J. Schneider 300,000 - - - 300,000
Ms A. Williams - - - - -
Executives
Mr J. de Ross - 200,000 - - 200,000
Directors’ Statutory Report For the year ended 30 June 2015

48
4. Remuneration Report (Audited) continued
4.14 Table of Directors’ remuneration for 2014 and 2015 financial years
Benefits
Short TermLong Term
Post Employment
Share Based Payment (b)
Base Salary &
Fees
STIP Other Short Term Benefits (a)
Long Service
Leave
Superannuation LTIP Performance
Rights
Total
Directors $ $ $ $ $ $ $
Mr J. Conde AOAppointed as Chairman on 25/02/13
2015 146,119 - - - 13,881 - 160,000
2014 146,453 - - - 13,547 - 160,000
Mr L. ShervingtonResigned on 07/11/13
2015 - - - - - - -
2014 34,325 - 1,942 - 3,175 - 39,442
Mr J. SchneiderAppointed as Non-Executive Director on 12/10/11
2015 86,758 - - - 8,242 - 95,000
2014 89,627 - - - 8,290 - 97,917
Mr D. MaxwellAppointed as Managing Director on 12/10/11
2015 626,217 509,713 82,810 - 18,783 491,800 1,729,323
2014 612,225 315,000 68,367 - 17,775 442,841 1,456,208
Mr H. GordonAppointed as Executive Director on 26/06/12
2015 204,953 139,901 6,134 - 18,783 215,518 585,289
2014 367,225 139,018 6,101 - 17,775 135,021 665,140
Ms A. WilliamsAppointed as Non-Executive Directoron 28/08/13
2015 86,758 - - - 8,242 - 95,000
2014 70,557 - 1,158 - 6,526 - 78,241
a) Other short term benefits include fringe benefits on accommodation, car parking and other benefits.
b) In accordance with the requirements of the Accounting Standards, remuneration includes a proportion of the value of the equity-linked compensation determined as at the grant date of the performance rights and progressively expensed over the vesting period. The amount allocated as remuneration is not relative to or indicative of the actual benefit (if any) that may ultimately be realised should the equity instruments vest. The value of the performance rights was determined in accordance with AASB 2 Share-based Payments and is discussed in Section 4.12 above and in more detail in Note 26 of the Notes to the Financial Statements. None of the performance rights issued vested and no payments were made for performance rights during the current financial year.
Directors’ Statutory Report For the year ended 30 June 2015

49
4. Remuneration Report (Audited) continued
4.15 Table of Executives’ remuneration for 2014 and 2015 financial years
Benefits
Short TermLong Term
Post Employment
Share Based Remuneration(b)
Base Salary &
Fees
STIP Other Short Term Benefits (a)
Long Service
Leave
Superannuation Performance Rights
Total
Executives $ $ $ $ $ $ $
Mr A. ThomasCommenced as Exploration Manager on 01/07/12
2015 377,625 153,256 6,248 - 18,783 179,910 735,822
2014 372,775 97,638 5,568 - 17,775 114,515 608,271
Mr J. de RossCommenced as Chief Finance Officer on 27/02/12 and as Company Secretary on 25/11/13
2015 332,936 135,551 6,025 - 18,783 126,734 620,029
2014 325,575 108,588 5,992 - 17,775 73,939 531,869
Ms A. EvansCommenced as Company Secretary and Legal Counsel (0.6 FT equivalent) on 21/02/12
2015 168,241 67,961 6,025 - 18,783 46,326 307,336
2014 153,474 43,470 5,992 - 14,196 27,069 244,201
Mr I. MacDougallCommenced as Operations Manager 02/02/14
2015 360,236 146,660 6,114 - 18,783 56,180 587,973
2014 138,664 37,760 1,957 - 6,998 6,241 191,620
Mr E. GlavasCommenced as Commercial and Business Development Manager 04/08/14
2015 224,684 97,799 5,112 - 17,218 12,752 357,565
2014 - - - - - - -
a) Other short term benefits include fringe benefits on accommodation, car parking and other benefits.
b) In accordance with the requirements of the Accounting Standards, remuneration includes a proportion of the value of the equity-linked compensation determined as at the grant date of the performance rights and progressively expensed over the vesting period. The amount allocated as remuneration is not relative to or indicative of the actual benefit (if any) that may ultimately be realised should the equity instruments vest. The value of the performance rights was determined in accordance with AASB 2 Share-based Payments and is discussed in Section 4.12 above and in more detail in Note 26 of the Notes to the Financial Statements. None of the performance rights issued vested and no payments were made for performance rights during the current financial year.
End of remuneration report.
Directors’ Statutory Report For the year ended 30 June 2015

50
5. Principal activities
Cooper Energy is an upstream oil and gas exploration and production company whose primary purpose is to secure, find, develop, produce and sell hydrocarbons. These activities are undertaken either solely or via unincorporated joint ventures. There was no significant change in the nature of these activities during the year.
6. Operating and financial review
Information on the operations and financial position of Cooper Energy and its business strategies and prospects is set out in the Operating and Financial Review.
7. Dividends
The Directors do not recommend the payment of a dividend and no amount has been paid or declared by way of dividends since the end of the previous financial year, or to the date of this report.
8.Environmental regulation
The Group is a party to various exploration and development licences or permits. In most cases, the licence or permit terms specify the environmental regulations applicable to oil and gas operations in the respective jurisdiction. The Group aims to ensure that it complies with the identified regulatory requirements in each jurisdiction in which it operates. There have been no significant known breaches of the environmental obligations of the Group’s licences.
9. Likely developments
Other than disclosed elsewhere in the Financial Report (including the Operating and Financial Review under the heading “2016 Outlook”), further information about likely developments in the operations of the Group and the expected results of those operations in future financial years has not been included in this report because disclosure of the information would likely result in unreasonable prejudice to the consolidated entity.
10. Directors’ interests
The relevant interest of each Director in ordinary shares and options over shares issued by the parent entity as notified by the Directors to the Australian Stock Exchange in accordance with S205G(1) of the Corporations Act 2001, at the date of this reports is as follows:
Cooper Energy Limited
Ordinary Shares Performance Rights
Mr J. Conde AO 250,000 -
Mr D. Maxwell 2,746,902 4,231,293
Mr H. Gordon 173,608 1,998,817
Mr J. Schneider 300,000 -
Ms A. Williams 30,000 -
11. Share options and performance rights
At the date of this report, there are no unissued ordinary shares of the parent entity under option.
At the date of this report, there are 17,023,996 outstanding performance rights granted to employees under the 2011 Plan.
12. Events after financial reporting date
Refer to Note 28 of the Notes to the Financial Statements.
13. Proceedings on behalf of the company
No person has applied to the Court under section 237 of the Corporations Act for leave to bring proceedings on behalf of the Company, or to intervene in any proceedings to which the Company is a party for the purpose of taking responsibility on behalf of the Company for all or part of the proceedings.
No proceedings have been brought or intervened in on behalf of Cooper Energy Limited with leave of the Court under section 237 of the Corporations Act.
Directors’ Statutory Report For the year ended 30 June 2015
51
14. Indemnification and insurance of directors and officers
14.1 Indemnification
The parent entity has agreed to indemnify the current Directors and past Directors of the parent entity and of the subsidiaries, where applicable, against all liabilities (subject to certain limited exclusions) to persons (other than the Group or a related body corporate) which arise out of the performance of their normal duties as a Director or Executive Director unless the liability relates to conduct involving a lack of good faith. The parent entity has agreed to indemnify the Directors and Executive Directors against all costs and expenses incurred in defending an action that falls within the scope of the indemnity and any resulting payments.
14.2 Insurance premiums
During the financial year, the parent entity has paid insurance premiums in respect of Directors’ and Officers’ liability and legal insurance contracts for current and former Directors and Officers including senior employees of the Parent entity.
The insurance premium relates to costs and expenses incurred by the relevant officers in defending proceedings, whether civil or criminal and whatever their outcome and other liabilities that may arise from their position, with the exception of conduct involving a wilful breach of duty or improper use of information or position to gain a personal advantage.
The insurance policy outlined above does not contain details of premiums paid in respect of individual Directors, Officers and senior employees of the parent entity.
15. Indemnification of auditors
To the extent permitted by law, the Company has agreed to indemnify its auditors, Ernst & Young, as part of the terms of its audit engagement agreement against claims by third parties arising from the audit (for an unspecified amount) except in the case where the claim arises because of Ernst & Young’s negligent, wrongful or wilful acts or omissions. No payment has been made to indemnify Ernst & Young during or since the financial year.
16. Auditor’s independence declaration
The auditor’s independence declaration is set out on page 104 and forms part of the Directors’ report for the financial year ended 30 June 2015.
17. Non-audit services
The amounts paid to the auditor of the Group, Ernst & Young and its related practices for non-audit services provided during the year was $nil (2014: $nil).
18. Rounding
The Group is of a kind referred to in ASIC Class Order 98/0100 dated 10 July 1998 and in accordance with that Class Order, amounts in the financial report have been rounded to the nearest thousand dollars, unless otherwise stated.
This report is made in accordance with a resolution of the Directors.
Mr John C. Conde AO Mr David P. MaxwellChairman Managing Director
Dated at Adelaide 17 August 2015
Directors’ Statutory Report For the year ended 30 June 2015

52

5353
Cooper Energy Limited and its controlled entities
Financial StatementsFor the year ended 30 June 2015

54
Consolidated Statement of Comprehensive IncomeFor the year ended 30 June 2015
Consolidated
Notes2015$000
2014$000
Continuing Operations
Revenue from oil sales 4 39,084 72,303
Cost of sales 4 (25,032) (26,056)
Gross profit 14,052 46,247
Other revenue 4 1,867 2,842
Exploration and evaluation expenditure written off (2,342) (1,261)
Finance costs 4 (495) (296)
Impairment 14 (22,642) (3,064)
Reclassification of fair value movement on sale of available for sale investments 3,634 -
Share of loss in associate (166) -
Administration and other expenses 4 (12,696) (13,258)
(Loss) / Profit before tax (18,788) 31,210
Income tax benefit / (expense) 5 2,955 (9,028)
Total tax benefit / (expense) 5 2,955 (9,028)
Net (loss) / profit after tax from continuing operations (15,833) 22,182
Discontinued operations
Total loss for the year from discontinued operations 10 (47,635) (232)
Total profit for the period attributable to members (63,468) 21,950
Other comprehensive income/(expenditure)
Items that may be reclassified subsequently to profit or loss
Foreign currency translation reserve 1,059 (164)
Fair value movements on available for sale investments (8,325) 5,796
Income tax effect on fair value movements 1,346 (1,346)
Reclassification during the year to profit or loss of impairment loss on available for sale investments 7,471 3,064
Reclassification during the year to profit or loss of profit on sale of available for sale investments (3,634) -
Other comprehensive income/(expenditure) for the period net of tax (2,083) 7,350
Total comprehensive income/(loss) for the period attributable to members (65,551) 29,300
cents cents
Basic earnings per share from continuing operations 6 (4.8) 6.7
Diluted earnings per share from continuing operations 6 (4.8) 6.5
Basic earnings per share 6 (19.2) 6.7
Diluted earnings per share 6 (19.2) 6.4
The above Statement of Comprehensive Income should be read in conjunction with the accompanying notes.

55
Consolidated Statement of Financial PositionAs at 30 June 2015
Consolidated
Notes2015$000
2014$000
Assets
Current Assets
Cash and cash equivalents 7 39,373 47,178
Trade and other receivables 8 12,001 11,145
Inventory 940 289
Income tax receivable 859 -
Prepayments 9 640 732
53,813 59,344
Exploration Assets classified as held for sale 10 - 46,906
Total Current Assets 53,813 106,250
Non-Current Assets
Available for sale financial assets 11 1,343 26,040
Investment in associate 12 520 -
Term deposits at banks 7 59 1,919
Oil properties 13 11,921 18,293
Property, plant & equipment 15 981 1,141
Exploration and evaluation 16 105,363 94,621
Total Non-Current Assets 120,187 142,014
Total Assets 174,000 248,264
Liabilities
Current Liabilities
Trade and other payables 17 8,936 12,343
Provisions 18 1,913 553
Income tax payable 5 - 5,040
10,849 17,936
Exploration Liabilities and provisions classified as held for sale 10 - 2,740
Total Current Liabilities 10,849 20,676
Non-Current Liabilities
Deferred tax liabilities 5 11,020 14,431
Provisions 18 45,194 41,360
Financial liabilities 19 3,066 4,004
Total Non-Current Liabilities 59,280 59,795
Total Liabilities 70,129 80,471
Net Assets 103,871 167,793
Equity
Contributed equity 20 115,460 114,625
Reserves 20 6,151 7,440
(Accumulated losses) / Retained profits 20 (17,740) 45,728
Total Equity 103,871 167,793
The above Statement of Financial Position should be read in conjunction with the accompanying notes.
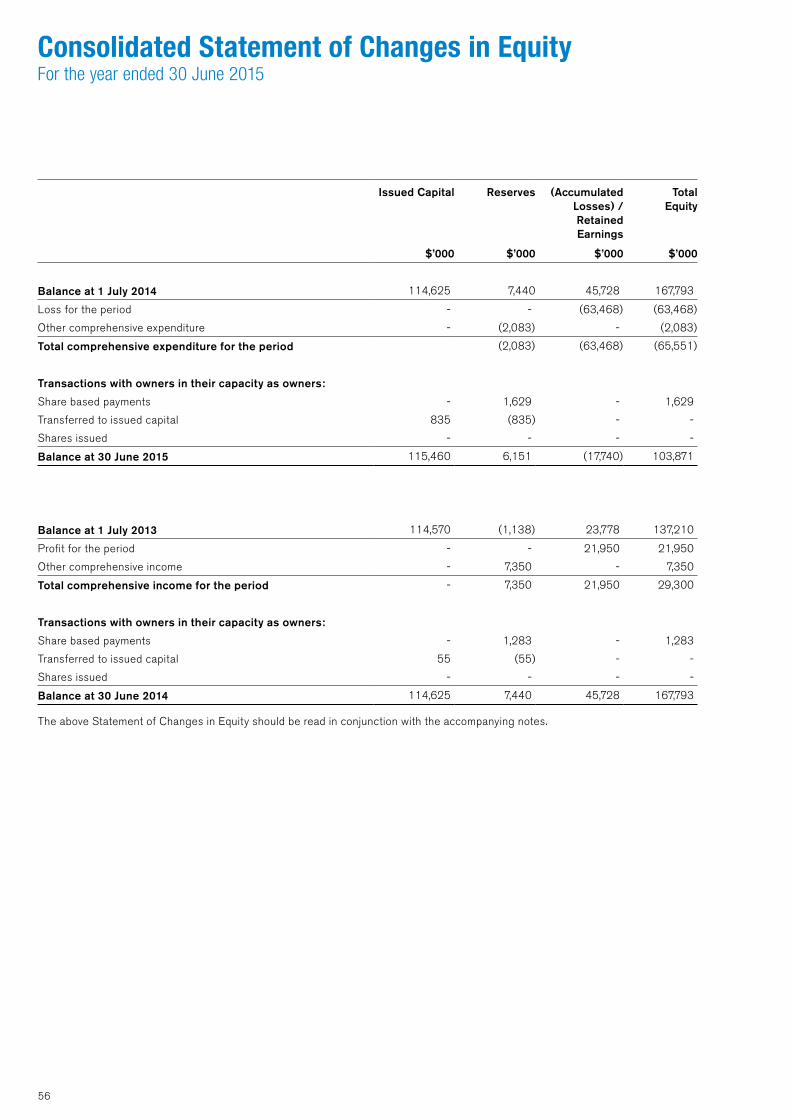
56
Consolidated Statement of Changes in EquityFor the year ended 30 June 2015
Issued Capital Reserves (Accumulated Losses) / Retained Earnings
Total Equity
$’000 $’000 $’000 $’000
Balance at 1 July 2014 114,625 7,440 45,728 167,793
Loss for the period - - (63,468) (63,468)
Other comprehensive expenditure - (2,083) - (2,083)
Total comprehensive expenditure for the period (2,083) (63,468) (65,551)
Transactions with owners in their capacity as owners:
Share based payments - 1,629 - 1,629
Transferred to issued capital 835 (835) - -
Shares issued - - - -
Balance at 30 June 2015 115,460 6,151 (17,740) 103,871
Balance at 1 July 2013 114,570 (1,138) 23,778 137,210
Profit for the period - - 21,950 21,950
Other comprehensive income - 7,350 - 7,350
Total comprehensive income for the period - 7,350 21,950 29,300
Transactions with owners in their capacity as owners:
Share based payments - 1,283 - 1,283
Transferred to issued capital 55 (55) - -
Shares issued - - - -
Balance at 30 June 2014 114,625 7,440 45,728 167,793
The above Statement of Changes in Equity should be read in conjunction with the accompanying notes.

57
Consolidated Statement of Cash FlowsFor the year ended 30 June 2015
Consolidated
Notes
2015$000
2014$000
Cash Flows from Operating Activities
Receipts from customers 38,613 80,991
Payments to suppliers and employees (33,065) (32,431)
Income tax (paid)/received (5,062) 300
Interest received – other entities 1,549 1,398
Net cash from operating activities 7 2,035 50,258
Cash Flows from Investing Activities
Transfers of term deposits 1,860 2,847
Payment for available for sale financial assets 11 - (62)
Receipts from sale of other property, plant & equipment - 12
Payment for acquisition of investment in associate (273) -
Receipts from sale of financial assets 11 15,660 -
Payments for exploration and evaluation (13,189) (41,456)
Acquisition of exploration and evaluation (4,470) (1,877)
Investments in oil properties (9,763) (5,967)
Net cash flows used in investing activities (10,175) (46,503)
Cash Flows from Financing Activities
Payment for shares - (55)
Net cash flow used in financing activities - (55)
Net (decrease)/increase in cash held (8,140) 3,700
Net foreign exchange differences 335 324
Cash and Cash Equivalents At 1 July 47,178 43,154
Cash and Cash Equivalents At 30 June 7 39,373 47,178
The above Statement of Cash Flows should be read in conjunction with the accompanying notes.

58
Notes to the Financial StatementFor the year ended 30 June 2015
1. Corporate information
The consolidated financial report of Cooper Energy Limited (the parent entity) for the year ended 30 June 2015 was authorised for issue in accordance with a resolution of the Directors on 14 August 2015.
Cooper Energy Limited is a company limited by shares incorporated and domiciled in Australia whose shares are publicly traded on the Australian Securities Exchange.
The nature of the operations and principal activities of the Group are described in note 5 of the Directors Report.
2. Summary of significant accounting policies
a) Basis of preparation
The financial report is a general-purpose financial report, which has been prepared in accordance with the requirements of the Corporations Act 2001 and Australian Accounting Standards and other authoritative pronouncements of the Australian Accounting Standards Board.
The financial report has also been prepared on a historical cost basis, except for available for sale financial assets which have been measured at fair value. Cooper Energy Limited is a for profit company.
The financial report is presented in Australian dollars and all values are rounded to the nearest thousand dollars ($’000) unless otherwise stated under the option available to the Group under ASIC Class Order 98/0100. The Group is an entity to which the class order applies.
Significant event and transaction
On 16 December 2014 Cooper Energy Ltd announced the acquisition of a 50% interest in the Sole gas field and Orbost Gas Plant. The acquisition was completed in May 2015. This acquisition consisted of one retention licence with undeveloped resources, the Orbost Gas Plant and land and the assumption of abandonment liabilities relating to one appraisal well and the gas plant. For cash consideration of $2.5 million and pre completion costs of $2.0 million, Cooper Energy made an asset acquisition consisting of the following:
• Sole exploration and evaluation asset $12.6 million
• Appraisal well abandonment liability $2.4 million
• Orbost Gas Plant and land abandonment liability $5.8 million
b) Statement of compliance
(i) Changes in accounting policy and disclosures
The financial report complies with Australian Accounting Standards and International Financial Reporting Standards (“IFRS”) as issued by the International Accounting Standards Board.
The Accounting policies adopted are consistent with those of the previous financial year except as follows:
The Group has adopted the following new and amended Australian Accounting Standard and AASB Interpretations as of 1 July 2015:
• AASB 2012-3 Amendments to Australian Accounting Standards – Offsetting Financial Assets and Financial Liabilities
• AASB 2013-3 Amendments to AASB 136 – Recoverable Amount Disclosure for Non-Financial Assets
• AASB 1031 Materiality
• AASB 2013-9 Amendments to Australian Accounting Standards – Conceptual Framework, Materiality and Financial Instruments
• AASB 2014-1 Part A -Annual Improvements 2010–2012 Cycle
• AASB 2014-1 Part A -Annual Improvements 2011–2013 Cycle
Adoption of these standard interpretations is described below:

59
Notes to the Financial StatementFor the year ended 30 June 2015
2. Summary of significant accounting policies continued
b) Statement of compliance continued
AASB 2012-3 Amendments to Australian Accounting Standards - Offsetting Financial Assets and Financial Liabilities
Summary AASB 2012-3 adds application guidance to AASB 132 Financial Instruments: Presentation to address inconsistencies identified in applying some of the offsetting criteria of AASB 132, including clarifying the meaning of "currently has a legally enforceable right of set-off" and that some gross settlement systems may be considered equivalent to net settlement.
Application Date of the Standard 1 January 2014
Application date for Group 1 July 2014
Impact on Group financial report The application of this standard has not resulted in any significant change in the 2015 year end accounts.
AASB 2013-3 Amendments to AASB 136 – Recoverable Amount Disclosures for Non-Financial Assets
Summary AASB 2013-3 amends the disclosure requirements in AASB 136 Impairment of Assets. The amendments include the requirement to disclose additional information about the fair value measurement when the recoverable amount of impaired assets is based on fair value less costs of disposal.
Application Date of the Standard 1 January 2014
Application date for Group 1 July 2014
Impact on Group financial report The application of this standard has not resulted in any significant change in the 2015 year end accounts.
AASB 1031 Materiality
Summary The revised AASB 1031 is an interim standard that cross-references to other Standards and the Framework (issued December 2013) that contain guidance on materiality. AASB 1031 will be withdrawn when references to AASB 1031 in all Standards and Interpretations have been removed
Application Date of the Standard 1 January 2014
Application Date for Group 1 July 2014
Impact on Group Financial report The application of this standard has not resulted in any significant change in the 2015 year end accounts.
AASB 2013-9 Amendments to Australian Accounting Standards – Conceptual Framework, Materiality and Financial Instruments
Summary The Standard contains three main parts and makes amendments to a number Standards and Interpretations.
Part A of AASB 2013-9 makes consequential amendments arising from the issuance of AASB CF 2013-1.
Part B makes amendments to particular Australian Accounting Standards to delete references to AASB 1031 and also makes minor editorial amendments to various other standards.
Part C makes amendments to a number of Australian Accounting Standards, including incorporating Chapter 6 Hedge Accounting into AASB 9 Financial Instruments.
Application Date of the Standard 1 January 2014
Application Date for Group 1 July 2014
Impact on Group Financial report The application of this standard has not resulted in any significant change in the 2015 year end accounts.

60
Notes to the Financial StatementFor the year ended 30 June 2015
AASB 2014-1 Part A -Annual Improvements
2010–2012 Cycle
Summary AASB 2014-1 Part A: This standard sets out amendments to Australian Accounting Standards arising from the issuance by the International Accounting Standards Board (IASB) of International Financial Reporting Standards (IFRSs) Annual Improvements to IFRSs 2010–2012 Cycle and Annual Improvements to IFRSs 2011–2013 Cycle.
Annual Improvements to IFRSs 2010–2012 Cycle addresses the following items:
• AASB 2 - Clarifies the definition of ‘vesting conditions’ and ‘market condition’ and introduces the definition of ‘performance condition’ and ‘service condition’.
• AASB 3 - Clarifies the classification requirements for contingent consideration in a business combination by removing all references to AASB 137.
• AASB 8 - Requires entities to disclose factors used to identify the entity’s reportable segments when operating segments have been aggregated. An entity is also required to provide a reconciliation of total reportable segments’ asset to the entity’s total assets.
• AASB 116 & AASB 138 - Clarifies that the determination of accumulated depreciation does not depend on the selection of the valuation technique and that it is calculated as the difference between the gross and net carrying amounts.
AASB 124 - Defines a management entity providing KMP services as a related party of the reporting entity. The amendments added an exemption from the detailed disclosure requirements in paragraph 17 of AASB 124 for KMP services provided by a management entity. Payments made to a management entity in respect of KMP services should be separately disclosed.
Application Date of the Standard 1 July 2014
Application Date for Group 1 July 2014
Impact on Group Financial report The application of this standard has not resulted in any significant change in the 2015 year end accounts.
AASB 2014-1 Part A -Annual Improvements
2011–2013 Cycle
Summary Annual Improvements to IFRSs 2011–2013 Cycle addresses the following items:
• AASB13 - Clarifies that the portfolio exception in paragraph 52 of AASB 13 applies to all contracts within the scope of AASB 139 or AASB 9, regardless of whether they meet the definitions of financial assets or financial liabilities as defined in AASB 132.
• AASB 140 - Clarifies that judgment is needed to determine whether an acquisition of investment property is solely the acquisition of an investment property or whether it is the acquisition of a group of assets or a business combination in the scope of AASB 3 that includes an investment property. That judgment is based on guidance in AASB 3.
Application Date of the Standard 1 July 2014
Application Date for Group 1 July 2014
Impact on Group Financial report The application of this standard has not resulted in any significant change in the 2015 year end accounts.
(ii) Accounting standards and interpretations issued but not yet effective
The accounting standards and interpretations that have recently been issued or amended but are not yet effective and have not been adopted by the Group and for which the Group has elected not to early adopt for the annual reporting period ending 30 June 2015, are outlined below:
2. Summary of significant accounting policies continued
b) Statement of compliance continued

61
Notes to the Financial StatementFor the year ended 30 June 2015
AASB 2014-3 Amendments to Australian Accounting Standards – Accounting for Acquisitions of Interests in Joint Operations
[AASB 1 & AASB 11]
Summary AASB 2014-3 amends AASB 11 to provide guidance on the accounting for acquisitions of interests in joint operations in which the activity constitutes a business. The amendments require:
(a) the acquirer of an interest in a joint operation in which the activity constitutes a business, as defined in AASB 3 Business Combinations, to apply all of the principles on business combinations accounting in AASB 3 and other Australian Accounting Standards except for those principles that conflict with the guidance in AASB 11; and
(b) the acquirer to disclose the information required by AASB 3 and other Australian Accounting Standards for business combinations.
This Standard also makes an editorial correction to AASB 11
Application Date of the Standard 1 January 2016
Application Date for Group 1 July 2016
Impact on Group Financial report The adoption of this standard in the current format is not expected to have a material impact on the Group.
AASB 2014-10 Amendments to Australian Accounting Standards – Sale or Contribution of Assets between an Investor and its Associate or Joint Venture
Summary AASB 2014-10 amends AASB 10 Consolidated Financial Statements and AASB 128 to address an inconsistency between the requirements in AASB 10 and those in AASB 128 (August 2011), in dealing with the sale or contribution of assets between an investor and its associate or joint venture. The amendments require:
(a) a full gain or loss to be recognised when a transaction involves a business (whether it is housed in a subsidiary or not); and
(b) a partial gain or loss to be recognised when a transaction involves assets that do not constitute a business, even if these assets are housed in a subsidiary.
AASB 2014-10 also makes an editorial correction to AASB 10.
AASB 2014-10 applies to annual reporting periods beginning on or after 1 January 2016. Early adoption permitted.
Application Date of the Standard 1 January 2016
Application Date for Group 1 July 2016
Impact on Group Financial report The adoption of this standard in the current format is not expected to have a material impact on the Group.
2. Summary of significant accounting policies continued
b) Statement of compliance continued

62
Notes to the Financial StatementFor the year ended 30 June 2015
AASB 2015-1 Amendments to Australian Accounting Standards – Annual Improvements to Australian Accounting Standards 2012–2014 Cycle
Summary The subjects of the principal amendments to the Standards are set out below:
AASB 5 Non-current Assets Held for Sale and Discontinued Operations:
• Changes in methods of disposal – where an entity reclassifies an asset (or disposal group) directly from being held for distribution to being held for sale (or vice versa), an entity shall not follow the guidance in paragraphs 27–29 to account for this change.
AASB 7 Financial Instruments: Disclosures:
• Servicing contracts - clarifies how an entity should apply the guidance in paragraph 42C of AASB 7 to a servicing contract to decide whether a servicing contract is ‘continuing involvement’ for the purposes of applying the disclosure requirements in paragraphs 42E–42H of AASB 7.
• Applicability of the amendments to AASB 7 to condensed interim financial statements - clarify that the additional disclosure required by the amendments to AASB 7 Disclosure–Offsetting Financial Assets and Financial Liabilities is not specifically required for all interim periods. However, the additional disclosure is required to be given in condensed interim financial statements that are prepared in accordance with AASB 134 Interim Financial Reporting when its inclusion would be required by the requirements of AASB 134.
AASB 119 Employee Benefits:
• Discount rate: regional market issue - clarifies that the high quality corporate bonds used to estimate the discount rate for post-employment benefit obligations should be denominated in the same currency as the liability. Further it clarifies that the depth of the market for high quality corporate bonds should be assessed at the currency level.
AASB 134 Interim Financial Reporting:
• Disclosure of information ‘elsewhere in the interim financial report’ -amends AASB 134 to clarify the meaning of disclosure of information ‘elsewhere in the interim financial report’ and to require the inclusion of a cross-reference from the interim financial statements to the location of this information.
Application Date of the Standard 1 January 2016
Application Date for Group 1 July 2016
Impact on Group Financial report The adoption of these updates is not expected to have a material impact on the Group.
AASB 2015-2 Amendments to Australian Accounting Standards – Disclosure Initiative: Amendments to AASB 101
Summary The Standard makes amendments to AASB 101 Presentation of Financial Statements arising from the IASB’s Disclosure Initiative project. The amendments are designed to further encourage companies to apply professional judgment in determining what information to disclose in the financial statements. For example, the amendments make clear that materiality applies to the whole of financial statements and that the inclusion of immaterial information can inhibit the usefulness of financial disclosures. The amendments also clarify that companies should use professional judgment in determining where and in what order information is presented in the financial disclosures.
Application Date of the Standard 1 January 2016
Application Date for Group 1 July 2016
Impact on Group Financial report The adoption of these updates is not expected to have a material impact on the Group.
2. Summary of significant accounting policies continued
b) Statement of compliance continued

63
Notes to the Financial StatementFor the year ended 30 June 2015
2. Summary of significant accounting policies continued
b) Statement of compliance continued
AASB 2015-3 Amendments to Australian Accounting Standards arising from the Withdrawal of AASB 1031 Materiality
Summary The Standard completes the AASB’s project to remove Australian guidance on materiality from Australian Accounting Standards.
Application Date of the Standard 1 July 2015
Application Date for Group 1 July 2015
Impact on Group Financial report The adoption of this standard is not expected to have a material impact on the Group.
AASB 2014-4 Clarification of Acceptable Methods of Depreciation and Amortisation (Amendments to IAS 16 and IAS 38)
Summary AASB 116 and AASB 138 both establish the principle for the basis of depreciation and amortisation as being the expected pattern of consumption of the future economic benefits of an asset.
The IASB has clarified that the use of revenue-based methods to calculate the depreciation of an asset is not appropriate because revenue generated by an activity that includes the use of an asset generally reflects factors other than the consumption of the economic benefits embodied in the asset.
The amendment also clarified that revenue is generally presumed to be an inappropriate basis for measuring the consumption of the economic benefits embodied in an intangible asset. This presumption, however, can be rebutted in certain limited circumstances.
Application Date of the Standard 1 January 2016
Application Date for Group 1 July 2016
Impact on Group Financial report The Group currently uses diminishing value and units of production bases for the calculation of depreciation and amortisation. This standard will have no impact upon the Group’s current methodologies.
AASB 15 Revenue from Contracts with Customers
Summary In May 2014, the IASB issued IFRS 15 Revenue from Contracts with Customers, which replaces IAS 11 Construction Contracts, IAS 18 Revenue and related Interpretations (IFRIC 13 Customer Loyalty Programmes, IFRIC 15 Agreements for the Construction of Real Estate, IFRIC 18 Transfers of Assets from Customers and SIC-31 Revenue—Barter Transactions Involving Advertising Services).
The core principle of IFRS 15 is that an entity recognises revenue to depict the transfer of promised goods or services to customers in an amount that reflects the consideration to which the entity expects to be entitled in exchange for those goods or services. An entity recognises revenue in accordance with that core principle by applying the following steps:
(a) Step 1: Identify the contract(s) with a customer
(b) Step 2: Identify the performance obligations in the contract
(c) Step 3: Determine the transaction price
(d) Step 4: Allocate the transaction price to the performance obligations in the contract
(e) Step 5: Recognise revenue when (or as) the entity satisfies a performance obligation
Early application of this standard is permitted.
AASB 2014-5 incorporates the consequential amendments to a number Australian Accounting Standards (including Interpretations) arising from the issuance of AASB 15.
Application Date of the Standard 1 January 2017
Application Date for Group The International Accounting Standards Board (IASB) in its July 2015 meeting decided to confirm its proposal to defer the effective date of IFRS 15 (the international equivalent of AASB 15) from 1 January 2017 to 1 January 2018. The amendment to give effect to the new effective date for IFRS 15 is expected to be issued in September 2015. At this time, it is expected that the AASB will make a corresponding amendment to AASB 15, which will mean that the application date of this standard for the Group will move from 1 July 2017 to 1 July 2018.
Impact on Group Financial report The group is currently assessing the impact of this standard however, given the small number of individual contracts currently in place the Group expects the impact will be minimised.
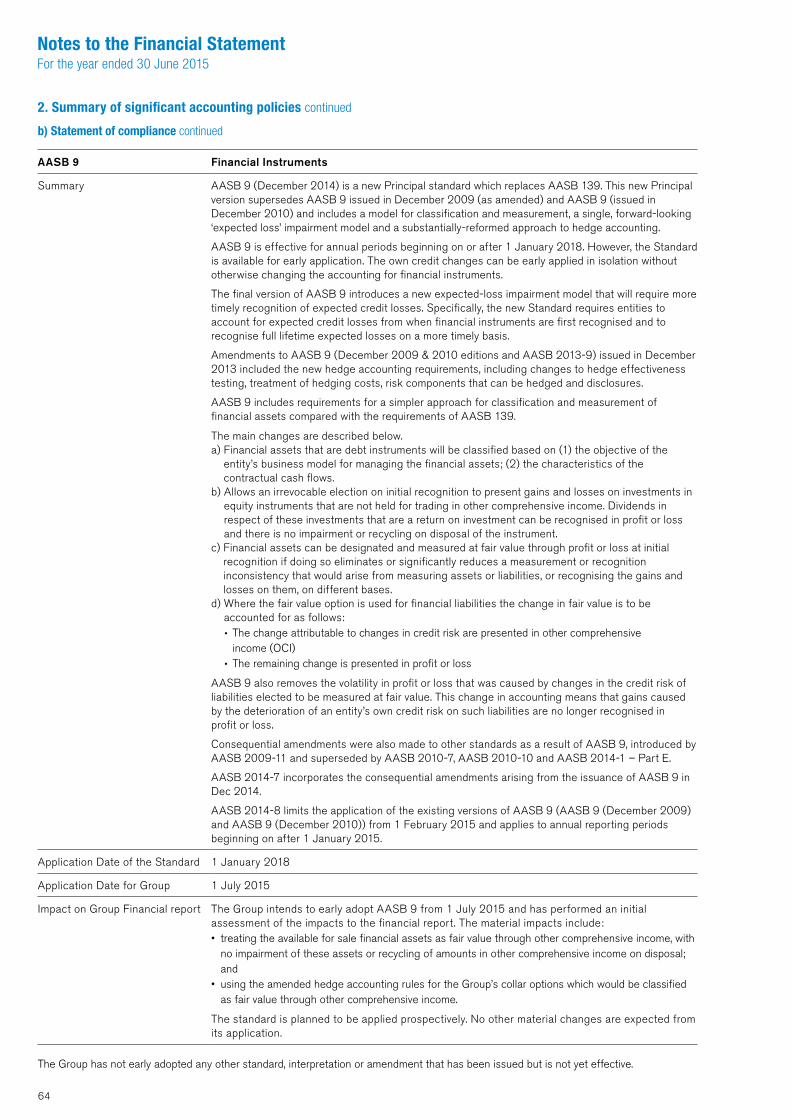
64
Notes to the Financial StatementFor the year ended 30 June 2015
AASB 9 Financial Instruments
Summary AASB 9 (December 2014) is a new Principal standard which replaces AASB 139. This new Principal version supersedes AASB 9 issued in December 2009 (as amended) and AASB 9 (issued in December 2010) and includes a model for classification and measurement, a single, forward-looking ‘expected loss’ impairment model and a substantially-reformed approach to hedge accounting.
AASB 9 is effective for annual periods beginning on or after 1 January 2018. However, the Standard is available for early application. The own credit changes can be early applied in isolation without otherwise changing the accounting for financial instruments.
The final version of AASB 9 introduces a new expected-loss impairment model that will require more timely recognition of expected credit losses. Specifically, the new Standard requires entities to account for expected credit losses from when financial instruments are first recognised and to recognise full lifetime expected losses on a more timely basis.
Amendments to AASB 9 (December 2009 & 2010 editions and AASB 2013-9) issued in December 2013 included the new hedge accounting requirements, including changes to hedge effectiveness testing, treatment of hedging costs, risk components that can be hedged and disclosures.
AASB 9 includes requirements for a simpler approach for classification and measurement of financial assets compared with the requirements of AASB 139.
The main changes are described below.a) Financial assets that are debt instruments will be classified based on (1) the objective of the
entity’s business model for managing the financial assets; (2) the characteristics of the contractual cash flows.
b) Allows an irrevocable election on initial recognition to present gains and losses on investments in equity instruments that are not held for trading in other comprehensive income. Dividends in respect of these investments that are a return on investment can be recognised in profit or loss and there is no impairment or recycling on disposal of the instrument.
c) Financial assets can be designated and measured at fair value through profit or loss at initial recognition if doing so eliminates or significantly reduces a measurement or recognition inconsistency that would arise from measuring assets or liabilities, or recognising the gains and losses on them, on different bases.
d) Where the fair value option is used for financial liabilities the change in fair value is to be accounted for as follows:• The change attributable to changes in credit risk are presented in other comprehensive
income (OCI)• The remaining change is presented in profit or loss
AASB 9 also removes the volatility in profit or loss that was caused by changes in the credit risk of liabilities elected to be measured at fair value. This change in accounting means that gains caused by the deterioration of an entity’s own credit risk on such liabilities are no longer recognised in profit or loss.
Consequential amendments were also made to other standards as a result of AASB 9, introduced by AASB 2009-11 and superseded by AASB 2010-7, AASB 2010-10 and AASB 2014-1 – Part E.
AASB 2014-7 incorporates the consequential amendments arising from the issuance of AASB 9 in Dec 2014.
AASB 2014-8 limits the application of the existing versions of AASB 9 (AASB 9 (December 2009) and AASB 9 (December 2010)) from 1 February 2015 and applies to annual reporting periods beginning on after 1 January 2015.
Application Date of the Standard 1 January 2018
Application Date for Group 1 July 2015
Impact on Group Financial report The Group intends to early adopt AASB 9 from 1 July 2015 and has performed an initial assessment of the impacts to the financial report. The material impacts include:• treating the available for sale financial assets as fair value through other comprehensive income, with
no impairment of these assets or recycling of amounts in other comprehensive income on disposal; and
• using the amended hedge accounting rules for the Group’s collar options which would be classified as fair value through other comprehensive income.
The standard is planned to be applied prospectively. No other material changes are expected from its application.
The Group has not early adopted any other standard, interpretation or amendment that has been issued but is not yet effective.
2. Summary of significant accounting policies continued
b) Statement of compliance continued

65
Notes to the Financial StatementFor the year ended 30 June 2015
2. Summary of significant accounting policies continued
c) Basis of consolidation
The consolidated financial statements are those of the consolidated entity, comprising Cooper Energy Limited (“the parent entity”) and its subsidiaries (“the Group”).
The financial statements of subsidiaries are prepared for the same reporting period as the parent entity, using consistent accounting policies. Adjustments are made to bring into line any dissimilar accounting policies that may exist. All inter-company balances and transactions, income and expenses and profit and losses arising from intra-group transactions, have been eliminated in full.
Subsidiaries are consolidated from the date on which control is transferred to the Group and cease to be consolidated from the date on which control is transferred out of the Group.
d) Business combinations
Business combinations are accounted for using the acquisition method. The cost of an acquisition is measured as the aggregate of the consideration transferred, measured at acquisition date fair value and the amount of any non-controlling interest in the acquiree. For each business combination, the Group elects whether it measures the non-controlling interest in the acquiree at fair value or at the proportionate share of the acquiree’s identifiable net assets. Acquisition costs incurred are expensed and included in administrative expenses.
When the Group acquires a business, it assesses the financial assets and liabilities assumed for appropriate classification and designation in accordance with the contractual terms, economic circumstances and pertinent conditions as at the acquisition date. This includes the separation of embedded derivatives in host contracts by the acquiree.
If the business combination is achieved in stages, the acquisition date fair value of the acquirers previously held equity interest in the acquiree is remeasured to fair value at the acquisition date through profit or loss.
Any contingent consideration to be transferred by the acquirer will be recognised at fair value at the acquisition date. Subsequent changes to the fair value of the contingent consideration that is deemed to be an asset or liability will be recognised in accordance with AASB 139 either in profit or loss or as a change to other comprehensive income. If the contingent consideration is classified as equity it will not be remeasured. Subsequent settlement is accounted for within equity. In instances where the contingent consideration does not fall within the scope of AASB 139, it is measured in accordance with the appropriate AASB.
Goodwill is initially measured at cost, being the excess of the aggregate of the consideration transferred and the amount recognised for non-controlling interest over the net identifiable assets acquired and liabilities assumed. If this consideration is lower than the fair value of the net assets of the subsidiary acquired, the difference is recognised in profit or loss.
After initial recognition, goodwill is measured at cost less any accumulated impairment losses. For the purpose of impairment testing, goodwill acquired in a business combination is, from the acquisition date, allocated to each of the Group’s cash-generating units that are expected to benefit from the combination, irrespective of whether other assets or liabilities of the acquirer are assigned to those units.
Where goodwill forms part of the cash generating unit and part of the operation within that unit is disposed of, the goodwill associated with the operation disposed of is included in the carrying amount of the operation when determining the gain or loss on disposal of the operation. Goodwill disposed of in this circumstance is measured based on the relative values of the operation disposed of and the portion of the cash-generating unit retained.
e) Joint arrangements
The Group has an interest in arrangements that are controlled jointly. A joint arrangement is either a joint operation or a joint venture. The Group has a number of joint arrangements which are classified as joint operations. A joint operation is a joint arrangement whereby the parties that have joint control of the arrangement, have rights to the assets, and obligations for the liabilities, relating to the arrangement. Currently the Group does not have any interests in joint ventures.
In relation to its interests in joint operations, the Group recognises its:
• Assets, including its share of any assets held jointly
• Liabilities, including its share of any liabilities incurred jointly
• Revenue from the sale of its share of the output arising from the joint operation
• Share of the revenue from the sale of the output by the joint operation
• Expenses, including its share of any expenses incurred jointly
f) Foreign currency
The functional and presentation currency of the Company is Australian dollars.
Translation of foreign currency transactions
Transactions in foreign currencies are initially recorded in the functional currency of the transacting entity at the exchange rates ruling at the date of transaction. Monetary assets and liabilities denominated in foreign currencies at the reporting date are translated at the rates of exchange ruling at that date. Exchange differences in the consolidated financial statements are taken to the income statement.
Translation of the financial result of foreign operations
An entity’s functional currency is the currency of the primary economic environment in which the entity, or a significant component of the entity, operates.

66
Notes to the Financial StatementFor the year ended 30 June 2015
2. Summary of significant accounting policies continued
f) Foreign currency continued
Other than Sukananti Ltd, which has a US dollar functional currency, all other foreign operations of the group have an Australian dollar functional currency.
g) Investments
Available-for-sale Investments
Investments are classified as available-for-sale and are initially recognised at fair value plus any directly attributable transaction costs. The classification depends on the purpose for which the investments were acquired. Designation will be re-evaluated at each financial year-end.
After initial recognition, investments are remeasured to fair value. Changes in the fair value of available-for-sale investments are recognised as a separate component of equity until the investment is sold, collected or otherwise disposed of, or until the investment is determined to be impaired when there is a significant or prolonged decline in the fair value, at which time the cumulative change in fair value previously reported in equity is included in earnings.
For investments that are actively traded in organised financial markets, fair value is determined by reference to stock exchange quoted market bid prices at the close of business on the Consolidated Statement of Financial Position date. Where investments are not actively traded, fair value is established by using other market accepted valuation techniques.
Investments in associates
Investments in associates are initially recognised at cost. Any surplus over the Group’s share in the associates net assets on acquisition is accounted for as goodwill; any deficit is treated as an accounting gain and recognise immediately in the income statement.
After initial recognition, the Group recognises its share of the associated profit or loss.
h) Revenue and cost recognition
Revenue is recognised and measured at fair value of consideration received or receivable to the extent that it is probable that the economic benefits will flow to the Group and the revenue can be reliably measured. The following specific recognition criteria must also be met before revenue is recognised:
Revenues and costs from production sharing contracts
Revenue earned and production costs incurred from a production sharing contract are recognised when title to the product passes to the customer and is based upon the Group’s share of sales and costs relating to oil production that are allocated to the Group under the contract.
Interest revenue
Interest revenue is recognised as interest accrues (using the effective interest method, which is the rate that exactly discounts estimated future cash receipts through the expected life of the financial instrument) to the net carrying amount of the financial asset.
Joint venture fees
Joint venture fees are in respect of the Group’s parent’s ability to recover overhead costs relating to operated activities. Joint venture fees include overhead recoveries on operated activities, parent company overheads, operator overhead allowances and other indirect charges. Revenue is recognised when the Group’s right to receive payment is established or services are rendered.
i) Depreciation and amortisation
Oil properties are amortised on the Units of Production basis using the best estimate of proved and probable (2P) reserves. No amortisation is charged on areas under development where production has not commenced.
Depreciation on property plant and equipment is calculated at between 7.5% and 37.5% per annum using the diminishing value method over their estimated useful lives.
j) Employee benefits
Provision is made for employee benefits accumulated as a result of employees rendering services up to the end of the reporting period. These benefits included wages and salaries, including non-monetary benefits and annual leave. Liabilities are recognised in respect of employees’ services up to the reporting date and are measured at the amount expected to be paid when the liabilities are settled. Expenses for non-accumulating sick leave are recognised when the leave is taken and are measured at the rates paid or payable.
The general provisions for long service leave are recognised and measured as the present value of expected future payments to be made in respect of services provided by employees up to the reporting date using the projected unit credit method. Consideration is given to expected future wage and salary levels, experience of employee departures, and periods of service. Expected future payments are discounted using market yields at the reporting date on national government bonds with terms of maturity and currencies that match, as closely as possible, the estimated future cash outflows. Employees’ accumulated long service leave is ascribed to individual employees at the rates payable as and when they become entitled to long service leave. A provision for bonus is recognised and measured based upon the current wage and salary level and forms part of the employee short term incentive plan. The basis for the bonus is set out in the Remuneration Report in section 4 of the Directors’ Report.

67
Notes to the Financial StatementFor the year ended 30 June 2015
2. Summary of significant accounting policies continued
k) Share based payments
The Group provides benefits to employees (including Executive Directors) of the Group in the form of share-based payment transactions, whereby employees render services in exchange for rights over shares (“equity-settled transactions”).
The cost of these equity-settled transactions with employees is measured by reference to the fair value at the date at which they are granted and are recorded as an expense, with a corresponding increase in reserves, on a straight-line basis over the vesting period of the related instrument.
The fair value is determined using the Black-Scholes methodology to produce a Monte-Carlo simulation model that takes into account the exercise price, the vesting period, the vesting and performance criteria, the impact of dilution, the non-tradable nature of the performance right, the share price at grant date, the expected price volatility of the underlying share, the expected dividend yield and the risk-free interest rate for the term of the vesting period. The fair value of the performance rights granted excludes the impact of any non-market vesting conditions (for example, profitability and sales growth targets).
The volatility assumption is based on the actual volatility of Cooper Energy’s daily closing share price over the three year period to the valuation date.
The cost of equity-settled transactions is recognised, together with a corresponding increase in equity, over the period in which the performance and/or service conditions are fulfilled, ending on the date on which the relevant employees become fully entitled to the award (the vesting period).
The cumulative expense recognised for equity-settled transactions at each reporting date until vesting date reflects:
1. the extent to which the vesting period has expired; and
2. the Group’s best estimate of the number of equity instruments that will ultimately vest.
No adjustment is made for the likelihood of market performance conditions being met as the effect of these conditions is included in the determination of fair value at grant date. The Consolidated Statement of Comprehensive Income charge or credit for a period represents the movement in cumulative expense recognised as at the beginning and end of that period.
No expense is recognised for awards that do not ultimately vest, except for awards where vesting is only conditional upon a market condition.
If the terms of an equity-settled award are modified, as a minimum an expense is recognised as if the terms had not been modified. In addition, an expense is recognised for any modification that increases the total fair value of the share-based payment arrangement, or is otherwise beneficial to the employees as measured at the date of modification.
If an equity-settled award is cancelled, it is treated as if it had vested on the date of cancellation, and any expense not yet recognised for the award is recognised immediately. However, if a new award is substituted for the cancelled award and designated as a replacement award on the date that it is granted, the cancelled and new award are treated as if they were a modification of the original award, as described in the previous paragraph.
The dilutive effect, if any, of outstanding performance rights is reflected as additional share dilution in the computation of diluted earnings per share.
l) Leases
The determination of whether an arrangement is or contains a lease is based on the substance of the arrangement and requires an assessment of whether the fulfilment of the arrangement is dependent on the use of a specific asset or assets and the arrangement conveys a right to use the asset.
Finance leases, which transfer to the Group substantially all the risks and benefits incidental to ownership of the leased item, are capitalised at the inception of the lease at the fair value of the leased asset or, if lower, at the present value of the minimum lease payments. Lease payments are apportioned between the finance charges and reduction of the lease liability so as to achieve a constant rate of interest on the remaining balance of the liability. Finance charges are recognised as an expense in profit or loss.
Capitalised lease assets are depreciated over the shorter of the estimated useful life of the asset and the lease term if there is no reasonable certainty that the Group will obtain ownership by the end of the lease term.
Operating lease payments are recognised as an expense in the Consolidated Statement of Comprehensive Income on a straight-line basis over the lease term.
m) Income tax
Current tax assets and liabilities for the current and prior periods are measured at the amount expected to be recovered from or paid to the taxation authorities. The tax rates and tax laws used to compute the amount are those that are enacted or substantively enacted by the Consolidated Statement of Financial Position date.
Deferred income tax is provided on all temporary differences at the Consolidated Statement of Financial Position date between the tax bases of assets and liabilities and their carrying amounts for financial reporting purposes.
68
Notes to the Financial StatementFor the year ended 30 June 2015
2. Summary of significant accounting policies continued
m) Income tax continued
Deferred income tax liabilities are recognised for all taxable temporary differences except:
• when the deferred income tax liability arises from the initial recognition of goodwill or of an asset or liability in a transaction that is not a business combination and that, at the time of the transaction, affects neither the accounting profit nor taxable profit or loss; or
• when the taxable temporary difference is associated with investments in subsidiaries, associates or interests in joint ventures, and the timing of the reversal of the temporary difference can be controlled and it is probable that the temporary difference will not reverse in the foreseeable future.
Deferred income tax assets are recognised for all deductible temporary differences, carry-forward of unused tax assets and unused tax losses, to the extent that it is probable that taxable profit will be available against which the deductible temporary differences and the carry-forward of unused tax credits and unused tax losses can be utilised, except:
• when the deferred income tax asset relating to the deductible temporary difference arises from the initial recognition of an asset or liability in a transaction that is not a business combination and, at the time of the transaction, affects neither the accounting profit nor taxable profit or loss; or
• when the deductible temporary difference is associated with investments in subsidiaries, associates or interest in joint ventures, in which case a deferred tax asset is only recognised to the extent that it is probable that the temporary difference will reverse in the foreseeable future and taxable profit will be accessible against which the temporary difference can be utilised.
The carrying amount of deferred income tax assets is reviewed at each Consolidated Statement of Financial Position date and reduced to the extent that it is no longer probable that sufficient taxable profit will be available to allow all or part of the deferred income tax asset to be utilised.
Unrecognised deferred income tax assets are assessed at each Consolidated Statement of Financial Position date and are recognised to the extent that it has become probable that future taxable profit will allow the deferred tax asset to be recovered.
Deferred income tax assets and liabilities are measured at the tax rates that were expected to apply to the year when the asset is realised or the liability is settled, based on tax rates and tax laws that have been enacted or substantively enacted at the Consolidated Statement of Financial Position date.
Income taxes relating to items recognised directly in equity are recognised in equity and not in profit or loss.
Deferred tax assets and deferred tax liabilities are offset only if a legally enforceable right exits to offset current tax assets against current tax liabilities and the deferred tax asset and liabilities relate to the same taxable entity and the same taxation authority.
n) Other taxes
Goods and Services Taxes (“GST”)
Revenues, expenses and assets are recognised net of the amount of Goods and Services Taxes (“GST”) except:-
• where the GST incurred on a purchase of goods and services is not recoverable from the taxation authority, in which case the GST is recognised as part of the cost of acquisition of the asset or as part of the expense item as applicable; and
• receivables and payables are stated with the amount of GST included.
The net amount of GST recoverable from, or payable to, the taxation authority is included as part of receivables or payables in the Consolidated Statement of Financial Position.
Cash flows are included in the Cash Flow Statement on a net basis and the net GST component of cash flows arising from investing and financing activities, which is recoverable from, or payable to, the taxation authority, are classified as operating cash flows.
Commitments and contingencies are disclosed net of the amount of GST recoverable from, or payable to, the taxation authority.
Petroleum Resource Rent Tax (PRRT)
For PRRT purposes, the impact of future augmentation on expenditure is included in the determination of future taxable profits when assessing the extent to which a deferred tax asset can be recognised in the statement of financial position. Deferred tax assets are reduced to the extent that it is no longer probable that the related tax benefit will be realised. The Group has lodged starting base returns for all exploration and production areas. In June 2013, participants including the Company were granted a combination certificate for the Cooper Basin projects essentially deeming PEL 92 and PEL 93 to be a single project for PRRT purposes.
o) Exploration and evaluation expenditure
Exploration and evaluation expenditure is accounted for in accordance with the area of interest method and is capitalised to the extent that:
i. the rights to tenure of the areas of interest are current and the Group controls the area of interest in which the expenditure has been incurred; and
ii. such costs are expected to be recouped through successful development and exploration of the area of interest, or alternatively by its sale; or
iii. exploration and evaluation activities in the area of interest have not at the reporting date:
a. reached a stage which permits a reasonable assessment of the existence or otherwise of economically recoverable reserves; and b. active and significant operations in, or in relation to, the area of interest are continuing.

69
Notes to the Financial StatementFor the year ended 30 June 2015
2. Summary of significant accounting policies continued
o) Exploration and evaluation expenditure continued
An area of interest refers to an individual geological area where the potential presence of an oil or a natural gas field is considered favourable or has been proven to exist, and in most cases will comprise an individual prospective oil or gas field.
Exploration and evaluation expenditure which does not satisfy these criteria is written off. Specifically, costs carried forward in respect of an area of interest that is abandoned or costs relating directly to the drilling of an unsuccessful well are written off in the year in which the decision to abandon is made or the results of drilling are concluded. The success or otherwise of a well is determined by reference to the drilling objectives for that well. For successful wells, the well costs remain capitalised on the Consolidated Statement of Financial Position as long as sufficient progress in assessing the reserves and the economic and operating viability of the project is being made. A regular review is undertaken of each area of interest to determine the appropriateness of continuing to carry forward costs in relation to that area of interest.
Where an ownership interest in an exploration and evaluation asset is exchanged for another, the transaction is recognised by reference to the carrying value of the original interest. Any cash consideration paid, including transaction costs, is accounted for as an acquisition of exploration and evaluation assets. Any cash consideration received, net of transaction costs, is treated as a recoupment of costs previously capitalised with any excess accounted for as a gain on disposal of non-current assets.
Where a discovered oil or gas field enters the development phase the accumulated exploration and evaluation expenditure is transferred to oil properties.
p) Oil properties
Oil properties are carried at cost including construction, installation of infrastructure such as roads and the cost of development of wells.
Subsequent costs are included in the asset’s carrying amount or recognised as a separate asset, as appropriate, only when it is probable that future economic benefits associated with the item will flow to the Group and the cost of the item can be measured reliably. All other repairs and maintenance are charged to the Consolidated Statement of Comprehensive Income during the financial period in which they are incurred.
q) Provision for restoration
The Group records the present value of its share of the estimated cost to restore operating locations. The nature of restoration activities includes the obligations relating to the reclamation, waste site closure, plant closure, production facility removal and other costs associated with the restoration of the site.
A restoration provision is recognised after the construction of the facility and then reviewed on an annual basis.
When the liability is recorded the carrying amount of the production assets is increased by the asset retirement costs and depreciated over the producing life of the asset. Over time, the liability is increased for the change in the present value based on a risk free discount rate. The unwinding of the discount is recorded as an accretion charge within finance costs.
Any changes in the estimate of the provision for restoration arising from changes in the gross cost estimate or changes in the discount rate of the restoration provision are recorded by adjusting the provision and the carrying amount of the production asset and then depreciated over the producing life of the asset. Any change in the discount rate is applied prospectively.
These estimated costs, whilst based on anticipated technological and legal requirements, assume no significant changes will occur in relevant State, Federal and International legislation.
r) Property, plant and equipment
Property, plant and equipment are stated at historical cost less accumulated depreciation and any accumulated impairment losses. Historical cost includes expenditure that is directly attributable to the acquisition of the items.
Subsequent costs are included in the asset’s carrying amount or recognised as a separate asset, as appropriate, only when it is probable that future economic benefits associated with the item will flow to the Group and the cost of the item can be measured reliably. All other repairs and maintenance are charged to the Consolidated Statement of Comprehensive Income during the financial period in which they are incurred.
The assets’ residual values and useful lives are reviewed, and adjusted if appropriate, at each Consolidated Statement of Financial Position date. The carrying values of property, plant and equipment are reviewed for impairment at each reporting date, with recoverable amount being estimated when events or changes in circumstances indicate that the carrying value may be impaired. The recoverable amount of property, plant and equipment is the higher of fair value less cost to sell and value in use. For an asset that does not generate largely independent cash flows, recoverable amount is determined for the cash generating unit to which the asset belongs, unless the asset’s value in use can be estimated to be close to its fair value.
An asset’s or cash generating unit’s carrying amount is written down immediately to its recoverable amount if the asset’s or cash generating unit’s carrying amount is greater than its estimated recoverable amount.
Gains and losses on disposals are determined by comparing proceeds with the carrying amount. These are included in the statement of comprehensive income.
An item of property, plant and equipment is de-recognised upon disposal or when no further future economic benefits are expected from its use. Any gains or losses arising on de-recognition of the asset (calculated as the difference between the net disposal proceeds and the net carrying amount of the asset) is included in the statement of comprehensive income in the period the asset is de-recognised.

70
Notes to the Financial StatementFor the year ended 30 June 2015
s) Impairment of non-current assets
Assets that are subject to amortisation are reviewed for impairment whenever events or changes in circumstances indicate that the carrying amount may not be recoverable. An impairment loss is recognised for the amount by which the asset’s carrying amount exceeds its recoverable amount. The recoverable amount is the higher of an asset’s fair value less costs to sell and value in use. For the purposes of assessing impairment, assets are grouped at the lowest levels for which there are separately identifiable cash flows (cash generating units). In assessing value-in-use, the estimated future cash flows are discounted to their present value using a pre-tax rate that reflects current market assessments of the time value of money and the risks specific to the asset.
t) Cash and cash equivalents
Cash and short term deposits in the Consolidated Statement of Financial Position comprise cash at bank and short term deposits with an original maturity of twelve months or less. For the purposes of the Statement of Cash Flows, cash includes cash on hand and in banks, and money market investments readily convertible to cash within 90 days from date of investment, net of outstanding bank overdrafts.
u) Trade and other receivables
Trade receivables, which generally have 30 to 90 day terms, are recognised and carried at original invoice amount less an allowance for any uncollectible amounts.
An allowance for doubtful debts is made when there is objective evidence that the Group will not be able to collect the debts. Financial difficulties of the debtor, default payments or debts more than 90 days overdue are considered objective evidence of impairment. The amount of the impairment loss is the receivable carrying amount, compared to the present value of estimated future cash flows, discounted at the original effective interest rate. Bad debts are written off when identified.
v) Inventory
Inventories are carried at the lower of their cost or net realisable value. Inventories held by the group are in respect of stores and spares involved in drilling operations.
w) Trade and other payables
Trade payables and other payables are carried at amortised costs and represent liabilities for goods and services provided to the Group prior to the end of the financial year that are unpaid and arise when the Group becomes obliged to make future payments in respect of the purchase of these goods and services.
x) Provisions
Provisions are recognised when the Group has a legal or constructive obligation to make a future sacrifice of economic benefits to other entities as a result of past transactions or other past events, it is probable that a future sacrifice of economic benefits will be required and a reliable estimate can be made of the amount of the obligation.
Provisions are not recognised for future operating losses. Where there are a number of similar obligations, the likelihood that an outflow will be required in settlement is determined by considering the class of obligations as a whole. A provision is recognised even if the likelihood of an outflow with respect to any one item included in the same class of obligations may be small.
y) Contributed equity
Issued and paid up capital is recognised as the fair value of the consideration received by the Group.
Any transaction costs arising on the issue of ordinary shares are recognised directly in equity as a reduction of the share proceeds received.
z) Earnings per share
Basic earnings per share are calculated as net profit attributable to members divided by the weighted average number of ordinary shares.
Diluted earnings per share is calculated as net profit attributable to members adjusted for the after tax effect of dilutive potential ordinary shares that have been recognised as expenses during the period divided by the weighted average number of ordinary shares and dilutive potential ordinary shares.
aa) Derivative financial instruments
Derivatives are initially recognised at their fair value when the Group becomes a party to the contract. Movement in the derivative’s fair value is taken directly to profit or loss. The Group does not use hedge accounting.
bb) Significant accounting judgements, estimates and assumptions
(i) Significant accounting judgements
In the process of applying the Group’s accounting policies, management has made the following judgements, apart from those involving estimations, which have the most significant effect on the amounts recognised in the financial statements:
Joint arrangements
Judgement is required to determine when the Group has joint control over an arrangement, which requires an assessment of the relevant activities and when the decisions in relation to those activities require unanimous consent. The Group has determined that the relevant activities for its joint arrangements are those relating to the operating and capital decisions of the arrangement, such as approval of the capital
2. Summary of significant accounting policies continued

71
Notes to the Financial StatementFor the year ended 30 June 2015
expenditure program for each year and appointing, remunerating and terminating the key management personnel or service providers of the joint arrangement. The considerations made in determining joint control are similar to those necessary to determine control over subsidiaries.
Judgement is also required to classify a joint arrangement. Classifying the arrangement requires the Group to assess their rights and obligations arising from the arrangement. Specifically, the Group considers:
• The structure of the joint arrangement – whether it is structured through a separate vehicle;
• When the arrangement is structured through a separate vehicle, the Group also considers the rights and obligations arising from: The legal form of the separate vehicle; the terms of the contractual arrangement and; other facts and circumstances (when relevant).
This assessment often requires significant judgement, and a different conclusion on joint control and also whether the arrangement is a joint operation or a joint venture, may materially impact the accounting.
Taxation
The Group’s accounting policy for taxation requires management’s judgement in relation to the types of arrangements considered to be a tax on income in contrast to an operating cost.
Judgement is also made in assessing whether deferred tax assets and certain deferred tax liabilities are recognised on the Consolidated Statement of Financial Position.
Deferred tax assets, including those arising from un-recouped tax losses, capital losses, and temporary differences arising from the Petroleum Resource Rent Tax (Imposition – General) Act 2011, are recognised only where it is considered more likely than not they will be recovered, which is dependent on the generation of sufficient future taxable profits.
Judgements are also required about the application of income tax legislation. These judgements and assumptions are subject to risk and uncertainty, hence there is a possibility changes in circumstances will alter expectation, which may impact the amount of deferred tax assets and deferred tax liabilities recognised on the Consolidated Statement of Financial Position and the amount of other tax losses and temporary differences not yet recognised.
(i) Significant accounting judgements continued
In such circumstances, some or all of the carrying amounts of recognised deferred tax assets and liabilities may require adjustment, resulting in a corresponding credit or charge to the Consolidated Statement of Comprehensive Income.
Operating lease commitments
The Group has entered into a commercial property lease. The Group has determined that is does not retain any of the significant risks and rewards of ownership of this property and has thus classified the lease as an operating lease.
(ii) Significant accounting estimates and assumptions
The carrying amounts of certain assets and liabilities are often determined based on estimates and assumptions of future events. The key estimates and assumptions that have a significant risk of causing a material adjustment to the carrying amounts of certain assets and liabilities within the next annual reporting period are:
Determination of recoverable hydrocarbons
Estimates of recoverable hydrocarbons impact the asset impairment assessment, depreciation and amortisation rates and decommissioning and restoration provisions.
Estimates of recoverable hydrocarbons are evaluated and reported by qualified petroleum reserves and resources evaluators in accordance with the ASX Listing Rules and the Company’s Hydrocarbon Guidelines (www.cooperenergy.com.au/policies). A technical understanding of the geological and engineering processes enables the recoverable hydrocarbon estimates to be determined by using forecasts of production, commodity prices, production costs, exchange rates, tax rates and discount rates.
Recoverable hydrocarbon estimates may change from time to time if any of the forecast assumptions are revised.
Impairment of capitalised exploration and evaluation expenditure
The future recoverability of capitalised exploration and evaluation expenditure is dependent on a number of factors, including whether the Group decides to exploit the related lease itself or, if not, whether it successfully recovers the related exploration and evaluation asset through sale.
Factors which could impact the future recoverability include the level of oil reserves, future technological changes which could impact the cost of extraction, future legal changes (including changes to environmental restoration obligations) and changes to commodity prices.
To the extent that capitalised exploration and evaluation expenditure is determined not to be recoverable in the future, this will reduce profits and net assets in the period in which this determination is made.
In addition, exploration and evaluation expenditure is capitalised if activities in the area of interest have not yet reached a stage which permits a reasonable assessment of the existence or otherwise of economically recoverable oil reserves. To the extent that it is determined in the future that this capitalised expenditure should be written off, this will reduce profits and net assets in the period in which this determination is made.
2. Summary of significant accounting policies continued
bb) Significant accounting judgements, estimates and assumptions continued

72
Notes to the Financial StatementFor the year ended 30 June 2015
Impairment of oil properties and property, plant & equipment
The Group reviews the carrying amount of oil properties and property, plant & equipment at each reporting date starting with analysis of any indicators of impairment. Where indicators of impairment are present, the group will test whether the cash generating unit’s recoverable amount exceeds its carrying amount. The Group makes assumptions regarding future production and sales volumes, pricing, foreign exchange rates and capital and operating expenditure. The sensitivity of the impairment models to these assumptions is tested as part of this process and shows that the models are most sensitive to management’s assumptions relating to production and pricing.
Provisions for decommissioning and restoration costs
Decommissioning and restoration costs are a normal consequence of oil extraction and the majority of this expenditure is incurred at the end of a well’s life. In determining an appropriate level of provision consideration is given to the expected future costs to be incurred, the timing of these expected future costs (largely dependent on the life of the well), and the estimated future level of inflation.
The ultimate cost of decommissioning and restoration is uncertain and costs can vary in response to many factors including changes to the relevant legal requirements, the emergence of new restoration techniques or experience at other wells. The expected timing of expenditure can also change, for example in response to changes in oil reserves or to production rates.
Changes to any of the estimates could result in significant changes to the level of provisioning required, which would in turn impact future financial results.
Share-based payments transactions
The Group measures the cost of equity-settled transactions with employees by reference to the fair value of the equity instruments at the date at which they are granted. The fair value is determined by an external valuation expert using the calculation criteria detailed in note 2(k).
3. Segment reporting
Identification of reportable segments and types of activities
The Group operates throughout the world and prepares reports internally and externally by continental geographical segments. Within each segment, the costs of operations and income are prepared firstly by legal entity and then by joint venture. Revenue and outgoings are allocated by way of their natural expense and income category. These reports are drawn up on a quarterly basis. Resources are allocated between each segment on an as needs basis. Selective reporting is provided to the Board quarterly while the annual and bi-annual results are reported to the Board. The Managing Director is the chief operating decision maker.
Other prospective opportunities outside of these geographical segments are also considered from time to time and, if they are secured, will then be attributed to the continental geographical segment where they are located.
The current external customers by geographical location of production are the Australian Business Unit with two customers and the Indonesian Business Unit with one customer.
The following are the current geographical segments:
Australian Business Unit
Exploration and evaluation for oil and gas, development, production and sale of crude oil in a number of areas in the Cooper Basin located in South Australia. Revenue is derived from the sale of crude oil to IOR Energy Pty Ltd and a consortium of buyers made up of Santos Limited and its subsidiaries; Delhi Petroleum Pty Ltd and Origin Energy Resources Limited. Interest income is earned from the placement of funds with various Australian Banks for periods of up to six months.
Asian Business Unit
The Asian business unit involves the production and sale of crude oil from the Tangai-Sukananti KSO. It is located on the island of Sumatra, Indonesia. Revenue is derived from the sale of crude oil to PT Pertamina EP. The Group is also involved in exploration and evaluation for oil and gas in the Sumbagsel and Merangin III Permit areas on the island of Sumatra, Indonesia.
African Business Unit
Exploration and evaluation for oil and gas in the Bargou, Nabeul and Hammamet permit areas off the coast of Tunisia. No income is derived from these units. The Company has announced its intention to dispose of the equity interests in the Tunisian assets.
European Business Unit
The Company has disposed of all exploration interests in Poland and is in the process of winding up the Polish and Dutch subsidiaries.
Accounting Policies and inter-segment transactions
The accounting policies used by the Group in reporting segments internally is the same as those contained in note 2 to the accounts and in the prior period.
2. Summary of significant accounting policies continued
bb) Significant accounting judgements, estimates and assumptions continued

73
Notes to the Financial StatementFor the year ended 30 June 2015
3. Segment reporting continued
The following table presents revenue and segment results for reportable segments.
Geographical Segments Australian Business
Unit
$’000
African Business Unit
(Disc. Ops.)
$’000
Asian Business
Unit
$’000
European Business Unit
(disc. Ops)
$’000
Elimination
$’000
Consolidated
$’000
Year ended 30 June 2015
Revenue 33,510 - 5,574 - - 39,084
Interest and other revenue 2,423 - - - (556) 1,867
Total consolidated revenue 35,933 - 5,574 - (556) 40,951
Depreciation of property (397) - (72) - - (469)
Amortisation of:
- Development costs (5,256) - (2,248) - - (7,504)
- Exploration costs (771) - - - - (771)
Impairment (22,642) - - - - (22,642)
Finance costs (495) - - - - (495)
Share based payments (1,629) - - - - (1,629)
Exploration costs written off (2,342) - - - - (2,342)
Segment result (17,670) (47,657) (562) 22 (556) (66,423)
Income tax 2,955
Net Profit (63,468)
Segment liabilities 67,168 1,521 1,675 - (235) 70,129
Segment assets 148,001 318 25,902 14 (235) 174,000
Non-Current Assets 101,972 - 18,215 - - 120,187
Cash flow from:
- Operating activities 5,802 (1,503) (2,132) (132) - 2,035
- Investing activities (12,862) 325 2,219 141 - (10,175)
- Financing - - - - - -
Capital Expenditure (18,966) (392) (8,064) - - (27,422)

74
Notes to the Financial StatementFor the year ended 30 June 2015
Geographical Segments Australian Business
Unit
$’000
African Business Unit
(Disc. Ops.)
$’000
Asian Business
Unit
$’000
European Business Unit
(disc. Ops)
$’000
Elimination
$’000
Consolidated
$’000
Year ended 30 June 2014
Revenue 66,457 - 5,846 - - 72,303
Other revenue 3,973 - - - (1,131) 2,842
Total consolidated revenue 70,430 - 5,846 - (1,131) 75,145
Depreciation of property (434) - (52) - - (486)
Amortisation of:
- Development costs (4,943) - (707) - - (5,650)
- Exploration costs (1,112) - - - - (1,112)
Impairment (3,064) (3,064)
Finance costs (296) - - - - (296)
Share based payments (1,283) - - - - (1,283)
Exploration costs written off (1,261) - - - - (1,261)
Segment result 30,164 (17) 2,177 (215) (1,131) 30,978
Income tax (9,028)
Net Profit 21,950
Segment liabilities 75,767 2,670 1,963 71 - 80,471
Segment assets 185,825 46,844 15,533 62 - 248,264
Non-Current Assets 129,555 - 12,703 - - 142,014
Cash flow from:
- Operating activities 48,100 688 1,360 110 - 50,258
- Investing activities (19,529) (22,149) (4,645) (180) - (46,503)
- Financing (55) - - - - (55)
Capital Expenditure (22,351) (22,149) (4,620) (180) - (49,300)
Revenue from external customers by geographical location of production
2015$’000
2014$’000
Australia 33,510 66,457
Indonesia 5,574 5,846
Total revenue 39,084 72,303
Revenue from one customer amounted to $32,220,000 (2014: $63,983,000) arising from oil sales.
3. Segment reporting continued

75
Notes to the Financial StatementFor the year ended 30 June 2015
4. Revenues and expenses
Profit before income tax expense includes the following revenues and expenses whose disclosure is relevant in explaining the performance of the entity:
Consolidated2015
$’0002014$’000
Revenues from oil operations
Oil sales 39,084 72,303
Total revenue from oil sales 39,084 72,303
Other revenue
Interest revenue 1,225 1,360
Gain on acquisition of associate 281 -
Joint venture fees 361 1,482
Total other income 1,867 2,842
Cost of sales
Production expenses (13,464) (12,814)
Royalties (3,293) (6,480)
Amortisation of exploration costs in areas under production (771) (1,112)
Amortisation of development costs in areas under production (7,504) (5,650)
Total cost of sales (25,032) (26,056)
Finance costs
Accretion of rehabilitation cost (1,433) (257)
Finance cost of success fee (310) (39)
Fair value adjustment of success fee liability 1,248 -
Total finance costs (495) (296)
Administration and other expenses
Depreciation of property, plant and equipment (469) (486)
General administration (includes employee benefits and lease payments) (12,931) (12,423)
Losses from change in fair value of derivative financial asset designated as fair value through profit and loss
(206) -
Realised and unrealised foreign currency translation gain/(loss) 946 (349)
Total other expenses (12,696) (13,258)
Employee benefits expense
Director and employee benefits (5,067) (5,401)
Share based payments (1,629) (1,283)
Superannuation expense (364) (315)
(7,060) (6,999)
Lease payments
Minimum lease payment – operating lease (326) (99)
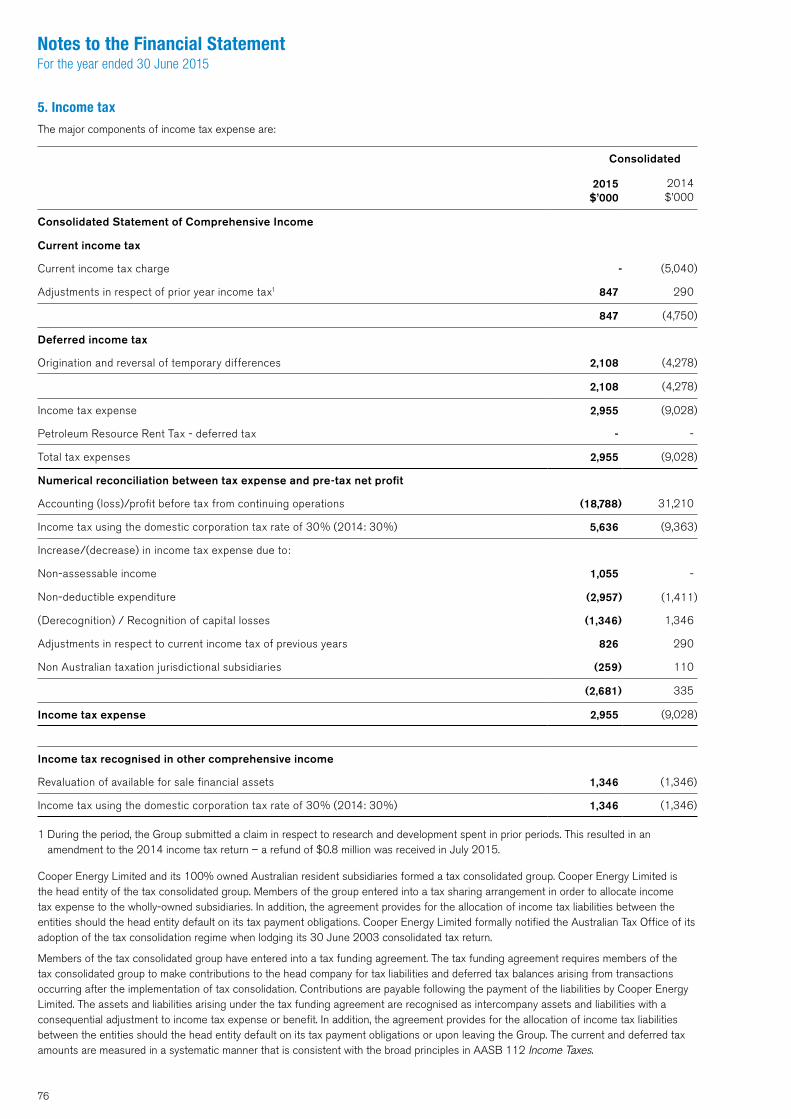
76
Notes to the Financial StatementFor the year ended 30 June 2015
5. Income tax
The major components of income tax expense are:
Consolidated
2015$’000
2014$’000
Consolidated Statement of Comprehensive Income
Current income tax
Current income tax charge - (5,040)
Adjustments in respect of prior year income tax1 847 290
847 (4,750)
Deferred income tax
Origination and reversal of temporary differences 2,108 (4,278)
2,108 (4,278)
Income tax expense 2,955 (9,028)
Petroleum Resource Rent Tax - deferred tax - -
Total tax expenses 2,955 (9,028)
Numerical reconciliation between tax expense and pre-tax net profit
Accounting (loss)/profit before tax from continuing operations (18,788) 31,210
Income tax using the domestic corporation tax rate of 30% (2014: 30%) 5,636 (9,363)
Increase/(decrease) in income tax expense due to:
Non-assessable income 1,055 -
Non-deductible expenditure (2,957) (1,411)
(Derecognition) / Recognition of capital losses (1,346) 1,346
Adjustments in respect to current income tax of previous years 826 290
Non Australian taxation jurisdictional subsidiaries (259) 110
(2,681) 335
Income tax expense 2,955 (9,028)
Income tax recognised in other comprehensive income
Revaluation of available for sale financial assets 1,346 (1,346)
Income tax using the domestic corporation tax rate of 30% (2014: 30%) 1,346 (1,346)
1 During the period, the Group submitted a claim in respect to research and development spent in prior periods. This resulted in an amendment to the 2014 income tax return – a refund of $0.8 million was received in July 2015.
Cooper Energy Limited and its 100% owned Australian resident subsidiaries formed a tax consolidated group. Cooper Energy Limited is the head entity of the tax consolidated group. Members of the group entered into a tax sharing arrangement in order to allocate income tax expense to the wholly-owned subsidiaries. In addition, the agreement provides for the allocation of income tax liabilities between the entities should the head entity default on its tax payment obligations. Cooper Energy Limited formally notified the Australian Tax Office of its adoption of the tax consolidation regime when lodging its 30 June 2003 consolidated tax return.
Members of the tax consolidated group have entered into a tax funding agreement. The tax funding agreement requires members of the tax consolidated group to make contributions to the head company for tax liabilities and deferred tax balances arising from transactions occurring after the implementation of tax consolidation. Contributions are payable following the payment of the liabilities by Cooper Energy Limited. The assets and liabilities arising under the tax funding agreement are recognised as intercompany assets and liabilities with a consequential adjustment to income tax expense or benefit. In addition, the agreement provides for the allocation of income tax liabilities between the entities should the head entity default on its tax payment obligations or upon leaving the Group. The current and deferred tax amounts are measured in a systematic manner that is consistent with the broad principles in AASB 112 Income Taxes.

77
Notes to the Financial StatementFor the year ended 30 June 2015
5. Income tax continued
Unrecognised temporary differences At 30 June 2015, there are no unrecognised temporary differences associated with the Group’s investments in subsidiaries or joint ventures, as the Group has no liability for additional taxation should unremitted earnings be remitted (2014 $nil).
Franking Tax CreditsAt 30 June 2015 the parent entity had franking tax credits of $43,715,169 (2014: $38,663,576). The fully franked dividend equivalent is $102,002,060 (2014 $90,215,011).
PRRT
Cooper Energy Limited has not recognised a Deferred Tax Asset for the Petroleum Rent Resource Tax of $22,341,000 (2014: $19,071,000) on the basis that it has a significant level of undeducted expenditure and nil PRRT payments projected in the future. As stated in note 28, Events after the reporting period, through the BMG Joint Venture the Group plans to submit applications to revert the existing licenses to petroleum retention leases. This reversion may have an impact on the Group’s ability to carry forward the unused PRRT credits in respect of BMG, which if lost would result in the recognition of a deferred tax liability of approximately $1,000,000.
Income Tax Losses
(a) Revenue Losses
Cooper Energy Limited has recognised a Deferred Tax Asset for the year ended 30 June 2015 of $676,797 (2014: nil). All prior recognised Deferred Tax Assets have been fully utilised during the prior financial years.
(b) Capital Losses
Cooper Energy has not recognised a Deferred Tax Asset for Australian income tax capital losses of $22,207,705 (2014: $15,987,262) on the basis that it is not probable that the carried forward capital losses will be utilised against future assessable capital profits.
Consolidated Statement of
Financial Position
Consolidated Statement of Comprehensive
Income
2015$’000
2014 $’000
2015$’000
2014 $’000
Deferred income tax from corporate tax
Deferred income tax at the 30 June relates to the following:
Deferred tax liabilities
Trade and other receivables 1,574 1,790 216 1,826
Available for sale financial assets - - - 919
Oil properties - 1,624 1,624 849
Exploration and evaluation 11,706 12,637 931 (4,751)
Provisions 416 - (416) -
Unrealised currency translation gain 144 122 (22) 83
13,840 16,173
Deferred tax assets
Property, plant & equipment 12 15 (3) (3)
Oil properties 1,296 - 1,296 -
Trade and other payables 29 42 (13) 7
Provision for employee entitlements 681 512 169 (97)
Provisions - 1,173 (1,173) 388
Other 125 - 168 -
Tax losses 677 - 677 (3,499)
2,820 1,742
Deferred tax income (expense) 3,454 (4,278)
Deferred tax liability from corporate tax 11,020 14,431

78
Notes to the Financial StatementFor the year ended 30 June 2015
Consolidated Statement of
Financial Position
Consolidated Statement of Comprehensive
Income
2015$’000
2014 $’000
2015$’000
2014 $’000
Deferred income tax from petroleum resource rent tax
Deferred income tax 30 June relates to the following:
Deferred tax liabilities
Exploration and evaluation - - - -
Deferred tax assets
Oil properties - - - -
As represented on the Consolidated Statement of Financial Position, deferred tax asset - -
As represented on the Consolidated Statement of Financial Position, net deferred tax liability 11,020 14,431
6. Earnings per share
Basic earnings per share amounts are calculated by dividing net profit for the year attributable to ordinary equity holders of the parent by the weighted average of ordinary shares outstanding during the year.
Diluted earnings per share amounts are calculated by dividing the net profit attributable to ordinary equity holders of the parent by the weighted average number of ordinary shares outstanding during the year plus the weighted average number of ordinary shares that would be issued on the conversion of all the dilutive potential options into ordinary shares. At 30 June 2015 there exists performance rights that if vested in full, would result in the issue of 17,276,975 ordinary shares over the next three years. In the current period these potential ordinary shares are considered antidilutive as their conversion to ordinary shares would reduce the loss per share. Accordingly, they have been excluded from the dilutive earnings per share calculation.
The following reflects the income and share data used in the basic and diluted earnings per share computations:
Consolidated
2015$’000
2014$’000
Net profit/(loss) attributable to ordinary equity holders of the parent from continuing operations (15,833) 22,182
2015Thousands
2014Thousands
Weighted average number of ordinary shares for basic earnings per share 330,905 329,377
Weighted average number of ordinary shares adjusted for the effect of dilution 330,905 341,666
Basic earnings per share for the period (cents per share) (4.8) 6.7
Diluted earnings per share for the period (cents per share) (4.8) 6.5
5. Income tax continued

79
Notes to the Financial StatementFor the year ended 30 June 2015
Consolidated
2015$’000
2014$’000
Net profit/(loss) attributable to ordinary equity holders of the parent from continuing and discontinued operations
(63,468) 21,950
Weighted average number of ordinary shares for basic earnings per share 330,905 329,377
Weighted average number of ordinary shares adjusted for the effect of dilution 330,905 341,666
Basic earnings per share for the period (cents per share) (19.2) 6.7
Diluted earnings per share for the period (cents per share) (19.2) 6.4
There have been no other transactions involving ordinary shares or potential ordinary shares between the reporting date and the date of completion of these financial statements.
7. Cash and cash equivalents and term deposits
Consolidated
Current Assets2015
$’0002014$’000
Cash at bank and in hand 7,380 7,671
Short term deposits at banks (i) 31,993 39,507
39,373 47,178
Non-Current Assets
Term deposits at bank (ii) 59 1,919
(i) Short term deposits at the banks are in Australian dollars and are for periods of up to 3 months and earn interest at money market interest rates.
(ii) The carrying value of the term deposit approximates its fair value.
The Company has a bilateral facility agreement for bank facilities totalling $40 million with Westpac Banking Corporation. Tranche A $10 million is committed to 30 September 2015 and is available for issuing bank guarantees and cash advances (sub limit $5 million for each item). As at 30 June 2015 bank guarantees of $3,906,000 (2014: $2,627,000) in relation to performance bonds on exploration permits were issued against the facility. Tranche B $30 million is committed to 30 June 2017 and is available for draw down subject to the satisfaction of certain conditions precedent. The Westpac facilities are currently being restructured from corporate to reserve based lending and it is expected this will be completed before 30 September 2015.
6. Earnings per share continued

80
Notes to the Financial StatementFor the year ended 30 June 2015
Consolidated
2015$’000
2014$’000
Reconciliation of net profit after tax to net cash flows from operating activities
Net Profit / (loss) for the Year (63,468) 21,950
Adjustments for:
Amortisation of development costs in areas of production 7,504 5,650
Amortisation of exploration costs in areas under production 771 1,112
Depreciation of property, plant and equipment 469 486
Exploration and evaluation written off 2,342 1,261
Impairment of Non-Current Assets 70,127 3,064
Share of loss in associate 166 -
Reclassification of fair value movement on sale of available for sale investments (3,634) -
Share based payments 1,629 1,283
Finance cost 496 296
Unrealised foreign currency translation (gain) / loss (444) 607
(Increase)/decrease in trade and other receivables (856) 8,556
(Increase)/decrease in inventories (651) (85)
(Increase)/decrease in prepayments 92 25
(Decrease)/increase in deferred tax liabilities (3,411) -
(Decrease)/increase in trade and other payables (3,407) 1,051
(Decrease)/increase in current tax liability (5,899) 5,040
(Decrease)/increase in provisions (140) 100
(Decrease)/increase in held for sale assets 349 (138)
Net cash from operating activities 2,035 50,258
7. Cash and cash equivalents and term deposits continued

81
Notes to the Financial StatementFor the year ended 30 June 2015
8. Trade and other receivables (current)
Consolidated
2015$’000
2014$’000
Trade receivables (i) 11,406 10,009
Related party receivables (ii) 238 787
Related party receivables – joint ventures (iii) 201 217
Interest receivable 156 132
12,001 11,145
(i) Trade receivables are non-interest bearing and are generally on 30-90 days terms. There are no past due or impaired receivables and none that have a history of past default.
(ii) All related party receivables are current within agreed terms of trade and do not exceed 180 days.
(iii) Related party receivables for joint ventures are for work to be undertaken in the near term and are within contractual arrangements.
(iv) Due to the short-term nature of the trade and other receivables, the carrying value approximates fair value.
9. Prepayments (current)
Consolidated
2015$’000
2014$’000
Bank facility fee 316 333
Insurance 324 399
640 732
10. Exploration assets held for sale and discontinued operations
In June 2013 the Board resolved to dispose of its exploration assets in Tunisia and during the 2012 financial year resolved to dispose of its exploration assets in Poland. The divestment process relating to Tunisia is yet to generate acceptable offers therefore the Group is seeking to defer and limit further capital expenditure and has advised the Tunisian Government of its intention to not extend or renew the Nabeul permit and is continuing efforts to divest the Bargou and Hammamet permits. The liquidation of the Polish entities is progressing.
The losses from the exploration assets classified as held for sale are presented on a separate line in the Consolidated Statement of Comprehensive Income.
During the financial year the company impaired E&E in respect of the Tunisian assets. The Tunisian and Polish entities activities are classified as discontinued operations at June 2015.
Consolidated
2015$’000
2014$’000
Exploration and evaluation assets held for sale - 46,906
Liabilities associated with assets held for sale - (2,740)
Net assets directly associated with disposal group - 44,166
Loss for the year from discontinued operations (150) (232)
Impairment loss recognised on the re-measurement to fair value (47,485) -
Loss for the year from discontinued operations (47,635) (232)
Basic (loss)/earnings per share from discontinued operations (cents per share) (14.4) (0.07)
Diluted (loss)/earnings per share from discontinued operations (cents per share) (14.4) (0.07)

82
Notes to the Financial StatementFor the year ended 30 June 2015
11. Available for sale investments (non-current)
Consolidated
2015$’000
2014$’000
Shares at fair value 1,343 26,040
A reconciliation of the movement during the year is as follows:-
Opening balance 26,040 20,182
Purchases - 62
Reclassification as investment in associate (712) -
Fair value movement (8,325) 5,796
Sale of investment (15,660) -
Closing balance 1,343 26,040
12. Investments in associate (non-current)
The group has a 21.55% (2014: 22.9%) interest in Bass Strait Oil Company Limited (ASX: BAS), which is involved in oil and gas exploration in the Gippsland basin, offshore Victoria, Australia. The Group’s interest in Bass Strait Oil Company Limited is accounted for using the equity method in the consolidated financial statements. In prior period the investment was classified as available for sale – during the 2015 financial year Cooper obtained significant influence over the investment following the election of one of the Group’s board members to the board of BAS and therefore commenced accounting for the investment as an investment in associate. The following table illustrates the summarised preliminary and unaudited financial information of the Group’s investment in Bass Strait Oil Company Limited at 30 June 2015:
Consolidated2015
$’000
Current assets 841
Non-current assets 4,279
Current liabilities (163)
Non-current liabilities -
Equity 4,957
Group’s share of net assets 1,068
Reconciliation to Group’s carrying amount of investment
Dilution through rights issue and capital injection (18)
Impairment (530)
Group’s carrying amount of the investment 520
Loss before tax (802)
Income tax expense (35)
Loss for the year (continuing operations) (837)
Total comprehensive expenditure for the year (continuing operations) (837)
Group’s share of loss for the year (166)
The associate had no contingent liabilities at 30 June 2015.
The investment in associate has been impaired and is carried at fair value.

83
Notes to the Financial StatementFor the year ended 30 June 2015
13. Oil properties (non-current)
Consolidated
2015$’000
2014$’000
Regions of focus
Australia 7,624 16,778
Asia 4,297 1,515
Africa - -
Europe - -
Total oil properties 11,921 18,293
Transferred Explorationand Evaluation Development Total
$’000 $’000 $’000
Consolidated
Year end 30 June 2015
Carrying amount at 1 July 2014 2,438 15,855 18,293
Additions 111 9,244 9,355
Foreign currency adjustment - 32 32
Depreciation (771) (7,504) (8,275)
Impairment - (7,484) (7,484)
Carrying amount at 30 June 2015 1,778 10,143 11,921
As at 30 June 2015
Cost 5,174 35,356 40,530
Accumulated depreciation & impairment (3,396) (25,213) (28,609)
1,778 10,143 11,921
Year end 30 June 2014
Carrying amount at 1 July 2013 3,289 14,127 17,416
Additions 261 7,301 7,562
Foreign currency adjustment - 77 77
Depreciation (1,112) (5,650) (6,762)
Carrying amount at 30 June 2014 2,438 15,855 18,293
As at 30 June 2014
Cost 5,063 26,080 31,143
Accumulated depreciation (2,625) (10,225) (12,850)
2,438 15,855 18,293

84
Notes to the Financial StatementFor the year ended 30 June 2015
14. Impairment
The following impairment losses were recognised during the financial year:
Consolidated
2015$’000
2014$’000
Impairment
Available for sale financial assets (7,471) (3,064)
Investments in associates (530) -
Exploration & Evaluation (7,157) -
Oil Properties – PEL 93 (7,484) -
Total (22,642) (3,064)
In accordance with the Group’s accounting policies and procedures, the Group performs its impairment testing bi-annually.
Exploration and Evaluation Impairment
During the period the Group’s exploration assets in the Otway basin were reviewed. As a result of this review, the Otway basin Area of Interest was refined into several Areas of Interest being:
• Otway onshore deep troughs
• PEL 168
• PEL 186
• PEP 151
Following this review and assessment, PEL 186 and PEP 151were fully impaired as they were not considered to be prospective. The total impairment recognised in respect of exploration assets was $7.2m.
Oil Properties Impairment
A number of factors represented indicators of impairment as at 30 June 2015, including a significant decline in the oil price throughout the period. As a result, the Group assessed the recoverable amounts of its Cash Generating Units (CGUs).
Impairment Testing
i) Methodology
Impairment is recognised when the carrying amount exceeds the recoverable amount of a CGU. The recoverable amount of each CGU has been estimated using its value in use (VIU).
Value in use is estimated based on discounted cash flows using market based commodity price and exchange rate assumptions, estimated production forecasts based on 2P reserves, operating costs and capital expenditure based on current development plans.
Estimates of production, operating costs and capital expenditure are sourced from our planning process including specific development plans of each CGU.
ii) Key Assumptions
The table below summarises the key assumptions used:
30 June 2015 30 June 2014
2016-2018 Long term (2019 +)
2015-2018 Long term (2019 +)
Real oil price (US$ per bbl) $65 increasing to $75
$80 $100 decreasing
to $95
$95
AUD:USD exchange rate $0.80 $0.80 $0.90 decreasing
to $0.85
$0.85
CPI (%) 2.5% 2.5% 2.5% 2.5%
Pre-tax real discount rate (%) AUD assets 11.2%USD assets 15.0%
AUD assets 10.4%USD assets 15.0%

85
Notes to the Financial StatementFor the year ended 30 June 2015
14. Impairment continued
Commodity prices and exchange rates
Oil price and exchange rates are estimated with reference to external data and are reviewed quarterly. The rates applied have been obtained from spot and forward values and market analysis including equity analyst estimates.
Discount rate
In determining the VIU, the future cash flows were discounted using rates based on the Group’s real pre-tax weighted average cost of capital, in line with the Capital Asset Pricing Model, for each functional currency with additional premiums being applied based on geographical location and current economic conditions.
Production, operating and capital costs
Production forecasts have been based on 2P developed and undeveloped reserves. The forecasts include all capital required to produce the reserves and, where applicable, develop the undeveloped reserves.
iii) Impacts
As a result of impairment testing, the recoverable amount of PEL 93 was reduced to nil and an impairment loss of $7.5 million was recognised.
Sensitivity Analysis
Any change to the assumptions used to determine the VIU could result in a change to the recoverable amount. Given the degree of change required to each individual input before an impairment reversal on PEL 93 would be indicated, impairment reversal is not likely.
In addition to the impairment testing performed over PEL 93, testing was performed over PEL 92 and Sukananti. The results of this testing indicated that the CGU’s recoverable amount was higher than their carrying amount. No impairment was recognised in respect of PEL 92 or Sukananti.
15. Other property, plant & equipment (non-current)
Consolidated
2015$’000
2014$’000
Consolidated
Year end 30 June
Carrying amount at 1 July 1,141 1,464
Additions 237 281
Disposals/written off - (118)
Depreciation (397) (486)
Carrying amount at 30 June 981 1,141
As at 30 June
Cost 2,142 1,919
Accumulated depreciation (1,161) (778)
981 1,141

86
Notes to the Financial StatementFor the year ended 30 June 2015
16. Exploration and evaluation (non-current)
Consolidated
2015$’000
2014$’000
Regions of focus
Australia 91,489 83,702
Asia 13,874 10,919
Africa - -
European - -
Total exploration and evaluation 105,363 94,621
Reconciliations of the carrying amounts of capitalised exploration at the beginning and end of the financial year are set out below:
Carrying amount at 1 July 94,621 30,846
Expenditure 7,750 45,747
Exploration acquired 12,602 42,443
Transferred to oil properties (111) (261)
Unsuccessful exploration wells written off (i) (2,342) (1,261)
Impairment (7,157) -
Exploration expenditure classified as held for sale - (22,893)
Carrying amount at 30 June 105,363 94,621
(i) Exploration write offs relate to exploration wells that were plugged and abandoned as unsuccessful during the year.
(ii) Recoverability is dependent on the successful development and commercial exploration or sale of the respective areas of interest.

87
Notes to the Financial StatementFor the year ended 30 June 2015
17. Trade and other payables (current)
Consolidated
2015$’000
2014$’000
Trade payables (i) 1,400 4,951
Accruals 3,636 2,117
5,036 7,068
Related party payables – joint arrangements (ii) 3,900 5,275
8,936 12,343
(i) Trade and other payables are non-interest bearing and are normally settled on 30-90 day terms
(ii) Related party payables are accrued expenditure incurred on joint arrangements
18. Provisions (non-current)
Consolidated
2015$’000
2014$’000
Current Liabilities
Restoration provision 1,500 -
Employee provisions 391 509
Other provisions 22 44
1,913 553
Non-Current Liabilities
Long service leave provision 145 104
Restoration provision 45,049 41,256
45,194 41,360
Movement in carrying amount of the non-current restoration provision:
Carrying amount at 1 July 41,256 3,321
Revaluation of provision (5,772) 1,077
Provision through asset acquisition 8,132 36,601
Increase through accretion 1,433 257
Carrying amount at 30 June 45,049 41,256
The restoration provision is the present value of the Group’s share of the estimated cost to restore operating locations. The nature of restoration activities includes the obligations relating to the reclamation, waste site closure, plant closure, production facility removal and other costs associated with the restoration of the site. However, actual restoration costs will ultimately depend upon future market prices for the necessary decommissioning works required that will reflect market conditions at the relevant time and the condition of the site at the time of the restoration. Furthermore, the timing of restoration is likely to depend on when the fields cease to produce at economically viable rates. This, in turn, will depend upon future oil and gas prices, which are inherently uncertain.
The discount rate used in the calculation of the provision as at 30 June 2015 equalled 2.98% (2014: 3.7%) reflecting the Australian Government 10 year bond rate.

88
Notes to the Financial StatementFor the year ended 30 June 2015
19. Financial liabilities (non-current)
Consolidated
2015$’000
2014$’000
Success fee financial liability 3,066 4,004
Movement in carrying amount of the success fee financial liability:
Carrying amount at 1 July 4,004 -
Obligation through BMG asset acquisition - 3,965
Finance cost 310 39
Fair value adjustment (1,248) -
Carrying amount at 30 June 3,066 4,004
The success fee liability is the fair value of the Group’s liability to pay a $5,000,000 success fee upon the commencement of commercial production of hydrocarbons on the Group’s BMG assets acquired on 7 May 2014.
The discount rate used in the calculation of the liability as at 30 June 2015 equalled 2.98% (2013: 3.7%) reflecting the Australian Government 10 year bond rate.
20. Contributed equity and reserves
Share capital
Consolidated
2015$’000
2014$’000
Ordinary shares
Issued and fully paid 115,460 114,625
Effective 1 July 1998, the Corporations legislation in place abolished the concepts of authorised capital and par value shares. Accordingly, the Parent does not have authorised capital or par value in respect of its issued shares.
Fully paid ordinary shares carry one vote per share and carry the right to dividends.
Thousands $’000
Movement in ordinary shares on issue
At 1 July 2014 329,236 114,625
Issuance of shares for Performance Rights 2,669 835
At 30 June 2015 331,905 115,460
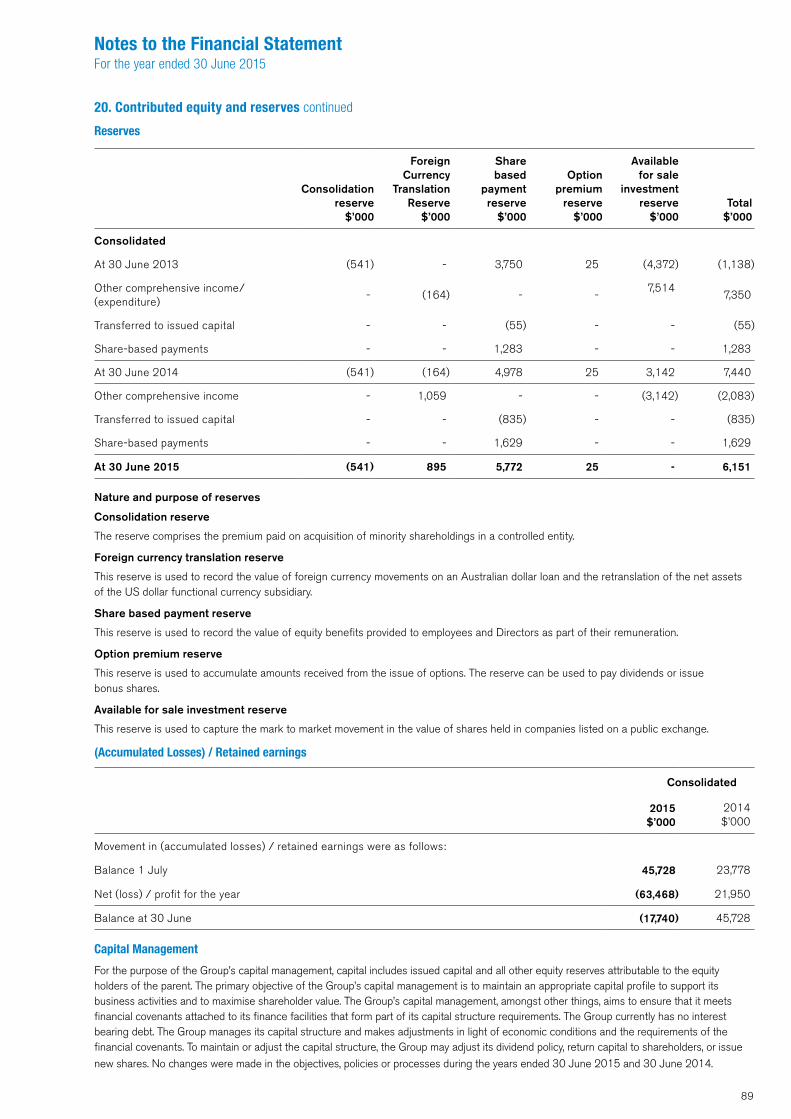
89
Notes to the Financial StatementFor the year ended 30 June 2015
20. Contributed equity and reserves continued
Reserves
Consolidationreserve
$’000
Foreign Currency
Translation Reserve
$’000
Share based
paymentreserve
$’000
Optionpremium
reserve$’000
Available for sale
investment reserve
$’000Total
$’000
Consolidated
At 30 June 2013 (541) - 3,750 25 (4,372) (1,138)
Other comprehensive income/(expenditure)
- (164) - -7,514
7,350
Transferred to issued capital - - (55) - - (55)
Share-based payments - - 1,283 - - 1,283
At 30 June 2014 (541) (164) 4,978 25 3,142 7,440
Other comprehensive income - 1,059 - - (3,142) (2,083)
Transferred to issued capital - - (835) - - (835)
Share-based payments - - 1,629 - - 1,629
At 30 June 2015 (541) 895 5,772 25 - 6,151 Nature and purpose of reserves
Consolidation reserve
The reserve comprises the premium paid on acquisition of minority shareholdings in a controlled entity.
Foreign currency translation reserve
This reserve is used to record the value of foreign currency movements on an Australian dollar loan and the retranslation of the net assets of the US dollar functional currency subsidiary.
Share based payment reserve
This reserve is used to record the value of equity benefits provided to employees and Directors as part of their remuneration.
Option premium reserve
This reserve is used to accumulate amounts received from the issue of options. The reserve can be used to pay dividends or issue bonus shares.
Available for sale investment reserve
This reserve is used to capture the mark to market movement in the value of shares held in companies listed on a public exchange.
(Accumulated Losses) / Retained earnings
Consolidated
2015$’000
2014$’000
Movement in (accumulated losses) / retained earnings were as follows:
Balance 1 July 45,728 23,778
Net (loss) / profit for the year (63,468) 21,950
Balance at 30 June (17,740) 45,728
Capital Management
For the purpose of the Group’s capital management, capital includes issued capital and all other equity reserves attributable to the equity holders of the parent. The primary objective of the Group’s capital management is to maintain an appropriate capital profile to support its business activities and to maximise shareholder value. The Group’s capital management, amongst other things, aims to ensure that it meets financial covenants attached to its finance facilities that form part of its capital structure requirements. The Group currently has no interest bearing debt. The Group manages its capital structure and makes adjustments in light of economic conditions and the requirements of the financial covenants. To maintain or adjust the capital structure, the Group may adjust its dividend policy, return capital to shareholders, or issue
new shares. No changes were made in the objectives, policies or processes during the years ended 30 June 2015 and 30 June 2014.

90
Notes to the Financial StatementFor the year ended 30 June 2015
21. Financial risk management objectives and policies
The Group’s principal financial instruments comprise cash and short term deposits, receivables, available for sale investments and payables.
The Group manages its exposure to key financial risks in accordance with its risk management policy with the objective to ensure that the financial risks inherent in oil and gas exploration activities are identified and then managed or kept as low as reasonably practicable.
The main financial risks that arise in the normal course of business for the Group’s financial instruments are foreign currency risk, commodity price risk, share price risk, credit risk, liquidity risk and interest rate risk. The Group uses different methods to measure and manage different types of risks to which it is exposed. These include monitoring exposure to foreign exchange risk and assessments of market forecast for interest rates, foreign exchange and commodity prices. Liquidity risk is monitored through the development of future rolling cash flow forecasts.
It is, and has been, throughout the period under review, the Board’s policy that no speculative trading in financial instruments be undertaken.
The primary responsibility for the identification and control of financial risks rests with the Managing Director and the Chief Financial Officer, under the authority of the Board. The Board is apprised of these and other risks at Board meetings and agrees any policies that may be taken to manage any of the risks identified below.
Details of the significant accounting policies and methods adopted, including criteria for recognition, the basis of measurement and the basis on which income and expenses are recognised , in respect of each financial instrument are disclosed in Note 2 to the financial statements.
Fair value hierarchy
All financial instruments for which fair value is recognised or disclosed are categorised within the fair value hierarchy, described as follows, and based on the lowest level input that is significant to the fair value measurement as a whole:
Level 1 — Quoted market prices in an active market (that are unadjusted) for identical assets or liabilities
Level 2 — Valuation techniques (for which the lowest level input that is significant to the fair value measurement is directly or indirectly observable)
Level 3 — Valuation techniques (for which the lowest level input that is significant to the fair value measurement is unobservable)
For financial instruments that are recognised at fair value on a recurring basis, the Group determines whether transfers have occurred between Levels in the hierarchy by re-assessing categorisation (based on the lowest level input that is significant to the fair value measurement as a whole) at the end of each reporting period.
Set out below is an overview of financial instruments held by the Group, with a comparison of the carrying amounts and fair values as at 30 June 2015:
Carrying amount Fair value
Level2015
$’0002014$’000
2015$’000
2014$’000
Consolidated
Financial assets
Available for sale investments 1 1,343 26,040 1,343 26,040
Financial liabilities
Success fee financial liability 3 3,066 4,004 3,066 4,004
The financial assets and liabilities of the Group are recognised in the consolidated statement of financial position in accordance with the accounting policies set out in Note 2.
The following summarises the significant methods and assumptions used in estimating the fair values of financial instruments
Available for sale investments
The fair value of available for sale investments is determined by reference to their quoted market price on a prescribed equity stock exchange at the reporting date, and hence is a level 1 fair value measurement.
Success fee financial liability
The success fee liability is the fair value of the Group’s liability to pay a $5,000,000 success fee upon the commencement of commercial production of hydrocarbons on the Group’s BMG assets acquired on 7 May 2014. Refer to Note 19 for details. The significant unobservable valuation input for the success fee financial liability includes: a probability of 37% that no payment is made and a probability of 63% the payment is made in 2021; and discount rate of 2.98%.

91
Notes to the Financial StatementFor the year ended 30 June 2015
21. Financial risk management objectives and policies continued
Derivative financial instruments
The derivative financial instruments relate to options the Group has entered into to mitigate the risk on the Group’s operating cash flow of oil price movements. At 30 June 2015, the fair value of these options is nil.
Market risk
Market risk is the risk that the fair value of future cash flows of a financial instrument will fluctuate because of changes in market prices. Market risk comprises three types of risk: foreign currency risk, commodity price risk and interest rate risk. Financial instruments affected by market risk include deposits, trade receivables, trade payables and accrued liabilities.
The sensitivity analyses in the following sections relate to the position as at 30 June 2015 and 30 June 2014.
The sensitivity analyses have been prepared on the basis that the amount of the financial instruments in foreign currencies is all constant. The sensitivity analyses are intended to illustrate the sensitivity to changes in market variables on the Group’s financial instruments and show the impact on profit or loss and shareholders’ equity, where applicable.
The analyses exclude the impact of movements in market variables on the carrying value of provisions.
The following assumptions have been made in calculating the sensitivity analyses:
• The statement of financial position sensitivity relates to US-denominated trade receivables
• The sensitivity of the relevant profit before tax item and/or equity is the effect of the assumed changes in respective market risks. This is based on the financial assets and financial liabilities held at 30 June 2015 and 30 June 2014
• The impact on equity is the same as the impact on profit before tax
a) Foreign currency risk
The Group has transactional currency exposure arising from all its sales which are denominated in United States dollars, whilst almost all its costs are denominated in the Group’s functional currency of Australian dollars.
In addition the Group operates internationally and is exposed to foreign exchange risk arising from various currency exposures, to the United States dollars, Euro’s and Polish Zloty’s. Transaction exposures, where possible, are netted off across the Group to reduce volatility and provide a natural hedge.
The Group may from time to time have cash denominated in United States dollars, Euro’s and Polish Zloty’s.
Currently the Group has no foreign exchange hedge programmes in place. The Chief Financial Officer manages the purchase of foreign currency to meet expenditure requirements, which cannot be netted off against US dollar receivables.
The financial instruments which are denominated in US dollars are as follows:
Consolidated2015
$’0002014$’000
Financial assets
Cash 3,198 5,269
Term deposits at bank 43 1,618
Trade and other receivables (current and non-current) 6,360 4,531
Financial liabilities
Trade and other payables 1,265 2,897
The following table summarises the sensitivity of financial instruments held at the year end, to movements in the exchange rates for the Australian dollar to the foreign currency, with all other variables held constant.
Impact on after tax profit
If the Australian dollar were higher at the balance date by 10% (758) (775)
If the Australian dollar were lower at the balance date by 10% 926 947
Impact on other comprehensive income
If the Australian dollar were higher at the balance date by 10% 81 (15)
If the Australian dollar were lower at the balance date by 10% (99) 18
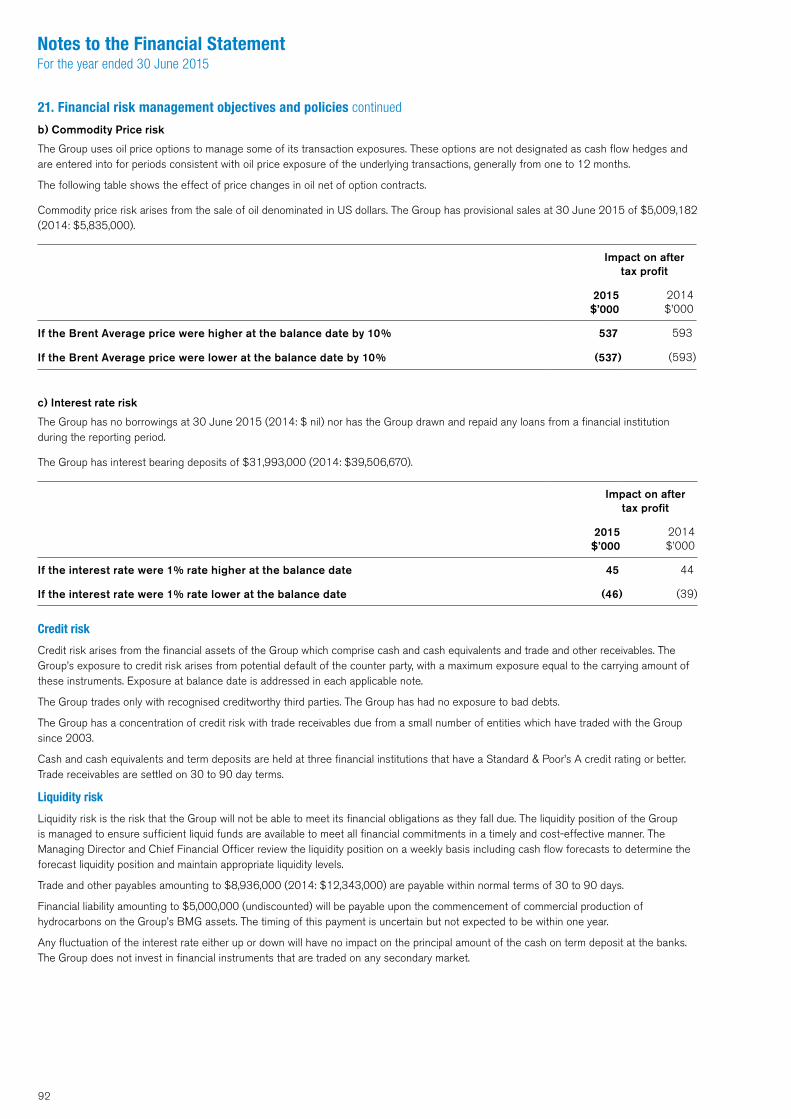
92
Notes to the Financial StatementFor the year ended 30 June 2015
21. Financial risk management objectives and policies continued
b) Commodity Price risk
The Group uses oil price options to manage some of its transaction exposures. These options are not designated as cash flow hedges and are entered into for periods consistent with oil price exposure of the underlying transactions, generally from one to 12 months.
The following table shows the effect of price changes in oil net of option contracts.
Commodity price risk arises from the sale of oil denominated in US dollars. The Group has provisional sales at 30 June 2015 of $5,009,182 (2014: $5,835,000).
Impact on after tax profit
2015$’000
2014$’000
If the Brent Average price were higher at the balance date by 10% 537 593
If the Brent Average price were lower at the balance date by 10% (537) (593)
c) Interest rate risk
The Group has no borrowings at 30 June 2015 (2014: $ nil) nor has the Group drawn and repaid any loans from a financial institution during the reporting period.
The Group has interest bearing deposits of $31,993,000 (2014: $39,506,670).
Impact on after tax profit
2015$’000
2014$’000
If the interest rate were 1% rate higher at the balance date 45 44
If the interest rate were 1% rate lower at the balance date (46) (39)
Credit risk
Credit risk arises from the financial assets of the Group which comprise cash and cash equivalents and trade and other receivables. The Group’s exposure to credit risk arises from potential default of the counter party, with a maximum exposure equal to the carrying amount of these instruments. Exposure at balance date is addressed in each applicable note.
The Group trades only with recognised creditworthy third parties. The Group has had no exposure to bad debts.
The Group has a concentration of credit risk with trade receivables due from a small number of entities which have traded with the Group since 2003.
Cash and cash equivalents and term deposits are held at three financial institutions that have a Standard & Poor’s A credit rating or better. Trade receivables are settled on 30 to 90 day terms.
Liquidity risk
Liquidity risk is the risk that the Group will not be able to meet its financial obligations as they fall due. The liquidity position of the Group is managed to ensure sufficient liquid funds are available to meet all financial commitments in a timely and cost-effective manner. The Managing Director and Chief Financial Officer review the liquidity position on a weekly basis including cash flow forecasts to determine the forecast liquidity position and maintain appropriate liquidity levels.
Trade and other payables amounting to $8,936,000 (2014: $12,343,000) are payable within normal terms of 30 to 90 days.
Financial liability amounting to $5,000,000 (undiscounted) will be payable upon the commencement of commercial production of hydrocarbons on the Group’s BMG assets. The timing of this payment is uncertain but not expected to be within one year.
Any fluctuation of the interest rate either up or down will have no impact on the principal amount of the cash on term deposit at the banks. The Group does not invest in financial instruments that are traded on any secondary market.

93
Notes to the Financial StatementFor the year ended 30 June 2015
Share price risk
Share price risk arises from the movement of share prices on a prescribed stock exchange. The Group has available for sale investments the fair value of which fluctuates as a result of movement in the share price.
Impact on available for sale investment
reserve
Impact on profit before tax
2015$’000
2014$’000
2015$’000
2014$’000
If the share price were 10% higher at the balance date 134 2,604 - -
If the share price were 10% lower at the balance date - - (134) (2,604)
22. Commitments and contingencies
Consolidated
2015$’000
2014$’000
Operating lease commitments under non-cancellable office lease not provided for in the financial statements and payable:
Within one year 357 277
After one year but not more than five years 582 778
After more than five years - -
Total minimum lease payments 939 1,055
The Parent entity leases a suite of offices in Adelaide from which it conducts its operations. The lease is for a further four years with an option to renew after that date.
Exploration capital commitments not provided in the financial statements and payable:
Within one year 44,597 11,742
After one year but not more than five years 12,359 19,228
After more than five years - -
Total minimum lease payments 56,956 30,970
As at 30 June 2015 the Parent entity has bank guarantees for $4,067,000 (2014: $4,520,000). These guarantees are in relation to performance bonds on exploration permits and guarantees on office leases.
21. Financial risk management objectives and policies continued

94
Notes to the Financial StatementFor the year ended 30 June 2015
The group has interests in a number of joint arrangements which are classified as joint operations. These joint operations are involved in the exploration and/or production of oil in Australia, Tunisia and Indonesia. The Group has the following interests in joint arrangements in the following major areas:
Ownership Interest
2015 2014
a) Joint Arrangements in which Cooper Energy Limited is the operator/manager
Australia
PEL 186 Oil and gas exploration 33.33% 33.33%
VIC/L26 Oil and gas exploration and production 65% 65%
VIC/L27 Oil and gas exploration and production 65% 65%
VIC/L28 Oil and gas exploration and production 65% 65%
Indonesia
Sukananti KSO Oil and gas exploration and production 55% 55%
Sumbagsel PSC Oil and gas exploration 100% 100%
Merangin III PSC Oil and gas exploration 100% 100%
Tunisia
Bargou Exploration Permit Oil and gas exploration 30% 30%
Nabeul Exploration Permit Oil and gas exploration 85% 85%
b) Joint Arrangements in which Cooper Energy Limited is not the operator/manager
Australia
PEL 90 Oil and gas exploration 25% 25%
PEL 93 Oil and gas exploration 30% 30%
PEL 100 Oil and gas exploration 19.167% 19.167%
PEL 110 Oil and gas exploration 20% 20%
PEL 494 Oil and gas exploration 30% 30%
PEL 495 Oil and gas exploration 30% 30%
PEP 150 Oil and gas exploration 20% 20%
PEP 168 Oil and gas exploration 50% 50%
PEP 171 Oil and gas exploration 25% 25%
PEP 151 Oil and gas exploration 75% 75%
PPL 207 Oil and gas exploration and production 30% 30%
PRL 32 Oil and gas exploration 30% 30%
PRL 85-104* (Formerly PEL 92)
Oil and gas exploration and production 25% 25%
VIC/RL3 Oil and gas exploration and production 50% -
Orbost Gas Plant Gas production 50% -
Tunisia
Hammamet Exploration Permit Oil and gas exploration 35% 35%
*Includes associated PPL’s
23. Interests in joint arrangements
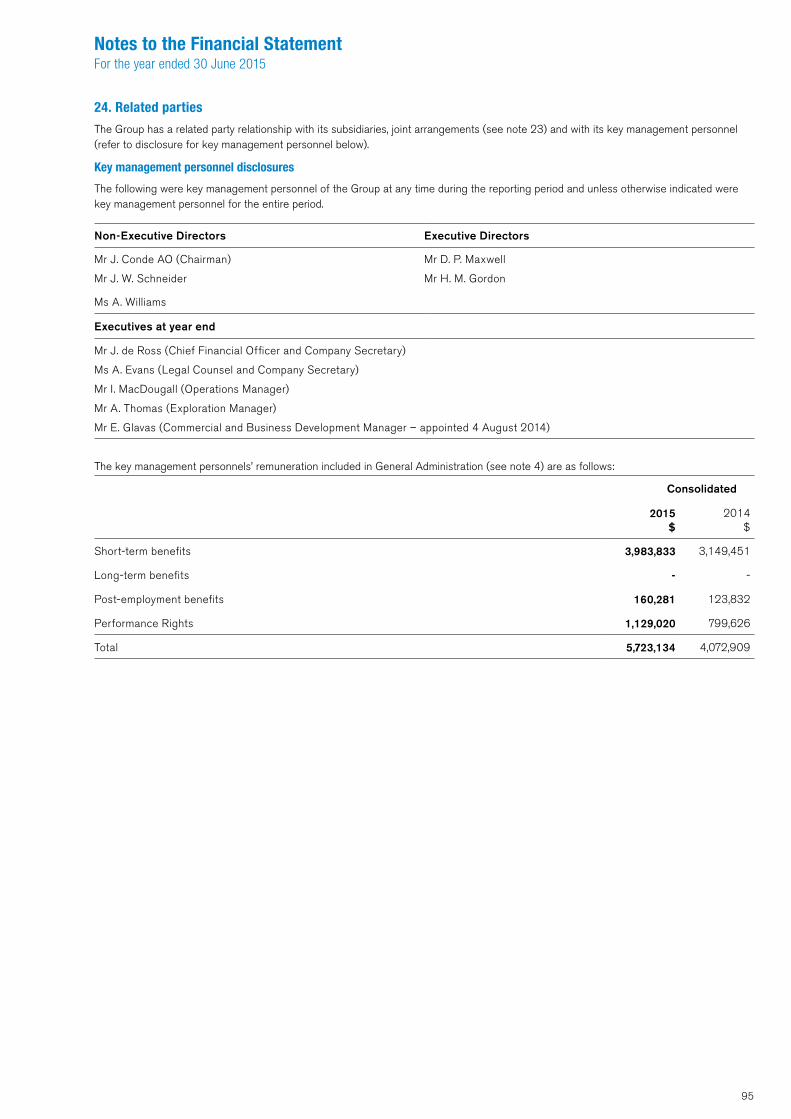
95
Notes to the Financial StatementFor the year ended 30 June 2015
24. Related parties
The Group has a related party relationship with its subsidiaries, joint arrangements (see note 23) and with its key management personnel (refer to disclosure for key management personnel below).
Key management personnel disclosures
The following were key management personnel of the Group at any time during the reporting period and unless otherwise indicated were key management personnel for the entire period.
Non-Executive Directors Executive Directors
Mr J. Conde AO (Chairman)
Mr J. W. Schneider
Mr D. P. Maxwell
Mr H. M. Gordon
Ms A. Williams
Executives at year end
Mr J. de Ross (Chief Financial Officer and Company Secretary)
Ms A. Evans (Legal Counsel and Company Secretary)
Mr I. MacDougall (Operations Manager)
Mr A. Thomas (Exploration Manager)
Mr E. Glavas (Commercial and Business Development Manager – appointed 4 August 2014)
The key management personnels’ remuneration included in General Administration (see note 4) are as follows:
Consolidated
2015$
2014$
Short-term benefits 3,983,833 3,149,451
Long-term benefits - -
Post-employment benefits 160,281 123,832
Performance Rights 1,129,020 799,626
Total 5,723,134 4,072,909

96
Notes to the Financial StatementFor the year ended 30 June 2015
24. Related parties continued
Subsidiaries
The Group financial statements include the financial statements of Cooper Energy Limited and the subsidiaries listed in the following table.
NameCountry of incorporation
Equity interest
2015 %
2014 %
Cooper Energy Indonesia Limited British Virgin Islands 100% 100%
Cooper Energy Sukananti Limited British Virgin Islands 100% 100%
Cooper Energy Sumbagsel Limited British Virgin Islands 100% 100%
Cooper Energy Merangin III Limited British Virgin Islands 100% 100%
CE Tunisia Bargou Ltd British Virgin Islands 100% 100%
CE Hammamet Ltd British Virgin Islands 100% 100%
CE Nabeul Ltd British Virgin Islands 100% 100%
Cooper Energy (Seruway) Pty Ltd Australia 100% 100%
CE Poland Pty Ltd Australia 100% 100%
Somerton Energy Limited Australia 100% 100%
Essential Petroleum Exploration Pty Ltd Australia 100% 100%
Cooper Energy (PBGP) Pty Ltd Australia 100% 100%
CE Poland Coopertief UA Netherlands 99% 99%
CE Polska sp z.o.o. Poland 100% 100%
Joint arrangements
During the reporting period, the Group provided geological and technical services to joint arrangements it manages at a cost of $2,822,000 (2014: $1,929,000). At the end of the financial period, $391,000 was outstanding for these services (2014: $1,004,000).
An impairment assessment is undertaken each financial year of related party receivables by examining the financial position of the related party and their investment in the respective joint ventures which are prospecting for hydrocarbons to determine whether there is objective evidence that a related party receivable is impaired. When such objective evidence exists, the Group recognises an allowance for the impairment loss.

97
Notes to the Financial StatementFor the year ended 30 June 2015
25. Share based payment plans
On 16 December 2011 shareholders of Cooper Energy approved the establishment of an Employee Performance Rights Plan whereby the Board can, subject to certain conditions, issue performance rights to employees to acquire shares in the parent entity.
During the financial year, issues were made on December 2014. The performance rights were issued for no consideration. The right extends to the holder the right to be vested with shares in the parent entity.
Testing of the performance rights will be in three equal tranches over the term of the right to be determined in the fourth calendar quartile of each year. At the end of the three year measurement period, those rights that were tested and achieved will vest.
The vesting test is two parts. Up to 25% of the eligible rights to be tested are determined from the absolute total shareholder return of Cooper Energy’s share price against its own share price at the date of the grant of the right. If the return is less than 5% no rights will vest. If the return is between 5% and 25% the rights that will vest will be between 6.25% and 12.5% of the eligible rights. If the return is greater than 25% up to 25% of the eligible rights will vest.
The second part is for the remaining 75% of the eligible rights to vest and is determined from the absolute total shareholder return of Cooper Energy’s share price ranked against a weighted basket of absolute total shareholder returns of peer companies listed on the Australian Stock Exchange. If Cooper Energy’s ranking is lower than 6 out of 9 of peer companies no rights will vest. If the ranking is 5th 50% of rights the eligible rights will vest. If Cooper Energy is ranked 3rd or 4th, prorate 50% to 100% of the eligible rights will vest and if it ranks 1st or 2nd, 100% of the eligible rights will vest.
Rights that do not qualify for vesting in any one year can be carried forward to the following year for testing of vesting eligibility. There are no participating rights or entitlements inherent in the rights and holders will not be entitled to participate in new issues of capital offered to shareholders during the period of the rights. All rights are settled by physical delivery of shares.
Information with respect to the number of performance rights granted to employees is as follows:
Date GrantedNumber of
rights granted
Average share price at commencement
date of grant (cents)
Average contractual life of rights at
grant date in yearsRemaining life of
rights in years
2 August 2012 252,980 $0.437 3 0
10 December 2012 5,172,342 $0.574 3 1
31 May 2013 267,607 $0.471 3 1
6 November 2013 6,581,999 $0.405 3 2
28 April 2014 312,033 $0.510 3 2
1 December 2014 6,584,708 $0.285 3 3
The number of performance rights held by employees is as follows:
Numberof rights
Numberof rights
2015 2014
Balance at beginning of year 14,748,003 8,561,370
- granted 6,584,708 6,894,032
- vested (2,669,814) (135,588)
- expired and not exercised (223,478) -
- forfeited following employee resignation (1,162,444) (571,811)
Balance at end of year 17,276,975 14,748,003
Achieved at end of year 1,746,390 1,704,527
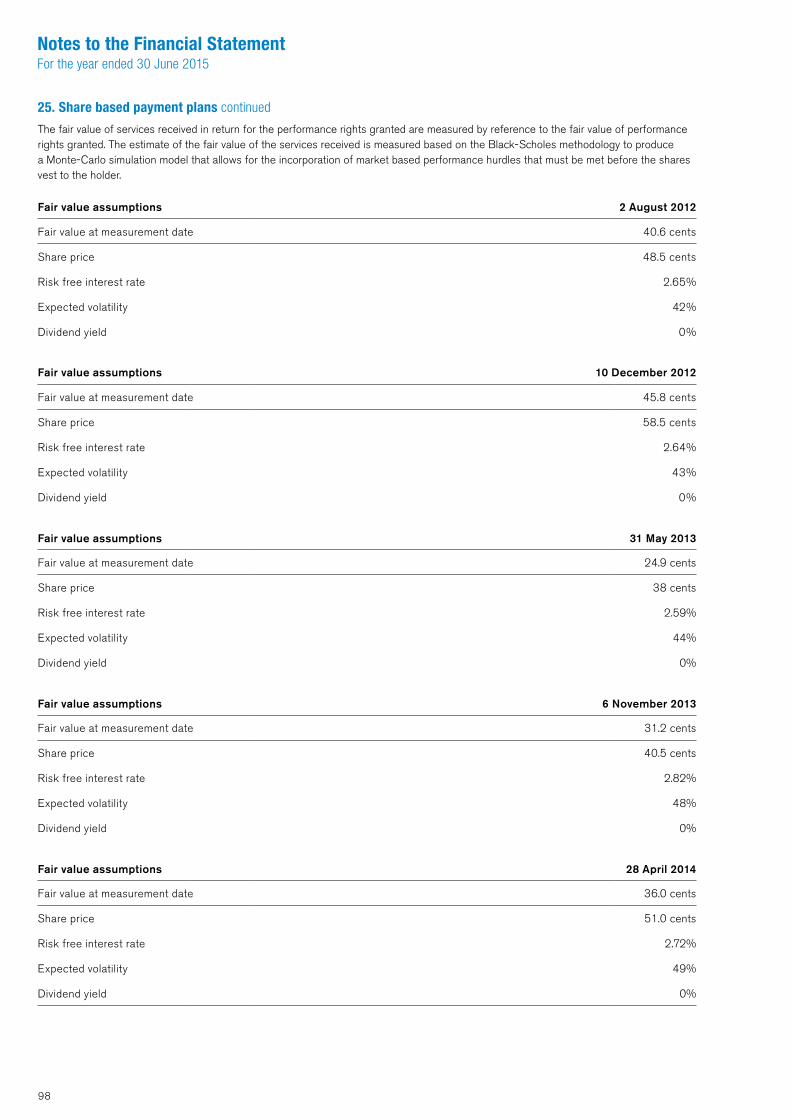
98
Notes to the Financial StatementFor the year ended 30 June 2015
25. Share based payment plans continued
The fair value of services received in return for the performance rights granted are measured by reference to the fair value of performance rights granted. The estimate of the fair value of the services received is measured based on the Black-Scholes methodology to produce a Monte-Carlo simulation model that allows for the incorporation of market based performance hurdles that must be met before the shares vest to the holder.
Fair value assumptions 2 August 2012
Fair value at measurement date 40.6 cents
Share price 48.5 cents
Risk free interest rate 2.65%
Expected volatility 42%
Dividend yield 0%
Fair value assumptions 10 December 2012
Fair value at measurement date 45.8 cents
Share price 58.5 cents
Risk free interest rate 2.64%
Expected volatility 43%
Dividend yield 0%
Fair value assumptions 31 May 2013
Fair value at measurement date 24.9 cents
Share price 38 cents
Risk free interest rate 2.59%
Expected volatility 44%
Dividend yield 0%
Fair value assumptions 6 November 2013
Fair value at measurement date 31.2 cents
Share price 40.5 cents
Risk free interest rate 2.82%
Expected volatility 48%
Dividend yield 0%
Fair value assumptions 28 April 2014
Fair value at measurement date 36.0 cents
Share price 51.0 cents
Risk free interest rate 2.72%
Expected volatility 49%
Dividend yield 0%
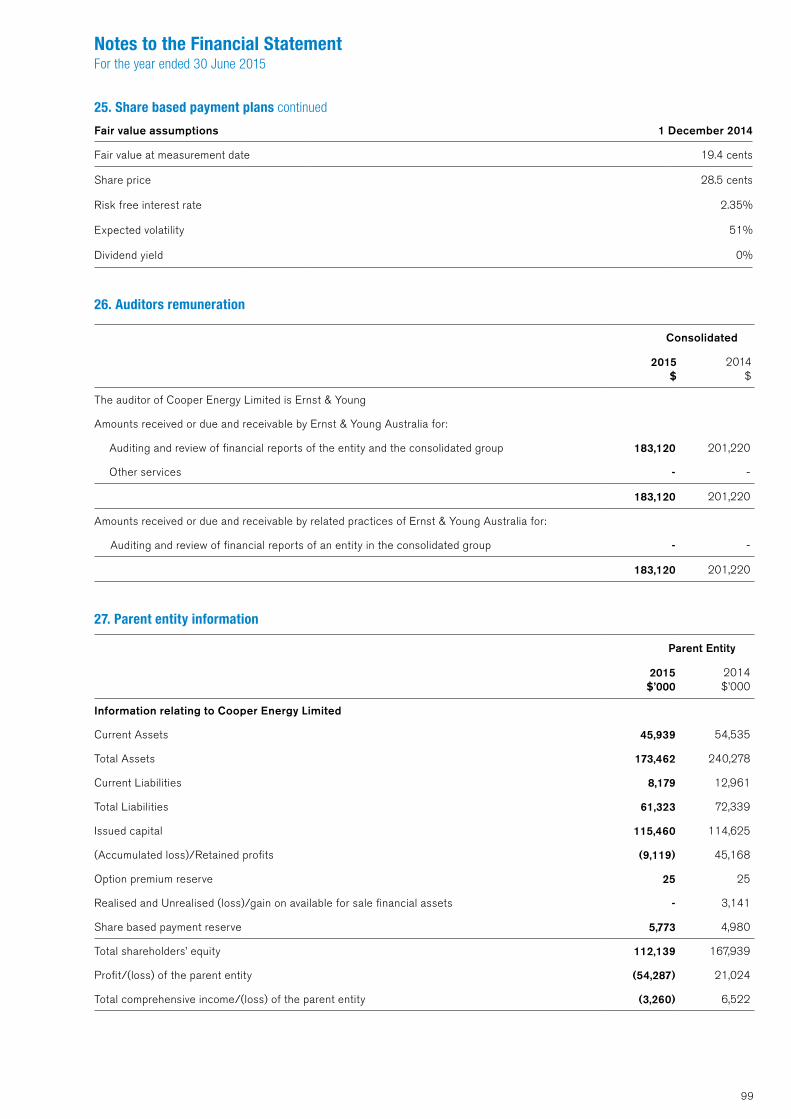
99
Notes to the Financial StatementFor the year ended 30 June 2015
Fair value assumptions 1 December 2014
Fair value at measurement date 19.4 cents
Share price 28.5 cents
Risk free interest rate 2.35%
Expected volatility 51%
Dividend yield 0%
26. Auditors remuneration
Consolidated
2015$
2014$
The auditor of Cooper Energy Limited is Ernst & Young
Amounts received or due and receivable by Ernst & Young Australia for:
Auditing and review of financial reports of the entity and the consolidated group 183,120 201,220
Other services - -
183,120 201,220
Amounts received or due and receivable by related practices of Ernst & Young Australia for:
Auditing and review of financial reports of an entity in the consolidated group - -
183,120 201,220
27. Parent entity information
Parent Entity
2015$’000
2014$’000
Information relating to Cooper Energy Limited
Current Assets 45,939 54,535
Total Assets 173,462 240,278
Current Liabilities 8,179 12,961
Total Liabilities 61,323 72,339
Issued capital 115,460 114,625
(Accumulated loss)/Retained profits (9,119) 45,168
Option premium reserve 25 25
Realised and Unrealised (loss)/gain on available for sale financial assets - 3,141
Share based payment reserve 5,773 4,980
Total shareholders’ equity 112,139 167,939
Profit/(loss) of the parent entity (54,287) 21,024
Total comprehensive income/(loss) of the parent entity (3,260) 6,522
25. Share based payment plans continued

100
Notes to the Financial StatementFor the year ended 30 June 2015
Parent Entity
2015$’000
2014$’000
Commitments and Contingencies
Operating lease commitments under non-cancellable office lease not provided for in the financial statements and payable:
Within one year 357 277
After one year but not more than five years 582 778
After more than five years - -
Total minimum lease payments 939 1,055
28. Events after the reporting period
Sales agreement for Sole Gas Project
On 3 August 2015 the Group announced the signing of a Heads of Agreement with O-I Australia which defines the key terms for the sale of gas from the Sole gas field. The key terms set out in the Heads of Agreement will form the basis of a fully termed gas sales agreement which will be subject to an affirmative Final Investment Decision for development of the Sole gas field.
Consolidation of PEL 494 and PEL 495
The consolidation of PEL 494 and PEL 495, located in the Otway basin, was approved pursuant to the Petroleum and Geothermal Energy Act 2000 on 6 August 2015 with an effective date of 20 March 2015. The consolidated area was designated as PEL 494 and the former PEL 495 was consequently revoked.
BMG retention lease
The BMG Joint Venture currently holds life-of-field Production Licences VIC/L26, VIC/L27 & VIC/L28 over the BMG fields. Pursuant to the Offshore Petroleum and Greenhouse Gas Storage Act 2006, the Joint Authority may terminate a production licence if no petroleum recovery operations under the licence have been carried on at any time during a continuous period of at least 5 years. The Joint Venture plans to submit applications to convert the existing licences to petroleum retention leases by 18 August 2015 in order to preserve tenure over these blocks until petroleum recovery operations can again commence. The reversion to petroleum retention leases may have consequences on Petroleum Resource Rent Tax as noted in note 5.
27. Parent entity information continued

101
In accordance with a resolution of the Directors of Cooper Energy Limited, I state that:
In the opinion of the Directors:
(a) the financial statements and notes of the consolidated entity are in accordance with the Corporations Act 2001, including:
(i) giving a true and fair view of the consolidated entity’s financial position as at 30 June 2015 and of its performance for the year ended on that date; and
(ii) complying with Australian Accounting Standards (including the Australian Accounting Interpretations) and the Corporations Regulations 2001;
(b) the financial statements and notes also comply with International Financial Reporting Standards as disclosed in note 2b;
(c) there are reasonable grounds to believe that the consolidated entity will be able to pay its debts as and when they become due and payable; and
(d) this declaration has been made after receiving the declarations required to be made to the Directors in accordance with section 295A of the Corporations Act 2001 for the financial year ended 30 June 2015.
Signed is accordance with a resolution of the Directors.
Mr John C. Conde AO Mr David P. MaxwellChairman Director
17 August 2015
Directors’ Declaration
102
A member firm of Ernst & Young Global Limited Liability limited by a scheme approved under Professional Standards Legislation

103
A member firm of Ernst & Young Global Limited Liability limited by a scheme approved under Professional Standards Legislation

104
A member firm of Ernst & Young Global Limited Liability limited by a scheme approved under Professional Standards Legislation

105
Securities Exchange and Shareholder Informationas at 31 August 2015
ListingThe company’s shares are quoted on the Australian Securities Exchange under the code of “COE”.
Number of ShareholdersThere were 5,050 shareholders. All issued shares carry voting rights. On a show of hands every member at a meeting of shareholders shall have one vote and upon a poll each share shall have one vote.
Distribution of Shareholding (at 31 August 2015)
Size of Shareholding Number of holders Number of Shares % of issued capital
1 - 1,000 1,088 308,527 0.09
1,001 - 5,000 1,415 4,132,232 1.24
5,001 - 10,000 830 6,886,242 2.07
10,001 - 100,000 1,539 51,239,486 15.43
100,001 - 9,999,999,999 178 269,519,389 81.16
Total 5,050 332,085,876 100.00
Unquoted Options on IssueNil
Unquoted Performance Rights
Number of Holders of Performance Rights Total Performance Rights
29 17,023,996
Unmarketable ParcelsThere were 1,812 members, representing 1,625,444 shares, holding less than a marketable parcel of 2,778 shares in the company.
Twenty Largest Shareholders
Rank Name Units % of Issued Capital
1. Beach Energy Limited 60,590,884 18.25
2. J P Morgan Nominees Australia Limited 48,906,692 14.73
3. HSBC Custody Nominees (Australia) Limited 28,493,046 8.58
4. National Nominees Limited 22,442,633 6.76
5. Zero Nominees Pty Ltd 17,001,753 5.12
6. Citicorp Nominees Pty Limited 15,628,316 4.71
7. Citicorp Nominees Pty Limited <Colonial First State INV A/C> 5,956,495 1.79
8. Cairnglen Investments Pty Ltd <Woodford Super Fund A/C> 4,880,000 1.47
9. BNP Paribas Noms Pty Ltd <DRP> 4,632,091 1.39
10. Navigator Australia Ltd <MLC Investment Sett A/C> 2,791,295 0.84
11. Kavel Pty Ltd <Kleemann Family A/C> 2,768,482 0.83
12. Bresrim Nominees Pty Ltd <D A Hannes Super Fund #2 A/C> 1,610,970 0.49
13. Vanez Holdings Pty Ltd <Spyglass Nominees Pty Ltd> 1,350,000 0.41
14. Celtic Trust Company Ltd <Three Sisters Global EN A/C> 1,329,281 0.40
15. Town Inns (Holdings) Pty Ltd 1,300,000 0.39
16. Mrs Tracy Michele Kleemann 1,106,803 0.33
17. Amalgamated Dairies Limited 1,055,933 0.32
18. CPU Share Plans Pty Limited <COE VPR Control A/C> 1,020,163 0.31
19. Chesser Nominees Pty Ltd 1,000,000 0.30
20. Jakana Pty Ltd <Bateman Super Fund A/C> 1,000,000 0.30
Totals: Top 20 holders of Ordinary Fully Paid Shares (Total) 224,864,837 67.71
Substantial ShareholderThe following were substantial holders in the company, as disclosed in substantial holding notices given to the Company as required by section 671B of the Corporations Act.
Name of entityNumber of securities in which substantial shareholder
has a relevant interest as at date of last noticeVoting power
as at date of last notice
Beach Energy Limited 60,590,884 18.41%
Kinetic Investment Partners Limited 20,924,029 7.15%

106
Shareholder Information
Share RegistryComputershare Investor Services Pty LtdLevel 5, 115 Grenfell StreetAdelaide SA 5000
Website: investorcentre.com/au
Telephone: Australia 1300 655 248 International +61 3 9415 4887
Facsimile: +61 3 9473 2500
Enquiries and share registry addressShareholders with enquiries about their shareholdings should contact the company’s share registry, Computershare Investor Services Pty Ltd, via the telephone contact above.
Online shareholder informationShareholders can obtain information about their holdings or view their account instructions online, as well as download forms to update their holder details. For identification and security purposes, you will need to know your Holder Identification Number (HIN/SRN), Surname/Company Name and Post/Country Code to access. This service is accessible via the Computershare website.
Change of addressShareholders who have changed their address should advise Computershare in writing. Written notification can be mailed or faxed to Computershare at the address given above and must include both old and new addresses and the security holder reference number (SRN) of the holding.
Change of address forms are available for download from the Computershare website. Alternatively, holders can amend their details on-line via the Computershare website. Shareholders who have broker sponsored holdings should contact their broker to update these details.
Annual Report mailing listShareholders who wish to vary their annual report mailing arrangements should advise Computershare in writing. Electronic versions of the report are available to all via the company’s website. Annual Reports will be mailed to all shareholders who have elected to be placed on the mailing list for this document. Report election forms can be downloaded from the Computershare website.
Forms for downloadAll forms relating to amendment of holding details and holder instructions to the company are available for download from the Computershare.
Investor informationInformation about the company is available from a number of sources:
• Website: www.cooperenergy.com.au
• E-news: Shareholders can nominate to receive company information electronically. This service is hosted by Computershare and can be accessed via Computershare’s website
• Publications: the annual report is the major printed source of company information. Other publications include the half-yearly report, company press releases, investor packs, presentations and Open Briefings. All publications can be obtained either through the company’s website or by contacting the company
• Telephone or email enquiry: to Don Murchland, Investor Relations +61 439 300 932; [email protected]

Corporate Directory
DirectorsJohn C Conde AO, Chairman
David P Maxwell
Hector M Gordon
Jeffery W Schneider
Alice J M Williams
Company SecretariesAlison M Evans
Jason de Ross
Registered Office and Business AddressLevel 10, 60 Waymouth Street Adelaide, South Australia 5000
Telephone: + 618 8100 4900Facsimile: + 618 8100 4997E-mail: [email protected]: www.cooperenergy.com.au
AuditorsErnst & Young121 King William StreetAdelaide, South Australia, 5000
SolicitorsJohnson Winter & Slattery Level 9 211 Victoria Square Adelaide SA 5000
BankersWestpac Banking CorporationLevel 18, 91 King William StreetAdelaide, South Australia, 5000
National Australia Bank LimitedLevel 2, 22 King William StreetAdelaide, South Australia, 5000
Commonwealth Bank of AustraliaLevel 8, 100 King William StreetAdelaide, South Australia, 5000
Citibank N.A.2 Park StreetSydney, New South Wales 2000
Share RegistryComputershare Investor Services Pty LimitedLevel 5, 115 Grenfell StreetAdelaide SA 5000
Website: investorcentre.com/au
Telephone: Australia 1300 655 248 International +61 3 9415 4887Facsimile: +61 3 9473 2500
