from the trenches: lessons learned from the jboss ... · pdf filefrom the trenches: lessons...
TRANSCRIPT

From the trenches: Lessons learned from the JBoss performance team
Ståle W. Pedersen
Senior Principal Software Engineer
29 June 2016

Agenda
Lessons of what we've learned….
• Methodology• Tools• Profiling• Benchmarking• Road to EAP7 from a performance perspective

Methodology
Performance optimization Methodology

Methodology
What
• What prevents my application from running faster?– Monitoring

Methodology
What -> Where
• What prevents my application from running faster?– Monitoring
• Where does it hide?– Profiling

Methodology
What -> Where -> How
• What prevents my application from running faster?– Monitoring
• Where does it hide?– Profiling
• How can we improve performance?– tuning/optimizing

Methodology
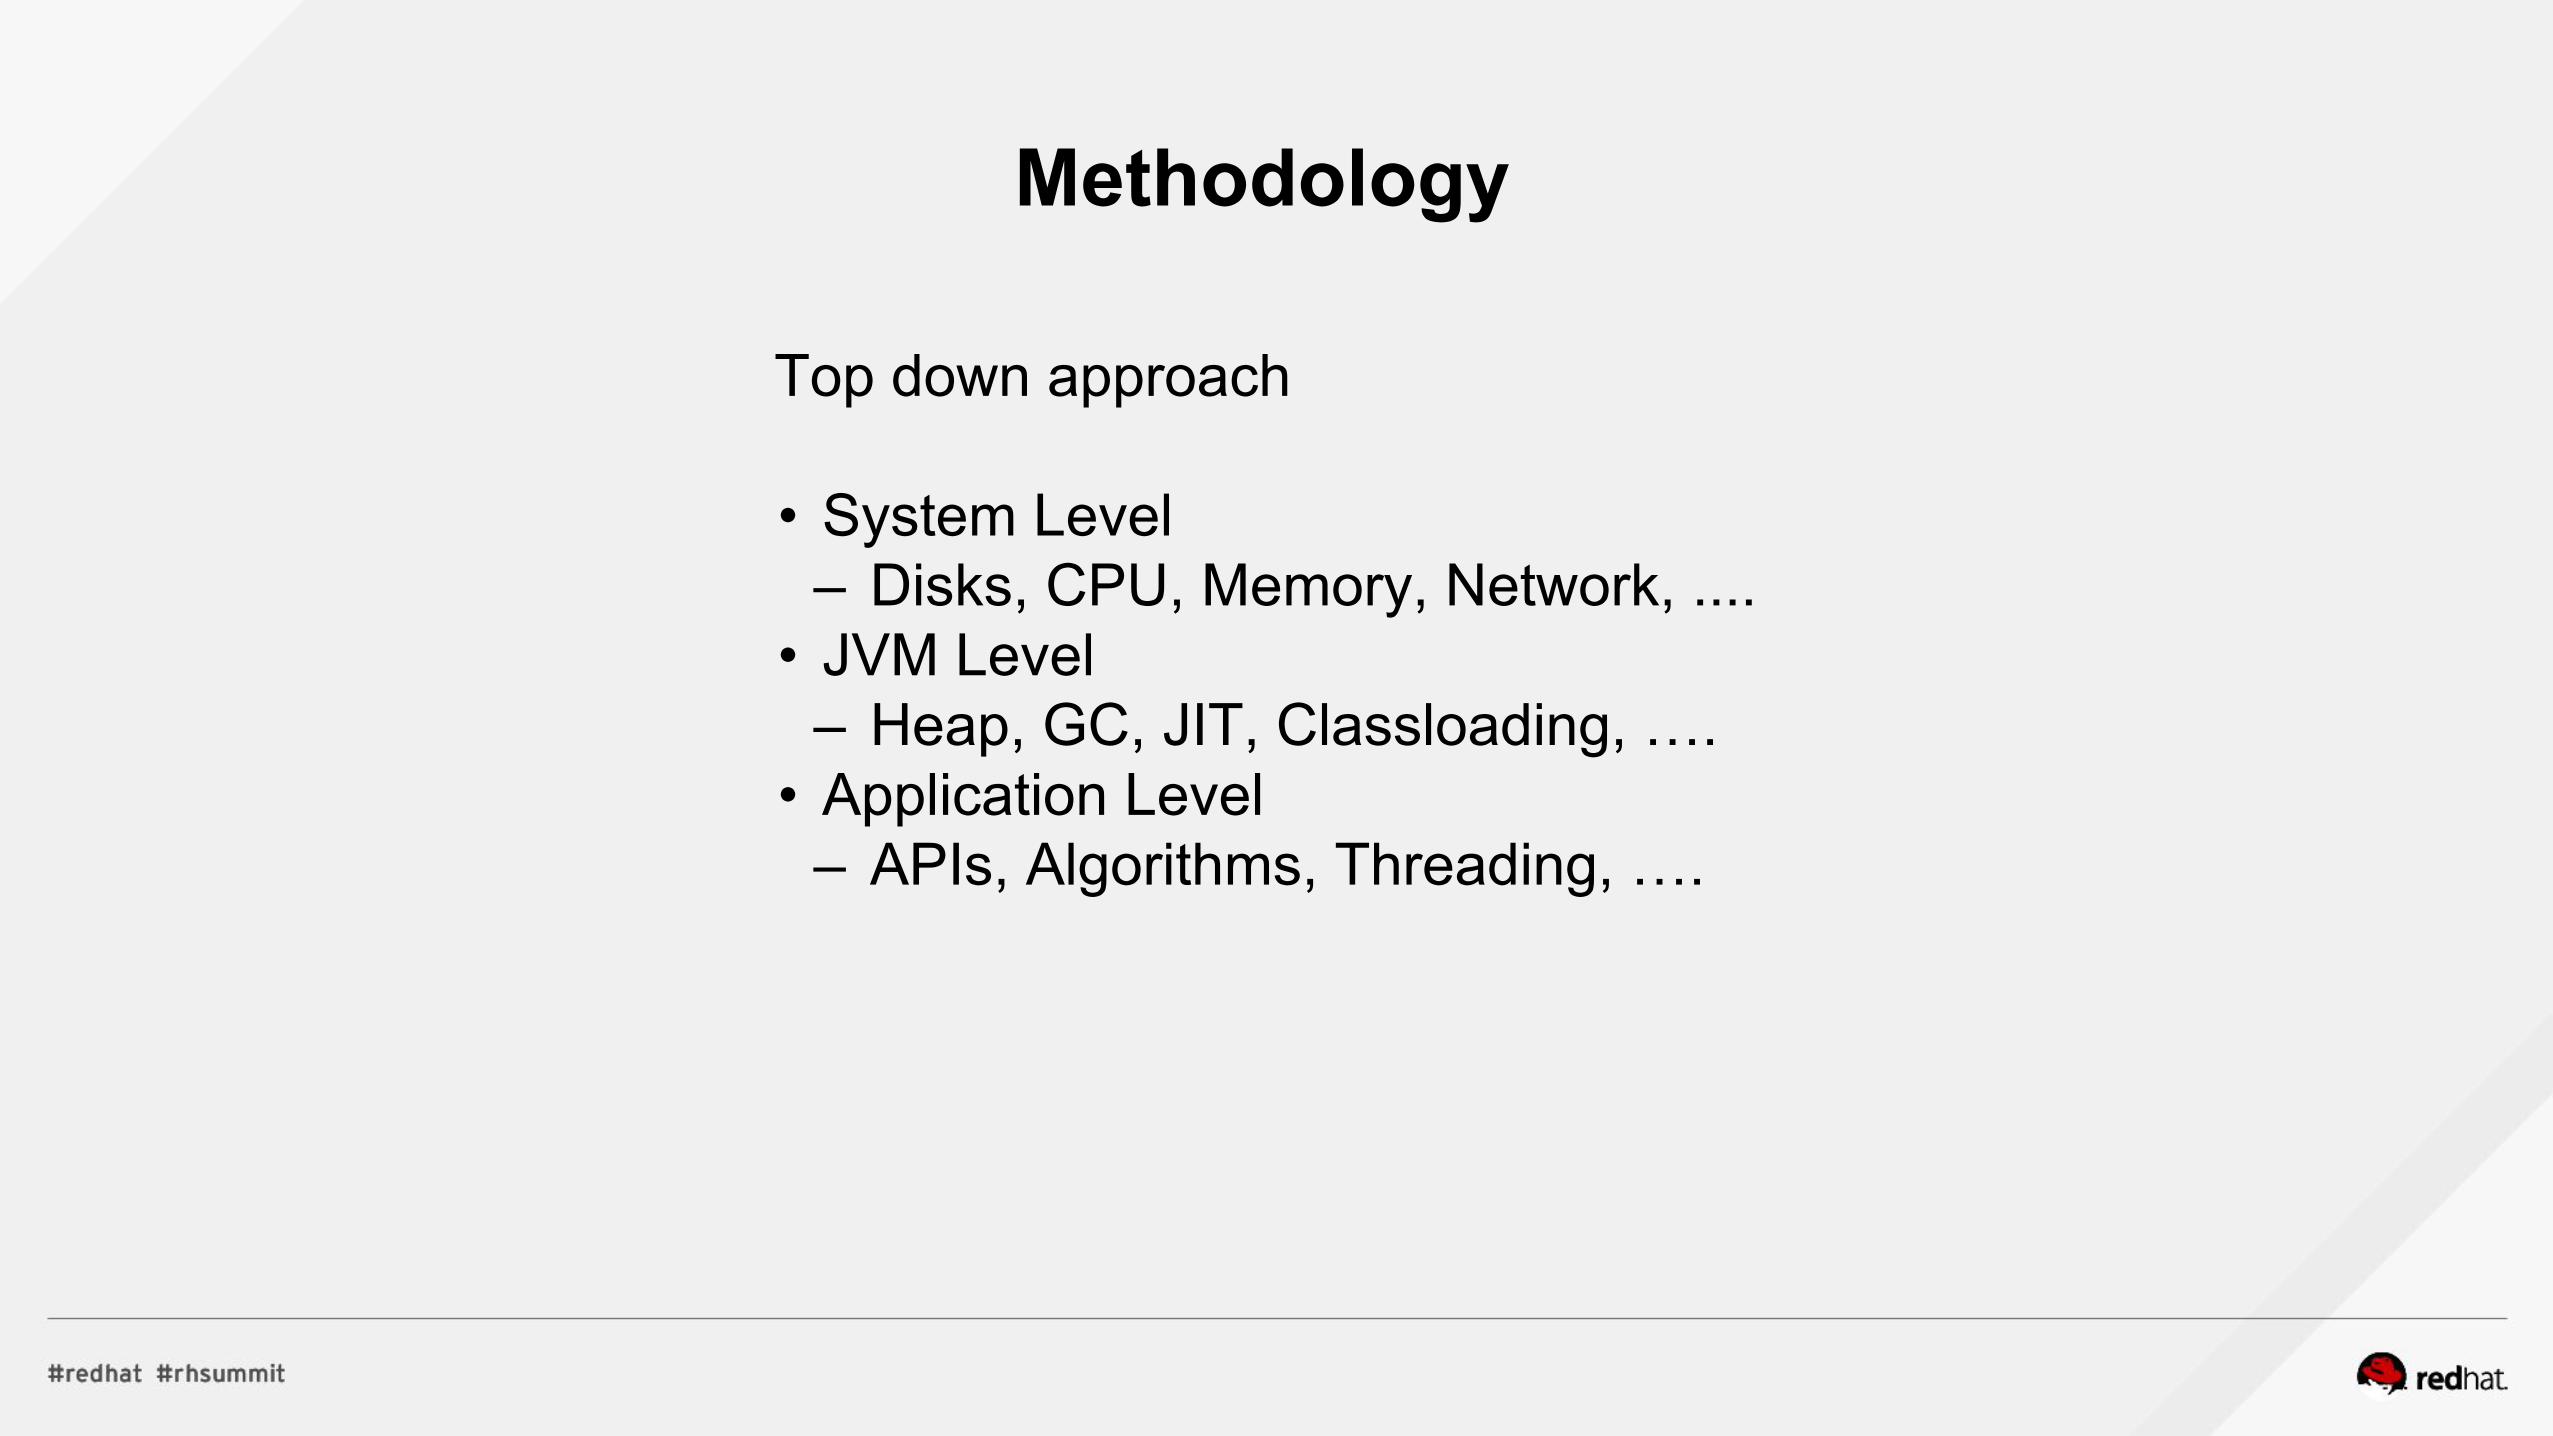
Top down approach
• System Level– Disks, CPU, Memory, Network, ....

Methodology
Top down approach
• System Level– Disks, CPU, Memory, Network, ....
• JVM Level– Heap, GC, JIT, Classloading, ….
Methodology
Top down approach
• System Level– Disks, CPU, Memory, Network, ....
• JVM Level– Heap, GC, JIT, Classloading, ….
• Application Level– APIs, Algorithms, Threading, ….

Tools

Tools
Tool types
• Observability, safe, depending on overhead• Benchmarking, load testing. Difficult to do in a production environment• Tuning, changes could hurt performance, perhaps not now or at the current load, but
later

top
System summary, list processes or threads
• Can miss processes that do not last long enough to be caught• Will most often consume a fair bit of CPU• Default summary CPU usage, use “1” to get a better view of cores

dmesg
Print kernel ring buffer
• Display system messages• An error tool that can give info why an application is slow/dies• Eg: OOM issues, filehandles, TCP errors, ++

free
Memory usage
• Give a quick overview over memory usage• Virtual page, and block devices I/O cache
vmstat
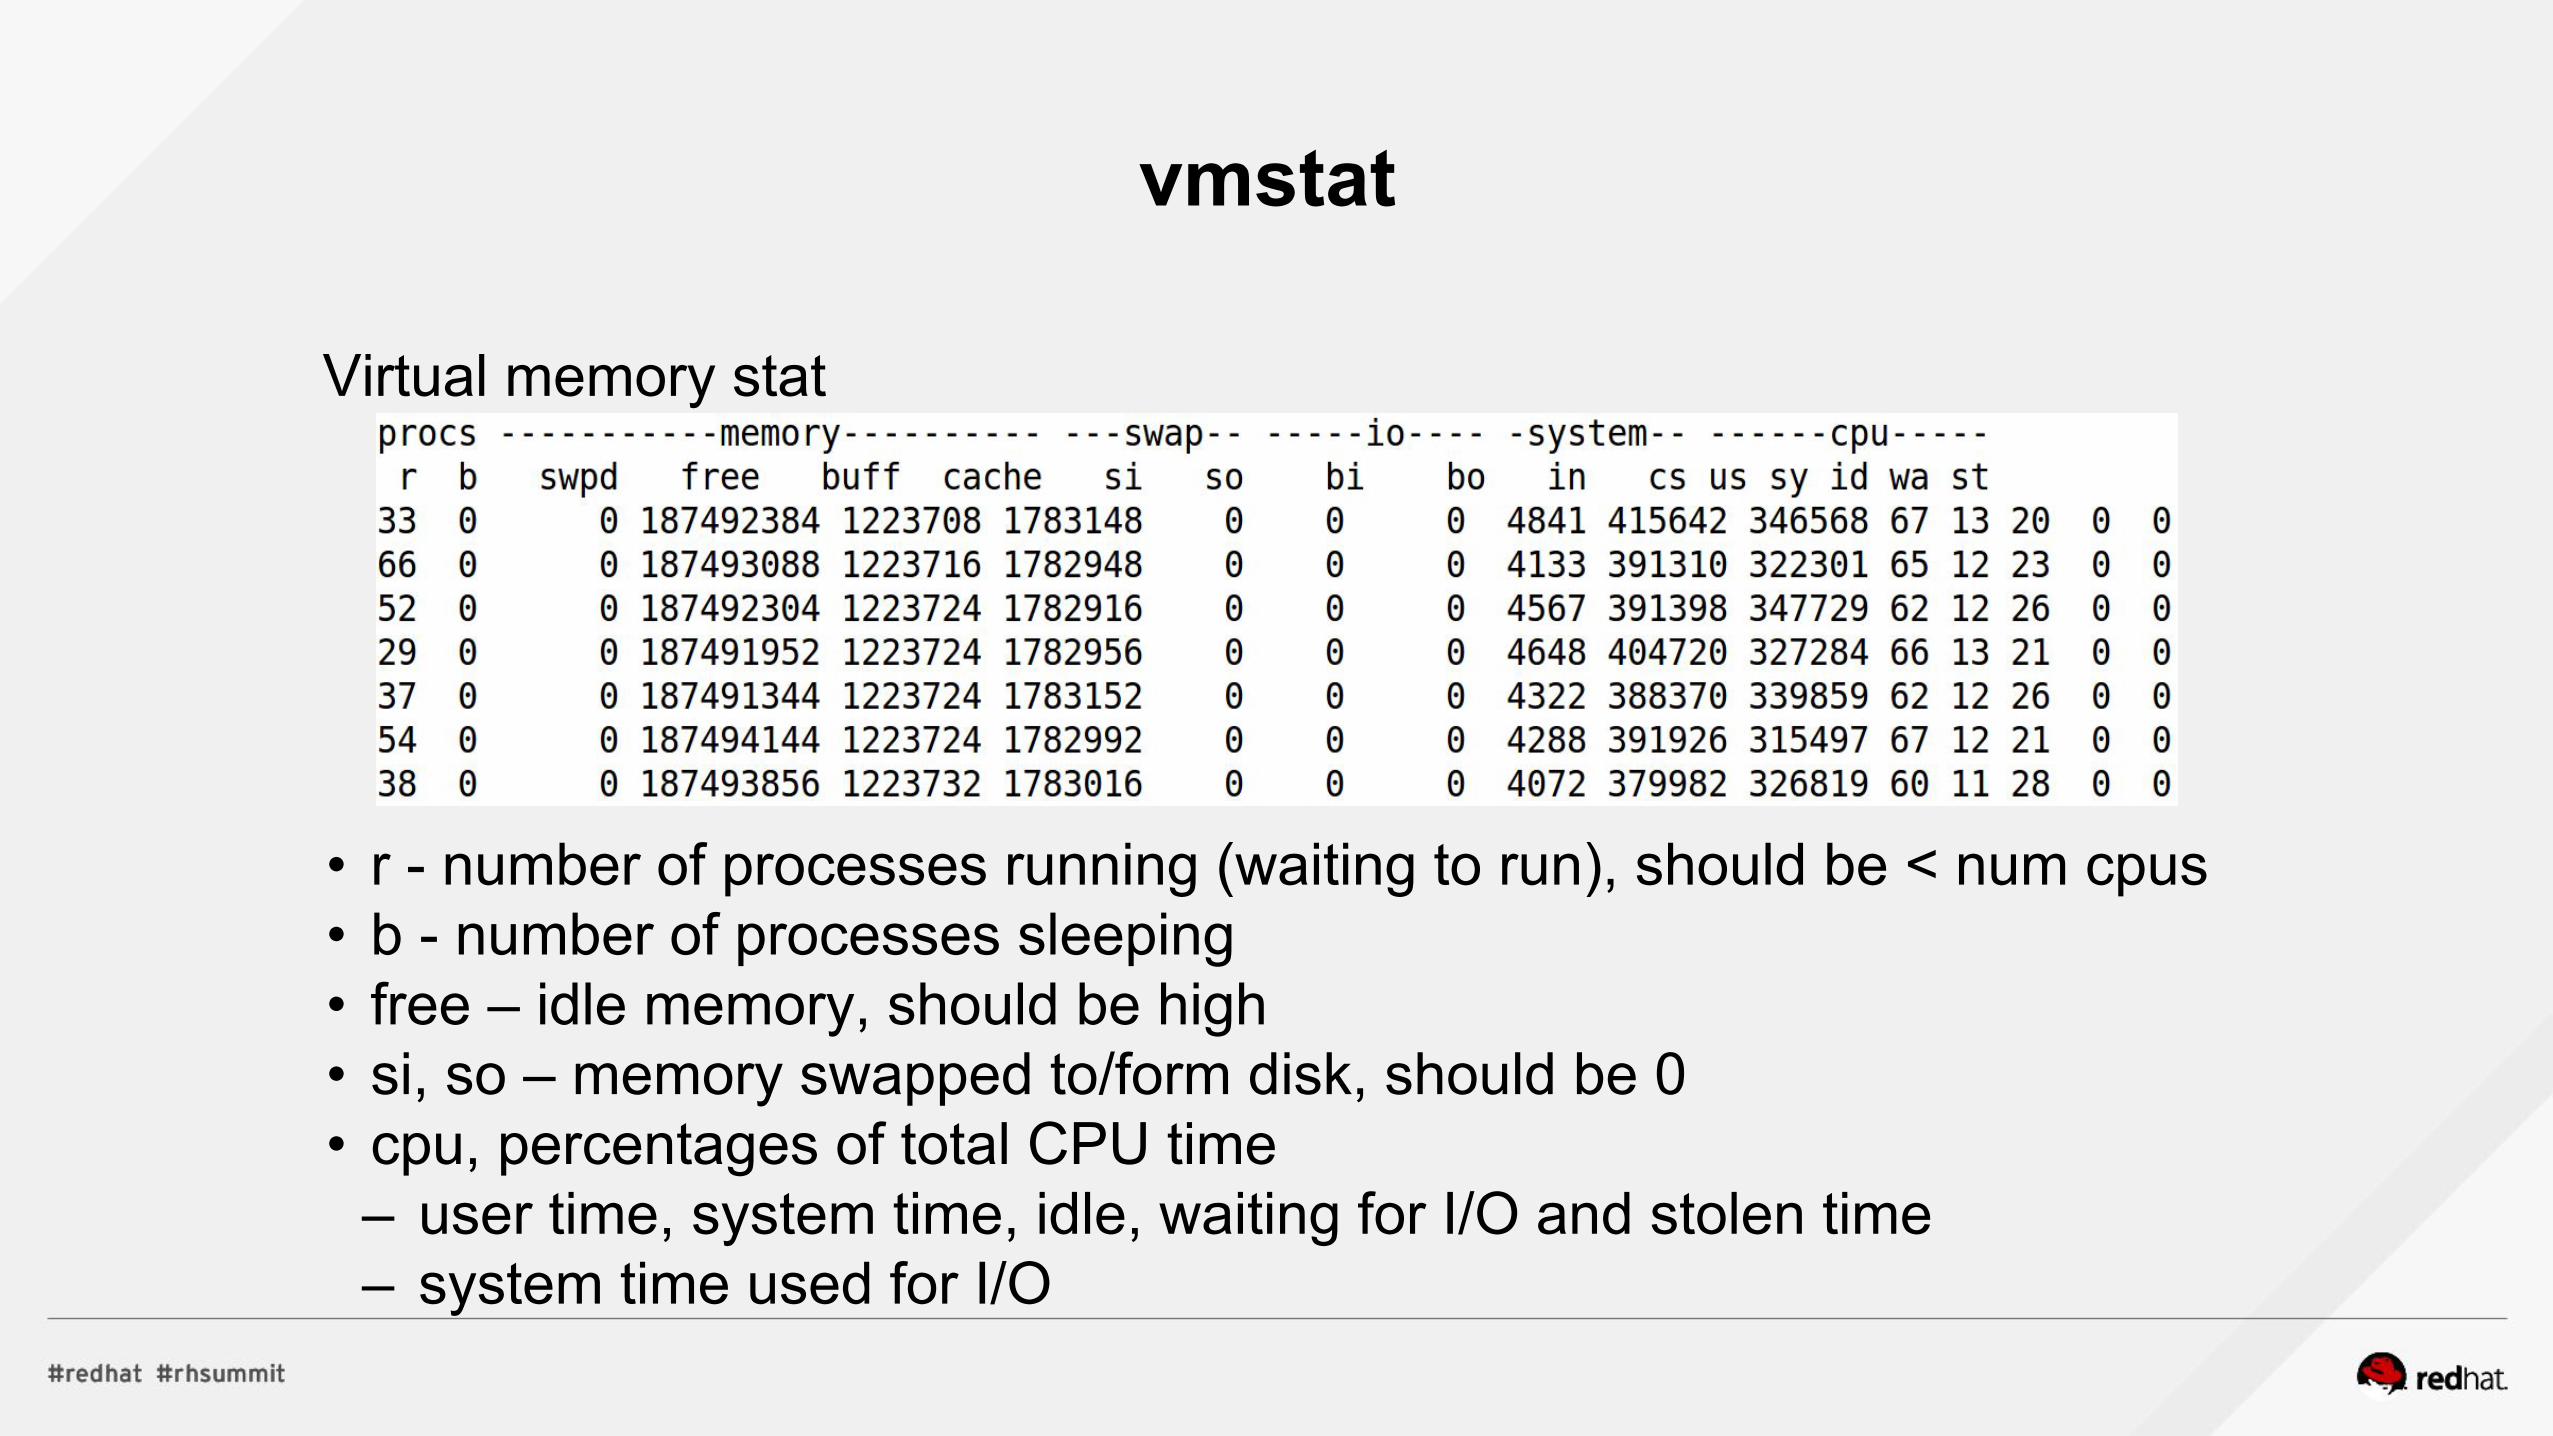
Virtual memory stat
• r - number of processes running (waiting to run), should be < num cpus• b - number of processes sleeping• free – idle memory, should be high• si, so – memory swapped to/form disk, should be 0• cpu, percentages of total CPU time
– user time, system time, idle, waiting for I/O and stolen time– system time used for I/O

mpstat
Processors statistics
• Gives a good overview of CPU time• Comparable to top (with 1 pressed to show all CPU's), but use less CPU

sar
System activity information
• Check network throughput• rxpck/s, txpck/s – total number of packets received/transmitted per second• %ifutil – utilization percentage of the network interface• Use EDEV for statistics on failures the network devices are reporting
sar
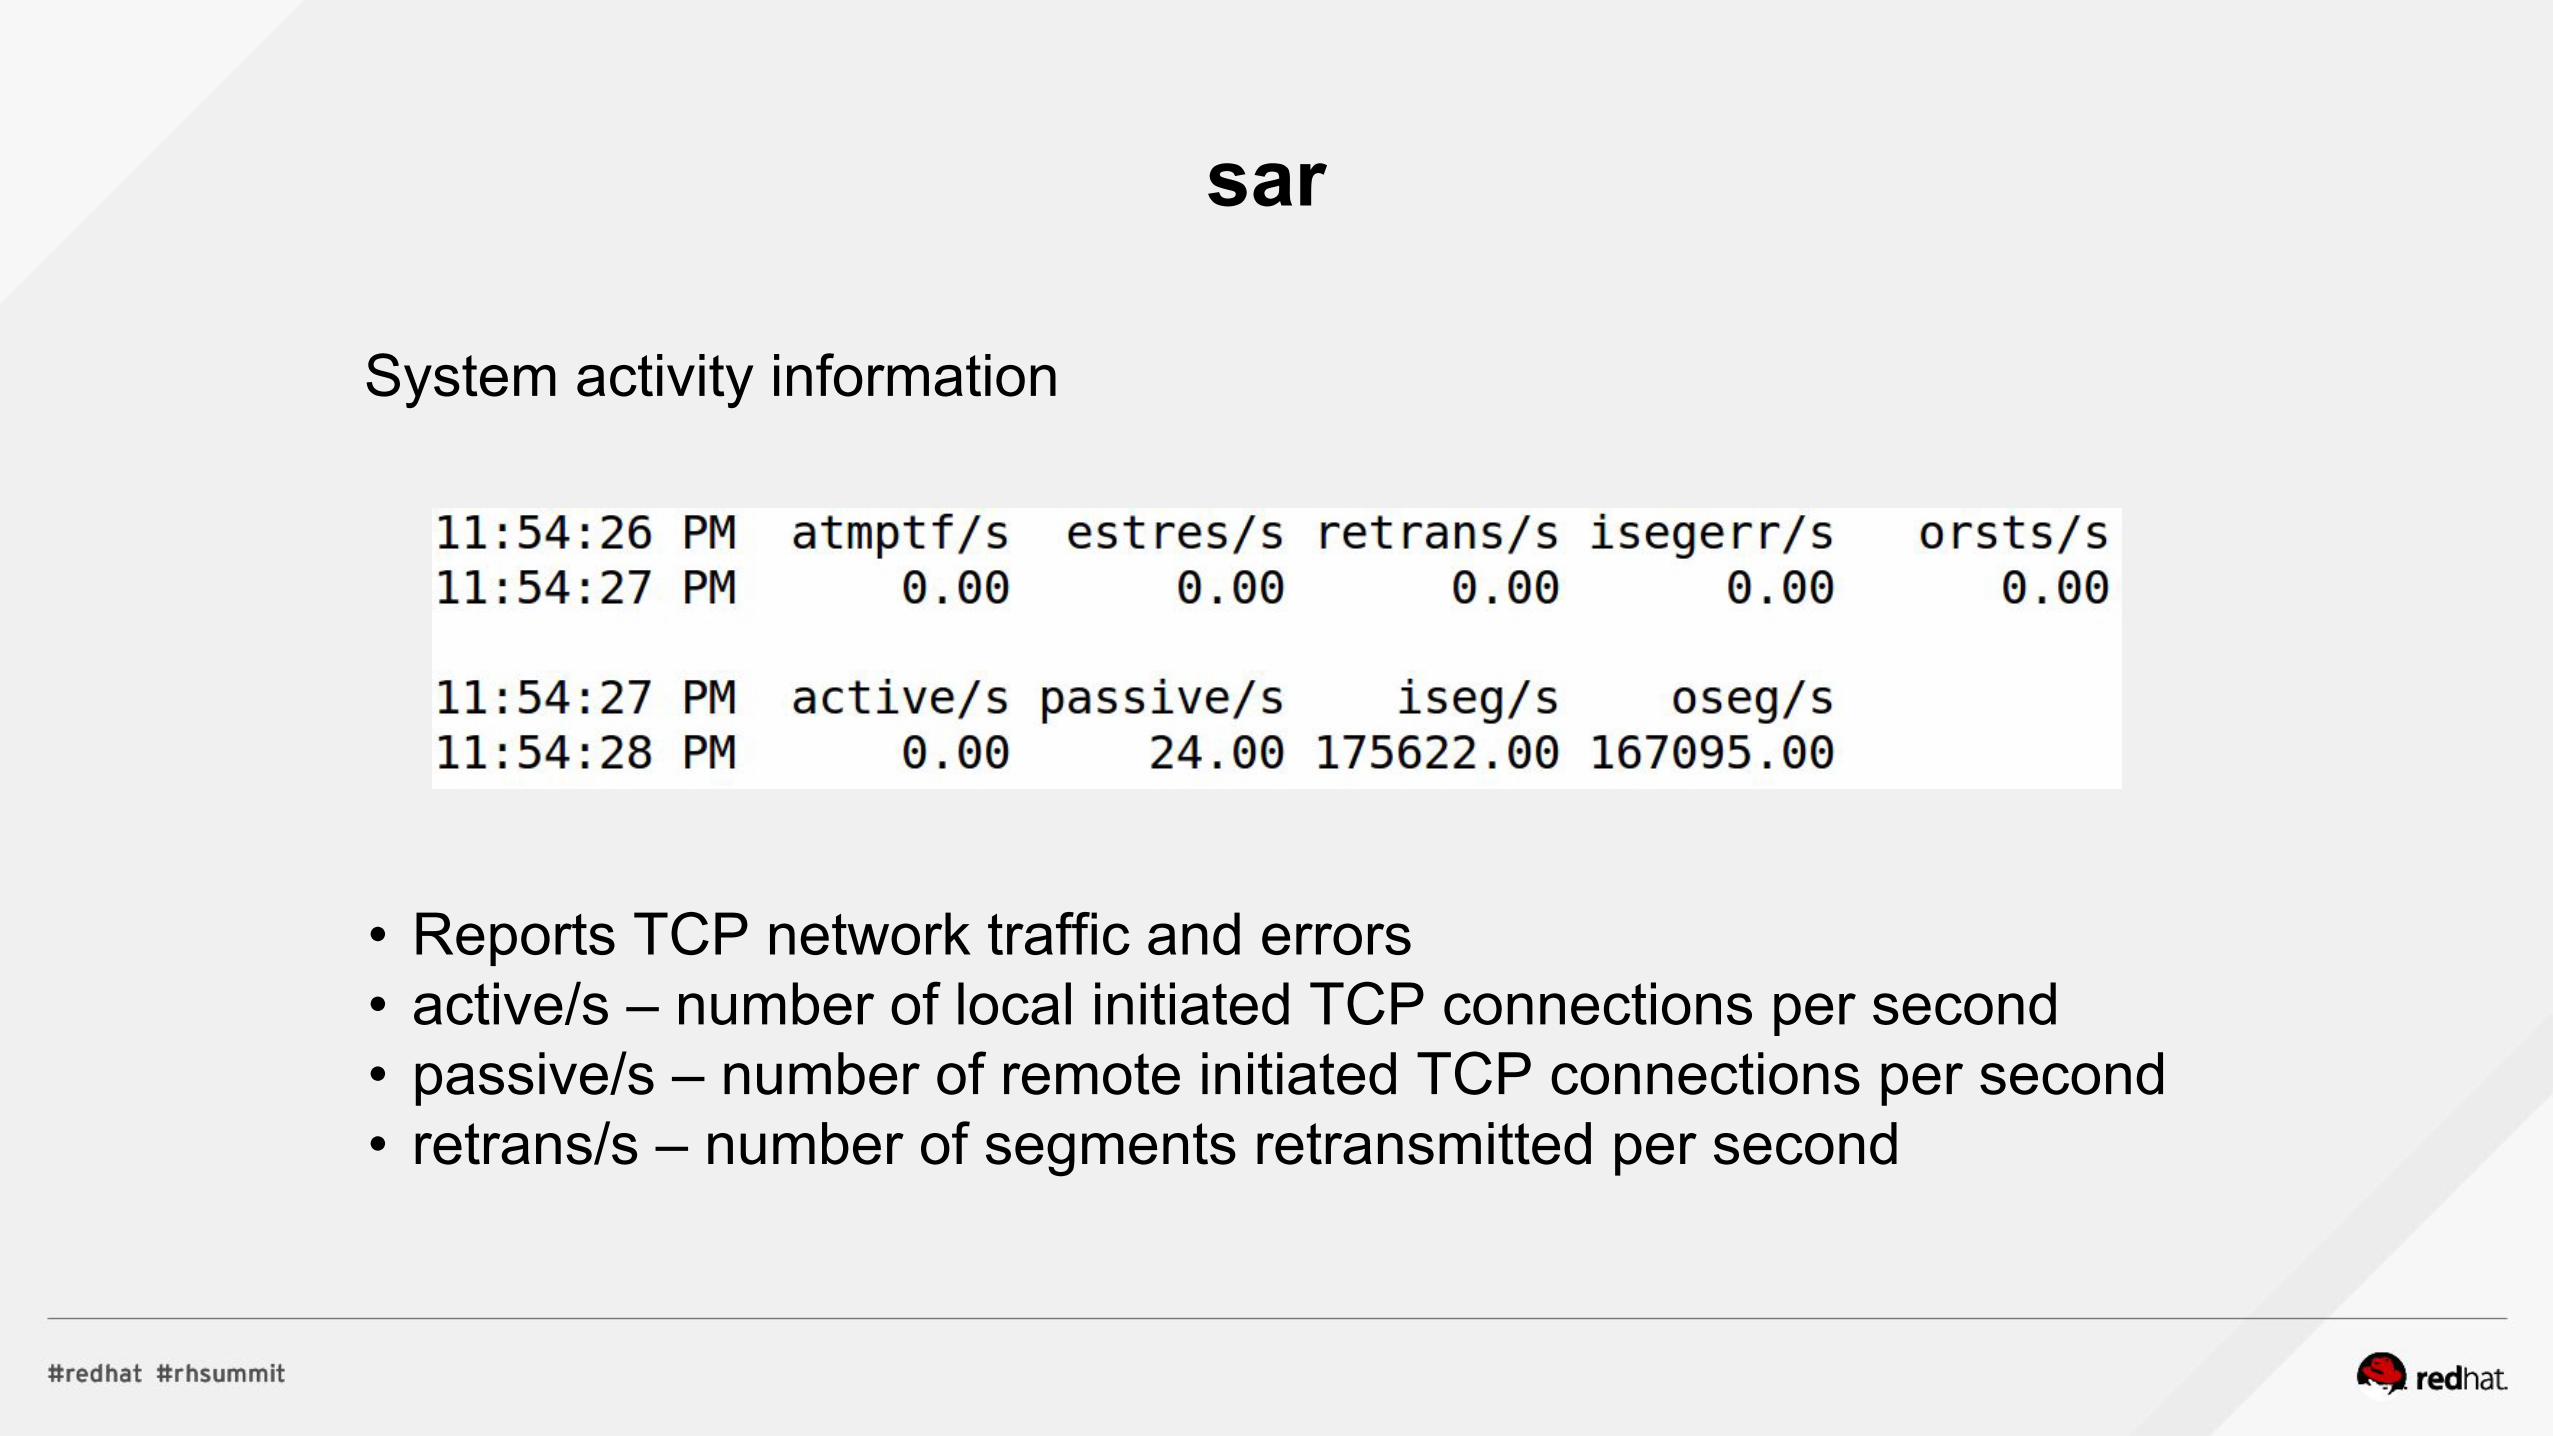
System activity information
• Reports TCP network traffic and errors• active/s – number of local initiated TCP connections per second• passive/s – number of remote initiated TCP connections per second• retrans/s – number of segments retransmitted per second

iostat
Monitor system I/O devices

Java Tools
Observing Java applications

Java Tools
Observing Java applications
• Not as many tools out of the box

Java Tools
Observing Java applications
• Not as many tools out of the box– but they are powerful
• jstack, jstat, jcmd, jps, jmap, jconsole, jvisualvm

jstack
Prints Java thread stack traces for a Java process
• Useful to quickly look at the current state of the threads

jmap
Prints Java shared object memory maps or heap memory
• Several different options– histo[:live] – Prints a histogram of the heap, list classes, number of objects, size– heap – Prints information regarding heap status and usage– dump:<dump-options> – Dump java heap– No options will print shared object mappings

jstat
Monitor JVM statistics; gc, compilations, classes
• Many useful options: class, compiler, gc, gccapacity, gccause, gcnew, gcold, gcutil, ... – class – number of classes loaded/unloaded, Kbytes loaded/unloaded– compiler - number of compiled, failed, invalid compilations, with failedtype/method– gcutil – garbage collection statistics; survivor space 0,1, eden, old space,
permanent, young generation, gc collection time, …

Byteman
A tool that simplifies Java tracing, monitoring and testing• http://byteman.jboss.org/
RULE ServerLogger_serverStoppedCLASS org.jboss.as.server.ApplicationServerServiceMETHOD stopAT ENTRYIF TRUEDOopenTrace("stop","/tmp/stop.log");traceStack("stop: "+Thread.currentThread.getName()+"\n","stop");ENDRULE

Java Tools
What have we learned• Java have decent monitoring tools out of the box• Not as easy to use, but powerful• Gives a lot of information as a (fairly) low cost
• Also included– VisualVM– JConsole

Tools
Final thought
• Which tool you use/prefer is not important

Tools
Final thought
• Which tool you use/prefer is not important– What is important is that you can measure everything

Profilers
Profilers
High CPU load
Can profilers help?
Profilers (try) to show “where” application time is spent

Different CPU Profilers
• Instrumenting– Adds timing code to application
• Sampling– Collect thread dumps periodically– VisualVM, JProfiler, Yourkit, ….
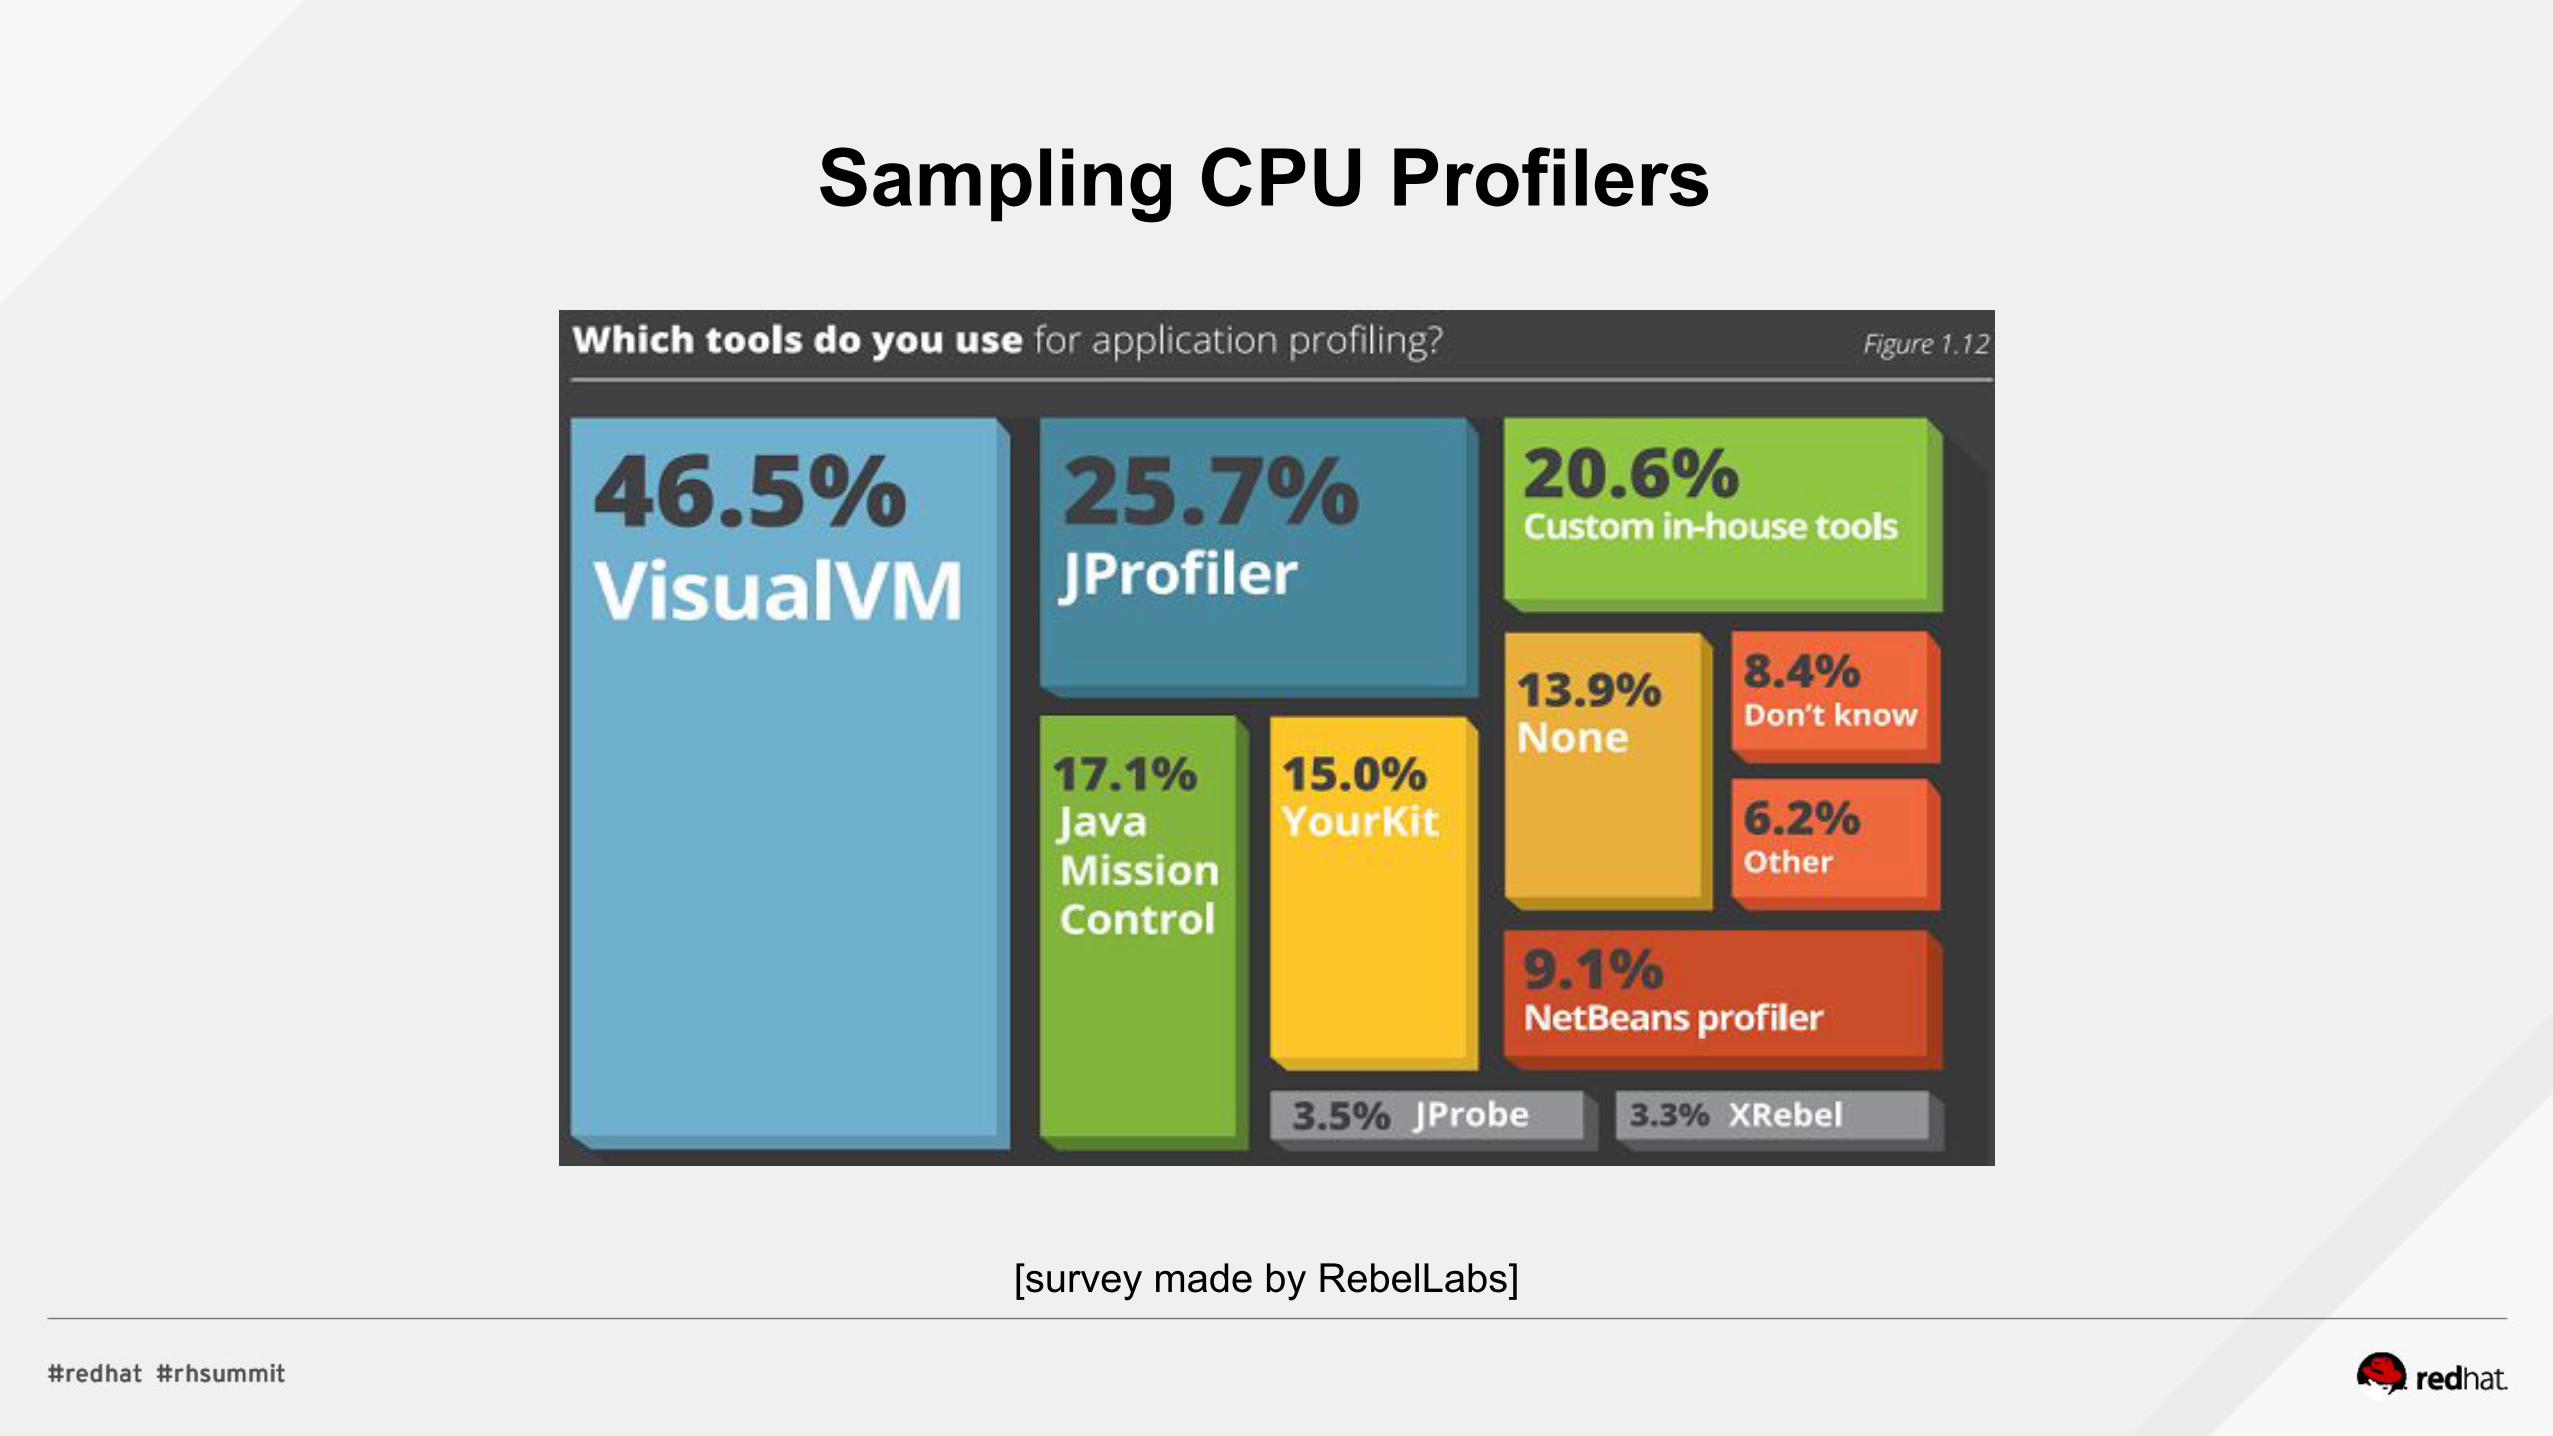
Sampling CPU Profilers
[survey made by RebelLabs]

Sampling Profilers
Samples
MainThread.run()
Backend.findUser()
Controller.doAction()
new User() fetchUser()
display()
someLogic() moreLogic()
evenMoreLogic()

Sampling Profilers
More samples
MainThread.run()
Backend.findUser()
Controller.doAction()
new User() fetchUser()
display()
someLogic() moreLogic()
evenMoreLogic()

Sampling Profilers
How do they work?
• Most profilers use JVMTI
– Using GetCallTrace
• Triggers a global safepoint
• Collect stack trace
• Large impact on application
• Samples only at safepoints

What is a safepoint?
A safepoint is a range of execution where the state of the thread is well described.
Java threads poll a global flag
– At method exit/enter– At “uncounted” (int) loops

What is a safepoint?
A safepoint can be delayed by
– Large Methods– Long running “uncounted” (int) loops

Sampling Profilers
Safepoint bias
MainThread.run()
Backend.findUser()
Controller.doAction()
new User() fetchUser()
display()
someLogic() moreLogic()
evenMoreLogic()

Safepoint summary
JVM have many safepoint operations
• To monitor its impact use– -XX:+PrintGCApplicationStoppedTime– -XX:+PrintSafepointStatistics– -XX:+PrintSafepointStatisticsCount=X

Sample Profilers
Java profilers that work better!
• Profilers that use AsyncGetCallTrace
– Java Mission Control• Very good tool, just don’t use it in production (without a license)
– Oracle Solaris Studio• Not well known, it’s free and it works on Linux
– Honest Profiler• Open source, cruder, but works very well

Java Mission Control/Flight Recorder
• Designed for usage in production systems• Potentially low overhead
– Be wary of what you record• Capture everything is not a good strategy• Capture data for one specific thing (memory, contention, cpu)
• Capturing data will not be skewed by safepoints– Make sure to use:
• -XX:+UnlockDiagnosticVMOptions -XX:+DebugNonSafepoints• Need a license to be used in production, free to use for development

Honest-Profiler
• Open source!!• https://github.com/RichardWarburton/honest-profiler• Works on OpenJDK• Will by default enable
– -XX:+UnlockDiagnosticVMOptions -XX:+DebugNonSafepoints
Java Profilers problem
• Java stack only
• Method tracing have large observer effect
• Do not report:
– GC
– Deopt
– Eg System.arrayCopy ….

Perf
• A system profiler• Show the whole stack
– JVM– GC– Kernel
• Previously not very useful for Java– Missing stacks– Method symbols missing
Perf
• Solution– Java8u60 added the option -XX:PreserveFramePointer
• Allows system profilers to capture stack traces
• Visibility of everything– Java methods– JVM, GC, libraries, kernel
• Low overhead• Flamegraph

System C++Java


Flamegraph
Top edge show which method is using CPU and how much.
MainThread.run()
a()
b()
e()
c()
d()


Limitations of Perf Mixed Mode
• Frames might be missing (inlined)
• Disable inlining:
– -XX:-Inline
– Many more Java frames
– Will be slower
• perf-map-agent have experimental un-inline support

Profiling at Red Hat
• Perf for CPU profiling
• Java Mission Control
– Contention
– Thread analysis
– Memory usage

Benchmarking

Benchmarking
Most benchmarks are flawed, wrong and full of errors.

Benchmarking
Most benchmarks are flawed, wrong and full of errors– Used cautiously it can be a very valuable tool to reveal performance issues,
compare applications, libraries, ...
Benchmarking
• Java Benchmarking libraries– Microbenchmarks
• Java Microbenchmark Harness– http://openjdk.java.net/projects/code-tools/jmh/
• JMH is the only library on Java we recommend for microbenchmarks• Still possible to write bad benchmarks with JMH
Benchmarking
Load testing frameworks– Gatling
• http://gatling.io/
– Faban• http://faban.org/

Benchmarking
A Hibernate microbenchmark lesson
• We wanted to compare cache lookup performance between Hibernate 4 and 5– We also wanted to test a new cache we added to Infinispan, Simple cache
• Created several JMH benchmarks that tested different use cases– Default cache with and without eviction– Simple cache with and without eviction

Benchmarking
A Hibernate microbenchmark lesson
4.3 w/ eviction 292050 ops/s
4.3 w/o eviction 303992 ops/s
5.0 w/ eviction 314629 ops/s
5.0 w/o eviction 611487 ops/s
5.0 w/o eviction (simple cache) 706509 ops/s

Benchmarking
We progressed to a large full scale EE benchmark.
• We expect similar or better results vs EAP6 (Hibernate 4.2)

Benchmarking
We progressed to a large full scale EE benchmark.
• We expect similar or better results vs EAP6 (Hibernate 4.2)– The response times are 5-10x slower!– And we are now CPU bound

Benchmarking
We progressed to a large full scale EE benchmark.
• We expect similar or better results vs EAP6 (Hibernate 4.2)– The response times are 5-10x slower!– And we are now CPU bound
• How is that possible?

Benchmarking
We progressed to a large full scale EE benchmark.
• We expect similar or better results vs EAP 6 (Hibernate 4.2)– The response times are 5-10x slower!– And we are now CPU bound
• How is that possible?– We had several microbenchmarks showing better performance on Hibernate 5– Could the problem lie in WildFly 10?– Let’s profile!

Benchmarking

Benchmarking

Benchmarking
What had happened?
• Why did we spend so much CPU in this method and why do it not reflect the results from the microbenchmarks?

Benchmarking
What had happened?
• Why did we spend so much CPU in this method and why do it not reflect the results from the microbenchmarks?– We started debugging
• -XX+PrintCompilation– Show when/which methods are compiled/decompiled– Showed that the method only was compiled once, but twice on EAP 6 (Hib4.2)– Why?

Benchmarking
What had happened?
• We had made several changes internally in Hibernate 5 to reduce memory usage

Benchmarking
What had happened?
• We had made several changes internally in Hibernate 5 to reduce memory usage– One specific class was refactored to an interface– Changing a monomorphic call site to a bimorphic call site
• Which can prevent compiling/inlining of methods!

Benchmarking
What had happened?
• We had made several changes internally in Hibernate 5 to reduce memory usage– One specific class was refactored to an interface– Changing a monomorphic call site to a bimorphic call site
• Which can prevent compiling/inlining of methods!
• Direct method calls will “always” be optimized (no subclassing)• In Java subclassing/inheritance might cause the JVM to no optimize method calls

Benchmarking
Lessons learned
• Code changes might have unexpected consequences– In this case, reduced memory, increased CPU usage
• Benchmarks are good, but should always be questioned– When you benchmark, analyze (all/most) possible use cases

Benchmarking
Lessons learned
• Code changes might have unexpected consequences– In this case, reduced memory, increased CPU usage
• Benchmarks are good, but should always be questioned– When you benchmark, analyze (all/most) possible use cases
• Yes, we ended up fixing the CPU usage without causing it to use more memory!

EAP 7 Performance Improvements
Performance highlights
• JPA• JCA• Web

EAP 7 Performance Improvements
Hibernate 5 performance improvements
• Memory usage– Reduced memory usage 20-50%
• Cache improvements– Simple Cache
• 132% Improvement with immutable objects
• Pooled Optimizer– In persistence.xml add property
• hibernate.id.optimizer.pooled.preferred value="pooled-lotl”

EAP 7 Performance Improvements
Hibernate 5 performance improvements
• Bytecode enhancements– hibernate.enhancer.enableDirtyTracking– hibernate.enhancer.enableLazyInitialization
• Improved caching– hibernate.cache.use_reference_entries– hibernate.cache.infinispan.immutable-entity.cfg = “immutable-entity”

EAP 7 Performance Improvements
IronJacamar performance improvements
• Contention issues– New default ManagedConnectionPool
• Disabled logging– Not everything is disabled
• <datasource …. enlistment-trace="false" >• Fairness
– Set to true at default• <datasource> <pool><fair>false</fair></pool>

EAP 7 Performance Improvements
Undertow vs JBossWeb
• Undertow is nonblocking• JBossWeb have a thread for each connection

EAP 7 Performance Improvements
Simple HelloServlet Benchmark
EAP 6.4 EAP 7RPS Mean 95% 99% Mean 95% 99%5000 2 1 4 0 1 1
15000 3 4 56 1 2 625000 13 18 247 1 3 740000 46 246 414 12 23 8455000 361 647 1889 65 136 635

EAP 7 Performance Improvements
• Lightweight• Embeddable• Scalable• HTTP/2• HTTP Upgrade

EAP 7 Performance Improvements
Overall EAP 7 Performance tricks
• Remote byte pooling– jboss.remoting.pooled-buffers
• Disable CDI– CDI is enabled by default in EAP 7

EAP 7 Performance Improvements
Going from EAP 6 to EAP 7
• Overall 20-25% improvement• Scales better• Uses/allocates less memory

Q&A
