from the selectedworks of omar h. abdalla
TRANSCRIPT
Helwan University
From the SelectedWorks of Omar H. Abdalla
2018
Security & Reliability Criteria for Power SystemPlanningOmar H. Abdalla
Available at: https://works.bepress.com/omar/55/
1/6/2019
1
Security & Reliability
Criteria for Power System
PlanningProf. Omar Hanafy Abdalla
Fellow of the Egyptian Society of Engineers
Helwan University
1
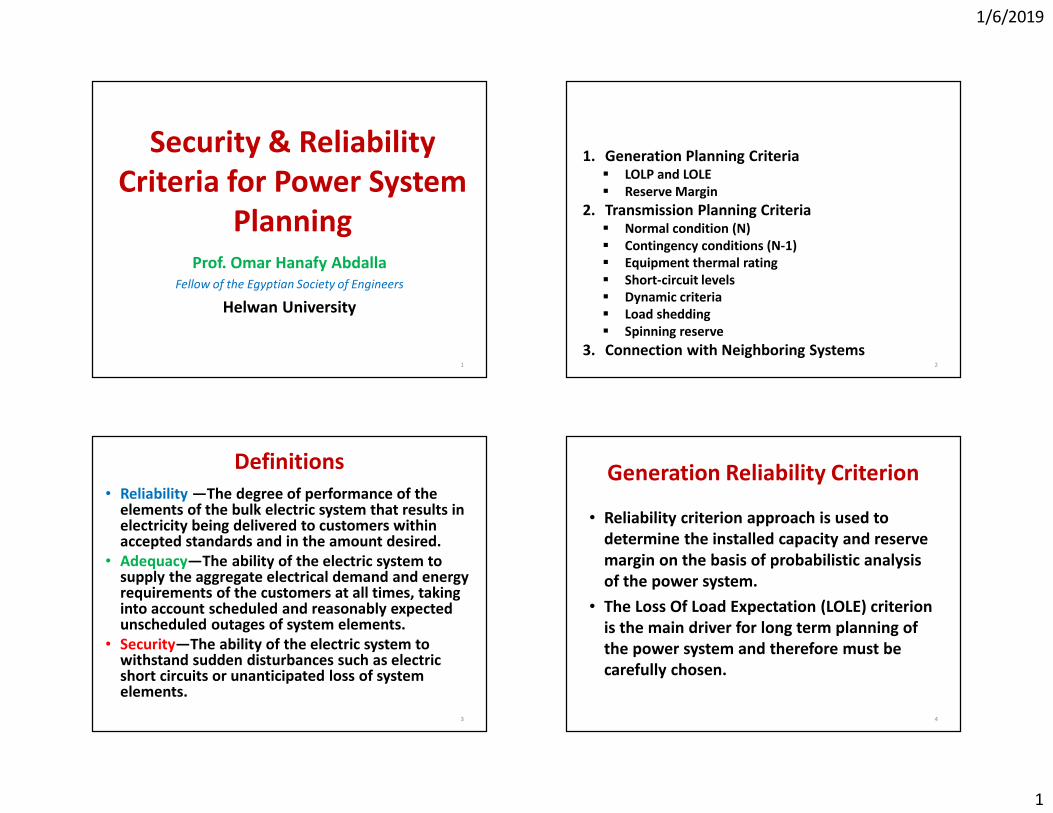
1. Generation Planning Criteria LOLP and LOLE
Reserve Margin
2. Transmission Planning Criteria Normal condition (N)
Contingency conditions (N-1)
Equipment thermal rating
Short-circuit levels
Dynamic criteria
Load shedding
Spinning reserve
3. Connection with Neighboring Systems2
Definitions
• Reliability —The degree of performance of the elements of the bulk electric system that results in electricity being delivered to customers within accepted standards and in the amount desired.
• Adequacy—The ability of the electric system to supply the aggregate electrical demand and energy requirements of the customers at all times, taking into account scheduled and reasonably expected unscheduled outages of system elements.
• Security—The ability of the electric system to withstand sudden disturbances such as electric short circuits or unanticipated loss of system elements.
3
Generation Reliability Criterion
• Reliability criterion approach is used to
determine the installed capacity and reserve
margin on the basis of probabilistic analysis
of the power system.
• The Loss Of Load Expectation (LOLE) criterion
is the main driver for long term planning of
the power system and therefore must be
carefully chosen.
4
1/6/2019
2
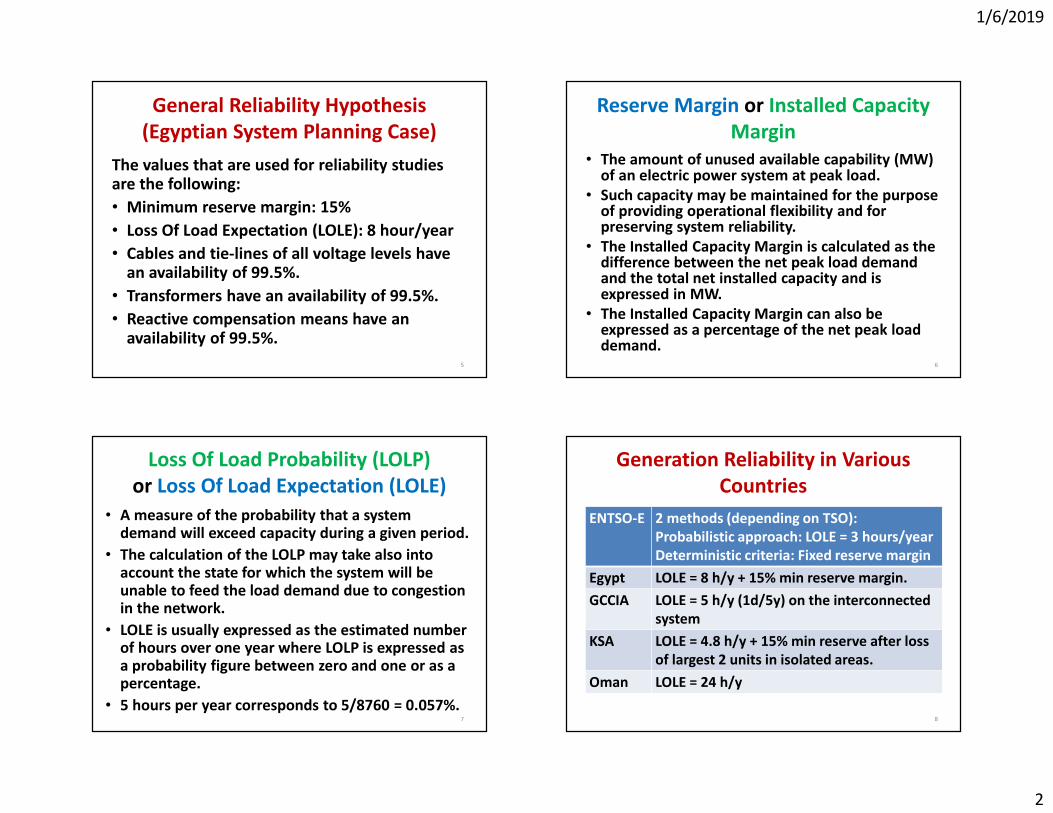
General Reliability Hypothesis
(Egyptian System Planning Case)
The values that are used for reliability studies are the following:
• Minimum reserve margin: 15%
• Loss Of Load Expectation (LOLE): 8 hour/year
• Cables and tie-lines of all voltage levels have an availability of 99.5%.
• Transformers have an availability of 99.5%.
• Reactive compensation means have an availability of 99.5%.
5
Reserve Margin or Installed Capacity
Margin
• The amount of unused available capability (MW) of an electric power system at peak load.
• Such capacity may be maintained for the purpose of providing operational flexibility and for preserving system reliability.
• The Installed Capacity Margin is calculated as the difference between the net peak load demand and the total net installed capacity and is expressed in MW.
• The Installed Capacity Margin can also be expressed as a percentage of the net peak load demand.
6
Loss Of Load Probability (LOLP)
or Loss Of Load Expectation (LOLE)
• A measure of the probability that a system demand will exceed capacity during a given period.
• The calculation of the LOLP may take also into account the state for which the system will be unable to feed the load demand due to congestion in the network.
• LOLE is usually expressed as the estimated number of hours over one year where LOLP is expressed as a probability figure between zero and one or as a percentage.
• 5 hours per year corresponds to 5/8760 = 0.057%.7
Generation Reliability in Various
Countries
8
ENTSO-E 2 methods (depending on TSO):
Probabilistic approach: LOLE = 3 hours/year
Deterministic criteria: Fixed reserve margin
Egypt LOLE = 8 h/y + 15% min reserve margin.
GCCIA LOLE = 5 h/y (1d/5y) on the interconnected
system
KSA LOLE = 4.8 h/y + 15% min reserve after loss
of largest 2 units in isolated areas.
Oman LOLE = 24 h/y

1/6/2019
3
Transmission Network Planning
Criteria
• To achieve the planning criteria objective it is essential that system simulations be performed in advance to identify the facilities necessary to assure a reliable transmission system in future years.
• Here, we describe the outage events which are used to determine if any thermal or voltage violations exist during peak and minimum demand conditions.
• The definitions of the normal and contingency conditions are discussed:
9
Normal Conditions
• The normal condition (base case) represents
the system with all elements in service.
• This is often referred to as N condition.
• The system must be able to supply all firm
demand and firm transfers to other areas.
• All equipment must:
– Operate within applicable ratings,
– Voltages must be within applicable limits, and
– The system must be stable.
10
Basic Assumptions Related to
N Criterion of Transmission Networks
• The rating limits of transmission lines should be intended as maximum permanent currents (or MVA).
• No overload of the transmission network is allowed.
• No generator will be above its continuous reactive capability.
• In normal operating condition, it is allowed to have long-term overload of transformers up to 10% of nominal current (or MVA).
11
Normal Operating Voltage Range
(±5%) - Egyptian System
Nominal Voltage
(kV)
Maximum
Limit (kV)
Minimum
Limit (kV)
500 525 475
400 420 380
220 231 209
132 138.6 125.4
66 69.3 62.7
12
1/6/2019
4
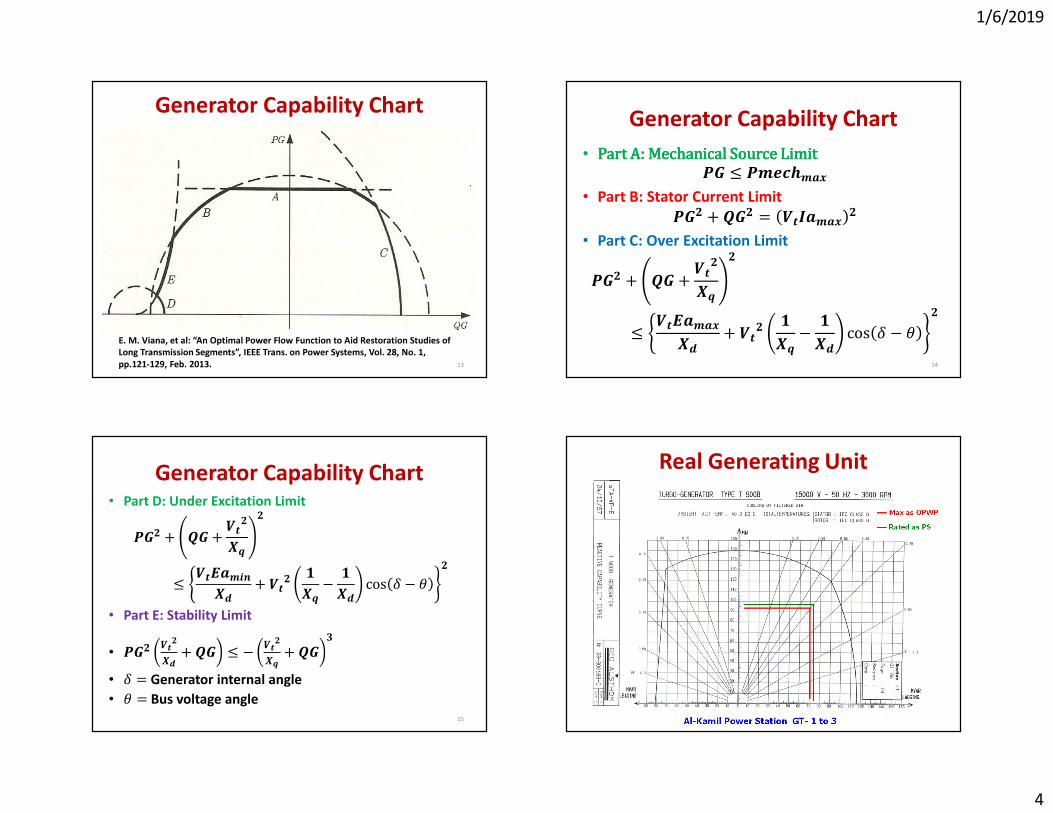
Generator Capability Chart
13
E. M. Viana, et al: “An Optimal Power Flow Function to Aid Restoration Studies of
Long Transmission Segments”, IEEE Trans. on Power Systems, Vol. 28, No. 1,
pp.121-129, Feb. 2013.
Generator Capability Chart
• Part A: Mechanical Source LimitPart A: Mechanical Source LimitPart A: Mechanical Source LimitPart A: Mechanical Source Limit
�� ≤ ��������
• Part B: Stator Current Limit
��� + ��� = !"#�����
• Part C: Over Excitation Limit
��� + �� +!"
�
$%
�
≤!"&����
$'
+ !"� (
$%
−(
$'
cos + − ,
�
14
Generator Capability Chart• Part D: Under Excitation Limit
��� + �� +!"
�
$%
�
≤!"&��-.
$'
+ !"� (
$%
−(
$'
cos + − ,
�
• Part E: Stability Limit
• ��� !"�
$'+ �� ≤ −
!"�
$%+ ��
/
• + = Generator internal angle
• , = Bus voltage angle
15
Real Generating Unit
16
1/6/2019
5
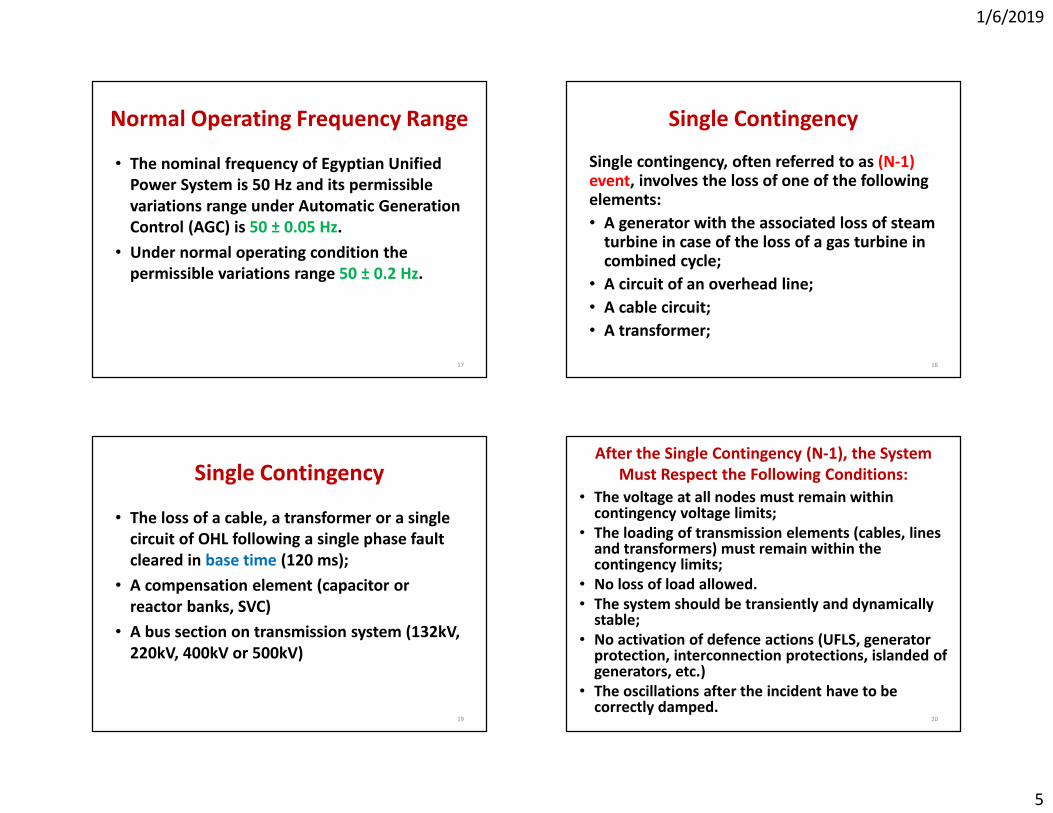
Normal Operating Frequency Range
• The nominal frequency of Egyptian Unified
Power System is 50 Hz and its permissible
variations range under Automatic Generation
Control (AGC) is 50 ± 0.05 Hz.
• Under normal operating condition the
permissible variations range 50 ± 0.2 Hz.
17
Single Contingency
Single contingency, often referred to as (N-1) event, involves the loss of one of the following elements:
• A generator with the associated loss of steam turbine in case of the loss of a gas turbine in combined cycle;
• A circuit of an overhead line;
• A cable circuit;
• A transformer;
18
Single Contingency
• The loss of a cable, a transformer or a single
circuit of OHL following a single phase fault
cleared in base time (120 ms);
• A compensation element (capacitor or
reactor banks, SVC)
• A bus section on transmission system (132kV,
220kV, 400kV or 500kV)
19
After the Single Contingency (N-1), the System
Must Respect the Following Conditions:
• The voltage at all nodes must remain within contingency voltage limits;
• The loading of transmission elements (cables, lines and transformers) must remain within the contingency limits;
• No loss of load allowed.
• The system should be transiently and dynamically stable;
• No activation of defence actions (UFLS, generator protection, interconnection protections, islanded of generators, etc.)
• The oscillations after the incident have to be correctly damped.
20
1/6/2019
6
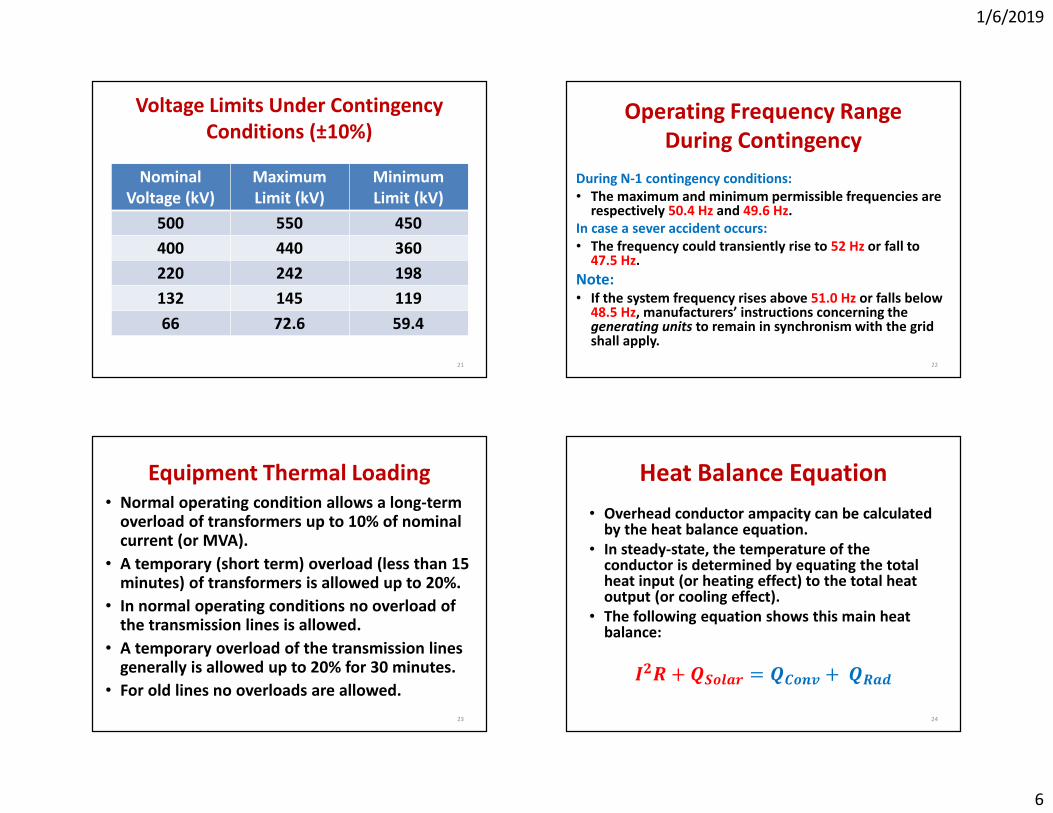
Voltage Limits Under Contingency
Conditions (±10%)
Nominal
Voltage (kV)
Maximum
Limit (kV)
Minimum
Limit (kV)
500 550 450
400 440 360
220 242 198
132 145 119
66 72.6 59.4
21
Operating Frequency Range
During Contingency
During N-1 contingency conditions:
• The maximum and minimum permissible frequencies are respectively 50.4 Hz and 49.6 Hz.
In case a sever accident occurs:
• The frequency could transiently rise to 52 Hz or fall to 47.5 Hz.
Note:• If the system frequency rises above 51.0 Hz or falls below
48.5 Hz, manufacturers’ instructions concerning the generating units to remain in synchronism with the grid shall apply.
22
Equipment Thermal Loading
• Normal operating condition allows a long-term overload of transformers up to 10% of nominal current (or MVA).
• A temporary (short term) overload (less than 15 minutes) of transformers is allowed up to 20%.
• In normal operating conditions no overload of the transmission lines is allowed.
• A temporary overload of the transmission lines generally is allowed up to 20% for 30 minutes.
• For old lines no overloads are allowed.
23
Heat Balance Equation
• Overhead conductor ampacity can be calculated by the heat balance equation.
• In steady-state, the temperature of the conductor is determined by equating the total heat input (or heating effect) to the total heat output (or cooling effect).
• The following equation shows this main heat balance:
#�0 + �123�4 = �52.6 + �0�'
24
1/6/2019
7
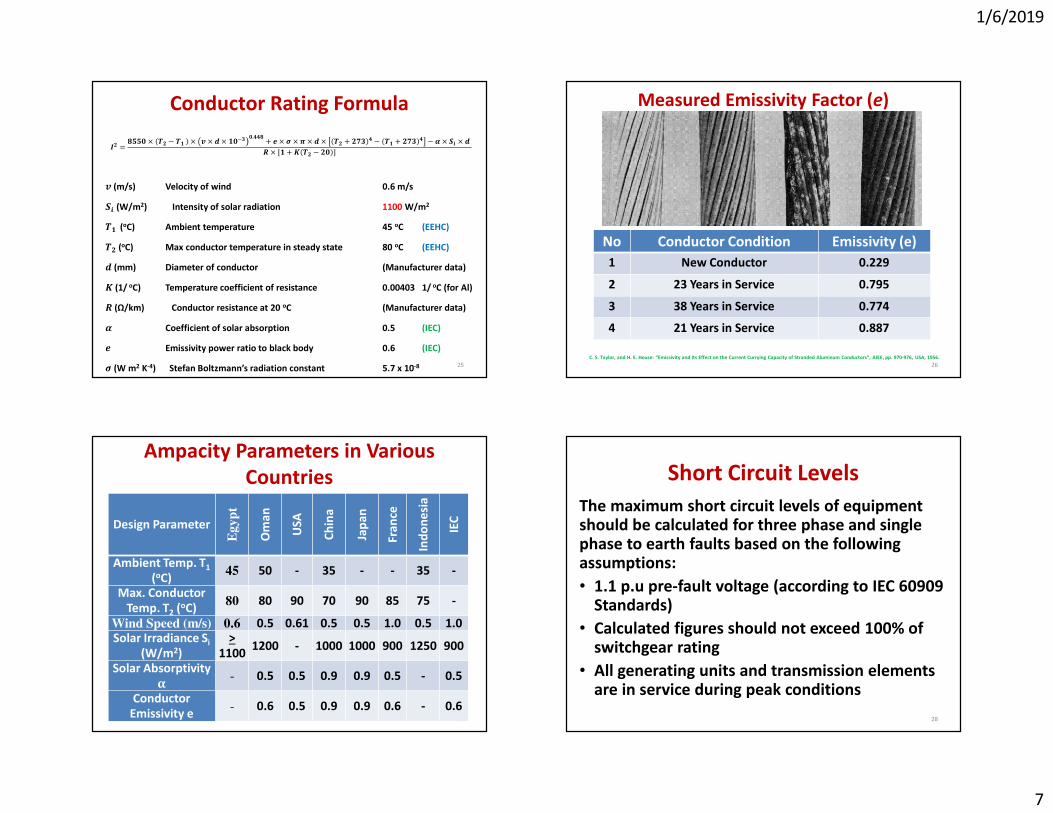
Conductor Rating Formula
#� =7889 × ;� − ;( × 6 × ' × (9</ 9.>>7
+ � × ? × @ × ' × ;� + �A/ > − ;( + �A/ > − B × 1- × '
0 × ( + C ;� − �9
6 (m/s) Velocity of wind 0.6 m/s
1- (W/m2) Intensity of solar radiation 1100 W/m2
;( (oC) Ambient temperature 45 oC (EEHC)
;� (oC) Max conductor temperature in steady state 80 oC (EEHC)
' (mm) Diameter of conductor (Manufacturer data)
C (1/ oC) Temperature coefficient of resistance 0.00403 1/ oC (for Al)
0 (Ω/km) Conductor resistance at 20 oC (Manufacturer data)
B Coefficient of solar absorption 0.5 (IEC)
� Emissivity power ratio to black body 0.6 (IEC)
? (W m2 K-4) Stefan Boltzmann’s radiation constant 5.7 x 10⁻⁸ 25
Measured Emissivity Factor (e)
26
No Conductor Condition Emissivity (e)
1 New Conductor 0.229
2 23 Years in Service 0.795
3 38 Years in Service 0.774
4 21 Years in Service 0.887
C. S. Taylor, and H. E. House: “Emissivity and its Effect on the Current Currying Capacity of Stranded Aluminum Conductors”, AIEE, pp. 970-976, USA, 1956.
Ampacity Parameters in Various
Countries
27
Design Parameter
Eg
yp
t
Om
an
US
A
Ch
ina
Jap
an
Fra
nce
Ind
on
esi
a
IEC
Ambient Temp. T1
(oC)45 50 - 35 - - 35 -
Max. Conductor
Temp. T2 (oC)80 80 90 70 90 85 75 -
Wind Speed (m/s) 0.6 0.5 0.61 0.5 0.5 1.0 0.5 1.0Solar Irradiance Si
(W/m2)
>
11001200 - 1000 1000 900 1250 900
Solar Absorptivity
D- 0.5 0.5 0.9 0.9 0.5 - 0.5
Conductor
Emissivity e- 0.6 0.5 0.9 0.9 0.6 - 0.6
Short Circuit Levels
The maximum short circuit levels of equipment should be calculated for three phase and single phase to earth faults based on the following assumptions:
• 1.1 p.u pre-fault voltage (according to IEC 60909 Standards)
• Calculated figures should not exceed 100% of switchgear rating
• All generating units and transmission elements are in service during peak conditions
28

1/6/2019
8
Short Circuit Levels (EEHC)
29
Nominal
System Voltage
(kV r.m.s.)
Short-Circuit Level
Short Time Withstand
Current (KA)
Peak Withstand
Current (KA)
11 25 (3sec.) 63
22 25 (3sec.) 63
66 31.5 (1sec.) 80
132 31.5 (1sec.) 80
220 50/40 (1sec.) 125/100
500 40/50 (1sec.) 125/100
Short-Circuit Current
30
Short Circuit Levels
• The power system fault current levels shall not
exceed the values listed in the Table.
• The short-circuit fault ratings for equipment
shall not be less than these values.
• The short circuit levels given above are for a
three phase symmetrical fault.
• Fault level calculations shall be based on the
highest voltages at each system voltage level,
as defined before.31
Dynamic Criteria
The system will be considered stable if the
following conditions are met:
A. Generator Synchronism
B. System Damping
C. Transient voltage and frequency performance
32

1/6/2019
9
Generator Synchronism
All generators in the system have to remain
in synchronism as demonstrated by the
relative rotor angles;
Neither sustained nor increasing oscillations
of the rotor angle are generated for any
generator of the system;
No loss of synchronism among machines
should be detected;
No sustained voltage oscillations should be
detected on any node.33
System Damping
• The stability curves describing a transiently-limited
time domain system trajectory, will be visually
inspected to insure that the oscillations are damped or
at least are as close to 5% damping ratio as is possible.
• This value, in fact, is internationally adopted to ensure
an acceptable operating condition of the system.
• A stability simulation is deemed to exhibit positive
damping if a line defined by the peak of the machine
relative rotor angle swing curve will intersect a second
line connecting the valley of the curve with an increase
in time.
34
System Damping
• Corresponding lines on bus voltage swing curves
will also intersect with an increase in time.
• A simulation, which satisfies these conditions,
will be defined as stable.
• A simulation, which appears to have zero%
damping ratio with acceptable voltage, will be
defined as marginally stable.
35
Eigenvalue AnalysisEigenvalue AnalysisEigenvalue AnalysisEigenvalue Analysis
I(,� = −? ± LM' = −NM. ± LM. ( − N�
((((Damping RatioDamping RatioDamping RatioDamping Ratio)))) N =?
?�TM'�
36

1/6/2019
10
Transient Voltage and Frequency
Performance
• Minimum transient frequency and duration, maximum transient voltage dips and duration, and post transient voltage deviations should be considered for each of the simulated scenarios.
• These parameters will be measured at load buses.
• The minimum frequency and the transient voltage dip should be investigated for each case in order to evaluate the needs for eventually emergency actions.
37
Dynamic & Steady-State Frequency
Deviations
38
Load Shedding Scheme
• A load shedding scheme is implemented in
the Unified Power System of Egypt based on
under-frequency relays and on local
measures and actions.
• This scheme consists of 8 stages, with no
time delay and different percentages of total
load tripped at each stage, as reported in the
following Table:
39
Load Shedding Scheme in the Egyptian
Power Grid – (Ref. Operation Code)
Frequency (Hz) Load Shedding (%)
49.2 6
49.1 3
49.0 4
48.9 7
48.8 20
48.7 20
48.65 15% of rest
48.6 15% of rest 40

1/6/2019
11
ENTSO-E Recommended
Under Frequency Load Shedding (UFLS)
41
49.4
49.2
49.0 48.8 48.6 48.4 48.2 48.0 47.8 47.6 47.4
5%
10%
15%
20%
25%
30%
35%
Individual
range
Load
shedding
amount
Frequency
(Hz)
48.547.5
Not
needed
Solidarity
range
Minimum
Load shedding
Mandatory
45%
50%
40%
Standard
Load sheddingVoluntary
49.4
49.2
49.0 48.8 48.6 48.4 48.2 48.0 47.8 47.6 47.4
5%
10%
15%
20%
25%
30%
35%
Individual
range
Load
shedding
amount
Frequency
(Hz)
48.547.5
Not
needed
Solidarity
range
Minimum
Load shedding
Mandatory
45%
50%
40%
Standard
Load sheddingVoluntary
Spinning Reserve (SR)
• The size of the secured incident corresponds to
the largest power loss resulting from a single
credible incident (including the loss of a
combined cycle: GT + corresponding share of
the ST).
• The spinning reserve should cover the secured
incident plus a margin of 10%.
• The reserve allocated to each unit shall not
exceed 5% of the size of the generating unit.
42
Power Reserve Requirement and
Criteria
According to Operation Rules, in the Egyptian
power system, frequency and active power
control is provided by the following means:
• Automatic response from generating units
operating in a free governor frequency
sensitive mode (Primary Reserve);
• Automatic Generation Control (AGC) of
generating units equipped with automatic load
frequency control (Secondary Reserve).
43
Power Reserve Requirement and
Criteria (Ref. EEHC 2008)
• To ensure network security in the Egyptian and other system composing synchronous grid (Jordan, Libya, etc.), after the most severe outage considered, the total needed Primary Control Reserve is pre-determined at a value of 250 MW composed of 150 MW thermal reserve and 100 MW hydro reserve.
• These were provided by 20 units of TPP and 10 units of HPP under the AGC;
• The goal of Secondary Control Reserve is to restore frequency and cross–border exchange to the set values.
44

1/6/2019
12
Table 39: Operational Criteria for Definition of
Operating Reserve Value (Ref. EEHC 2008)
Type of Operating
Reserve
Value
(MW)
Comments
Primary spinning reserve (within 30 sec):
250
100 MW Hydro generation
150MW Thermal generation
Secondary spinning reserve (within 14.5 minutes):
In Winter 350 Hydro-Thermal generation
In Summer 175 Hydro-Thermal generation
175 Interconnection lines
Cold reserve (within 15 minutes):
600 Gas Turbines45
Primary & Secondary Responses
• It shows that the primary response must be
available within the first 5 seconds after
frequency drop incident and should be fully
available for at least 25-30 seconds after the
event.
• Beyond that the secondary response should be
available and must be available till a maximum
of 30 minutes.
47
Generation Control
48

1/6/2019
13
AGC of Two-Area System
49Source: O. I. Elgerd, “Electric Energy Systems Theory – An Introduction”, McGraw Hill, Inc.
Interconnection with External Systems• The Egyptian Unified Power System is
presently operating in interconnected mode with the neighboring countries:
– Jordan, and
– Libya.
• In near future, the Egyptian power system will be interconnected to the KSA system through a DC link to facilitate power exchange of 3000 MW.
• Interconnection with Sudan is also expected in future through 2000 MW HVDC link.
50
Expected Peak 2030 Egyptian Power
System with External Interconnections
51
8
Share of SR in the Interconnected
System Operation
• Each Transmission System Operator (TSO) should contribute to the SR in accordance with its respective contribution coefficient (Ci):
5- =�U�.<-
�U�.<"2"�3
• This effectively means that each TSO must maintain a share of the total spinning reserve requirement of the interconnected system which is proportional to its share of the total online generation within the interconnected system at the time of coincident system peak.
52
1/6/2019
14
Egypt-Libya Interconnection
• Actually the interconnection with Libya is
realized through two 220 kV OHTL starting
from Salloum substation up to Toubroq
substation.
• The main parameters of the interconnection
lines are:
– Length 257 km
– Rated voltage 220 kV
– Rated power 460 MVA
53
Interconnection with Jordan
• The interconnection with Jordan transmission network is realized through 500/400 kV transformer substation at Taba using autronsformer units installed to create the 400 kV busbar.
• The interconnection line 400 kV starting from Taba substation and ending at Aqaba substation is composed of a OHTL and HVAC undersea cable to cross the Aqaba Gulf up to Aqaba substation.
54
The 500/400kV Interconnection with
Jordan Transmission Network
The 400 kV interconnection link has the
following main parameters:
• Length 43 km (approximately)
• Rated voltage 400 kV
• Rated power 1780 MVA
55
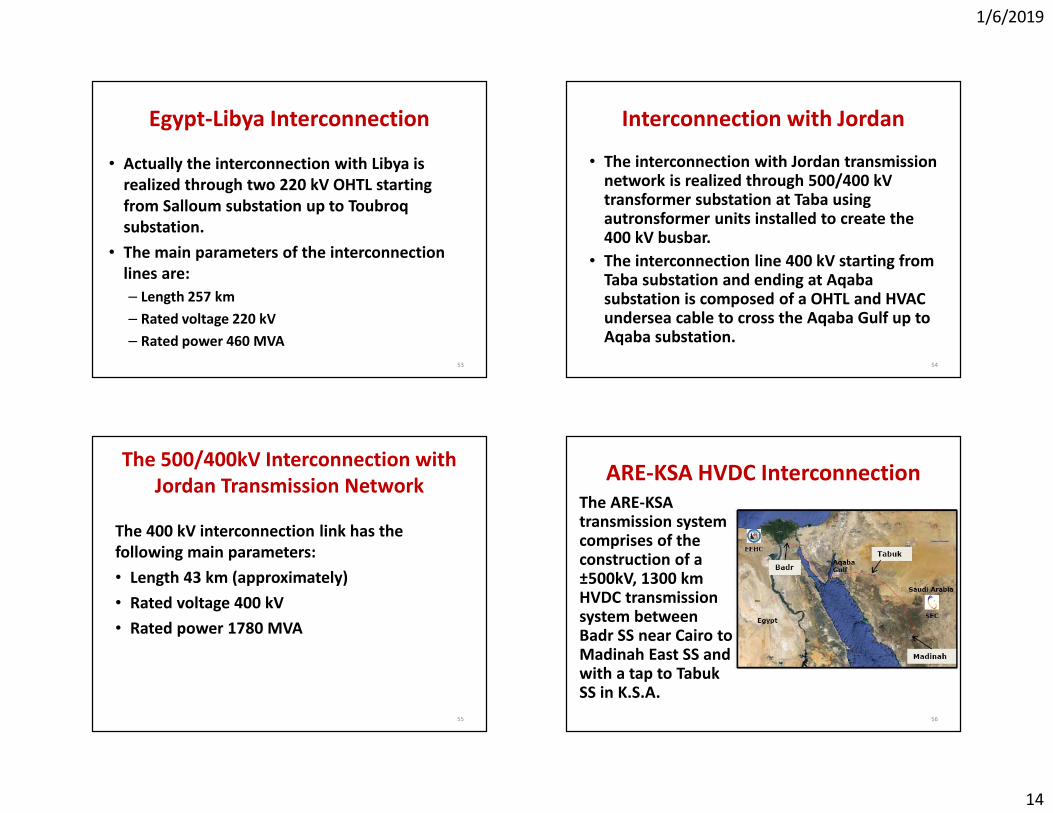
ARE-KSA HVDC Interconnection
The ARE-KSA transmission system comprises of the construction of a ±500kV, 1300 km HVDC transmission system between Badr SS near Cairo to Madinah East SS and with a tap to TabukSS in K.S.A.
56
1/6/2019
15
Right-of-Way Widths
• A minimum right of way width of 70
meters, i.e. 35 meters on either side from
the line center, shall be required for 500 kV
overhead lines.
• A minimum right-of-way width of 50
meters shall be required for 220 kV
overhead lines
• For 66 kV lines 26 meters.
57