from the cio’s desk · ongoing panama leaks case against the prime minister, kept the market...
TRANSCRIPT

FROM THE CIO’s DESK: Panama Case Leads to Market’s Consolidation
Awaiting Trigger of MSCI’s Emerging Market Rebalancing
Dear Investor, After a rampant three month ride and a robust performance, the stock market finally appeared in a consolidation phase during the month of February 2017 whereby both the indices closed marginally lower; the KMI-30 index closed 0.29% down at 83,569 pts while the KSE-100 index closed 0.46% down at 48,534 pts. Foreigners remained net sellers during the month once again with a net sell of USD 29.6 million taking the total net sell for the fiscal year to USD 438.4 million. However, it is pertinent to note that despite the continued and considerable foreign selling, the market has maintained an upward trajectory and stayed resilient. The investors’ confidence is at an all-time high in light of the improving economic indicators and positive developments expected going forward. During the month, volatility remained the main highlight since investors’ sentiments were dampened due to a destabilized law and order situation when there was a sudden hike in terrorist attacks throughout the country. Alongside, the SECP’s tightening measures against the brokers to curb issues like in-house margin financing, were also adding to the market’s volatility. SECP also served non-compliance notices to fifteen brokers out of which four brokers defaulted on their obligations during the month. All the above mentioned coupled with anticipations regarding the outcome of the ongoing Panama Leaks Case against the prime minister, kept the market volatile and the investors cautious. However, initiation of fresh operations by armed forces in Punjab post the heightened terrorist activities was taken as a positive sign by the market as it highlighted on the government’s resolve to tackle this menace firmly. Agreement on the finalization of a product structure for margin financing was also taken as a positive development as it will play a supportive role in improving the market’s liquidity. Overall, the fact that the market did not break the psychological barrier of 48,000 pts is a very crucial point and reflects on the excess liquidity still available for deployment which keeps supporting the market and kept it range bound during the month. On the international front, oil showed a range bound behavior whereby Brent Crude closed at USD 55.59/barrel, down 0.20%. in line with this, the oil sector underperformed the overall stock market as it was down by 1.30% over the month. Gold showed strength as it closed the month 3.11% up at USD 1,248.33/ounce.
Outlook In its recent semiannual index review, Financial Times Stock Exchange (FTSE), has also included Pakistan in its Global Equity Index Series – Asia Pacific, ex Japan based on which, six Pakistani stocks will be added in this tracker index. This rebalancing will add to the impetus of MSCI Reclassification and will translate into larger foreign investment inflow for the country which shall drive the market higher. This recent development reflects on the continuously improving economic fundamentals as well as brighter prospects for the country going forward. At the same time, the consensus on a product structure for formalizing margin financing is also expected to reap positive results as it will improve the liquidity of PSX. With the Panama Case hearings concluded, the court is expected to announce its final verdict during March 2017 and the expectations regarding the final verdict may keep the market volatile in the short term. Investors’ interest in fundamentally strong scrips is expected to stay intact. Selective stock picking will be the key to attractive returns in the current market scenario and our view stays positive on the market for long-term. Investors with relevant risk profiles and investment horizons are advised to go through our Fund Manager Report hereunder for a detailed performance review of our mutual funds and select a scheme for investment according to their risk preferences.
Ground Floor Block “B”, Finance and Trade Center, Shahrah-e-Faisal Karachi.
UAN: 111-633-926 (111-Meezan) Call Center: 0800-42525, Web Site: www.almeezangroup.com

.
Sr. No.
Funds Category Fund Name Symbol
Fund
size (Rs. in
million)
Inception date
Return (net of all expenses including Management Fee)
FY17TD (%) Since Inception
CAGR (%)
Fund Benchmark Fund Benchmark
1 Islamic Equity Al Meezan Mutual Fund AMMF 8,586 13-Jul-95 28.1 26.3 17.3 16.8
2 Islamic Equity Meezan Islamic Fund MIF 50,463 8-Aug-03 28.6 26.3 22.6 19.5
3 Islamic Index Tracker
KSE Meezan Index Fund KMIF 1,167 23-May-12 25.4 26.3 26.5 29.6
4 Islamic Balanced Meezan Balanced Fund MBF 8,492 20-Dec-04 17.6 15.2 17.0 14.6
5 Islamic Asset Allocation
Meezan Asset Allocation Fund MAAF 1,422 18-Apr-16 24.2 21.3 - -
6 Islamic Income Meezan Islamic Income Fund MIIF 10,651 15-Jan-07 5.3 2.9 14.5 5.2
7 Islamic Income Meezan Sovereign Fund MSF 8,924 10-Feb-10 7.9 4.3 11.3 6.5
8 Islamic Money
Market Meezan Cash Fund MCF 3,946 15-Jun-09 6.9 3.1 11.1 6.5
9 Islamic Commodity Meezan Gold Fund MGF 381 13-Aug-15 -4.7 -1.7 3.4 8.7
10 Islamic Equity Meezan Energy Fund MEF 691 29-Nov-16 9.2 16.3 - -
11
Meezan Financial Planning Fund
of Fund
Islamic Fund of
Funds Scheme MFPF-Aggressive Allocation Plan MPFP - AGG 860 11-Apr-13 20.3 18.4 21.2 20.6
Islamic Fund of
Funds Scheme MFPF-Moderate Allocation Plan MPFP - MOD 514 11-Apr-13 15.4 14.2 16.7 17.6
Islamic Fund of
Funds Scheme MFPF-Conservative Allocation Plan MPFP - CON 426 11-Apr-13 10.5 8.3 11.8 10.6
Islamic Fund of
Funds Scheme Meezan Capital Preservation Plan-II MPFP - MCPP-II 3,344 16-Dec-14 12.7 11.3 8.8 8.6
Islamic Fund of
Funds Scheme Meezan Asset Allocation Plan-I MPFP - MAAP-I 1,460 10-Jul-15 23.5 22.7 21.6 23.3
Islamic Fund of Funds Scheme
Meezan Asset Allocation Plan-II MPFP - MAAP-II 1,073 24-Nov-15 22.5 22.0 30.9 33.6
Islamic Fund of
Funds Scheme Meezan Asset Allocation Plan-III MPFP - MAAP-III 3,367 26-Jan-16 22.5 22.3 35.2 38.9
Islamic Fund of
Funds Scheme Meezan Asset Allocation Plan-IV MPFP - MAAP-IV 978 23-May-16 21.3 20.5 - -
12 Meezan Strategic Allocation
Fund
Islamic Fund of
Funds Scheme Meezan Strategic Allocation Plan-I MSAP- I 2,779 19-Oct-16 12.7 13.4 - -
Islamic Fund of
Funds Scheme Meezan Strategic Allocation Plan-II MSAP- II 1,746 21-Dec-16 2.2 2.1 - -
Islamic Fund of
Funds Scheme Meezan Strategic Allocation Plan-III MSAP- III 58 16-Feb-17 -0.3 0.1 - -
13 Meezan Tahaffuz Pension Fund
Islamic Voluntary Pension Scheme
MTPF-Equity sub Fund MTPF-EQT 5,537 28-Jun-07 26.3 - 20.8 -
MTPF-Debt sub Fund MTPF-DEBT 2,357 28-Jun-07 5.4 - 11.6 -
MTPF-Money Market sub Fund MTPF-MMKT 578 28-Jun-07 4.7 - 11.3 -
MTPF-Gold sub Fund MTPF-Gold 44 4-Aug-16 -6.8 - - -

0
Fund Managers‟ Report
AL Meezan Investment Management Limited
Stock Market Review
During the month of February 2017, the KSE-100 index declined by
0.46% to close at 48,534 points. Banks, Oil & Gas marketing and
Cements were positive contributors whereas Power and Fertilizer
stocks were negative contributors. The average daily volume of the
market was 347.7 mn shares, down by 20.9% on a MoM basis.
Foreigners reported a net sell of USD 29.6 mn in February. Mutual
Funds were net buyers of USD 47.9 mn, Insurance companies were
net buyers of USD 16 mn and Individuals were net sellers of USD
43.4 mn. Foreign selling continued due to an expected US interest
rate hike in the month of March, albeit parallel foreign buying in
MSCI Emerging market stocks was also witnessed. Oil prices
remained range bound during the month as news of rising
inventories and shale production were countered by OPEC
member’s commitment to reduce oil output. WTI closed at USD
54.01/bbl, up 1.1% MoM.
Going forward, the upcoming inclusion of Pakistan into the MSCI
emerging market Index due on the 31st of May is likely to keep
foreign interest alive in MSCI based stocks. Certain concerns
continue to linger regarding the outcome of the Panama case which
is expected during the coming month. However, factors such as
MSCI reclassification and rising market liquidity are likely to favor
equities in the longer term.
KSE-100 Index Performance
Al Meezan Investments, the company in operation since 1995, has one of the longest track record of managing mutual funds in the private sector
in Pakistan. Al Meezan Investments manages Thirteen mutual funds; namely Al Meezan Mutual Fund, Meezan Balanced Fund, Meezan Islamic
Fund, Meezan Islamic Income Fund, Meezan Tahaffuz Pension Fund, Meezan Cash Fund, Meezan Sovereign Fund, Meezan Financial Planning Fund
of Funds, KSE Meezan Index Fund, Meezan Gold Fund, Meezan Asset Allocation Fund, Meezan Strategic Allocation Fund and Meezan Energy Fund.
The total funds under management of Al Meezan, the only full-fledged Shariah compliant asset management company in Pakistan, have reached
Rs. 111.33 billion as on February 28, 2017. With an AM2++ credit rating denoting high management quality, the company clearly stays well ahead
of all its competitors in the Islamic asset management market in Pakistan.
February, 2017
Money Market Review
The money market faced relatively tight liquidity scenario evidenced
by Rs. 3.95 trillion worth of OMO injections carried out by the SBP
coupled with Rs. 11.60 billion worth of discounting availed by various
counters during this month. However, the OMO mop-ups and floor
placements during the month were of Rs. 20.90 bn and Rs. 33.90 bn
respectively. The 3MK closed 2bps down at 6.07% while 6MK closed
flat at 6.12%. The T-bill yields went up by 4 to 6 bps while PIB yields
changed in a range of -4 to 4 bps.
Inflation for the month of February 2017 clocked in at 4.22% as
compared to 3.66% in January 2017 and 4.02% in February, 2016.
The average inflation during 8MFY17 stands at 3.90% compared to
2.48% during the same period last year.
Moreover, two T-bill auctions were conducted during this period
whereby in total Rs. 1.25 trillion was accepted against the
participation of Rs. 1.49 billion with major participation and
acceptance in 3 months category. A PIB auction was also conducted
whereby Rs. 58 bn was accepted against the participation of Rs. 112
bn with major participation and acceptance in 3 year category.
On the forex front, the rupee in interbank market closed flat at Rs.
104.86/$ while in the open market, it closed Rs. 0.70 stronger at Rs.
107.20/$ during the month.
6 Month KIBOR
Disclaimer This publication is for informational purpose only and nothing herein should be construed as a solicitation, recommendation or an offer to buy or sell any fund. All investments in mutual funds are
subject to market risk. The NAV based prices of units and any dividends/returns thereon are dependent on force and factors affecting the capital markets. These may go up or down based on market conditions.
Past performance is not necessarily indicative of future results. Performance data does not include cost incurred by investor in the form of sales-load etc.
(This report has been prepared in line with MUFAP’s recommended Format)
47,000
48,000
49,000
50,000
51,000
0
100
200
300
400
500
600
1-F
eb
7-F
eb
13-F
eb
17-F
eb
23-F
eb
Vol (mn) (LHS) Index (RHS)
28-F
eb
5.80
6.00
6.20
6.40
6.60
6.80
1-F
eb
4-F
eb
7-F
eb
10-F
eb
13-F
eb
16-F
eb
19-F
eb
22-F
eb
25-F
eb
28-F
eb

MEEZAN ISLAMIC FUND (MIF)
Fund Review:
Net assets of Meezan Islamic Fund stood at Rs. 50.46 billion as on February 28, 2017. The fund‟s NAV increased by 0.13% during the month of
February as compared to 0.29% decreased in benchmark index (KMI-30) while KSE-100 Index during the same period decreased by 0.46%. As
on February 28, the fund was 90% invested in equities.
Funds Details
Disclaimer This publication is for informational purpose only and nothing herein should be construed as a solicitation, recommendation or an offer to buy or sell any fund. All investments in mutual funds are subject to market
risk. The NAV based prices of units and any dividends/returns thereon are dependent on force and factors affecting the capital markets. These may go up or down based on market conditions. Past performance is not
necessarily indicative of future results. Performance data does not include cost incurred by investor in the form of sales-load etc. (This report has been prepared in line with MUFAP’s recommended Format)
AMC RATING AM2++ (STABLE OUTLOOK)
1M 3M 6M FYTD 1Yr 3Yr 5Yr PSD* CAGR*
MIF 0.1% 14% 21% 29% 56% 106% 283% 1487% 23%
Benchmark# -0.3% 17% 20% 26% 55% 95% 265% 1020% 19%
* Performance start date of August 08, 2003, CAGR since inception # KMI-30 replaced DJIIMPK as the Fund’s benchmark from July 01, 2009, while KSE-100 index remained as the benchmark till June 30, 2006, ^ NAV to NAV with dividend reinvested
FY16 FY15 FY14 FY13 FY12 FY11 FY10 FY09
MIF 17% 22% 29% 51% 19% 39% 31% -30%
Benchmark 16% 20% 30% 54% 14% 44% 37% -35%
Engro Corporation 8% Oil & Gas Development Co. Ltd. 5%
Lucky Cement Ltd. 7% Honda Atlas Cars 4%
Packages Ltd. 7% Engro Fertilizer Ltd. 4%
The Hub Power Co. Ltd. 6% Pakistan State Oil Co. Ltd. 4%
Mari Petroleum Ltd. 5% K-Electric Ltd. 4%
Fund Type: Open End Risk Level High Launch Date 8th Aug 2003 Trustee CDC
Auditors KPMG Taseer Hadi & Co.
Registrar Meezan Bank Ltd. Unit Types A, B and C Management Fee 2% Front End Load 2% Fund Category Equity Back End Load Nil Benchmark KMI-30 Leverage Nil Listing PSX AMC Rating AM2++
Rating Agency JCRVIS Pricing Mechanism Forward Valuation Days Mon-Fri Subscription/ Redemption Days Mon-Fri 9am – 4pm Fund Manager Muhammad Asad
Members of Investment Committee
M. Shoaib, CFA
Muhammad Asad
Ali Asghar
Ali Khan, CFA, FRM
Ahmed Hassan, CFA
Asif Imtiaz, CFA Zain Malik, CFA Asmar Hamoodi, CFA Imad Ansari
Investment Objective:
To maximize total investor returns by investing in
Shariah Compliant equities focusing on both capital
gains and dividend income.
Fund Details:
Jan '16 Feb '17 MoM %
Net Assets (Rs mn) 48,921 50,463 3.15%
NAV Per Unit (Rs) 85.06 85.17 0.13%
Equity (%) 89.35 90.32
Cash (%) 9.79 9.26
Other receivables (%) 0.86 0.42
P/E 11.51
Expense Ratio* 3.87%
*This includes 1.50% representing government levy, Worker's
Welfare Fund and SECP fee. (Annualized)
adf
MIF KSE-100
Index
KMI-30
Index
Standard Deviation (%) 12.34 11.06 13.03
Sharpe Ratio 4.16 4.50 3.88
Fund Net Assets:
Top Ten Equity Holdings: (% of Total Assets):
Annual Returns:
Performance - Cumulative Returns:
Fund’s Performance:
Sector Allocation:
EQ
UITY
qu
ity
Risk Measures – Feb ‘17:
Asset Allocation:
SWWF Disclosure: The Fund has provided an amount of Rs. 345.26 million against Sindh Workers’ Welfare Fund (SWWF) Liability. Had that not been provided, the NAV
per unit/return for the period would have been higher by Rs. 0.58 / 0.68%.
February, 2017
20%10%
14%
14%
7%35%
Cement
Power Generation & Distribution
Oil & Gas Exploration Companies
Fertilizer
Oil & Gas Marketing Companies
Others
-
200
400
600
800
1,000
1,200
1,400
1,600
1,800
Aug-0
3
Mar-
04
Oct-
04
May-0
5
Dec-0
5
Jul-
06
Feb-0
7
Sep-0
7
Apr-
08
Nov-0
8
Jun-0
9
Jan-1
0
Aug-1
0
Apr-
11
Nov-1
1
Jun-1
2
Jan-1
3
Aug-1
3
Mar-
14
Oct-
14
May-1
5
Dec-1
5
Jul-
16
Feb-1
7
MIF Benchmark

AL MEEZAN MUTUAL FUND (AMMF)
Fund Review:
The net assets of Al Meezan Mutual Fund (AMMF) as at February 28, 2017 stood at Rs. 8.59 billion. The fund‟s NAV decreased by 0.02% during
the month of February as compared to 0.29% decreased in benchmark index (KMI-30) while KSE-100 Index during the same period decreased
by 0.46%. As on February 28, the fund was 91% invested in equities.
Funds Details
Disclaimer This publication is for informational purpose only and nothing herein should be construed as a solicitation, recommendation or an offer to buy or sell any fund. All investments in mutual funds are subject to market
risk. The NAV based prices of units and any dividends/returns thereon are dependent on force and factors affecting the capital markets. These may go up or down based on market conditions. Past performance is not
necessarily indicative of future results. Performance data does not include cost incurred by investor in the form of sales-load etc. (This report has been prepared in line with MUFAP’s recommended Format)
AMC RATING AM2++ (STABLE OUTLOOK)
1M 3M 6M FYTD 1Yr 3Yr 5Yr PSD* CAGR*
AMMF -0.02% 14% 21% 28% 55% 106% 280% 3,040% 17%
Benchmark# -0.29% 17% 20% 26% 55% 95% 265% 2,809% 17%
* Performance start date of July 13, 1995, CAGR since inception # KMI-30 replaced DJIIMPK as the Fund’s benchmark from July 01, 2009, while KSE-100 index remained as the benchmark till June 30, 2006. ^ NAV to NAV with dividend reinvested
FY16 FY15 FY14 FY13 FY12 FY11 FY10 FY09
AMMF 16% 22% 30% 51% 19% 37% 31% -32%
Benchmark 16% 20% 30% 54% 14% 44% 37% -35%
Engro Corporation 9% Oil & Gas Development Co. Ltd. 5%
Lucky Cement Ltd. 7% Pakistan State Oil Co. Ltd. 4%
Packages Ltd. 6% Engro Fertilizer Ltd. 4%
The Hub Power Co. Ltd. 6% K-Electric Ltd. 4%
Mari Petroleum Ltd. 5% Pakistan Oilfields Ltd. 3%
Fund Type: Open End Risk Level High Launch Date 13th Jul 1995 Trustee CDC
Auditors KPMG Taseer Hadi & Co.
Registrar Meezan Bank Ltd. Unit Types A, B,C and D Management Fee 2% Front End Load 2% Fund Category Equity Back End Load Contingent Load Benchmark KMI-30 Leverage Nil Listing PSX AMC Rating AM2++
Rating Agency JCRVIS Pricing Mechanism Forward Valuation Days Mon-Fri Subscription/ Redemption Days Mon-Fri 9am – 4pm Fund Manager Ahmed Hassan, CFA
Members of Investment Committee
M. Shoaib, CFA
Muhammad Asad
Ali Asghar
Ali Khan, CFA, FRM
Ahmed Hassan, CFA
Asif Imtiaz, CFA Zain Malik, CFA Asmar Hamoodi, CFA Imad Ansari
Investment Objective:
The objective of Al Meezan Mutual Fund is to optimize
the total investment returns, both capital gains and
dividend income, through prudent investment
management.
Fund Details:
Jan '17 Feb '17 MoM %
Net Assets (Rs mn) 8,163 8,586 5.19%
NAV Per Unit (Rs) 23.06 23.06 -0.02%
Jan '17 Feb '17
Equity (%) 93.20 90.92
Cash (%) 6.66 8.46
Other receivables (%) 0.13 0.61
P/E 11.58
Expense Ratio* 3.77%
*This includes 1.35% representing government levy,
Worker's Welfare Fund and SECP fee. (Annualized)
Fund Net Assets:
Top Ten Equity Holdings: (% of Total Assets):
Annual Returns:
Performance - Cumulative Returns:
Investment Growth from FY 1996 - to Date
Sector Allocation:
EQ
UITY
qu
ity
Asset Allocation:
AMMF KSE-100 Index
KMI-30 Index
Standard Deviation (%) 12.20 11.06 13.03
Sharpe Ratio 4.12 4.50 3.88
Risk Measures – Feb ‘17:
SWWF Disclosure: The Fund has provided an amount of Rs. 51.35 million against Sindh Workers’ Welfare Fund (SWWF) Liability. Had that not been provided, the NAV per
unit/return for the period would have been higher by Rs. 0.14 / 0.60%.
February, 2017
21%10%
15%
14%
8%
32%
Cement
Power Generation & Distribution
Oil & Gas Exploration Companies
Fertilizer
Oil & Gas Marketing Companies
Others
100,000
122,800
1,172,192
487,122
968,549
3,140,098
-
500,000
1,000,000
1,500,000
2,000,000
2,500,000
3,000,000
3,500,000
July
95
June 0
3
June 1
0
Dec 1
1
Jul 12
Feb 1
3
Sep 1
3
Apr
14
Nov 1
4
Jun 1
5
Jan 1
6
Aug 1
6
Conversion from close end fund to
Feb 17

MEEZAN ISLAMIC INCOME FUND (MIIF)
Fund Review
Net assets of Meezan Islamic Income Fund (MIIF) stood at Rs. 10.65 billion as on February 28, 2017. MIIF has provided an annualized return of
4.30% for the month of February as compared to its benchmark which has provided an annualized return of 2.84% during the same period.
Funds Details
Disclaimer This publication is for informational purpose only and nothing herein should be construed as a solicitation, recommendation or an offer to buy or sell any fund. All investments in mutual funds are subject to market
risk. The NAV based prices of units and any dividends/returns thereon are dependent on force and factors affecting the capital markets. These may go up or down based on market conditions. Past performance is not
necessarily indicative of future results. Performance data does not include cost incurred by investor in the form of sales-load etc. (This report has been prepared in line with MUFAP’s recommended Format)
AMC RATING AM2++ (STABLE OUTLOOK)
1M 3M 6M FYTD 1Yr 3Yr 5Yr PSD*
MIIF 4.30% 4.98% 5.29% 5.29% 5.09% 7.98% 11.56% 14.45%
Benchmark 2.84% 2.80% 2.81% 2.87% 2.95% 4.01% 4.64% 5.25%
* Performance start date of Jan 15, 2007, ^ NAV to NAV with dividend reinvested
FY16 FY15 FY14 FY13 FY12 FY11 FY10 FY09
MIIF 5.76% 8.15% 11.90% 14.45% 7.79% 11.77% 7.31% 10.14%
Benchmark 3.49% 5.04% 5.38% 5.54% 6.02% 5.88% 5.80% 6.12%
K-Electric Limited-III 11% Fatima Fertilizer Sukuk 2%
GoP Ijarah Sukuks XVII 9% K-Electric Limited-II 2%
GoP Ijarah Sukuks XVIII 5% GoP Ijarah Sukuks XVI 0.32%
Engro Fertilizer Limited - I 3% Hascol Sukuk 3%
Jan ’17 Feb ’17 Sukuks 20% 21%
Government backed / Guaranteed Securities 9% 14%
Bai Muajjal 7% 7%
Placements with Banks and DFIs 23% 28%
Cash 40% 29%
Others Including receivables 1% 1%
Fund Type: Open End Risk Level Minimal Launch Date 15-Jan-07 Trustee CDC
Auditors KPMG Taseer Hadi & Co.
Registrar Meezan Bank Ltd. Unit Types A, B and C Management Fee 1.5% Front End Load 0.5% Fund Category Income Leverage Nil Listing PSX AMC Rating AM2++ Rating Agency JCRVIS Fund Stability Rating A- (f) Pricing Mechanism Forward Weighted average time to maturity
1.37 Years
Back End Load Contingent load for Type C investors
Benchmark 6 Months average deposit
rates of 3 A-rated Islamic
Banks
Valuation Days Mon-Fri Subscription/ Redemption Days
Mon-Fri 9am – 4pm
Fund Manager Zain Malik, CFA
Members of Investment Committee
M. Shoaib, CFA
Muhammad Asad
Ali Asghar
Ali Khan, CFA, FRM
Ahmed Hassan, CFA
Asif Imtiaz, CFA Zain Malik, CFA Asmar Hamoodi, CFA Imad Ansari
*This includes 0.45% representing government levy,
Worker's Welfare Fund and SECP fee. (Annualized)
Investment Objective: To provide investors with a high and stable rate of
current income consistent with long term preservation
of capital in a Shar iah compliant way. A secondary
objective is to take advantage of opportunities to
realize capital appreciation.
Fund Details:
Jan '17
Feb '17 MoM %
Net Assets (Rs mn) 10,998 10,651 -3.15%
NAV Per Unit (Rs) 52.91 53.09 0.33%
Expense Ratio* 2.16%
Top Portfolio Holdings:(% of Total Assets):
Annual Returns:
Performance - Annualized Returns:
Monthly Performance:
Asset Allocation:
Details of Non Performing Investments:
Fund Net Assets:
Credit Quality of Portfolio:
IN
CO
ME
SWWF Disclosure: The Fund has provided an amount of Rs. 13.83 million against Sindh Workers’
Welfare Fund (SWWF) Liability. Had that not been provided, the NAV per unit/return for the period
would have been higher by Rs. 0.07 / 0.13%.
AAA 22.7%
AA+ 15.7%
AA 10.7%
AA- 7.9%
A+ 34.8%
A 6.7%
February, 2017
23%
16%
11%
35%
7% 8%
0%
10%
20%
30%
40%
AAA
AA+
AA
A+
A AA-
Credit Quality
0%
2%
4%
6%
8%
10%
Jul-1
6
Aug-1
6
Sep-1
6
Oct-1
6
Nov-1
6
Dec-1
6
Jan-1
7
Feb-1
7
MIIF Benchmark

MEEZAN CASH FUND (MCF)
Fund Review
Net assets of Meezan Cash Fund (MCF) stood at Rs. 3.95 billion as on February 28, 2017. MCF has provided an annualized return of 4.22% for
the month of February as compared to its benchmark which has provided an annualized return of 2.67% during the same period.
Funds Details
Disclaimer This publication is for informational purpose only and nothing herein should be construed as a solicitation, recommendation or an offer to buy or sell any fund. All investments in mutual funds are subject to market
risk. The NAV based prices of units and any dividends/returns thereon are dependent on force and factors affecting the capital markets. These may go up or down based on market conditions. Past performance is not
necessarily indicative of future results. Performance data does not include cost incurred by investor in the form of sales-load etc. (This report has been prepared in line with MUFAP’s recommended Format)
AMC RATING AM2++ (STABLE OUTLOOK)
1M 3M 6M FYTD 1Yr 3Yr 5Yr PSD*
MCF 4.22% 10.48% 7.54% 6.87% 6.15% 6.72% 8.21% 11.13%
Benchmark 2.67% 2.70% 2.71% 3.09% 3.50% 4.93% 5.74% 6.52%
* Performance start date of June 15, 2009, ^ NAV to NAV with dividend reinvested
FY16 FY15 FY14 FY13 FY12 FY11 FY10 FY09
MCF 4.59% 7.46% 7.08% 8.78% 10.71% 11.02% 10.09% 8.03%≠
Benchmark 4.49% 6.24% 6.55% 6.91% 8.13% 8.24% 7.50% 7.60%
≠15 days of operations
Fund Type: Open End Risk Level Minimal Launch Date 15-Jun-09 Trustee CDC
Auditors KPMG Taseer Hadi & Co.
Registrar Meezan Bank Ltd. Unit Types A, B and C Management Fee 1% Front End Load Nil Back End Load* 0.1% if redemption
within 3 days Fund Category Money Market Leverage Nil Listing PSX AMC Rating AM2++ Rating Agency JCRVIS Fund Stability Rating AA (f) Pricing Mechanism Forward Weighted average time to maturity
3.66 Days
Benchmark 3 Months average
deposit rates of 3 AA
rated Islamic Banks Valuation Days Mon-Fri Subscription/ Redemption Days Mon-Fri 9am – 4pm Fund Manager Zain Malik, CFA
Members of Investment Committee
M. Shoaib, CFA
Muhammad Asad
Ali Asghar
Ali Khan, CFA, FRM
Ahmed Hassan, CFA
Asif Imtiaz, CFA Zain Malik, CFA Asmar Hamoodi, CFA Imad Ansari
Investment Objective: To seek maximum possible preservation of capital and
a reasonable rate of return via investing primarily in
liquid Shariah compliant money market and debt
securities.
Fund Details:
Jan'17 Feb'17 MoM %
Net Assets (Rs mn) 4,097 3,946 -3.69%
NAV Per Unit (Rs) 52.27 52.44 0.32%
Expense Ratio 1.68%
*This includes 0.43% representing government levy, Worker's
Welfare Fund and SECP fee. (Annualized)
AAA 46.29%
AA+ 12.69%
AA 38.03%
Rating Exposure:
Portfolio: Salient Features
Annual Returns:
Performance – Annualized Returns:
Monthly Performance:
Asset Allocation:
Fund Net Assets:
Key Benefits
Maximum Preservation of Principal Investment
High Liquidity (Redemption within two working days)
*No Sales Load (No Entry or Exit charges)
Tax Credit as per tax laws
Investment Policy and Strategy
Investments in High Grade & Liquid avenues:
Instrument/Issuer Rating : Minimum ‘AA’
Maximum Maturity of Instruments : Six Months
Average Time to Maturity of Portfolio : Three Months
Benchmark Average return on 6-month Islamic bank deposits
Portfolio Composition:
Jan ’17 Feb ’17
Placements with Banks and DFIs 11% 12%
Cash 87% 85%
Other Including receivables 2% 3%
M
ON
EY
MA
RK
ET
SWWF Disclosure: The Fund has provided an amount of Rs. 5.56 million against Sindh Workers’
Welfare Fund (SWWF) Liability. Had that not been provided, the NAV per unit/return for the period
would have been higher by Rs. 0.07 / 0.14%.
February, 2017
12%
85%
3%
Placements with Banks and DFIs
Cash
Other Including receivables
0%
4%
8%
12%
16%
20%
24%
Jul-1
6
Aug-1
6
Sep-1
6
Oct-1
6
Nov-1
6
Dec-1
6
Jan-1
7
Feb-1
7
MCF Benchmark

MEEZAN SOVEREIGN FUND (MSF)
Fund Review
Net assets of Meezan Sovereign Fund (MSF) stood at Rs. 8.92 billion as on February 28, 2017. For the month of February, the fund has provided
an annualized return of 0.46% as compared to its benchmark which has provided an annualized return of 4.02% during the same period.
Funds Details
Disclaimer This publication is for informational purpose only and nothing herein should be construed as a solicitation, recommendation or an offer to buy or sell any fund. All investments in mutual funds are subject to market
risk. The NAV based prices of units and any dividends/returns thereon are dependent on force and factors affecting the capital markets. These may go up or down based on market conditions. Past performance is not
necessarily indicative of future results. Performance data does not include cost incurred by investor in the form of sales-load etc. (This report has been prepared in line with MUFAP’s recommended Format)
AMC RATING AM2++ (STABLE OUTLOOK)
1M 3M 6M FYTD 1Yr 3Yr 5Yr PSD*
MSF 0.46% 6.23% 8.36% 7.91% 7.17% 7.09% 8.87% 11.30%
Benchmark 4.02% 3.85% 4.26% 4.25% 4.28% 5.19% 5.90% 6.54%
* Performance start date of Feb 10, 2010, ^ NAV to NAV with dividend reinvested
FY16 FY15 FY14 FY13 FY12 FY11 FY10 FY09
MSF 5.12% 6.81% 8.50% 9.11% 11.19% 11.45% 9.76%* -
Benchmark 4.49% 6.24% 6.55% 6.91% 8.13% 8.24% 7.50% -
* 140 days of operations
Fund Type: Open End Risk Level Minimal Launch Date 10-Feb-10 Trustee CDC
Auditors KPMG Taseer Hadi & Co.
Registrar Meezan Bank Ltd. Unit Types A, B, C and D Management Fee 1% Front End Load 0.5% Back End Load Nil Fund Category Income Leverage Nil Listing PSX AMC Rating AM2++ Rating Agency JCRVIS Fund Stability Rating AA (f) Pricing Mechanism Forward Weighted average time to maturity
1.67 years
Benchmark 6 Months PKISRV Rate
Valuation Days Mon-Fri Subscription/ Redemption Days Mon-Fri 9am – 4pm Fund Manager Zain Malik, CFA
Members of Investment Committee
M. Shoaib, CFA
Muhammad Asad
Ali Asghar
Ali Khan, CFA, FRM
Ahmed Hassan, CFA
Asif Imtiaz, CFA Zain Malik, CFA Asmar Hamoodi, CFA Imad Ansari
Investment Objective: To seek maximum possible preservation of capital and
a reasonable rate of return
Fund Details:
Jan'17 Feb'17 MoM %
Net Assets (Rs mn) 8,890 8,924 0.39%
NAV Per Unit (Rs) 53.46 53.48 0.04%
Expense Ratio* 1.66%
*This includes 0.45% representing government levy, Worker's
Welfare Fund and SECP fee. (Annualized)
AAA 86.54% AA+ 5.58%
AA 0.58%
A+ 6.56%
Jan ’17 Feb ’17
Government Guaranteed 87% 86%
Cash 11% 13%
Other Including receivables 2% 1%
Asset Rating:
Portfolio: Salient Features
Annual Returns:
Performance - Annualized Returns:
Monthly Performance:
Asset Allocation:
Fund Net Assets:
Key Benefits
Maximum Preservation of Principal Investment
Primary Investments in securities issued by Government of Pakistan
Very Low Risk
Liquidity (Redemption on average in 2-3 working days)
Tax Credit as per tax laws
Investment Policy and Strategy
Investments in High Grade & Liquid avenues:
Minimum 70% Investment in Government backed / issued securities (rated „AAA‟)
Placements in top rated banks and financial institutions
Weighted Average Time to Maturity of Portfolio : Not more than 4 years
Benchmark Average return on 6-month Islamic bank deposits
Asset Allocation:
IN
CO
ME
SWWF Disclosure: The Fund has provided an amount of Rs.
16.61 million against Sindh Workers’ Welfare Fund (SWWF) Liability.
Had that not been provided, the NAV per unit/return for the period
would have been higher by Rs. 0.10 / 0.19%.
February, 2017
86%
13%1%
Government Guaranteed
Cash
Other Including receivables
-4%
0%
4%
8%
12%
16%
20%
Jul-1
6
Aug-1
6
Sep-1
6
Oct-1
6
Nov-1
6
Dec-1
6
Jan-1
7
Feb-1
7
MSF Benchmark

MEEZAN TAHAFFUZ PENSION FUND (MTPF)
Fund Review:
As at February 28, 2017, total size of net assets of Meezan Tahaffuz Pension Fund (MTPF) stood at Rs. 8,516 million. For the month of February,
the NAV of equity sub fund decreased by 0.72%, gold sub fund increased 2.85%, while the NAV of debt and money Market sub funds provided an
annualized return of 2.07% and 4.75% respectively.
Funds Details
Disclaimer This publication is for informational purpose only and nothing herein should be construed as a solicitation, recommendation or an offer to buy or sell any fund. All investments in mutual funds are subject to market
risk. The NAV based prices of units and any dividends/returns thereon are dependent on force and factors affecting the capital markets. These may go up or down based on market conditions. Past performance is not
necessarily indicative of future results. Performance data does not include cost incurred by investor in the form of sales-load etc. (This report has been prepared in line with MUFAP’s recommended Format)
AMC RATING AM2++ (STABLE OUTLOOK)
1M 3M 6M YTD 1Yr
3Yr 5Yr PSD* CAGR*
High Volatility -1% 11% 16% 22% 42% 94% 259% 439% 19%
Med. Volatility -0.3% 7% 11% 15% 28% 66% 176% 316% 16%
Low Volatility -0.03% 4% 7% 9% 17% 42% 107% 214% 13%
Lower Volatility 0.3% 1% 3% 3% 5% 18% 38% 111% 8%
MTPF – Gold** 3% 4% -4% -7% - - - -7% -
* Performance start date of June 28, 2007. CAGR since inception, ** Performance state of August 04, 2016,
^ NAV to NAV with dividend reinvested
Allocation Scheme Equity Debt Money Market
High Volatility 80% 20% 0%
Medium Volatility 50% 40% 10%
Low Volatility 25% 60% 15%
Lower Volatility 0% 50% 50%
FY16 FY15 FY14 FY13 FY12 FY11 FY10 FY09
MTPF- Equity 18.1% 26.6% 32.4% 54.9% 16.8% 36.0% 31.5% -25.8%
MTPF- Debt 4.5% 6.4% 7.7% 8.3% 9.5% 10.9% 8.5% 10.2%
MTPF- MMkt 4.0% 6.9% 6.9% 7.8% 10.9% 10.7% 8.5% 11.1%
Fund Type: Open End Risk Level Investor Dependent Launch Date 28-Jun-07 Trustee CDC Auditors Deloitte Yousuf Adil Registrar Meezan Bank Ltd. Fund Category Pension Management Fee 1.5% Front End Load 3% Leverage Nil AMC Rating AM2++
Rating Agency JCRVIS Pricing Mechanism Forward
Valuation Days Mon-Fri
Subscription/ Redemption Days
Mon-Fri 9am – 4pm
Fund Manager Asmar Hamoodi, CFA
Members of Investment Committee M. Shoaib, CFA
Ali Khan, CFA, FRM Ahmed Hassan, CFA Zain Malik, CFA Imad Ansari
Muhammad Asad Ahmed Hassan, CFA Asif Imtiaz, CFA Asmar Hamoodi, CFA Ali Asghar
Rs (Mn) Jan '17 Feb '17 MoM %
MTPF- Equity 5,581 5,537 -0.80%
MTPF- Debt 2,337 2,357 0.89%
MTPF- MMkt 572 578 1.08%
MTPF- Gold 43 44 2.34%
Total Fund 8,533 8,516 -0.19%
Rs Jan '17 Feb '17 MoM %
MTPF- Equity 625.67 621.18 -0.72%
MTPF- Debt 211.49 211.83 0.16%
MTPF- MMkt 208.90 209.66 0.36%
MTPF- Gold 90.66 93.24 2.85%
Investment Objective: To provide participants a regular Halal income stream
after retirement/disability when they can no longer
earn regular income to support their living so that they
are not dependent on other members of the society.
Fund Details:
NAV per unit:
Annual Returns:
(MTPF – Equity): Sector Allocation & Top Holdings (Feb’17)
MTPF Debt Sub Fund:
Sukuk Holdings – MTPF (MMKT Fund)
GoP Ijarah Sukuks XVIII 25.45%
GoP Ijarah Sukuks XVI 17.70%
GoP Ijarah Sukuks XVII 3.95%
Jan
'17
Feb
'17
Gold (%) 83.5 83.7
Cash (%) 14.1 14.0
Other Including receivables (%) 2.4 2.3
EQT DEBT
Expense Ratio* 3.14% 2.07%
MMKT Gold
Expense Ratio* 2.08% 2.91%
*This includes EQT 1.34%, Debt 0.46%, MMKT 0.44% and
Gold 0.22% representing government levy, Worker's
Welfare Fund and SECP fee (Annualized)
MTPF Money Market Sub Fund:
P
EN
SIO
N
Fund Net Assets:
MTPF - Allocation Schemes
SWWF Disclosure: The Fund has provided an amount of Rs. 41.57mn (Equity), Rs. 3.73 mn (Debt)
and Rs. 0.77mn (MMKT) against Sindh Workers’ Welfare Fund (SWWF) Liability. Had that not been
provided, the NAV per unit/return for the period would have been higher by Rs. 4.66/0.75% (Equity), Rs.
0.34/0.16% (Debt.) and Rs. 0.28/0.13 (MMKT).
Cement 22%
Oil & Gas Exploration Companies 17%
Fertilizer 14%
Power Generation & Distribution 9%
Paper & Board 8%
Other Sectors 25%
Cash & Others including receivable 5%
February, 2017
Assets Allocation: MTPF (Gold Fund)
Fund
Engro Corporation 8.45%
Packages Ltd. 6.84%
Lucky Cement Ltd. 6.73%
Mari Petroleum Ltd. 5.43%
The Hub Power Co. Ltd. 4.95%
Oil & Gas Development Co. Ltd. 4.74%
Engro Fertilizer Ltd. 4.34%
Pakistan State Oil Co. Ltd. 4.09%
Pioneer Cement Co. Ltd 3.99%
K-Electric Ltd. 3.88%
55.4%
3.3% 34.2%
7.0%
GoP Guaranteed Securities
Sukuk
Placement
Cash & Other Including receivables
47.1%
15.0%
37.9%
GoP Guaranteed Securities
Placement
Cash & Other Including receivables

KSE-MEEZAN INDEX FUND (KMIF)
AMC RATING AM2++ (STABLE OUTLOOK)
Fund Review:
As at February 28, 2017, the net assets of KSE-Meezan Index Fund (KMIF) stood at Rs. 1.17 billion. For the month of February, KMIF provided a
return of -0.41%.
Disclaimer This publication is for informational purpose only and nothing herein should be construed as a solicitation, recommendation or an offer to buy or sell any fund. All investments in mutual funds are subject to market
risk. The NAV based prices of units and any dividends/returns thereon are dependent on force and factors affecting the capital markets. These may go up or down based on market conditions. Past performance is not necessarily indicative of future results. Performance data does not include cost incurred by investor in the form of sales-load etc. (This report has been prepared in line with MUFAP’s recommended Format)
1M 3M 6M FYTD 1Yr 3Yr 5Yr PSD* CAGR
KMIF -0.4% 17.1% 19.8% 25.4% 53.5% 83.2% - 207.4% 26.5%
Benchmark -0.3% 17.0% 20.4% 26.3% 55.5% 94.9% - 245.0% 29.6%
* Performance start date of May 23, 2012. ^ NAV to NAV with dividend reinvested
FY16 FY15 FY14 FY13 FY12 FY11 FY10 FY09
KMIF 13.3% 17.1% 26.5% 49.6% -2.4%* - - -
Benchmark 15.5% 20.1% 29.9% 54.4% -1.9% - - -
* 38 days of operations.
Lucky Cement Ltd. 10% Pakistan Oilfields Ltd. 5%
Oil & Gas Development Co. Ltd. 9% Dawood Hercules 4%
Engro Corporation 9% The Searle Co. Ltd. 4%
The Hub Power Co. Ltd. 9% Engro Fertilizer Ltd. 4%
Pakistan Petroleum Ltd. 8% Fauji Cement Co.Ltd. 3%
Fund Type: Open End Risk Level High Launch Date 23-May-12 Trustee CDC
Auditors KPMG Taseer Hadi & Co.
Registrar Meezan Bank Ltd. Unit Types A and B Management Fee 1% Front End Load 2% Fund Category Index Tracker Scheme Back End Load Nil Leverage Nil Listing PSX AMC Rating AM2++
Rating Agency JCRVIS Pricing Mechanism Forward Benchmark KMI-30 Index Valuation Days Mon-Fri Subscription/ Redemption Days Mon-Fri 9am – 1pm Fund Manager Asmar Hamoodi, CFA
Members of Investment Committee
M. Shoaib, CFA
Muhammad Asad
Ali Asghar
Ali Khan, CFA, FRM
Ahmed Hassan, CFA
Asif Imtiaz, CFA Zain Malik, CFA Asmar Hamoodi, CFA Imad Ansari
Investment Objective: KSE Meezan Index Fund (KMIF) is a Shariah
Compliant Index Fund that aims to provide investors
an opportunity to track closely the performance of the
KSE-Meezan Index 30 (KMI 30) by investing in
companies of the Index in proportion to their
weightages.
Performance - Cumulative Returns:
Annual Returns:
Fund Net Assets:
Sector Allocation:
Fund Details:
SWWF Disclosure: The Fund has provided an amount of Rs. 8.24 million against Sindh Workers’ Welfare Fund (SWWF) Liability. Had that not been provided, the NAV per
unit/return for the period would have been higher by Rs. 0.70 / 0.71%.
Jan '17 Feb '17 MoM %
Net Assets (Rs mn) 1,181 1,167 -1.17%
NAV Per Unit (Rs) 99.33 98.92 -0.41%
Expense Ratio* 3.01%
*This includes 1.24% representing government levy, Worker's
Welfare Fund and SECP fee.
Jan '17 Feb '17
Equity (%) 98.1 97.9
Cash (%) 1.6 1.6
Other Including receivables (%) 0.3 0.5
IN
DEX
TR
AC
KER
Fund’s Performance:
Top Ten Equity Holdings:(% of Total Assets):
Assets Allocation:
February, 2017
19%11%
24%
18%5%
23%
Cement
Power Generation & Distribution
Oil & Gas Exploration Companies
Fertilizer
Oil & Gas Marketing Companies
Others
90
110
130
150
170
190
210
230
250
270
290
310
330
350
370M
ay-1
2
Jul-1
2
Sep-1
2
Nov-1
2
Jan-1
3
Mar-1
3
Apr-1
3
Jun-1
3
Aug-1
3
Oct-1
3
Dec-1
3
Feb-1
4
Mar-1
4
May-1
4
Jul-1
4
Sep-1
4
Nov-1
4
Jan-1
5
Mar-1
5
Apr-1
5
Jun-1
5
Aug-1
5
Oct-1
5
Dec-1
5
Feb-1
6
Mar-1
6
May-1
6
Jul-1
6
Sep-1
6
Nov-1
6
Jan-1
7
Feb-1
7
KMIF Benchmark

MEEZAN FINANCIAL PLANNING FUND OF FUNDS (MFPFOF)
Fund Review:
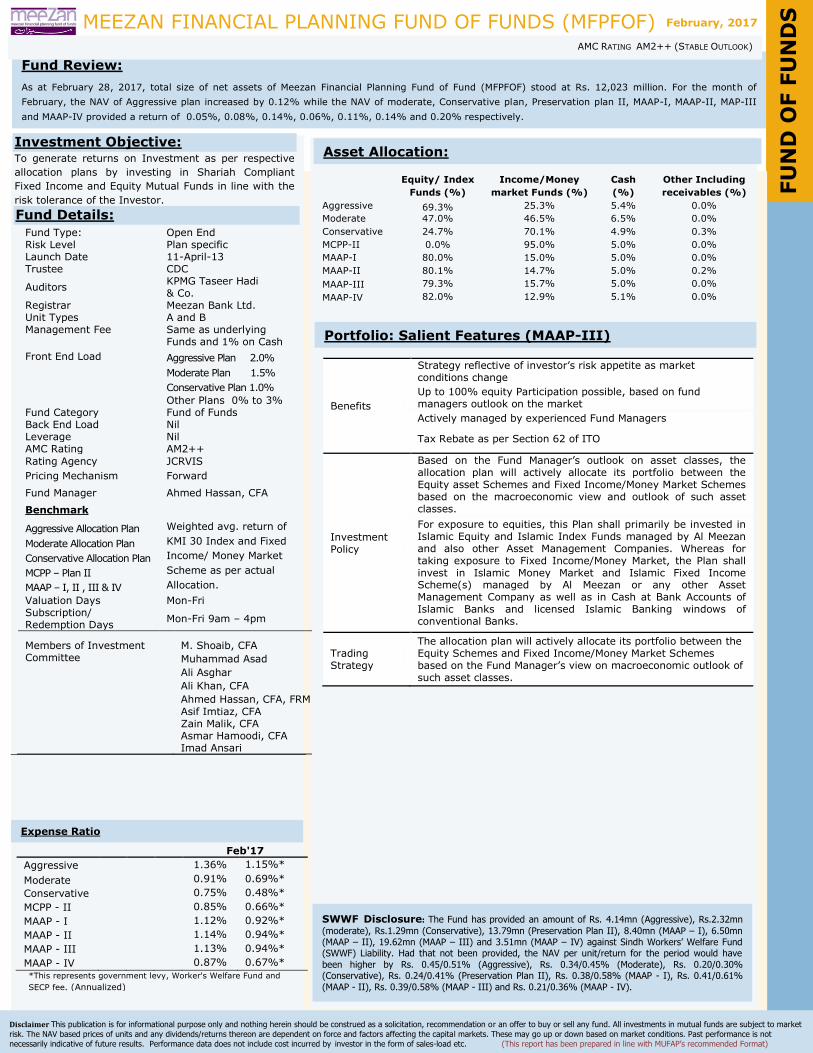
As at February 28, 2017, total size of net assets of Meezan Financial Planning Fund of Fund (MFPFOF) stood at Rs. 12,023 million. For the month of
February, the NAV of Aggressive plan increased by 0.12% while the NAV of moderate, Conservative plan, Preservation plan II, MAAP-I, MAAP-II, MAP-III
and MAAP-IV provided a return of 0.05%, 0.08%, 0.14%, 0.06%, 0.11%, 0.14% and 0.20% respectively.
Funds Details
Disclaimer This publication is for informational purpose only and nothing herein should be construed as a solicitation, recommendation or an offer to buy or sell any fund. All investments in mutual funds are subject to market
risk. The NAV based prices of units and any dividends/returns thereon are dependent on force and factors affecting the capital markets. These may go up or down based on market conditions. Past performance is not
necessarily indicative of future results. Performance data does not include cost incurred by investor in the form of sales-load etc. (This report has been prepared in line with MUFAP’s recommended Format)
AMC RATING AM2++ (STABLE OUTLOOK)
1M 3M 6M FYTD 1Yr 3Yr 5Yr PSD*
Aggressive 0.1% 10.0% 14.9% 20.3% 38.7% 72.8% - 111.2%
Benchmark -0.1% 11.7% 14.2% 18.4% 37.8% 67.2% 107.3%
Moderate 0.1% 7.1% 11.4% 15.4% 28.0% 55.9% - 82.3%
Benchmark 0.02% 8.9% 11.1% 14.2% 27.8% 55.3% 87.5%
Conservative 0.1% 4.6% 8.0% 10.5% 17.5% 38.5% - 54.4%
Benchmark 0.2% 5.0% 6.6% 8.3% 15.4% 31.6% 47.9%
MCPP – II*** 0.1% 5.5% 9.3% 12.7% 19.7% - - 20.5%
Benchmark 0.3% 7.0% 8.9% 11.3% 17.7% - - 19.9%
MAAP – I**** 0.1% 11.3% 17.2% 23.5% 45.5% - - 37.9%
Benchmark -0.1% 13.8% 17.3% 22.7% 46.7% - - 41.0%
MAAP – II***** 0.1% 11.0% 16.4% 22.5% 43.7% - - 40.7%
Benchmark -0.2% 13.4% 16.8% 22.0% 45.3% - - 44.3%
MAAP – III# 0.1% 11.0% 16.4% 22.5% 40.4% - - 39.0%
Benchmark -0.2% 13.6% 17.0% 22.3% 42.6% - - 43.2%
MAAP – IV## 0.2% 11.5% 17.0% 21.3% - - - 22.2%
Benchmark -0.2% 13.5% 16.8% 20.5% - - - 21.0%
* Performance start date of April 12, 2013. *** Performance start date of December 16, 2014. **** Performance start date of
July 10, 2015, ***** Performance start date of November 24, 2015. ^ NAV to NAV with dividend reinvested
# Performance start date of January 26, 2016, ## Performance start date of May 24, 2016.
FY16 FY15 FY14 FY13 FY12 FY11 FY10 FY09
Aggressive 13.3% 16.5% 22.1% 9.0%* - - - -
Benchmark 11.7% 15.1% 21.7% 7.9% - - - -
Moderate 11.3% 13.6% 17.3% 6.5%* - - - -
Benchmark 10.0% 12.9% 18.2% 6.2% - - - -
Conservative 8.7% 10.1% 12.6% 3.8%* - - - -
Benchmark 6.7% 8.6% 11.2% 3.6% - - - -
MCPP – II2 6.5% 0.4%*** - - - - - -
Benchmark 5.6% 2.0% - - - - - -
MAAP - I3 11.7% - - - - - - -
Benchmark 14.9% - - - - - - -
MAAP - II4 14.8% - - - - - - -
Benchmark 18.3% - - - - - - -
MAAP – III5 13.5% - - - - - - -
Benchmark 17.1% - - - - - - -
MAAP – IV6 0.7% - - - - - - -
Benchmark 0.4% - - - - - - -
* 80 days of operations, , 2 196 days of operations, 3 356 days of operation, 4 219 days of operation, 5 156 days of operation, 6 37 days of operation.
Rs Jan '17 Feb '17 MoM%
Aggressive 88.15 88.26 0.12%
Moderate 75.37 75.41 0.05%
Conservative 67.02 67.08 0.08%
MCPP - II 57.07 57.15 0.14%
MAAP - I 66.67 66.71 0.06%
MAAP - II 67.01 67.09 0.11%
MAAP - III 66.11 66.20 0.14%
MAAP - IV 58.63 58.75 0.20%
Fund Type: Open End Risk Level Plan specific Launch Date 11-April-13 Trustee CDC
Auditors KPMG Taseer Hadi & Co.
Registrar Meezan Bank Ltd. Unit Types A and B Management Fee Same as underlying
Funds and 1% on Cash
Front End Load Aggressive Plan 2.0%
Moderate Plan 1.5%
Conservative Plan 1.0%
Other Plans 0% to 3% Fund Category Fund of Funds Back End Load Nil Leverage Nil AMC Rating AM2++
Rating Agency JCRVIS
Pricing Mechanism Forward
Fund Manager Ahmed Hassan, CFA
Benchmark
Aggressive Allocation Plan Weighted avg. return of KMI 30 Index and Fixed Income/ Money Market Scheme as per actual allocation.
Moderate Allocation Plan
Conservative Allocation Plan
MCPP – Plan II
MAAP – I, II, III & IV
Valuation Days Mon-Fri Subscription/ Redemption Days
Mon-Fri 9am – 4pm
Members of Investment Committee
M. Shoaib, CFA
Muhammad Asad
Ali Asghar
Ali Khan, CFA
Ahmed Hassan, CFA, FRM
Asif Imtiaz, CFA Zain Malik, CFA Asmar Hamoodi, CFA Imad Ansari
Investment Objective: To generate returns on Investment as per respective
allocation plans by investing in Shariah Compliant
Fixed Income and Equity Mutual Funds in line with the
risk tolerance of the Investor.
Fund Details:
NAV per unit:
Annual Returns:
Fund Net Assets:
MFPFOF - Allocation Plan:
FU
ND
OF F
UN
DS
February, 2017
Rs (Mn) Jan '17 Feb '17 MoM %
Aggressive 784 860 9.71%
Moderate 687 514 -25.23%
Conservative 506 426 -15.71%
MCPP - II 3,340 3,344 0.13%
MAAP - I 1,463 1,460 -0.24%
MAAP - II 1,080 1,073 -0.60%
MAAP - III 3,370 3,367 -0.09%
MAAP - IV 1,005 978 -2.70%
Funds Multiplier:
MCPP-II
High Multiplier 0.00
Low Multiplier 0.00
(to be contd..)
MEEZAN FINANCIAL PLANNING FUND OF FUNDS (MFPFOF)
Fund Review:
As at February 28, 2017, total size of net assets of Meezan Financial Planning Fund of Fund (MFPFOF) stood at Rs. 12,023 million. For the month of
February, the NAV of Aggressive plan increased by 0.12% while the NAV of moderate, Conservative plan, Preservation plan II, MAAP-I, MAAP-II, MAP-III
and MAAP-IV provided a return of 0.05%, 0.08%, 0.14%, 0.06%, 0.11%, 0.14% and 0.20% respectively.
Funds Details
Disclaimer This publication is for informational purpose only and nothing herein should be construed as a solicitation, recommendation or an offer to buy or sell any fund. All investments in mutual funds are subject to market
risk. The NAV based prices of units and any dividends/returns thereon are dependent on force and factors affecting the capital markets. These may go up or down based on market conditions. Past performance is not
necessarily indicative of future results. Performance data does not include cost incurred by investor in the form of sales-load etc. (This report has been prepared in line with MUFAP’s recommended Format)
AMC RATING AM2++ (STABLE OUTLOOK)
Equity/ Index
Funds (%)
Income/Money
market Funds (%)
Cash
(%)
Other Including
receivables (%)
Aggressive 69.3% 25.3% 5.4% 0.0%
Moderate 47.0% 46.5% 6.5% 0.0%
Conservative 24.7% 70.1% 4.9% 0.3%
MCPP-II 0.0% 95.0% 5.0% 0.0%
MAAP-I 80.0% 15.0% 5.0% 0.0%
MAAP-II 80.1% 14.7% 5.0% 0.2%
MAAP-III 79.3% 15.7% 5.0% 0.0%
MAAP-IV 82.0% 12.9% 5.1% 0.0%
Fund Type: Open End Risk Level Plan specific Launch Date 11-April-13 Trustee CDC
Auditors KPMG Taseer Hadi & Co.
Registrar Meezan Bank Ltd. Unit Types A and B Management Fee Same as underlying
Funds and 1% on Cash
Front End Load Aggressive Plan 2.0%
Moderate Plan 1.5%
Conservative Plan 1.0%
Other Plans 0% to 3% Fund Category Fund of Funds Back End Load Nil Leverage Nil AMC Rating AM2++
Rating Agency JCRVIS
Pricing Mechanism Forward
Fund Manager Ahmed Hassan, CFA
Benchmark
Aggressive Allocation Plan Weighted avg. return of
KMI 30 Index and Fixed
Income/ Money Market
Scheme as per actual
Allocation.
Moderate Allocation Plan
Conservative Allocation Plan
MCPP – Plan II
MAAP – I, II , III & IV
Valuation Days Mon-Fri Subscription/ Redemption Days
Mon-Fri 9am – 4pm
Members of Investment Committee
M. Shoaib, CFA
Muhammad Asad
Ali Asghar
Ali Khan, CFA
Ahmed Hassan, CFA, FRM
Asif Imtiaz, CFA Zain Malik, CFA Asmar Hamoodi, CFA Imad Ansari
Investment Objective: To generate returns on Investment as per respective
allocation plans by investing in Shariah Compliant
Fixed Income and Equity Mutual Funds in line with the
risk tolerance of the Investor.
Fund Details:
Asset Allocation:
FU
ND
OF F
UN
DS
SWWF Disclosure: The Fund has provided an amount of Rs. 4.14mn (Aggressive), Rs.2.32mn
(moderate), Rs.1.29mn (Conservative), 13.79mn (Preservation Plan II), 8.40mn (MAAP – I), 6.50mn (MAAP – II), 19.62mn (MAAP – III) and 3.51mn (MAAP – IV) against Sindh Workers’ Welfare Fund (SWWF) Liability. Had that not been provided, the NAV per unit/return for the period would have
been higher by Rs. 0.45/0.51% (Aggressive), Rs. 0.34/0.45% (Moderate), Rs. 0.20/0.30% (Conservative), Rs. 0.24/0.41% (Preservation Plan II), Rs. 0.38/0.58% (MAAP - I), Rs. 0.41/0.61%
(MAAP - II), Rs. 0.39/0.58% (MAAP - III) and Rs. 0.21/0.36% (MAAP - IV).
February, 2017
Portfolio: Salient Features (MAAP-III)
Benefits
Strategy reflective of investor‟s risk appetite as market conditions change
Up to 100% equity Participation possible, based on fund managers outlook on the market
Actively managed by experienced Fund Managers
Tax Rebate as per Section 62 of ITO
Investment Policy
Based on the Fund Manager‟s outlook on asset classes, the allocation plan will actively allocate its portfolio between the Equity asset Schemes and Fixed Income/Money Market Schemes based on the macroeconomic view and outlook of such asset classes.
For exposure to equities, this Plan shall primarily be invested in Islamic Equity and Islamic Index Funds managed by Al Meezan and also other Asset Management Companies. Whereas for taking exposure to Fixed Income/Money Market, the Plan shall invest in Islamic Money Market and Islamic Fixed Income Scheme(s) managed by Al Meezan or any other Asset Management Company as well as in Cash at Bank Accounts of Islamic Banks and licensed Islamic Banking windows of conventional Banks.
Trading Strategy
The allocation plan will actively allocate its portfolio between the Equity Schemes and Fixed Income/Money Market Schemes based on the Fund Manager‟s view on macroeconomic outlook of such asset classes.
Feb'17
Aggressive 1.36% 1.15%*
Moderate 0.91% 0.69%*
Conservative 0.75% 0.48%*
MCPP - II 0.85% 0.66%*
MAAP - I 1.12% 0.92%*
MAAP - II 1.14% 0.94%*
MAAP - III 1.13% 0.94%*
MAAP - IV 0.87% 0.67%*
*This represents government levy, Worker's Welfare Fund and
SECP fee. (Annualized)
Expense Ratio

asdf
January, 2016
MEEZAN GOLD FUND (MGF)
Fund Review:
Net assets of Meezan Gold Fund (MGF) as at February 28, 2017 stood at Rs. 381 million. The fund‟s NAV increased by 2.95% during the month.
Funds Details
Disclaimer This publication is for informational purpose only and nothing herein should be construed as a solicitation, recommendation or an offer to buy or sell any fund. All investments in mutual funds are subject to market
risk. The NAV based prices of units and any dividends/returns thereon are dependent on force and factors affecting the capital markets. These may go up or down based on market conditions. Past performance is not necessarily indicative of future results. Performance data does not include cost incurred by investor in the form of sales-load etc. (This report has been prepared in line with MUFAP’s recommended Format)
AMC RATING AM2++ (STABLE OUTLOOK)
1M 3M 6M FYTD 1Yr 3Yr 5Yr PSD*
MGF 2.9% 4.2% -3.9% -4.7% 0.3% - - 5.4%
Benchmark 2.7% 3.2% -1.7% -1.7% 3.1% - - 13.7% * Performance start date of Aug 13, 2015, ^ NAV to NAV with dividend reinvested
FY16 FY15 FY14 FY13 FY12 FY11 FY10 FY09
MGF 10.5%* - - - - - - -
Benchmark 16.0% - - - - - - -
* 322 days of operations.
Jan '17 Feb '17
Gold (%) 87.5 88.0
Cash (%) 6.7 11.8
Other Including receivables (%) 5.8 0.2
Fund Type: Open End Risk Level High Launch Date 13-Aug-15 Trustee CDC
Auditors KPMG Taseer Hadi & Co.
Registrar Meezan Bank Ltd. Unit Types C Management Fee 1% Front End Load 2% Fund Category Commodity Fund Back End Load Nil Benchmark Combination of 70%
PKR base closing price of physical gold and 30% 3 Month average deposit rates of 3 AA rated Islamic Banks
Leverage Nil Listing PSX AMC Rating AM2++
Rating Agency JCRVIS Pricing Mechanism Forward Valuation Days Mon-Fri Subscription/ Redemption Days Mon-Fri 9am – 4pm Fund Manager Ali Khan, CFA, FRM
Members of Investment Committee
M. Shoaib, CFA
Muhammad Asad
Ali Asghar
Ali Khan, CFA, FRM
Ahmed Hassan, CFA
Asif Imtiaz, CFA Zain Malik, CFA Asmar Hamoodi, CFA Imad Ansari
Investment Objective: “Meezan Gold Fund (MGF)” aims to provide maximum
exposure to prices of Gold in a Shariah Compliant
(Islamic) manner, by investing a significant portion of
the Fund‟s net assets in deliverable gold based
contracts available on Pakistan Mercantile Exchange
(PMEX).”
Fund Details:
Jan ’17 Feb '17 MoM %
Net Assets (Rs mn) 381 381 0.06%
NAV Per Unit (Rs) 50.49 51.98 2.95%
Expense Ratio* 2.56%
*This includes 0.16% representing government levy, Worker's
Welfare Fund and SECP fee. (Annualized)
Annual Returns:
Performance - Cumulative Returns (net of expenses):
Fund Net Assets:
February, 2017
GO
LD F
UN
D
Portfolio: Salient Features
Key Advantages
Fully Shariah Compliant means of investing in gold
Efficient Store of value, thereby providing investors the opportunity to invest in a high priced (valuable) commodity through unit certificates (mutual funds)
Tracks price performance of gold
Maximum exposure to gold prices
Good hedge against Inflation
Investment Strategy
MGF, in line with its Investment Objectives, will invest in Authorized Investments as approved by the Shariah Advisor
To meet Fund‟s investment objective, at least seventy percent (70%) of Fund‟s net assets, will remain invested in deliverable gold based contracts available at a Commodity Exchange, during the year based on quarterly average investment calculated on daily basis.
Remaining net assets of the Fund shall be invested in cash and near cash instruments which include cash in bank accounts of Islamic banks and licensed Islamic banking windows of conventional banks (excluding TDR). However, at least 10% of the net assets of the Fund shall remain invested in cash and near cash instruments at all times.
Weighted Average Time to Maturity of Portfolio : Not more than 4 years
Investment Horizon Long term (Investors are advised to take a long term view of a minimum of 3 to 5 years)
Assets Allocation:
SWWF Disclosure: The Fund has provided an amount of Rs. 0.53 million against Sindh
Workers’ Welfare Fund (SWWF) Liability. Had that not been provided, the NAV per unit/return for
the period would have been higher by Rs. 0.07 / 0.14%.

MEEZAN ENERGY FUND (MEF)
Fund Review:
Net assets of Meezan Energy Fund (MEF) as at February 28, 2017 stood at Rs. 691 million. The fund‟s NAV decreased by 0.34% during the
month.
Funds Details
Disclaimer This publication is for informational purpose only and nothing herein should be construed as a solicitation, recommendation or an offer to buy or sell any fund. All investments in mutual funds are subject to market
risk. The NAV based prices of units and any dividends/returns thereon are dependent on force and factors affecting the capital markets. These may go up or down based on market conditions. Past performance is not necessarily indicative of future results. Performance data does not include cost incurred by investor in the form of sales-load etc. (This report has been prepared in line with MUFAP’s recommended Format)
AMC RATING AM2++ (STABLE OUTLOOK)
1M 3M 6M FYTD 1Yr 3Yr 5Yr PSD*
MEF -0.3% 9.2% - 9.2% - - - 9.2%
Benchmark -0.3% 17.0% - 16.3% - - - 16.3%
* Performance start date of November 29, 2006, ^ NAV to NAV with dividend reinvested
FY16 FY15 FY14 FY13 FY12 FY11 FY10 FY09
MEF - - - - - - - -
Benchmark - - - - - - - -
Sui Northern Gas Pipelines Ltd. 13% Hi-Tech Lubricants Ltd. 6%
Oil & Gas Development Co. Ltd. 9% Hub Power Co. Ltd. 6%
Pakistan Oilfields Ltd. 8% Sui Southern Gas Co. Lid. 4%
K-Electric Ltd. 8% Pakistan State Oil Co. Ltd. 4%
Mari Petroleum Ltd. 7% Hascol Petroleum Ltd. 4%
Fund Type: Open End Risk Level High Launch Date 29th Nov 2016 Trustee CDC
Auditors KPMG Taseer Hadi & Co.
Registrar Meezan Bank Ltd. Unit Types A, B and C Management Fee 2% Front End Load 3% Fund Category Sector (Equity) Scheme
Back End Load Nil Benchmark KMI-30 Leverage Nil Listing To be listed on PSX AMC Rating AM2++
Rating Agency JCRVIS Pricing Mechanism Forward Valuation Days Mon-Fri Subscription/ Redemption Days Mon-Fri 9am – 4pm Fund Manager Ahmed Hassan, CFA
Members of Investment Committee
M. Shoaib, CFA
Muhammad Asad
Ali Asghar
Ali Khan, CFA, FRM
Ahmed Hassan, CFA
Asif Imtiaz, CFA Zain Malik, CFA Asmar Hamoodi, CFA Imad Ansari
Investment Objective:
To seek long term capital appreciation through
investments in Shariah compliant equity stocks,
primarily from the energy sector / segment / industry,
as defined in the constitutive documents.
Fund Details:
Jan '17 Feb '17 MoM %
Net Assets (Rs mn) 742 691 -6.91%
NAV Per Unit (Rs) 54.77 54.58 -0.34%
Equity (%) 76.38
Cash (%) 12.50
Other receivables (%) 11.12
Expense Ratio* 2.63%
*This includes 0.63% representing government levy, Worker's
Welfare Fund and SECP fee. (Annualized)
adf
Fund Net Assets:
Top Ten Equity Holdings: (% of Total Assets):
Annual Returns:
Performance - Cumulative Returns:
Portfolio: Salient Features
Sector Allocation:
Asset Allocation:
SWWF Disclosure: The Fund has provided an amount of Rs. 1.18 million against Sindh Workers’
Welfare Fund (SWWF) Liability. Had that not been provided, the NAV per unit/return for the period
would have been higher by Rs. 0.09 / 0.17%.
February, 2017
Benefits
Up to 100% equity Participation possible in energy sector, based on
fund managers outlook on the market
Participation in a mature sector that is envisioned to benefit from the
Flagship CPEC projects.
Actively managed by experienced Fund Managers
Tax Rebate as per Section 62 of ITO
Investment
Policy
MEF shall primarily invest in Shariah compliant equity securities of the
energy sector / segment / Industry as defined in the offering document.
In case the fund manager expects the stock market to drop, based on
his analysis of macroeconomic factors such as interest rates, economic
growth rates, political climate, corporate earnings, stock market
valuations, etc, portfolio may be temporarily allocated to other allowable
asset classes, subject to the prescribed limits. While making stock
selection decisions, fundamental and technical models will be employed
and qualitative and quantitative analysis will be conducted to identify
undervalued stocks.
28%
32%
14%3%
23%
Oil & Gas Exploration Companies
Oil & Gas Marketing Companies
Power Generation & Distribution
Refinery
Others

MEEZAN STRATEGIC ALLOCATION FUND
Fund Review:
As at February 31, 2017, total size of net assets of Meezan Strategic Allocation Fund (MSAF) stood at Rs. 4.58 billion. For the month of February, the NAV
of Meezan Strategic Allocation Plan- I (MSAP-I) increased by 0.15%, Meezan Strategic Allocation Plan- II (MSAP-II) decreased by 0.35% and Meezan
Strategic Allocation Plan- III (MSAP-II) decreased by 0.32% respectively.
Funds Details
Disclaimer This publication is for informational purpose only and nothing herein should be construed as a solicitation, recommendation or an offer to buy or sell any fund. All investments in mutual funds are subject to market
risk. The NAV based prices of units and any dividends/returns thereon are dependent on force and factors affecting the capital markets. These may go up or down based on market conditions. Past performance is not
necessarily indicative of future results. Performance data does not include cost incurred by investor in the form of sales-load etc. (This report has been prepared in line with MUFAP’s recommended Format)
AMC RATING AM2++ (STABLE OUTLOOK)
1M 3M 6M FYTD 1Yr 3Yr 5Yr PSD*
MSAP-I* 0.1% 8.8% - 12.7% - - - 12.7%
Benchmark -0.2% 9.3% - 13.4% - - - 13.4%
MSAP-II** -0.3% - - 2.2% - - - 2.2%
Benchmark -0.2% - - 2.1% - - - 2.1%
MSAP-III** -0.3% - - -0.3% - - - -0.3%
Benchmark 0.1% - - 0.1% - - - 0.1%
* Performance start date of October 19, 2016. ** Performance start date of December 21, 2016. ***
Performance start date of February 16, 2016. ^ NAV to NAV with dividend reinvested
FY16 FY15 FY14 FY13 FY12 FY11 FY10 FY09
MSAP-I - - - - - - - -
Benchmark - - - - - - - -
MSAP-II - - - - - - - -
Benchmark - - - - - - - -
MSAP-III - - - - - - - -
Benchmark - - - - - - - -
Equity/ Index
Funds (%)
Income/Money
market Funds (%)
Cash
(%)
Other Including
receivables (%)
MSAP I 79.8% 15.2% 4.9% 0.1%
MSAP II 76.2% 18.8% 4.8% 0.2%
MSAP III 40.1% 7.2% 52.7% 0.0%
Fund Type: Open End Risk Level Low to Moderate
Launch Date 19-Oct-16 (MSAP I) 21-Dec-16 (MSAP II) 16-Feb-17 (MSAP III)
Trustee CDC
Auditors KPMG Taseer Hadi & Co.
Registrar Meezan Bank Ltd. Unit Types B and C Management Fee Nil (1% if investment
is made in CIS of other AMCs)
Front End Load 3% Fund Category Fund of Funds
Back End/Contingent Load
Contingent Load of 3% if redeemed within one year of close of Initial Subscription Period. Nil after one year.
Benchmark Weighted avg. return of KMI 30 Index and Fixed Income/ Money Market Scheme as per actual allocation.
Leverage Nil Listing - AMC Rating AM2++
Rating Agency JCRVIS Pricing Mechanism Forward Valuation Days Mon-Fri Subscription/ Redemption Days Mon-Fri 9am – 4pm Fund Manager Ahmed Hassan, CFA
Members of Investment Committee M. Shoaib, CFA
M. Shoaib, CFA
Muhammad Asad
Ali Asghar
Ali Khan, CFA, FRM
Ahmed Hassan, CFA
Asif Imtiaz, CFA Zain Malik, CFA Asmar Hamoodi, CFA Imad Ansari
Investment Objective: To actively allocate its portfolio between the equity
schemes and fixed income/money market schemes
based on the macroeconomic view of the fund manager
on such asset classes.
Fund Details:
Annual Returns:
Fund Net Assets:
Performance - Cumulative Returns:
FU
ND
OF F
UN
DS
February, 2017
Rs (Mn) Jan '17 Feb '17 MoM %
MSAP I 2,798 2,779 -0.66%
MSAP II 1,316 1,746 32.74%
MSAP III 58
Portfolio: Salient Features
Benefits
Strategy reflective of investor‟s risk appetite as market
conditions change
Up to 100% equity Participation possible, based on fund
managers outlook on the market
Actively managed by experienced Fund Managers
Tax Rebate as per Section 62 of ITO
Investment Policy
Based on the Fund Manager‟s outlook on asset classes, the
allocation plan will actively allocate its portfolio between the
Equity asset Schemes and Fixed Income/Money Market Schemes
based on the macroeconomic view and outlook of such asset
classes.
For exposure to equities, this Plan shall primarily be invested in
Islamic Equity and Islamic Index Funds managed by Al Meezan
and also other Asset Management Companies. Whereas for
taking exposure to Fixed Income/Money Market, the Plan shall
invest in Islamic Money Market and Islamic Fixed Income
Scheme(s) managed by Al Meezan or any other Asset
Management Company as well as in Cash at Bank Accounts of
Islamic Banks and licensed Islamic Banking windows of
conventional Banks.
Trading Strategy
The allocation plan will actively allocate its portfolio between the Equity Schemes and Fixed Income/Money Market Schemes based on the Fund Manager‟s view on macroeconomic outlook of such asset classes.
Assets Allocation:
NAV per unit:
Rs Jan '17 Feb '17 MoM %
MSAP I 56.26 56.34 0.15%
MSAP II 51.25 51.08 -0.35%
MSAP III 49.84
Expense Ratio
Feb'17
MSAP I 0.81% 0.63%*
MSAP II 0.41% 0.25%*
MSAP III 0.33% 0.06%*
*This represents government levy, Worker's Welfare Fund and SECP fee.
(Annualized)
SWWF Disclosure: The Fund has provided an amount of Rs. 6.39mn (MSAP - I) and
0.75mn (MSAP - II) against Sindh Workers’ Welfare Fund (SWWF) Liability. Had that not been
provided, the NAV per unit/return for the period would have been higher by Rs. 0.13 / 0.23%
(MSAP - I) and Rs. 0.02 / 0.04% (MSAP - II).

Fund Review:
Net assets of Meezan Asset Allocation Fund (MAAF) as at February 28, 2017 stood at Rs. 1.42 billion. The fund‟s NAV increased by 0.72% during
the month.
Funds Details
Disclaimer This publication is for informational purpose only and nothing herein should be construed as a solicitation, recommendation or an offer to buy or sell any fund. All investments in mutual funds are subject to market
risk. The NAV based prices of units and any dividends/returns thereon are dependent on force and factors affecting the capital markets. These may go up or down based on market conditions. Past performance is not necessarily indicative of future results. Performance data does not include cost incurred by investor in the form of sales-load etc. (This report has been prepared in line with MUFAP’s recommended Format)
1M 3M 6M FYTD 1Yr 3Yr 5Yr PSD*
MAAF 0.7% 14.8% 20.2% 24.2% - - - 27.6%
Benchmark -0.2% 14.8% 17.9% 21.3% - - - 27.6%
* Performance start date of Apr 18, 2016, ^ NAV to NAV with or without dividend reinvested
FY16 FY15 FY14 FY13 FY12 FY11 FY10 FY09
MAAF 2.8%* - - - - - - -
Benchmark 5.0% - - - - - - -
* 37 days of operations.
*
Engro Corporation 8% Oil & Gas Development Co. Ltd. 4%
Sui Northern Gas Pipelines Ltd. 6% DG Khan Cement Ltd. 3%
Lucky Cement Ltd. 6% Packages Ltd. 3%
K-Electric Ltd. 6% ICI Pakistan Limited 3%
Engro Fertilizer 4% Maple Leaf Cement Ltd. 3%
Fund Type: Open End Risk Level Low to Moderate Launch Date 18-Apr-2016 Trustee CDC
Auditors KPMG Taseer Hadi & Co.
Registrar Meezan Bank Ltd. Management Fee 1.5% Fund Category Asset Allocation Front End Load 3% Back End Load Nil Leverage Nil Listing - AMC Rating AM2++
Rating Agency JCRVIS
Pricing Mechanism Forward
Valuation Days Mon-Fri
Subscription/ Redemption Days Mon-Fri 9am – 4pm
Benchmark Weighted avg. return of KMI 30 Index and Fixed Income/ Money Market Scheme as per actual allocation.
Fund Manager Ahmed Hassan, CFA
Members of Investment Committee
M. Shoaib, CFA
Muhammad Asad
Ali Asghar
Ali Khan, CFA, FRM
Ahmed Hassan, CFA
Asif Imtiaz, CFA Zain Malik, CFA Asmar Hamoodi, CFA Imad Ansari
Fund Details:
Annual Returns:
Performance - Cumulative Returns:
Fund Net Asset:
MEEZAN ASSET ALLOCATION FUND (MAAF)
FUNDma(MBF) AMC RATING AM2++ (STABLE OUTLOOK)
Jan '17 Feb '17 MoM %
Net Assets (Rs mn) 1,181 1,422 20.38%
NAV Per Unit (Rs) 62.97 63.42 0.72%
Expense Ratio* 3.73%
*This includes 0.30% representing government levy, Worker's
Welfare Fund and SECP fee. (Annualized)
February, 2017
A
SSET
ALL
OCA
TIO
N
Assets Allocation:
Jan '17 Feb '17
Equity (%) 72.7 74.7
Money Market (%) 0.0 0.0
Cash (%) 26.8 24.6
Other Including receivables (%) 0.5 0.7
Investment Objective: The objective of Meezan Asset Allocation Fund (MAAF)
is to earn a potentially high return through asset
allocation between Shariah Compliant Equity
Instruments, Shariah Compliant Fixed Income
Instruments, Shariah Compliant Money Market
Instruments and any other Shariah Compliant
instrument as permitted by the SECP and Shariah
Advisor.
Top Ten Equity Holdings: (% of Total Assets):
Sector Allocation:
Fund’s Performance:
SWWF Disclosure: The Fund has provided an amount of Rs. 5.90 million against Sindh Workers’ Welfare
Fund (SWWF) Liability. Had that not been provided, the NAV per unit/return for the period would have been
higher by Rs. 0.26 / 0.42%.
16%
9%
12%
14%
7%
42%
Cement
Oil & Gas Exploration Companies
Oil & Gas Marketing Companies
Fertilizer
Power Generation & Distribution
Others
49.00
51.00
53.00
55.00
57.00
59.00
61.00
63.00
65.00
67.00
20-A
pr
16-M
ay
9-J
un
12-J
ul
5-A
ug
31-A
ug
30-S
ep
27-O
ct
22-N
ov
19-D
ec
12-J
an
7-F
eb
MAAF Benchmark
28-F
eb

Fund Review:
Net assets of Meezan Balanced Fund (MBF) as at February 28, 2017 stood at Rs. 8.49 billion. The fund‟s NAV increased by 0.15% during the
month.
Funds Details
Disclaimer This publication is for informational purpose only and nothing herein should be construed as a solicitation, recommendation or an offer to buy or sell any fund. All investments in mutual funds are subject to market
risk. The NAV based prices of units and any dividends/returns thereon are dependent on force and factors affecting the capital markets. These may go up or down based on market conditions. Past performance is not necessarily indicative of future results. Performance data does not include cost incurred by investor in the form of sales-load etc. (This report has been prepared in line with MUFAP’s recommended Format)
1M 3M 6M
FYTD 1Yr 3Yr 5Yr PSD* CAGR*
MBF 0.2% 10% 13% 18% 33% 66% 155% 576% 17%
Benchmark -0.1% 10% 12% 15% 31% 55% 134% 427% 15%
* Performance start date of Dec 20, 2004, CAGR since inception, ^ NAV to NAV with dividend reinvested
FY16 FY15 FY14 FY13 FY12 FY11 FY10 FY09
MBF 12% 16% 20% 32% 17% 25% 23% -11%
Benchmark 10% 13% 18% 30% 10% 25% 21% -15%
*
Equity
Sukuk
Engro Corporation 5% K-Electric Sukuk 3 5%
Lucky Cement Co. Ltd. 4% Hascol Sukuk 3%
Hub Power Co. Ltd. 4% GoP Ijarah Sukuk XVIII 3%
Packages Ltd. 4% GoP Ijarah Sukuk XVII 1%
Oil & Gas Development Co. Ltd. 2% Fatima Fertilizer Sukuk 1%
Jan ’17 Feb ’17 Equity 55% 52%
GoP Guaranteed Securities 2% 4%
Sukuk 11% 10%
Placements with Banks and DFIs 6% 9%
Cash Others including receivable 26% 25%
Fund Type: Open End Risk Level Moderate Launch Date 20-Dec-2004 Trustee CDC
Auditors KPMG Taseer Hadi & Co.
Registrar Meezan Bank Ltd. Management Fee 2% Fund Category Balanced Front End Load 2% Back End Load Nil Leverage Nil Listing PSX AMC Rating AM2++
Rating Agency JCRVIS
Pricing Mechanism Forward
Valuation Days Mon-Fri
Subscription/ Redemption Days Mon-Fri 9am – 4pm
Benchmark Weighted avg. return of KMI 30 Index and Fixed Income/ Money Market Scheme as per actual allocation.
Fund Manager Asmar Hamoodi, CFA
Members of Investment Committee
M. Shoaib, CFA
Muhammad Asad
Ali Asghar
Ali Khan, CFA, FRM
Ahmed Hassan, CFA
Asif Imtiaz, CFA Zain Malik, CFA Asmar Hamoodi, CFA Imad Ansari
Investment Objective:
The objective of Meezan Balanced Fund is to generate
long term capital appreciation as well as current
income by creating a balanced portfolio that is invested
both in high quality equity securities and Islamic
Income Instruments such as TFCs, COIs, Certificates of
Musharika, Islamic Sukuk, Ready-future hedges, and
other Shariah compliant instruments.
Fund Details:
Annual Returns:
Performance - Cumulative Returns:
Top Ten Portfolio Holdings:(% of Total Assets):
Sector Allocation:
Fund Net Asset:
MEEZAN BALANCED FUND (MBF) AMC RATING AM2++ (STABLE OUTLOOK)
Jan '17 Feb '17 MoM %
Net Assets (Rs mn) 7,651 8,492 10.99%
NAV Per Unit (Rs) 18.60 18.63 0.15%
Expense Ratio* 3.51%
*This includes 1.16% representing government levy, Worker's
Welfare Fund and SECP fee. (Annualized)
B
ALA
NC
ED
Asset Allocation:
SWWF Disclosure: The Fund has provided an amount of
Rs. 38.14 million against Sindh Workers’ Welfare Fund (SWWF)
Liability. Had that not been provided, the NAV per unit/return for
the period would have been higher by Rs. 0.08 / 0.45%.
February, 2017
Details of Non Performing Investments:
14%
13%
6% 6% 8%
53%
Sukuk
Cement
Oil & Gas Exploration Companies
Power Generation & Distribution
Fertilizer
Cash & others

Performance – Fiscal Year Returns:
FY16 FY15 FY14 FY13 FY12 FY11 FY10 FY09 FY08 FY07
MIF 17.4% 21.6% 29.2% 50.7% 19.5% 38.7% 30.9% -29.5% 0.3% 28.8%
Benchmark 15.5% 20.1% 29.9% 54.4% 13.6% 43.7% 36.9% -35.4% 0.9% 17.2%
AMMF 15.5% 22.0% 29.9% 50.6% 19.0% 37.4% 31.0% -32.0% 0.4% 27.0% Benchmark 15.5% 20.1% 29.9% 54.4% 13.6% 43.7% 36.9% -35.4% 0.9% 17.2%
MIIF 5.8% 8.2% 11.9% 14.5% 7.8% 11.8% 7.3% 10.1% 9.3% 10.1%
Benchmark 3.5% 5.0% 5.4% 5.5% 6.0% 5.9% 5.8% 6.1% 5.8% 5.0%
MCF 4.6% 7.5% 7.1% 8.8% 10.7% 11.0% 10.1% 8.0% - - Benchmark 4.5% 6.2% 6.6% 6.9% 8.1% 8.2% 7.5% 7.6% - -
MSF 5.1% 6.8% 8.5% 9.1% 11.2% 11.5% 9.8% - - -
Benchmark 4.5% 6.2% 6.6% 6.9% 8.1% 8.2% 7.5% - - -
MTPF- Equity 18.1% 26.6% 32.4% 54.90% 16.8% 36.0% 31.5% -25.8% 3.1% - MTPF- Debt 4.5% 6.4% 7.7% 8.30% 9.5% 10.9% 8.5% 10.2% 8.3% - MTPF- MMKT 4.0% 6.9% 6.9% 7.80% 10.9% 10.7% 8.5% 11.1% 7.7% -
KMIF 13.3% 17.1% 26.5% 49.6% -2.4% - - - - -
Benchmark 15.5% 20.1% 29.9% 54.4% -1.9% - - - - -
MBF 12.1% 15.9% 19.6% 31.8% 16.8% 25.4% 22.7% -10.8% 1.0% 25.5% Benchmark 9.5% 12.6% 17.7% 30.0% 9.8% 24.8% 21.3% -14.5% 3.4% 11.1%
Aggressive 13.3% 16.5% 22.1% 9.0% - - - - - -
Benchmark 11.7% 15.1% 21.7% 7.9% - - - - - -
Moderate 11.3% 13.6% 17.3% 6.5% - - - - - -
Benchmark 10.0% 12.9% 18.2% 6.2% - - - - - -
Conservative 8.7% 10.1% 12.6% 3.8% - - - - - -
Benchmark 6.7% 8.6% 11.2% 3.6% - - - - - -
MCPP - I 10.5% 7.8% - - - - - - - - Benchmark 8.7% 8.5% - - - - - - - -
MCPP – II 6.5% 0.4% - - - - - - - -
Benchmark 5.6% 2.0% - - - - - - - -
MAAP – I 11.7% - - - - - - - - - Benchmark 14.9% - - - - - - - - -
MAAP – II 14.8% - - - - - - - - - Benchmark 18.3% - - - - - - - - -
MAAP – III 13.5% - - - - - - - - - Benchmark 17.1% - - - - - - - - -
MAAP – IV 0.7% - - - - - - - - - Benchmark 0.4% - - - - - - - - -
MGF 10.5% - - - - - - - - - Benchmark 16.0% - - - - - - - - -
MAAF 2.8% - - - - - - - - - Benchmark 5.0% - - - - - - - - -
^ NAV to NAV with dividend reinvested
Disclaimer This publication is for informational purpose only and nothing herein should be construed as a solicitation, recommendation or an offer to buy or sell any fund. All investments in mutual funds are subject to market
risk. The NAV based prices of units and any dividends/returns thereon are dependent on force and factors affecting the capital markets. These may go up or down based on market conditions. Past performance is not necessarily indicative of future results. Performance data does not include cost incurred by investor in the form of sales-load etc. (This report has been prepared in line with MUFAP’s recommended Format)