from mpls to sd-wan: opportunities, limitations and best
TRANSCRIPT

DEGREE PROJECT IN ELECTRICAL ENGINEERING, SECOND CYCLE, 30 CREDITS STOCKHOLM, SWEDEN 2019
From MPLS to SD-WAN:
Opportunities, Limitations and
Best Practices
CLÉO LUCIANI
KTH ROYAL INSTITUTE OF TECHNOLOGY
SCHOOL OF ELECTRICAL ENGINEERING AND COMPUTER SCIENCE
KTH ROYAL INSTITUTE OF TECHNOLOGY
SCHOOL OF ELECTRICAL ENGINEERING AND COMPUTER SCIENCE


From MPLS to SD-WAN:
Opportunities, Limitations
and Best Practices
CLÉO LUCIANI
Master in Information and Network Engineering
Date: June 16, 2019
Supervisor: Peiyue Zhao
Examiner: György Dán
School of Electrical Engineering and Computer Science
Host Company: Curitiba AB
Swedish title: Från MPLS till SD-WAN: möjligheter, begränsningar och bästa praxis

Abstract
This thesis deals with Software-Defined Wide Area Networks (SD-WAN). It defines the
term, presents its different variations available on the market and contrasts it to a typical
MPLS network, based on criteria such as quality of service, link aggregation capabilities
and price.
Laboratory tests are conducted to compare the performances of one traditional
and two SD-WAN connections to the cloud over redundant links, in terms of resilience
to added latency, packet loss, bandwidth aggregation and failover capacities. An example
company with a typical network is presented to study whether the current solution is
satisfactory and how it could be improved. This thesis finds that the performance of
network is no longer satisfactory due to the company’s global presence and its high use
of the cloud and internet. The enterprise would benefit greatly from a switch to SD-WAN.
Four SD-WAN solutions are then compared based on vendor specifications. The
best option is chosen for the considered company and used to design a new network
leveraging SD-WAN appliances and cloud security services for local internet access. A
best practice is detailed for the design choice and for the transition process.
This thesis will be of interest to network professional and employees considering
SD-WAN for their company.
Sammanfattning
Det här examensarbete berör Software-Defined Wide Area Networks (SD-WAN).
Begreppet definieras, de olika versioner på marknaden presenteras och det jämförs med
ett typiskt MPLS nätverk, baserat på kriterier som service-kvalitet,
länkaggregeringsmöjligheter och pris.
Laborationstest har genomförts på en traditionell och två SD-WAN-förbindelser
till redundanta länkar för att utvärdera och jämföra deras prestanda, utifrån deras
uthållighet mot latens, paketförlust, bandbreddssamling och failover-kapacitet. Ett
typiskt nätverk hos ett företag presenteras och exemplifierar studien av huruvida en
nuvarande lösning är bra nog och hur den kan förbättras. Examensarbetets slutsats är
att nätverksprestanda inte längre är tillräcklig i och med företagets närvaro på den globala
marknaden och dess stora användning av molnet och internet. Företaget skulle dra stor
nytta av att byta till SD-WAN.
Fyra SD-WAN-lösningar jämförs baserat på leverantörsspecifikationer och den
bästa lösningen läggs fram för det aktuella företaget. Utifrån det designas sedan ett
nätverk med SD-WAN enheter och molnsäkerhetstjänster för lokal internetuppkoppling.
Den bästa praxis specificeras för designvalet liksom hur övergången ska ske.
Det här examensarbete är av intresse för yrkesverksamma inom nätverk och för
företag som överväger att byta till SD-WAN.

Acknowledgments
This thesis was executed at Curitiba AB, as a Degree Project for the KTH Information
and Network Engineering Master Program.
I would like to express my gratitude towards the entire Curitiba company for
introducing me to this new topic and helping me throughout my research.
I would also like to thank professor György Dán and Peiyue Zhao for supervising
and examining this thesis.
Finally, I would like to thank Björn Sandvall from Boliden as well as Anders
Norrman and Christer Söderberg from Nynas for accepting to be interviewed and giving
valuable insights into their company’s approach to SD-WAN.

Table of Contents
Chapter 1 Introduction .................................................................................................. 6
1.1 Objectives .................................................................................................................... 6
1.2 Sources Used ............................................................................................................... 7
Chapter 2 Background .................................................................................................. 9
2.1 Performance metrics .................................................................................................. 9
2.2 Techniques to improve QoS with redundant links ................................................ 11
2.3 The cloud ................................................................................................................... 12 2.3.1 Definition ........................................................................................................................... 12 2.3.2 Data location ...................................................................................................................... 13
2.4 Network options to access resources ....................................................................... 14 2.4.1 MPLS ................................................................................................................................. 14 2.4.2 Internet............................................................................................................................... 15 2.4.3 SD-WAN ............................................................................................................................ 16 2.4.3.1 Broad definition ............................................................................................................ 16 2.4.3.2 Different types of SD-WAN ......................................................................................... 19 2.4.3.2.1 Managed SD-WAN....................................................................................................... 19 2.4.3.2.2 SD-WAN as a Network-as-a-Service (NaaS) ............................................................. 21 2.4.3.2.3 Do-It-Yourself (DIY) SD-WAN .................................................................................. 22
Chapter 3 Evaluation and Methodology ..................................................................... 24
3.1 Perspective of a typical example company ............................................................. 24
3.2 Laboratory experiments........................................................................................... 26
3.2.1 Set-ups........................................................................................................................ 26
3.2.1.1 Traditional set-up ................................................................................................. 27
3.2.1.2 SteelConnect set-up .............................................................................................. 28
3.2.1.3 Talari set-up .......................................................................................................... 29
3.2.2 Protocols .................................................................................................................... 30 3.2.2.1 Failover test................................................................................................................... 30 3.2.2.2 Latency test ................................................................................................................... 31 3.2.2.3 Packet loss test .............................................................................................................. 32 3.2.2.4 Link aggregation test ................................................................................................... 32
3.2.3 Vendor Comparison ................................................................................................. 33
Chapter 4 Results and Discussion ............................................................................... 35
4.1 Analysis based on QoS criteria ................................................................................ 35
4.1.1 Latency ...................................................................................................................... 35
4.1.1.1 Latency due to backhauling ................................................................................ 35
4.1.1.2 Latency for cloud access via private links .......................................................... 36
4.1.1.3 Latency test ........................................................................................................... 37
4.1.2 Packet Loss ................................................................................................................ 39

4.1.2.1 Packet loss with redundant links ........................................................................ 39
4.1.2.2 Packet loss with one link ...................................................................................... 41
4.1.3 Bandwidth ................................................................................................................. 45
4.1.3.1 Using new links quickly ....................................................................................... 45
4.1.3.2 Using present links optimally .............................................................................. 46
4.2 Other criteria ............................................................................................................ 49
4.2.1 Security ...................................................................................................................... 50
4.2.2 Ease and speed of installation .................................................................................. 52
4.2.3 Visualization and monitoring .................................................................................. 55
4.2.4 Level of control ......................................................................................................... 56
4.2.5 Price ........................................................................................................................... 57
4.2.6 Conclusion regarding the need for SD-WAN......................................................... 58
4.3 SD-WAN choice ........................................................................................................ 60
4.3.1 Type of SD-WAN ...................................................................................................... 60
4.3.2 Vendor comparison .................................................................................................. 61
4.3.2.1 Identity features ................................................................................................... 61
4.3.2.2 Technical features for compatibility ................................................................... 61
4.3.2.3 Performance related features .............................................................................. 62
4.3.2.4 Management features ........................................................................................... 64
4.3.2.5 Economic features ................................................................................................ 64
4.3.2.6 Trust indicators .................................................................................................... 65
4.3.3 Vendor choice ............................................................................................................ 66
4.4 WAN design and transition ..................................................................................... 66 4.4.1 Types of links ..................................................................................................................... 66 4.4.2 Security .............................................................................................................................. 69 4.4.3 SD-WAN appliances ......................................................................................................... 70 4.4.4 Transition........................................................................................................................... 71
Chapter 5 Conclusion .................................................................................................. 72
References ...................................................................................................................... 74
Appendix A: Test results ................................................................................................ 80
Appendix B: Interview 1 ................................................................................................ 86
Appendix C: Interview 2 ................................................................................................ 89
Appendix D: Configuration of the Cisco router ........................................................... 96
Appendix E: Talari configuration................................................................................. 99


| Introduction
6
Chapter 1
Introduction
Company network traffic has strongly evolved in the last years, changing from a
predominant branch-to-branch and branch-to-datacenter pattern to a more internet-
oriented communication. This is primarily due to the rise of the Internet of Things (IoT)
and the move to the cloud, which necessitate an internet access for all locations. The
trend-shift started with Small and Medium Enterprises (SME) but has now even moved
on to bigger companies. Faced with the challenge of achieving an efficient ubiquitous
internet access, vendors came up with a new software-based approach to networking and
developed what is now called Software-Defined Wide Area Networks (SD-WAN). SD-
WAN seems like a promising solution, though it is not yet implemented by many
companies due to their reticence for change and a certain mistrust in a new product, as
observed by Gartner in 2017 [1]
This thesis studies whether SD-WAN is indeed advantageous in comparison to a
traditional MPLS-based Wide Area Network (WAN) and, if yes, how to best implement
it. Relevant concepts such as performance metrics, the cloud, MPLS and SD-WAN are
first defined, before explaining the evaluation method of this thesis. Some laboratory tests
are then executed and analyzed to finally propose a new network solution design.
1.1 Objectives
As of yet there are still few public SD-WAN comparison tests and not much material is
available to help companies decide which option they should choose. Most vendors have
little data on their websites and encourage potential clients to contact their sales
representatives if they want to know more. Due to limited resources, a company would
rarely contact more than three vendors to get more precise information and execute a
proof of concept. Hence the initial and most drastic selection between the vendors is very
superficial and based on little information. It is highly influenced by factors such as
employees’ prior knowledge of a certain vendor – be it first-hand knowledge or even
feedback from colleagues.

Introduction |
7
The goal of this thesis is therefore to present all the different options and parameters
which are relevant for a company considering an SD-WAN transition. After having
studied whether SD-WAN is indeed more advantageous than an MPLS-based network,
the thesis then develops a reasoning around the solution choice, from the type of SD-
WAN to the vendor choice and the actual design of the set-up. It focuses on the needs of
a mid-size company, but even other companies’ best-suited solutions are mentioned in
passing. The concrete and precise data specific to each vendor is limited in scope and
only researched for a few vendors. This is because such data quickly becomes obsolete
with each passing update and new product launch.
1.2 Sources Used
This thesis uses three types of sources. First, it draws on publicly available documentation
on the different SD-WAN solutions currently on the market. Most of these resources
originate from the vendors themselves (either SD-WAN appliances vendors or managed
SD-WAN solutions vendors). Some third parties such as Gartner or the NSS Labs offer
impartial analysis and comparisons of the different technologies. However, there are only
a few such third parties, and they themselves only have limited access to information and
technologies. A good example is when, last fall, Cisco refused to activate the Viptela SD-
WAN set-up that NSS Labs had purchased in order to analyze it. This refusal to be
subjected to an objective critic can seem suspicious and proves the importance of
unbiased sources. There is also a lack of precise data available on SD-WAN performance.
Vendors usually publish a few case-studies which describe what improvements they
brought to one of their clients, what problems were solved and how they managed this
feat. Yet these papers have few details – albeit for good reasons (e.g. for security and
privacy considerations). Due to the lack of complete information and its biased origin,
these resources cannot be sufficient to have a good objective understanding of the SD-
WAN landscape. Consequently, this thesis uses two additional sources of information.
One of them is network professionals: asking employees of different companies
about their experience with SD-WAN so far, their professional opinion about it as well
as its impact on the future of networking, can give more nuanced and realistic information
that puts into perspective vendors’ idealistic vision.
Three employees from two companies were interviewed in the context of this
thesis: Björn Sandvall, manager of Infrastructure Services at Boliden, as well as Anders
Norrman and Christer Söderberg, Technical Infrastructure Owner of
LAN/WAN/Datacenter and Network Security Governor at Nynas AB respectively.
Boliden is a Swedish mining and smelting company with about 30 sites spread in Europe,
with a majority located in Scandinavia. It has been using SD-WAN services for a little
over a year now and is still in the process of implementing it on more sites. Nynas is a
Swedish oil company which is Venezuelan- and Finnish-owned. It has between 40 to 50
sites worldwide, varying in size from 2 to 200 employees. Nynas has not yet implemented
a SD-WAN solution but is currently making the final decision regarding which SD-WAN
vendor to choose. It aims to have equipped between 5 and 10 sites with SD-WAN by the

| Introduction
8
end of the year. These two companies can be considered unbiased. Indeed, Boliden uses
system integrators (SI) to install the SD-WAN and has no direct contact with the SD-
WAN vendor, thus there is no conflict of interest. Nynas has not yet decided which
operator to choose and is itself objectively comparing several options. A transcription of
the two interviews is attached in Appendix B and Appendix C, and the information
learned from them is used throughout this thesis.
Finally, the third source to buttress the effectiveness of SD-WAN are laboratory
tests, presented in Chapter 3 . In the experiments, a computer in Stockholm is connected
to a virtual machine (VM) in the nearest Azure cloud location, using first a traditional set-
up with one router at each site, and then replacing these routers with SD-WAN appliances
(both a set from Talari and a set from Riverbed are tested). The router (respectively SD-
WAN device) at the Stockholm site is connected to two internet service providers (ISPs).
The link quality of one of these connections is worsened using a WAN emulator. The aim
of the laboratory test is to measure how much SD-WAN improves the performance of the
virtual link between the two end points, and how much resilience each solution has to
poor network quality.

Background |
9
Chapter 2
Background
This chapter defines the metrics useful to measure link performance and some common
methods used to improve quality of service with redundant links. It then presents the
cloud and different ways a company can access both internal and external resources.
2.1 Performance metrics
To analyze the performance of links, some metrics need to be defined first.
• Packet loss is the percentage of packets lost during a data transmission. This means it is
the number of valid packets received divided by the number of packets sent. The
difference between these two values can be due to packets being incomplete, out-of-order
or them arriving too late in the case of the connection-oriented TCP protocol.
• Bandwidth is the value announced in bits per second (bps) by the vendor when
purchasing a link. It represents the maximum data rate which it is possible to send over
the link. It is a theoretical value: when using the link, the user will experience a lower
value referred to as the throughput. Indeed, the throughput – also expressed in bits per
second – is the measurement of the actual amount of total data going through the link. It
should not be confused with the goodput, which is equal to the throughput minus the
useless data such as acknowledgements, retransmissions and overhead data.
• Latency characterizes the packet speed: it is often measured with the round-trip time
(RTT), which is the time it takes for a packet sent from a point A to reach its destination
B and then return to A. The RTT can for instance be measured by using the ping command
on a router: this will send an Internet Control Protocol (ICMP) packet to the specified
destination address and the RTT can be deduced from the received echo reply.
• Jitter is the variation of the latency. According to the RFC 4689, jitter is “the absolute
value of the difference between the forwarding delay of two consecutive received packets
belonging to the same stream” [2]. Studies have shown that jitter degrades the quality of
a video similarly to packet loss, so this metric can have a significant impact. Hence a
smaller jitter metric means better quality of communication, especially for sensitive
traffic such as Voice over IP (VoIP) traffic or video streams.

| Background
10
The performance metrics defined above are very useful for the Service Level
Agreement (SLA). The SLA is the contract between an ISP and a client. It defines
precisely the service which will be provided: it guarantees agreed-upon worst-case values
for performance metrics, maximum yearly cumulated downtime, maximum resolution
time for a network failure, etc. These values are legally binding: if the client can prove
that they are not met, the provider typically offers a monetary compensation instead.
Two other relevant concepts are the quality of service (QoS) and the quality of
experience (QoE). These concepts are less precise, their definition often varying
depending of the application domain. They will be used as stated below in the context of
this thesis.
• QoS is defined by the International Telecommunication Union (ITU) – more specifically
the Telecommunication Standardization Sector (ITU-T) –as “the totality of characteristics
of a telecommunications service that bear on its ability to satisfy stated and implied needs
of the user of the service” [3]. The most relevant characteristics used to quantify it are:
available bandwidth, throughput, latency, jitter and packet loss.
• QoE is defined as “the degree of delight or annoyance of the user of an application or
service” in Möller et al.’s research paper [4]. This same paper specifies that “in the context
of communication services, it is influenced by content, network, device, application, user
expectations and goals, and context of use”. In other words, QoE quantifies the way the
end-user perceives the network quality. Therefore it relies on the previous characteristics,
but it also takes into account the context such as the time of use, the type of traffic, the
cultural background of the user, previous performances, etc. For instance if a link has
high delays or high packet loss, the user might not notice it when using a mail service
whereas she would be very disturbed when holding a videoconference. Another example
could be a user that is used to having an internet access with low latency at home: this
user will be much more irritated than another when suddenly faced with some network
delays.
In short, QoS takes a technical approach while QoE is user-based. To facilitate
implementation of QoS features like traffic shaping and traffic policing, traffic circulating
over the network can be divided into different categories.
• Bulk traffic: traffic such as large file downloads, which necessitates high bandwidth but
is not sensitive to latency and jitter.
• Latency-sensitive traffic: traffic such as real-time communication (e.g. video
conference, VoIP) which necessitates low latency, low jitter and low packet loss, but
generally requires only a limited amount of bandwidth.
• Interactive traffic: traffic necessitating low latency and low packet loss. It is similar to
latency-sensitive traffic except that it does not require low jitter.
These three types of traffic types are a common way to classify traffic in order to facilitate
improvement of QoS. They are featured in the Riverbed and Talari appliances for path
selection and will be used later on.

Background |
11
2.2 Techniques to improve QoS with redundant links
The performance metrics defined previously are at the level of physical links. To improve
the connection between two end devices, one solution is to improve the intrinsic quality
of the link itself, but a more efficient and common option is to procure several links and
to combine them in order to get a virtual link with better quality. This combination can
be done at different layers of the OSI model.
One common technique is load-balancing. It is used mainly to increase
bandwidth capacity: devices connected by several links can use all of these links
simultaneously to send and receive data. The traffic repartition can be based on the
destination or source addresses, the destination or source port, the type of traffic, the time,
etc. It depends on the algorithms used and the capacities of the devices. The most basic
load-balancing solutions can allocate traffic flows to different links: for each traffic flow,
i.e. data communication between a source-destination pair, a hash of the destination
and/or source address is used to choose which link to use. With a high number of devices,
this selection method should statistically reach a repartition close to 50-50%. However,
in the cases of two devices exchanging a lot of traffic, this does not offer load-balancing
since only one link will be used (assuming no randomized hash is used). More advanced
solutions offer packet-level load-balancing, meaning that the steering decision is taken
individually for each packet, even if they are part of the same session (e.g. in TCP traffic).
Packet load-balancing offers superior load-sharing capabilities but can lead to problems
due to packets arriving out-of-order. Therefore, the end devices need to be able to palliate
the resulting issues: Cisco IOS for example does offer the per packet load-balancing
option on its routers but recommends not to use it due to the complexity of handling out-
of-order packets.
A common method to achieve load-balancing is link aggregation, defined in the
IEEE 802.1AX with the Link Aggregation Control Protocol (LACP). The LACP operates
at the layer 2 of the OSI model and consists in creating a logical channel by bundling
several ports of a physical device together. These ports will appear as only one port to the
outside, with a common virtual MAC address. This method offers load-balancing for
greater overall bandwidth and failover between the bundled links. However, it only works
between two directly connected devices and the bundle links must all be Ethernet links
of the same type. Moreover, the load-balancing method – called the scheduling algorithm
– is basic: it is generally based on IP or MAC addresses and cannot be influenced by the
administrator to take into account different types of traffic priorities. Therefore, LACP is
typically used on the backbone of an ISP or between two devices at a client location, but
it is not suitable for redundancy of ISP connections.
When using redundant links, it is important to implement a failover method.
More advanced solutions can even program switchover scenarios. Failover consists in
changing the link used in the case of a link failure. For instance, considering two devices
A and B connected by two link link_1 and link_2: if A is sending traffic to B via link_1
and link_2 thanks to load-balancing and link_1 suddenly fails, A should switch to only
sending traffic via link_2. This switch should be quick in order to lose as little data as
possible. Likewise, when link_1 comes back up, A should revert to using both links
quickly in order not to waste the bandwidth resources available. However, if A switches
too quickly between the links it uses, the connection becomes less stable. This problem

| Background
12
becomes especially visible in the case of a flapping link: the routing would constantly be
updated every time the link comes up (resp. down) again, wasting CPU computational
resources and making the connection unstable. This limit calls for a compromise between
bandwidth-use and stability: most solutions implement a timer to wait for a fixed timeout
duration before actually executing the failover. The timeout value is typically between 1s
and 10s, depending on the context.
Switchover is similar to failover but it is triggered by a worsening of link
performances instead of a link failure. For instance if A sends latency-sensitive traffic to
B via link_1 and link_1’s latency suddenly increases, a switchover scenario would start
sending the traffic over link_2 instead. The exact threshold triggering the switch is
typically when link_1’s latency becomes greater than link_2’s, but it could also be when
link_1’s latency becomes greater than a fixed value (for instance using IP SLA on Cisco
IOS); this depends on the implementation. The monitoring of the link quality can be done
either by analyzing the data traffic which is sent – this is called passive monitoring – or
by sending additional traffic created solely for the purpose of analyze the link metrics –
this is called active monitoring.
2.3 The cloud
2.3.1 Definition
The National Institute of Standards and Technology (NIST) defines cloud computing as
“a model for enabling ubiquitous, convenient, on-demand network access to a shared pool
of configurable computing resources […] that can be rapidly provisioned and released
with minimum management effort or service provider interaction” [6]. The cloud really
started being used about a decade ago with the introduction of the Amazon’s Elastic
Compute Cloud (EC2) [7] and quickly grew into a large market, estimated at $182,4
billion in 2018 by Gartner [8].
Cloud computing can be grouped into three service models [6]: Software as a Service
(SaaS) where the client can directly use an application running on the cloud (e.g. Office
365, Salesforce, Slack); Platform as a Service (PaaS) where the client can program its
own applications (e.g. AWS Elastic Beanstalk, Azure Cloud Services, OpenShift); and
Infrastructure as a Service (IaaS) where the client gets provided fundamental computing
resources like the network, storage and servers, and can manage a big part of the
infrastructure such as the OS, middleware, applications, firewalls, etc. (e.g. AWS EC2,
Virtual Machines on Azure, Google Compute Engine).
The cloud itself can be divided into the public cloud, which is open to anyone (e.g.
AWS, Azure), and the private cloud, where the infrastructure is exclusively available to
one organization. For a more succinct description, Gartner defines public cloud
computing as using a third party to provide computing capabilities over the internet [9].
The two public cloud market leaders are Amazon Web Services (AWS) and Microsoft
Azure. AWS is still ahead, with AWS adoption at 61% in 2019 while Azure is at 52% –
the third position being Google with 19% (some companies use multiple cloud services).
However, Azure adoption keeps increasing and is slowly catching up to AWS [10].
Background |
13
Nowadays cloud-use is ubiquitous: according to Rightscale, 91% of companies use at
least one public or private cloud, with 69% using a hybrid cloud (i.e. both public and
private). The public cloud is slowly replacing the private cloud. Rightscale found that
amongst 786 internationally polled companies, 91% use public cloud and 72% use private
cloud [10]. Moreover the private cloud use is diminishing while Gartner predicts the
public cloud use to keep growing by 17,5% in 2019 [8]. However, the cloud does not
integrate seamlessly with a traditional network due to the low dynamism of an MPLS
network which is slow to change. According to a 2017 KPMG study [7], the biggest
obstacle to cloud adoption is the “complexity of integration with the existing structure”.
This can supposedly be facilitated by SD-WAN.
2.3.2 Data location
Cloud resources are located in big datacenters spread all around the world. Cloud
service providers can either own and maintain the infrastructure themselves or simply
lease it – they often end up doing a mixture of both, such as Salesforce who has nine
internally managed datacenters but also rents some infrastructure from Amazon [11].
A company has limited control over the location at which their cloud data is
stored. Regarding Microsoft services, the location used to store the data is linked to the
geographical location of the account chosen at the time of subscription: therefore, there
can only be one location per tenant. If a new datacenter location opens closer to the user,
it is possible to request a move of one’s data. The application should be submitted within
the time limit (between three and seven months) and the transfer can take a long time (up
to 24 months) [12]. Alternatively, multi-national companies can use the Office 365 Multi-
Geo feature [13]. With it, a single tenant can choose several different geographical
locations and specify where to store which data. However, Microsoft warns that this
feature should be used for data residency considerations only and not for trying to
improve network performance [13].
Big public cloud providers such as Amazon or Microsoft have their own private
backbone infrastructure. Microsoft’s global network has more than 130 edge nodes
distributed world-wide [14], which they call their Distributed Service Front Door
infrastructure. Microsoft recommends going out on the internet as soon as possible in
order to reach their private network early on and thus ensure the best QoE [15]. The
situation could be slightly different for another cloud provider: a ThousandEyes study
found that, for AWS users, the traffic is only let in from the internet onto the private
Amazon network when it is close to the final destination. More generally, AWS limits as
most as possible the path over the Amazon backbone, likely in an effort not to overload
their private network [16].

| Background
14
2.4 Network options to access resources
When a company designs its network, it needs to provision access to all the resources it
uses. These can be divided into internal resources and external resources. Internal
resources are the ones hosted and managed by the company itself; they are typically
located in the company’s datacenter(s). These resources can include the company’s
private cloud, internal applications, servers with company data, etc. External resources
are the resources which the company simply accesses and uses (e.g. internet web sites);
this also includes the public cloud. Usually a user must first go on the private company
network to access internal resources, whereas external resources can be accessed from
any public network.
There are several designs possible to grant a remote office access to all resources.
2.4.1 MPLS
MPLS stands for Multi-Protocol Label Switching and it is a protocol operating between
the layer 2 and 3 of the OSI model. It appeared right before the turn of the century, with
a first IETF draft published in 1997 [17] , and quickly gained popularity in the following
years. As the term “multi-protocol” suggests, this technique can be run over various
protocol and link types (e.g. Ethernet, Frame Relay, ATM). It uses the labeling of packets
according to predetermined paths to route them quickly and efficiently throughout the
MPLS network. MPLS primarily owes its success to the QoS it offers. Indeed, MPLS
providers offer their clients a private network accessible through their Provider Edges
(PE). The latter are astutely geographically deployed to offer a good coverage of ingress
and egress points. This network is completely separate and owned by the MPLS provider,
who has total control over it. Even if several clients can often use the same infrastructure
of this private network, the provider has sufficient insight to precisely monitor the traffic
and not oversubscribe its service. In particular, it will strive to guarantee the agreed-upon
SLA. To do so, MPLS is also capable of prioritizing important traffic such as VoIP
[5]. A Nemertes global study for 3Q18 found that the MPLS reliability is of 99,81%. This
reliability criterion represents how long a company’s links were down on a yearly basis:
99,81% corresponds to a downtime of 16h39min. Nemertes does not specify whether this
downtime occurred during working hours or not, which strongly impacts users’ QoE.
However since the downtime was reported by companies themselves, this means the
failure was at least noticed by them – either by a network monitoring system or by
employees. It is an averaged value; the individual polled responses vary strongly based
on the region and carrier.
Due to this good reliability, MPLS is predominant in enterprise networks and
favored over the internet. The Nemertes study found that about 80% of companies use a
private WAN (predominantly MPLS, but sometimes also Point-to-Point): 42% use solely
a private WAN and 37,6% use both a private WAN and the internet [18].
Companies typically purchase a full-mesh network between all their sites using
one MPLS provider. This provides branch-to-branch connectivity. Companies can even
Background |
15
leverage MPLS to access external resources: internet access can be obtained by using
backhauling. This means that a remote branch’s internet traffic is sent via the private
MPLS network to a hub – often the headquarters –where the internet breakout then takes
place. Backhauling limits the number of sites with internet access.
Indeed, since the internet is completely open the number of potential attacker is
much higher than on a MPLS network, where only the other clients of the same MPLS
provider have access to the network (assuming that it is secure from physical intrusions).
Each local internet breakout is a potential point of entry for malevolent users and needs
to be secured. Therefore, companies equip them with advanced security stacks including
comprehensive security measures such as next-generation firewalls (NGFW) and
intrusion detection/ prevention systems (IDS/IPS). The installation, management and
upgrading of these services is complex and costly. Buying the same appliances for each
site and configuring them multiple times can seem a waste of time and resources.
Therefore, companies typically only have a couple of internet breakout sites and redirect
all internet traffic through them to limit the number of fully secured sites
A company can also access the cloud by buying a private link extending the MPLS
network directly into the cloud infrastructure, without going over the public internet. This
link can be purchased directly from the MPLS provider if the latter has a partnership with
the cloud service.
2.4.2 Internet
Internet links are much less regulated: as opposed to MPLS links, they are known for
offering a quality of service that can vary greatly over time. When purchasing an internet
link, the ISP only advertises a performance “up to” a certain metric, there is no guarantee
like in MPLS. However, the reliability of these links keeps improving, especially in
Scandinavia: it was measured at 99,13% for 3Q18 by Nemertes [18]. This represents
70h57min of downtime in a year, which is surprisingly close to MPLS’s results.
In exchange, internet links are cheap: a Nemertes study found that a 10Mpbs link
is on average 4,7 times more expensive for MPLS than for internet [18]. The exact values
can vary depending on the location, the company size, etc., but it is typical for MPLS to
be more expensive than internet links. In some cases, such as in Scandinavia, the price
difference can be quite small [Appendix B] [Appendix C]. Admittedly the recent SD-
WAN competition to MPLS could result in lower prices, but for now it is too early to tell
[Appendix B].
Internet links are also fast to acquire – typically only a couple of weeks. Since
they can be set-up very quickly, there is no vendor lock-in: if a link turns out to be
worthless after being in production, the company can easily change it. This allows for
lower costs in terms of link subscriptions.
Most big ISPs (e.g. Bahnhof and Tele2 in Scandinavia) offer both internet and
MPLS links. Therefore, the provider’s backbone – i.e. the core of their network– often

| Background
16
uses the same infrastructure with the same MPLS technology. Hence the main difference
between an MPLS customer and a simple internet subscriber is the guarantee of having
some reserved link capacity allocated to them, and thus being less subject to congestions
and other network degradations.
Internet links can of course be used to grant companies access to external
resources, but they can even be used to grant branch-to-branch connectivity. This is
usually done by using virtual private network (VPN) technology to build secure encrypted
tunnels between the company sites. The Internet Protocol Security (IPsec), operating at
layer 3 of the OSI model, is one of the most used VPN protocols. It allows companies to
create a network-to-network key-authenticated connection between the security gateways
of the two sites. VPNs are also used in the host-to-network tunnel configuration to give
roaming employees access to the company network.
Figure 1 – Options for a remote site to access internal and external resources
2.4.3 SD-WAN
2.4.3.1 Broad definition
SD-WAN is an acronym that stands for Software-Defined Wide-Area Networks. The
MEF (originally Metro Ethernet Forum) has established a functional definition of this
technology by specifying the “fundamental characteristics of SD-WAN” [19]. According
to the MEF, the necessary services an SD-WAN needs to offer are: a secure, IP-based
virtual overlay network (e.g. IPsec tunnels), transport-independence of the underlay
Background |
17
network (meaning it can operate over different media types), service assurance of each
SD-WAN tunnel (i.e. monitoring the QoS of each link and rerouting traffic to optimize
the QoE, based on traffic importance and type), application-driven packet forwarding,
high-availability through multiple WANs, policy-based packet forwarding, and finally
service automation via centralized management, control and orchestration (e.g. Zero
Touch Provisioning, management through a web portal). Some services that are often
additionally found but which are not inherent to the SD-WAN definition are WAN
optimization (i.e. the use of techniques such as data caching or compression to make data
transfer more efficient) and advanced security features.
SD-WAN came in the wave of the Software-Defined Networks (SDN) which
appeared in the beginning of the century and grew more established in 2007 with
Stanford’s Ethane project [20]. The Open Networking Foundation (ONF), a non-profit
consortium promoting SD-WAN adoption, dates the official beginning of SDN to 2011
[21]. The novel idea introduced by SDNs is the separation of the control plane and the
data plane, with the supervision of the whole network state and data flow happening at a
controller. Although SD-WAN uses the same underlying principle, it applies it to much
larger scales and has de-facto become separate from SDN. Google’s B4 [22] was the first
big evolution from SDN to SD-WAN, implemented in 2010. SDN has many open source
projects such as OpenFlow, which is the most common communication protocol used
between the data and control plane. Nowadays SDN is being increasingly implemented
in real life, especially in big datacenters as found by a Metzler survey [23]. In parallel,
research is still being done on the security threats specific to SDN and on how to mitigate
them. [24]
SD-WAN also uses SDN’s principle of plane separation with a controller at the
top of the hierarchy. In the SD-WAN standard published by the MEF, the elements that
might comprise an SD-WAN are listed as the following [19]:
• SD-WAN Edge(s): an Edge is the element that terminates the network at the client site:
it is the ingress/egress point of the SD-WAN tunnels. It can be connected to various types
of links and can perform QoS-related operations.
• SD-WAN Gateway(s): a Gateway is a particular type of Edge which can act as a bond
between a traditional part of the network and the SD-WAN fabric. It can both terminate
SD-WAN tunnels and traditional VPN connections.
• SD-WAN Controller: it is the element that is responsible for managing all the devices
(e.g. configuration, activation, IP address management, etc.).
• SD-WAN Orchestrator: it is the element that manages all the services (e.g. control of
the performance, security, etc.).
• Subscriber Web Portal: it is the tool through which an administrator can interact with
the network and manage it from a distance. The Subscriber Web Portal communicates
with the Orchestrator mentioned above.
All these elements can be provided through combined or individual components,
physically or virtually, on-premises or in the cloud. The MEF present a schematic
implementation as in Figure 2.

| Background
18
Figure 2 – Logical composition of an SD-WAN by MEF [19]
One important difference between SD-WAN and SDN is that the edge devices are
more independent in SD-WAN. Indeed, for SDN all the elements are typically installed
in one rack of a datacenter. Due to this proximity it is no problem to have frequent
communication between the controller and the SDN switches. In SD-WAN, the controller
is present at one location and the SD-WAN edges are spread globally. Since this distance
induces additional delay in communication, the frequency of interactions between the
control and data plane is reduced in the SD-WAN design.
Compared to SDN, SD-WAN is also much more industry oriented and has many
proprietary solutions. Big networking companies have invested in their own solutions and
are therefore reluctant to divulgate too much information, apart from performance results
and case studies proving their validity. Therefore SD-WAN is not linked to a particular
protocol or algorithm. Seeing as different companies have different SD-WAN solutions
but all market it as “SD-WAN”, it can be confusing for customers to understand exactly
what the term means and what to expect. Some companies even claim to have been selling
SD-WAN longer than the term exists, simply because the marketing term hadn’t been
coined when their product first came out. This is the case of Talari and their Adaptive
Private Networking solution, which was released about a decade ago [25].
For this reason, several organizations such as the MEF chose to write a standard
that clearly delimits what the word “SD-WAN” encompasses, thereby helping inter-
operability between vendors and guaranteeing a certain level of expected results. This
will also help increase clients’ trust in the products and their reliability. In keeping with
the drive for open standards and clarity, the Open Networking User Group (ONUG) has
been working to improve the user-vendor communication. It published an official SD-
WAN use-case in 2014 [26], and it also presented a test plan for SD-WAN solutions as
well a list of SD-WAN requirements from the industry’s point of view. This list does not
aim to define SD-WAN but rather to reflect their needs. Thankfully it is similar to the
MEF’s definition.

Background |
19
The ONUG also initiated the creation of the Open SD-WAN Exchange (OSE)
[27], an open framework which aims to enable, if not inter-operability, at least “multi-
vendor SD-WAN integration” [28]. Indeed, their vision is not to allow for the use of many
different vendor appliances when building an SD-WAN; this is not a realistic goal and its
value is debatable. However, it should be possible to get two SD-WANs from different
vendors to cooperate with each other. This is for example necessary in the case of a
merger between two companies where each already has a SD-WAN in place: considering
that the capital expenditures can be quite high in the beginning, the SD-WAN appliances
often need to be amortized over several years and having to change them prematurely due
to compatibility problems would be a big set-back. To achieve this desired SD-WAN
reference architecture, the OSE is working on several drafts of Services APIs [29]. It is
interesting to note that the OSE is chaired amongst others by one Cisco engineer and one
SilverPeaks engineer. This is an indication of the two vendors’ investment in the future
of SD-WAN. They will likely be among the firsts to follow the reference models once
they are established.
Ultimately, SD-WAN is not about one specific technology but rather it is a new
approach to handling traffic management. One noticeable element from the definition is
that SD-WAN is not reliant on the underlying media type. Consequently, even though it
is often presented as the opposite of an MPLS network, these are actually two compatible
concepts.
2.4.3.2 Different types of SD-WAN
SD-WAN solutions can be categorized into three different types: managed SD-WANs,
SD-WANs as a Network-as-a-Service (NaaS), and Do-It-Yourself (DIY) SD-WANs.
These distinctions originate in the different repartitions of the responsibility of setting-
up, managing and monitoring the network. These terms have been chosen based on their
common use in articles, but they are not official distinctions so they should be used with
care. For example some people use the terms “managed SD-WAN” and “SD-WAN-as-a-
service” interchangeably [30], while some use “SD-WAN as a Service” to describe the
category named “SD-WAN as a NaaS” here [31]. The definitions for the context of this
thesis are given below.
2.4.3.2.1 Managed SD-WAN
As the name implies, a managed SD-WAN is entirely handled by the provider. The latter
takes care of the hardware, the software, the transport services and the network as a whole.
The company’s input is simply to choose the provider in the beginning and to negotiate
the desired SLA. All the day-to-day operations of managing, monitoring, securing and
upgrading the network is the responsibility of the provider. Managed SD-WAN providers
are most often carriers, who have built their own underlying solution with a DIY SD-
WAN (see next part for the definition). For instance AT&T offers a managed solution
using the VeloCloud SD-WAN [32], British Telecom uses Cisco’s Viptela solution [32]
and Masergy uses SilverPeak’s [34].

| Background
20
A managed SD-WAN has the advantageous characteristic of the “one throat to
choke”, similarly to MPLS networks. Indeed, if a problem occurs, there is only one point
of contact to notify. In theory, the provider should even notice the issue and solve it
without the client having to file a case with them, but practice can be different.
One popular example is AT&T, who partnered with VMware for its VeloCloud
SD-WAN [32]. It is one of the carrier vendors offering more flexible solutions: both fully-
managed but also co-managed SD-WAN [35]. Clients can use AT&T’s various
connections (MPLS, Broadband, Wi-fi, etc.) and/or use their own connections which they
had already purchased [35]. AT&T’s SD-WAN offer is currently available in more than
150 countries. Other examples are CenturyLink, Verizon, Datapath.io, and Sprout.
The strength of a managed SD-WAN lies in its ease of use: it requires no technical
skills and can be purchased very easily without putting too much effort into it. If a
company wants to set up several international sites, the installation can be accelerated by
directly using the provider’s network there. This presupposes that the company has
checked beforehand whether the provider or its partners are present in all the desired
countries. This also has the benefit of preventing an increasing provider sprawl, i.e. when
a company leases links from a high number of different providers for all of their sites.
Indeed, this is difficult to manage and has an associated cost (need to figure out the ISP
aggregation in the beginning, manage all the contracts and then hold the providers
accountable, etc.). However, a managed SD-WAN induces a risk for vendor lock-in,
similarly to the MPLS situation.
A drawback of managed SD-WAN is the lack of control and overview the client
has over the network. Some managed ISP providers have identified this problem and are
now offering solutions with more power to the client such as AT&T with its co-managed
solution. Moreover, the network will be very dependent on the carrier’s network so that,
if a failure occurs on the provider’s backbone, all the links will become unavailable. This
is a rare event but not an impossible one, so a company wishing for a very strong
redundancy should take it into account. As an example, in March 2017 the 911 service
experienced a significant 5-hour failure during which more than 12 000 users couldn’t
reach 911. This was due to an AT&T network change [36]. More recently, CenturyLink
suffered a major outage in December 2018 that lasted for about two days and spanned the
whole of the USA [37]. This affected 911, cloud and DSL services. Therefore, companies
with critical services should not solely rely on a managed solution provided by one
carrier.
Some network specialists are skeptical towards carrier-provided SD-WANs and
warn against their lack of expertise on this subject [38]. These solutions being more
recent, the providers do not yet have so much experience with it. Moreover, their
underlying proprietary network is not public information, so that it can be hard to evaluate
their solution from an external point of view, for example regarding their connection to
the cloud. Indeed, the speed of cloud access is highly dependent on the architecture of the
network, e.g. whether the provider has SD-WAN appliances deployed at strategic
datacenters where the cloud resources are situated (see section 2.1 for more detail on the
cloud).

Background |
21
Nemertes expects that the number of managed SD-WAN will increase in the
coming years as the market matures and providers gain in experience, growing from the
current 30,1% to somewhere between 45% and 60% [18]. It should be noted that
Nemertes only separates the SD-WAN types into two categories, the DIY type and the
In-net one, a.k.a. the managed one. This means that the managed SD-WAN and SD-WAN
as a NaaS (see next part) as defined here are grouped together in their study.
All in all, this solution is promising but not mature yet, and network experts would
recommend using system integrators instead.
2.4.3.2.2 SD-WAN as a Network-as-a-Service (NaaS)
A company using an SD-WAN as NaaS subscribes to a provider to use their global
network, which is built using SD-WAN and has a high redundancy with links from
numerous providers. The client company can monitor and manage the SD-WAN through
a portal if it wants, as with a DIY solution. It can also be responsible for providing and
monitoring the last-mile, i.e. the connection from the company site to the network
provider’s point of presence (PoP) – some vendors now offer the option to take care of
the last-mile such as Aryaka with its Last Mile Services add-on. SD-WAN as a NaaS is
often described as an MPLS replacement (e.g. when Aryaka claims to be “the #1 MPLS
replacement” [39]) because, as MPLS, it is an international network which companies
can hire for their use. The Senior Vice President of Aryaka also refers to their offer as
Connectivity-as-a-service [40]. Some typical examples are Aryaka [39] and Cato
networks [41]. Most are recent providers (e.g. Cato networks was created in 2015), but
Aryaka was amongst the SD-WAN pioneers, having been founded in 2009 [40]. Aryaka
is now strongly established: it was the SD-WAN vendor with the third biggest revenue
share in 4Q18 according to an IHS study [42].
SD-WAN as a NaaS is accessible for companies because it does not require a
strong engagement – though it could require expertise. There are no capital expenditures:
a company does not need to buy appliances, it only pays a monthly fee to be able to use
the network. This prevents a vendor lock-in. For Cato networks, the pricing is more
advantageous than most MPLS links, with a 100Mbps connection at around $350 [43].
Pricing for Aryaka could not be found, but it is rumored to be more expensive. Moreover,
the client company can keep almost total control over its solution, it simply uses a network
that is possibly cheaper and above all more efficient (Cato has a service availability of
99,999% [43]).
Even though the company is in charge of handling the last-mile, this solution
facilitates implementation for a global company. Indeed, long international connections
can be complex to set up: a company would either need to buy a costly private link or
find an ISP aggregation that offers sufficient performance and is feasible logistically; all
of this to be done for every location.
The last-mile is usually set-up with an internet link. If the PoP is too far away or
in a region with bad internet quality, this could undermine the good performance of the

| Background
22
NaaS, since a network is only as good as its weakest link (without redundancy). For this
reason, the provider’s PoP deployment should be carefully examined before subscribing
to such a solution. For example, Aryaka claims that 95% of workers can reach their
nearest PoP in 30ms or less [44].
As a side note, this category is considered to part of the managed SD-WAN group
by some, but the two are distinguished here to offer a more in-depth view of the available
options. The “as-a-service” only relates to the “network” and not the whole “SD-WAN”,
which is what distinguishes this solution from the managed SD-WAN.
2.4.3.2.3 Do-It-Yourself (DIY) SD-WAN
A DIY SD-WAN is a solution in which a company buys appliances from an SD-WAN
vendor and then itself builds the network with it. The company is responsible for
configuring, managing and upgrading its SD-WAN. It has total control over everything,
from the choice of the design to the day-to-day monitoring. However, it also has all the
responsibility that goes with it. The term “company” is used loosely here: it could for
instance be with the help of system integrators. Indeed, if the company does not have
enough in-house resources or no one who is familiar with the technology, it can outsource
the configuration and monitoring tasks to an external team. This is the case of the
interviewed company Boliden, who delegated the responsibility of SD-WAN to Curitiba,
a system integrator company specialized in SD-WAN.
Some of the biggest DIY SD-WAN vendor include Cisco, VMware, SilverPeaks, and
Talari. The DIY solution is the most implemented one, currently at 69,9% according to a
2018 Nemertes study [18]. This is partially because it was the first SD-WAN solution
available: since carrier providers leverage the products of DIY SD-WAN vendors for
their own managed SD-WAN offers, their offers necessarily arrived on the market later.
The DIY solution has the advantage of being very finely adjustable to a
company’s specific needs and offers total control. This could explain why it has a higher
customer satisfaction than the others according to a Nemertes study [18]. Using a DIY
solution also prevents any privacy issue for companies with sensitive data since they can
handle everything themselves. The downside is that this solution requires certain
technical skills; but this can for instance be solved by using system integrators as
mentioned earlier.

Background |
23
Figure 3 – Responsibility schema for the different SD-WAN types
| Evaluation and Methodology
24
Chapter 3
Evaluation and Methodology
The underlying question for this thesis is whether SD-WAN is indeed better than a
traditional MPLS-network for contemporary company use and, if yes, what would be the
best implementation.
3.1 Perspective of a typical example company
This thesis will use the basis of an example company with a specified network to develop
its reasoning regarding the best solution. The enterprise considered is a mid-size company
having between 20 and 100 sites spread internationally. It is mainly based in Europe, with
a few sites in Asia. The headquarters (HQ) along with the datacenter (DC) are located in
Stockholm, Sweden. A figure with the site locations can be found in Figure 4. A new site
is planned to be created in Malmö in two months and the Paris office is currently in full
expansion, with a staff team expected to double by the end of the year.
The company has a skilled but small IT team (about eight people) which is based
at the headquarters in Stockholm. Some business trips to the other sites can be organized,
but they should be exceptional for cost reasons. Since the in-house IT team is relatively
small, the company is open to getting help from outside and to the outsourcing of services.
The IT division does not mind being accountable for connectivity problems as long as the
number of cases is manageable and there is not an overwhelming amount of simultaneous
urgent demands.
The Stockholm site containing the datacenter needs to be available at all times.
The Prague site runs critical business operations and also needs to be constantly up. The
rest of the sites are simple sales offices: they have some tolerance for downtime and do
not contain servers with sensitive information. For these locations, the company aims
foremost to strike an advantageous balance between performance and price. Indeed, it
wishes to minimize downtime for economic reasons, so it will not implement redundant
solutions that outweigh the theoretical cost of working hours lost during a blackout.
The company has some voice and video communication which necessitates low
latency and low jitter. All sites make heavy use of cloud services, most notably for Office
365 and Salesforce. The company predominantly uses the Microsoft public cloud but not
exclusively. It wants to guarantee a fast access to all these service from every location.

Evaluation and Methodology |
25
The company’s network is depicted in Figure 4. It consists of an MPLS network
mixed with some public internet links, leveraging VPN tunnels. Almost all sites are
connected to each other via an MPLS network bought from a single MPLS provider,
forming a full-mesh topology. Some sites could not be connected via MPLS: the
Montpellier office is located in a rented office space and the owner does not allow for
private connections to be installed. It has to use the available internet connection instead.
Since it has no on-site security features available, it tunnels all traffic to the site in
Stockholm. The Dubai site is connected to Hong-Kong via an internet link because an
MPLS link there would be much too expensive.
The company has two internet breakouts: one at the headquarters in Stockholm
and one in Hong-Kong. These sites have additional security features like a NGFW and
an IDS/IPS to offer the added protection necessary for the internet access. The company
also has a 100Mbps Express Route, purchased from their MPLS provider. The appliances
are mainly from Juniper, with also some Cisco appliances. The MPLS contract will be up
for renewal in a year’s time.
Figure 4 – Network of the considered company

| Evaluation and Methodology
26
3.2 Laboratory experiments
Regarding the tests executed, this thesis uses a virtual machine (VM) in Azure’s Dublin
datacenter to test the connection to Azure’s IaaS services. The tests can also give some
indication regarding the SaaS connection, since customer data for services like Office 365
are collocated in the Microsoft servers from these datacenters [45].
The following criteria will be evaluated during the experiments:
• speed of the connection – i.e. the end-to-end latency, given the links available and a
given type of data (the aim is not to make the communication faster with optimization
techniques such as compression, that is outside of the scope since it is not part of the SD-
WAN definition seen in Chapter 2)
• resilience of the connection – i.e. ensuring the minimum downtime possible
• load-balancing capabilities – i.e. making use of all the bandwidth available on all the
links, be it for one or several TCP connections
• visibility and link monitoring
• ease and speed of installation
• level of control
• price
Four tests are conducted to evaluate these criteria: a failover test, a latency test, a
packet loss test, and a ling aggregation test. The protocols are detailed in section 3.2.2.
3.2.1 Set-ups
The perspective is that of an office branch located in Stockholm which needs to access
Azure’s IaaS services. It is a small site (less than 100 employees) so it chooses solutions
at the lower end of the spectrum for cost savings. Hence, the network considered here is
limited to a site in Stockholm with a laptop and a vNET in Azure with an Ubuntu VM
running on it. The Stockholm site has two internet connections: one is an ADSL link from
Telenor with 1Mbps up and 10Mbps down (referred to as ISP A and link A); the other is
from the ISP “Bahnhof” (ISP B, hereafter referred to as link B) with a bandwidth of
1Gbps both up and down.
The laptop in Stockholm and the VM are connected using three different set-ups,
which could all be typically implemented by a company wanting to provide their
employees with access to Azure’s IaaS. The first solution is a traditional set-up with a
Cisco router at the Stockholm branch and an Azure VPN Gateway on the cloud. The
second set-up uses Riverbed’s SteelConnect SD-WAN solution, with one physical
appliance at Stockholm and one virtual appliance running on the Azure cloud. Similarly,
the third solution uses Talari’s SD-WAN appliances, one on site and one on the cloud.
The precise implementation is detailed in Figure 5, Figure 6 and Figure 7.

Evaluation and Methodology |
27
Independence of the set-up
In all the set-ups, the Ubuntu on Azure has both a private IP address (which is only
reachable through the VPN) and a public IP address. The latter will be kept throughout
the tests to ssh into the VM. To keep the ssh connection independent of the links and thus
of the tests being run, the ssh connection is routed over the Wi-fi interface of the laptop.
To do this, the ethernet link is indicated as the default interface and a routing rule is added
specifically for the VM public IP address using the command “sudo route -n add
52.178.135.137 10.181.1.1”. On the Azure side, the public IP of the laptop’s Wi-fi NIC is
categorized as internet and thus not routed over the tunnel. This provides independence
between the ssh connection and the test traffic. The ssh access through this public IP is
secured with a strong pair of RSA keys and a passphrase.
The Wi-fi connection goes over the ISP B but the gateway is situated upstream of
the degradation introduced; consequently, the connection stays up at all times. The ssh
traffic to control the iperf sessions represents a negligible amount of traffic compared to
the 1Gbps capacity of the link so it should have no impact on the tunnel capacities.
During the times of testing, link A was never used by others. However, link B was
simultaneously used by colleagues working at the Curitiba office since it serves as the
usual internet connection there. There were never more than five other employees using
this connection, and it was primarily for low-impact tasks such as internet searches.
Therefore, link B has enough bandwidth for this traffic to be negligible.
No additional security services such as firewalls are implemented here since they
are not relevant to the tests being run. This helps keep the design minimalistic and limits
the number of additional parameters that could influence the results and add complexity,
delays, etc. Of course, in a real business implementation, such features need to be present.
To minimize the risks entailed by the low security, all appliances are disconnected and
turned off when not in use.
3.2.1.1 Traditional set-up
The traditional set-up is as depicted in Figure 5.
Figure 5 – Laboratory set-up for the traditional solution

| Evaluation and Methodology
28
The two sites are connected through two IPsec tunnels, one on each ISP connection. Their
characteristics are left to Azure’s default values. The tunnel configuration for the
Stockholm side can be retrieved from the Azure graphical user interface (GUI): the
administrator needs to first create the local network gateway object and the connection
on the GUI, and then click on “Download Configuration” and selecting the Cisco IOS
option. This procedure is done twice (once for each ISP). It results in two IPsec tunnels
on the router using two virtual tunnel interfaces.
This laboratory test uses static routes, which is a viable option as confirmed by
the Azure documentation [46]. It does not use BGP for failover as suggested by the Azure
documentation [46] because this would require the two tunnels to terminate on two
separate routers. This would mean adding two routers, making this a solution with three
routers and diminishing the real-life likeness of the test-scenario. Indeed, a small branch
would want to minimize the hardware used and three routers for simply two internet
connections seems an overkill. It is not impossible that a branch would have their two
internet connections terminating on two separate routers but that is a more complex and
expensive solution that is usually reserved to bigger sites needing high redundancy.
Moreover, on Azure this BGP failover can only be used with route-based gateways and
not with policy-based gateways [46]. Therefore, the static routing set-up is likely still
being used by many companies who need to use Policy Based Routing (PBR): it is thus
a representative scenario.
Regarding the configuration: for Stockholm, the two tunnels are routed via two
static routes with the same subnet destination and same priority, resulting in two equal
cost path and automatic Cisco load-balancing [47]. On the Azure side, the routing was
left to the default setting of Azure.
3.2.1.2 SteelConnect set-up
The SteelConnect (SC) set-up is as shown in Figure 6.
Figure 6 – Laboratory set-up for the SteelConnect solution

Evaluation and Methodology |
29
The physical Riverbed appliance used is SteelConnect Model SDI-130 with a 25Mbps
license. The virtual Riverbed instance SDI-Azure is of type Standard_DS2_v2 and is
located in Dublin. It is created by using the one-click method of Riverbed: by linking the
existing Azure account to the Riverbed account using a set of IDs and a secret key, the
vNETs and subnets from Azure appear on the Riverbed GUI. From there, the subnet
Company_LAN (which contains the Ubuntu VM) is connected to the SD-WAN by
clicking on the “Connect” button in the Network Design > Azure > Virtual Networks tab.
This automatically creates a virtual instance on the subnet and all the associated necessary
objects for the SteelConnect Virtual Gateway (one public IP address, two NICs, two
subnets, one VM, one routing table). The SC manager is in the Amazon Cloud. The
automatic Azure routing is used, and no SteelHead optimization is added.
When having a site with two different ISPs, the Riverbed solution offers two
options: either the two links can be registered as part of the same WAN or they can be
registered as two uplinks from two different WANs. When placing them in the same
WAN, the “outbound traffic is automatically load-balanced” as indicated in the Riverbed
support documents [48] and there is automated failover between the two tunnels.
However, this limits the control over both links: they are seen as one big link by the SC
Manager and an administrator can no longer influence the routing. For example when
adding a traffic rule, the “path preference” category can only be set to a WAN, not to a
specific link.Conversely, when choosing the option of two separate WAN types for each
ISP link, the administrator can himself decide how traffic should be distributed between
each WAN link. However there is no longer automatic load-balancing nor automatic
failover.
This thesis choses to implement the solution using the “internet” WAN for both
links since it offers a better failover performance. Moreover, as it is the easiest and most
obvious way to configure the set-up, it is likely to be the most adopted by companies.
3.2.1.3 Talari set-up
The Talari SD-WAN set-up follows the advices from the Talari Implementation guide
[49] and the Virtual Talari Implementation Guide [50]. It is as depicted in Figure 7.
For the virtual Talari, a virtual instance DS3_v2 (the lowest instance
recommended [51]) is created on the Azure portal following the guide’s instruction [50].
After that the Talari portal of the Network Control Node (NCN) becomes accessible
through its public IP and the configuration can be staged and deployed. The exact
configuration can be found in the appendix.

| Evaluation and Methodology
30
Figure 7 – Laboratory set-up for the Talari solution
The cloud appliance is chosen as NCN because it has no DHCP-provided address.
Some other configurations choices which are relevant for this study are that the WAN
ingress/egress physical rates of WAN link A (resp. B) of the Stockholm site are set to
1,5Mbps/15Mbps (resp. 100Mbps/100Mbps). The Auto-Learn option is enabled in order
for Talari to perform automatic bandwidth detection for the WAN ingress/egress
permitted rates. Lastly a user defined application is created for Iperf, encompassing the
IP ranges 192.168.0.0/24 and 10.0.0.0/24 for TCP and UDP, and with the port 5001
(default port used by the Iperf server).
3.2.2 Protocols
One tool often used in the tests is iperf. It is a Bulk Transfer Capacity (BTC) tool. It was
preferred to its newer updated version iperf3 because the SteelConnect appliance has Iperf
as a predefined application which it recognizes. The WAN emulator used in the tests is
the Linktropy mini2 by Apposite.
Each test lasts 60 seconds and is executed 10 times as recommended by the RFC
2544 Benchmarking Methodology for Network Interconnect Devices [52]. The protocols
for the four tests are as follows.
3.2.2.1 Failover test
1. Make sure the WAN emulator is not in the set-up (simply to limit the number of
disruptive factors)
2. Ensure that the two links are connected and up.
3. Launch a ping from the Stockholm laptop to 10.0.0.4
4. Unplug the ISP1 (resp. ISP2) cable from the router or SD-WAN appliance

Evaluation and Methodology |
31
5. Note how many pings were lost before the connection was established again (if
any)
6. Wait at least 20s from the moment the connection is up again
7. Make sure the ping is still running
8. Plug in the disconnected cable again and note the time
9. Observe if some pings were lost (if yes, how many) and measure how long it takes
for the link to come up (using the event manager on each solution’s GUI)
10. Wait at least 20s from the moment the connection is up again
11. Start this process again with the other link, thus testing the two ISPs following an
alternating pattern
This test is executed 10 times for each link meaning 20 times in total. It is executed in
one session (less than an hour) so as to ensure having – as much as possible – the same
exterior conditions.
The test is done by alternating the link failures to limit the influence of a possible
link-quality memory. Indeed, if the same link is repeatedly pulled out and the appliance
keeps track of link performance, it will progressively stop using it in favor of the other
link. This would influence the results of the tests. By alternatively unplugging the two
links, the performance rate of these two links in memory (if it exists) would worsen
symmetrically so as not to impact the routing choice.
The ping tool used sends one ping every second, thus the number of pings lost can
be related to a downtime measurement with second-granular precision.
3.2.2.2 Latency test
1. Ensure that the WAN Emulator has no added delay
2. Ensure that the initial routing is over link B
3. The initial RTT for each link alone is measured by running a ping for 1min and
taking the average RTT value
4. On the WAN Emulator, increase the value (e.g. by 10ms) of the added delay
5. Launch a 1min ping from the Stockholm laptop to 10.0.0.4 and note the average
RTT
6. Repeat steps 4 and 5 until the latency is detected and the sane link A is consistently
used
The delay is added symmetrically on both unidirectional paths of link B: for example an
added delay of 40ms means there is 20ms additional delay from Stockholm to Azure and
20ms additional delay from Azure to Stockholm. This is because, according to vendor
specifications, some solutions have unidirectional path latency detection and
unidirectional packet steering while others do not. This test does not try to measure the
unidirectional capacities of each solution but the general detection threshold. Therefore,
a symmetrical delay is always used and no other asymmetrical tests will be run.

| Evaluation and Methodology
32
3.2.2.3 Packet loss test
1. Ensure that the iperf application is classified as “interactive” and not “latency
sensitive” traffic if there is application recognition
2. Using the WAN Emulator, set the bandwidth of link B to 10Mbps to have the
same downlink bandwidth on link A and B
3. Using the WAN Emulator, add 13ms latency to link B to have the same RTT of
58ms on link A and B
4. Ensure that the initial routing is over link B
5. Launch a 60s UDP from the Ubuntu VM to the Stockholm laptop. The commands
are:
“iperf -c 192.168.100.100 -t 60 -u” for the client and “iperf -s -u” for the server.
Repeat ten times.
Note the loss percentage and which link was used (for instance by looking at the
WAN emulator metrics)
6. Increment the packet loss percentage on the WAN emulator for the unidirectional
link B Azure to Stockholm
7. Repeat steps 4 and 5 until the packet loss is detected and the link A is consistently
used
The two links only differ by their packet loss throughout this test: their bandwidth and
latency characteristics have been set alike with the WAN emulator and the jitter parameter
(which is different for both links) has been taken out of the equation by using the
interactive traffic type. Indeed, in that case the controller only uses the latency and data
loss parameters to compute the best path – unlike for “latency sensitive traffic”, where all
three parameters are taken into account.
3.2.2.4 Link aggregation test
1. Using the WAN Emulator, limit the available bandwidth on the unidirectional link
B Azure to Stockholm to 10Mbps
2. Launch a 60-second long TCP test from the Ubuntu VM to the Stockholm laptop,
omitting the 3 first seconds to not take into account the TCP slow-start. The
command is “iperf -c 192.168.100.100 -t 60 -O 3”. Note the achieved bandwidth.
Do this ten times.
3. Launch a 60-second long TCP test from the Ubuntu VM to the Stockholm laptop
with two parallel clients. The command is “iperf -c 192.168.100.100 -t 60 -O 3 -
P 2”. Note the achieved bandwidth. Do this ten times.
4. Launch a 60-second long TCP test from the Ubuntu VM to the Stockholm laptop
with four parallel clients. The command is “iperf -c 192.168.100.100 -t 60 -O 3 -
P 4”. Note the achieved bandwidth. Do this ten times.
5. Using the WAN Emulator, limit the available bandwidth on the unidirectional link
B Azure to Stockholm to 5Mbps and redo steps 2 to 4

Evaluation and Methodology |
33
6. Using the WAN Emulator, limit the available bandwidth on the unidirectional link
B Azure to Stockholm to 1Mbps and redo steps 2 to 4
7. On the WAN Emulator, put the bandwidth of the unidirectional link B Azure to
Stockholm back to 100Mbps (the maximum allowed for the WAN emulator used)
8. Using the WAN Emulator, limit the available bandwidth on the unidirectional link
B Stockholm to Azure to 1Mbps
9. Launch a 60-second long TCP test from the Stockholm laptop to the Ubuntu VM,
omitting the 3 first seconds to not take into account the TCP slow-start. The
command is “iperf -c 10.0.0.4 -t 60 -O 3”. Note the achieved bandwidth.
Do this ten times. Repeat with two parallel clients, then four parallel clients.
3.2.3 Vendor Comparison
After having decided whether SD-WAN is indeed advantageous and which type of SD-
WAN fits the company best, the specific vendor remains to be chosen. This decision
should be buttressed by an in-depth analysis of the vendor solution, using the publicly
available information and also contacting vendors directly to get more precise data, price
estimations and even testing implementations using proofs of concepts (POCs). The
approach is similar for all types of SD-WAN, even though DIY offers are easier to
analyze in depth since the managed and NaaS solutions are more akin to black boxes:
their inner workings are obscure to the user who can only observe the achieved results
and overall QoE. This thesis executes the initial comparison which a company should do
after having decided on an SD-WAN type. It is limited to the DIY SD-WAN solution and
to four major players, chosen for reasons explained below. This is in an effort to keep the
thesis concrete and also due to time constraints. Indeed, the SD-WAN market is currently
very large (with more than 30 vendors) so it is not realistic to do an exhaustive analysis
of them all here. Vendor solutions can change quickly, so an updated research should
always be conducted. The approach used here can be applied to compare other vendors,
be they of the DIY type or another.
The four vendors investigated here are Viptela, VMware, Talari and Riverbed.
They were chosen based on their market presence and good performance in third-party
studies (VMware and Cisco were the two market leaders in 4Q18 [53]). Moreover, these
solutions – save for Riverbed – were all initially start-ups that were successful enough to
garner the attention of big companies and be acquired by them: Cisco bought Viptela in
August 2017 [54], VMware bought VeloCloud in December 2017 [55], and Oracle
bought Talari in November 2018 [56]. This signifies that they are now strongly
established and not likely to disappear from the market. Additionally, of the two
companies interviewed, one has implemented the Talari SD-WAN and the other is
considering implementing Viptela. Finally, the last underlying choice for this selection
of vendors is that both Talari’s and Riverbed’s SD-WAN solutions were tested in the
experiments of the Cloud Access section (see Chapter 3 ).

| Evaluation and Methodology
34
All these vendor solutions have slightly different inner workings and structures.
However, they amount to similar user-experiences, with varying performance and
features. Since this thesis is oriented towards the choice of an SD-WAN solution and the
transition to it from an enterprise’s point of view, this section does not dwell on presenting
each vendor’s proprietary system design. This information can be found on the vendor
site, on their webinars, etc. Instead it presents a comparison table summarizing some key
features that are relevant for the client. The criteria can be regrouped into six categories:
SD-WAN’s identity features, technical features relevant for compatibility with the current
network, performance-related features, management features, economic characteristics
and finally trust indicators.
The SD-WAN’s identity features are mostly useful to get familiarized with the
specific vocabulary of the company. Regarding the technical features, it is important to
verify whether the product has the possibility to integrate seamlessly with the company’s
current network. These features include the types of link supported, the dynamic routing
protocols supported, whether IPv6 is supported, whether some physical appliances
already on-site can be used for the solution simply by buying a license and doing an
upgrade.
Performance related features help predict how well the solution can preserve
quality of experience when faced with a high amount of traffic, link degradations,
malevolent users, etc.
The criterion “dynamic switching” is different from per-flow or -packet load-balancing.
It means that if a degradation suddenly occurs, it will be noticed quickly and the path will
be modified accordingly, in concordance with the specified QoS rules. Meanwhile, per-
flow and -packet load-balancing refer to link aggregation capabilities.
Management features give an indication of both the amount of control an
administrator has over the network, and the ease with which she can configure it.
Economic features inform the company of how the partnership will be: what is
the length of the contracts available, and what is the price scale.
The criterion “Communication Service Provider partners” is listed as part of the
“trust indicator” category: it indicates whether some ISP offers managed SD-WANs using
the vendor’s appliances. This can be a sign of reliability and market stability for the
vendor, as well as a proof that it works well for large scale networks. The trust indicator
category also contains the results of the 2018 NSS Lab test, in which calculated the Total
Cost of Ownership (TCO) per Mbps as well as a Quality of Experience (QoE) score for
both VoIP and video traffic. The QoE score is on a scale of 1 to 5, but there is a theoretical
maximum of 4,41 for VoIP and 4,53 for video.

Results and Discussion |
35
Chapter 4
Results and Discussion
This chapter presents the results obtained both through the laboratory tests, and through
the interviews and publicly available papers. The solutions are first evaluated based on
QoS criteria and other criteria, then the thesis analyzes how the company should choose
its SD-WAN (both the type and the vendor) before presenting a model for the WAN
transition.
4.1 Analysis based on QoS criteria
4.1.1 Latency
The latency issue can be separated into latency by design – addressed in 4.1.1.1 and
4.1.1.2 – and latency due to the technical capacities of the appliances used – addressed
in 4.1.1.3 with the results of the laboratory test.
4.1.1.1 Latency due to backhauling
Backhauling introduces considerable delays to the network. To give an example, the case
of a Hong-Kong site accessing the internet through the headquarters in Stockholm is
detailed. This scenario is extreme but not unrealistic: it was the case of one interviewed
company until a few years ago. [Appendix C]
Einstein’s theory of relativity states that the speed of light is the fastest speed
achievable for energy, information and all matter. Thus the speed of packets will always
be limited by the speed of light, which is c≈2,998.108m/s in vacuum. Currently, the fastest
type of transmission cable available is fiber optic cable, which has a performance close
to the speed of light. It is the medium most commonly used for long distances and all
modern submarine cables. High-speed fiber accounts for 25% of fixed internet
connections in OECD countries and is already predominant in countries like Korea, Japan
and Sweden [96]. Hence, the round-trip time for a Stockholm to Hong-Kong connection
will be calculated by assuming the use of a point-to-point optical cable following a
straight line – which is a simplified ideal scenario. The average refractive index in optical
fibers is n=1,5 [57] so the absolute maximal speed achievable in an optic fiber cable is
v =𝑐
𝑛 = 1,999.108m/s.

| Results and Discussion
36
The distance between Stockholm and Hong-Kong is d= 8220km as the crow flies.
It follows that the minimum round-trip time achievable for a connection between
Stockholm and Hong-Kong is RTT =2𝑑
𝑣 = 82,22ms.
The actual delay between the two sites will be higher due to the path not following
a straight line (the internet backbone only delivers best-effort performance), computing
time, possible security monitoring, etc. As an example of empirical value, the Dotcom-
Monitor reports an RTT of 278ms between Copenhagen and Hong-Kong over the internet
backbone [58].
Even though this value might seem small, it is already noticeable by a user. A
survey on latency impact on game players found that users experience a lagging feeling
as soon as there is 60ms or even 45ms delay [59]. Even when not using real-time
applications, an additional delay directly impacts the performance of TCP throughput
since the TCP protocol uses acknowledgements. The Mathis equation found by Mathis et
al. [60] states that:
𝑅 ≤MSS
RTT∗
1
√𝑝
with R being the rate, MSS the Maximum Segment Size, RTT the Round-Trip Time and
p the packet loss probability. This equation shows that the achievable rate is inversely
proportional to the round-trip time, therefore a high latency will result in a TCP
throughput degradation.
Hence it is not a viable solution to backhaul the traffic from Hong-Kong to
Stockholm, which is why most companies have at least one internet breakout per
continent. As mentioned previously, the second interviewed company added two internet
breakouts in America and Asia a couple of years ago due to a strong employee discontent
[Appendix C]. However, this is still not enough: the company mentioned that, despite
their three internet breakouts (in Stockholm, New-York and Hong-Kong), the employees
are still complaining about the poor network performance.
4.1.1.2 Latency for cloud access via private links
Due to MPLS’s lack of dynamism, providers are slow to offer connectivity to all the new
cloud datacenter locations; they are only gradually offering direct access to them, service
by service. A company can now for example buy ExpressRoute to access the Microsoft
cloud, Salesforce Express Connect to access Salesforce’s cloud, AWS Direct Connect for
access to the Amazon cloud, Google Interconnect Partner or Carrier Peer Link to access
respectively only Google Cloud Platform (GCP) or both GCP and the G suite, etc.
Purchasing all these links is expensive and it increases the complexity of the network
while still leading too unsatisfactory delays. One interviewed company having purchased
a 200Mbps ExpressRoute connection said it was reasonably priced (about 5000-
6000kr/month for 200Mbps of ExpressRoute [Appendix C]) but still not fast enough. It
is now planning to add internet breakout locations to solve the problem. Likewise, the
considered company has an ExpressRoute but the QoE is still too low. Cloud providers
such as Microsoft have private backbones with good performance so entering their
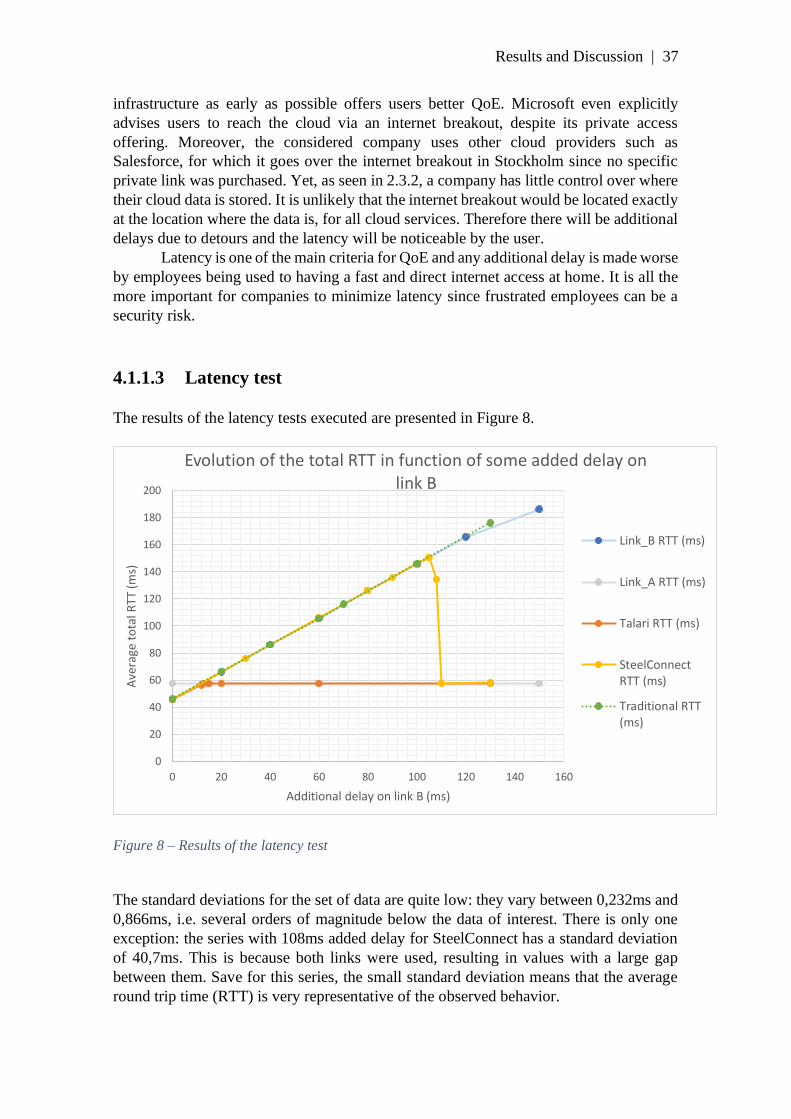
Results and Discussion |
37
infrastructure as early as possible offers users better QoE. Microsoft even explicitly
advises users to reach the cloud via an internet breakout, despite its private access
offering. Moreover, the considered company uses other cloud providers such as
Salesforce, for which it goes over the internet breakout in Stockholm since no specific
private link was purchased. Yet, as seen in 2.3.2, a company has little control over where
their cloud data is stored. It is unlikely that the internet breakout would be located exactly
at the location where the data is, for all cloud services. Therefore there will be additional
delays due to detours and the latency will be noticeable by the user.
Latency is one of the main criteria for QoE and any additional delay is made worse
by employees being used to having a fast and direct internet access at home. It is all the
more important for companies to minimize latency since frustrated employees can be a
security risk.
4.1.1.3 Latency test
The results of the latency tests executed are presented in Figure 8.
Figure 8 – Results of the latency test
The standard deviations for the set of data are quite low: they vary between 0,232ms and
0,866ms, i.e. several orders of magnitude below the data of interest. There is only one
exception: the series with 108ms added delay for SteelConnect has a standard deviation
of 40,7ms. This is because both links were used, resulting in values with a large gap
between them. Save for this series, the small standard deviation means that the average
round trip time (RTT) is very representative of the observed behavior.
0
20
40
60
80
100
120
140
160
180
200
0 20 40 60 80 100 120 140 160
Ave
rage
to
tal R
TT (
ms)
Additional delay on link B (ms)
Evolution of the total RTT in function of some added delay on link B
Link_B RTT (ms)
Link_A RTT (ms)
Talari RTT (ms)
SteelConnectRTT (ms)
Traditional RTT(ms)
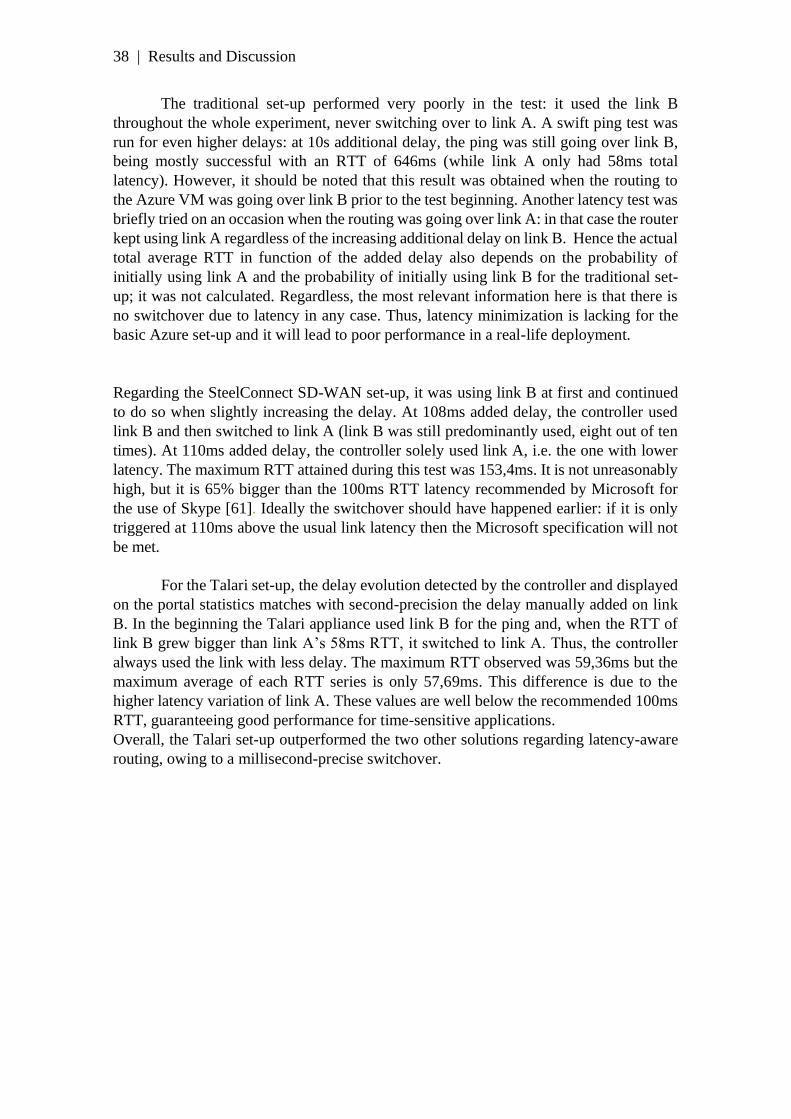
| Results and Discussion
38
The traditional set-up performed very poorly in the test: it used the link B
throughout the whole experiment, never switching over to link A. A swift ping test was
run for even higher delays: at 10s additional delay, the ping was still going over link B,
being mostly successful with an RTT of 646ms (while link A only had 58ms total
latency). However, it should be noted that this result was obtained when the routing to
the Azure VM was going over link B prior to the test beginning. Another latency test was
briefly tried on an occasion when the routing was going over link A: in that case the router
kept using link A regardless of the increasing additional delay on link B. Hence the actual
total average RTT in function of the added delay also depends on the probability of
initially using link A and the probability of initially using link B for the traditional set-
up; it was not calculated. Regardless, the most relevant information here is that there is
no switchover due to latency in any case. Thus, latency minimization is lacking for the
basic Azure set-up and it will lead to poor performance in a real-life deployment.
Regarding the SteelConnect SD-WAN set-up, it was using link B at first and continued
to do so when slightly increasing the delay. At 108ms added delay, the controller used
link B and then switched to link A (link B was still predominantly used, eight out of ten
times). At 110ms added delay, the controller solely used link A, i.e. the one with lower
latency. The maximum RTT attained during this test was 153,4ms. It is not unreasonably
high, but it is 65% bigger than the 100ms RTT latency recommended by Microsoft for
the use of Skype [61]. Ideally the switchover should have happened earlier: if it is only
triggered at 110ms above the usual link latency then the Microsoft specification will not
be met.
For the Talari set-up, the delay evolution detected by the controller and displayed
on the portal statistics matches with second-precision the delay manually added on link
B. In the beginning the Talari appliance used link B for the ping and, when the RTT of
link B grew bigger than link A’s 58ms RTT, it switched to link A. Thus, the controller
always used the link with less delay. The maximum RTT observed was 59,36ms but the
maximum average of each RTT series is only 57,69ms. This difference is due to the
higher latency variation of link A. These values are well below the recommended 100ms
RTT, guaranteeing good performance for time-sensitive applications.
Overall, the Talari set-up outperformed the two other solutions regarding latency-aware
routing, owing to a millisecond-precise switchover.

Results and Discussion |
39
4.1.2 Packet Loss
4.1.2.1 Packet loss with redundant links
The packet loss experiment tested the set-ups capacity to minimize packet loss for a
connection occurring over a virtual link, with one link having an increasing packet loss.
The results are summarized in Figure 9 and Figure 10.
Figure 9 – Median packet loss during the packet loss test
Figure 10 – Probability of using the non-lossy link during the packet loss test
0
0.2
0.4
0.6
0.8
1
1.2
0 0.2 0.4 0.5 0.6 0.7 1 3 5
Pro
bab
ility
of
usi
ng
the
link
wit
h t
he
leas
t p
acke
t lo
ss
Packet loss on link B (%)
Probabilty of using the healthiest linkwhen initial routing is over link B
Traditional: P_Tradi(good/init_B) SteelConnect: P_SC(good/init_B) Talari: P_Talari(good/init_B)

| Results and Discussion
40
Prior to analyzing the result data, a comment about the iperf tool should be made. It was
observed during the tests that the packet loss measured by iperf is about twice the amount
of the added packet loss induced by the WAN emulator. This seems suspicious because
the WAN emulator is in good working order and there is 0% packet loss when the WAN
emulator does not add any. Moreover, the packet loss info observed on Talari’s statistics
pages matched the WAN emulator packet loss value. Therefore, the correctness of the
packet loss value from the iperf utility can be questioned. Be that as it may, the iperf
measures are coherent between each other and simply seem to differ from reality by a
fixed coefficient. Moreover, the primary utility for these values is to indicate whether the
lossy link was used or not. Therefore, the data is still used to compare the different set-
ups.
The scattering of the test data is dichotomous since the path chosen either goes
over link A – in which case there is no loss – or over link B – in which case there is an
increasing amount of loss, infinitely superior to link A’s. A clear sign of the spread results
is that the standard variation is often at half the value of the data (e.g. 1,67 standard
deviation for the 3% packet loss test with SteelConnect). To observe the evolution of the
connection’s packet loss when one link is affected by packet loss, the first graph drawn
uses the median loss. It is more representative than the average loss because of the afore-
mentioned spread distribution. With the Riverbed set-up and 3% loss on link B, the link
A was used nine out of ten times with 0% loss, while the link B was used once with 5,28%
losses. The average packet loss is 0,528% while the median is 0%, making it less
misleading. A user’s experience would indeed not be a link suffering a constant 0,528%
packet loss but rather a link with no loss most of the time, and with some temporary
degradations. More details can be found in the appendix [Appendix A: Test results], such
as the maximum values, the standard deviation of each series, the average, the median
and the third quartile value.
To better represent the routing decision, a graph is also attached with the
appliance’s probability PAppliance(good) of using the healthy link. For 0% added packet
loss, both links are identically healthy so PX(good)=1.
The traditional set-up gives very bad results, with the UDP traffic still going
entirely over link B when it has 15% packet loss, leading to an Iperf measure of 30%
packet loss (not represented on the graphic to keep a legible scale).
It should be noted that the probability measured in this test is actually the conditional
probability PTradi(good/init_B), meaning the probability of using the good link knowing
that the initial routing was via the link B before the test started. The events “init_A” and
“init_B” form a partition of the probability space here, so the global probability
PTradi(good) can be calculated with the formula PTradi(good) = PTradi (good/init_A)*PTradi (init_A) + PTradi (good/init_B)*PTradi (init_B)
The probability PTradi (good/init_A) is equal to 1. This was tested at a point when the current
routing was over the link A: adding packet loss on link B did not change the routing. It is
also coherent with the empirical rule observed during all the tests, which was that, when
using a single session and under a relatively short period of time (e.g. about an hour), the
routing decision would not change as long as no cable was physically pulled out of the
Cisco router.

Results and Discussion |
41
If this traditional set-up were a true pure equal load-balancing and therefore
PTradi (init_A) = PTradi (init_B) = 0,5
Then the total general probability of using the healthy link would be: PTradi(good) = 0,5*1 + 0,5*0 = 0,5
This probability reflects the general probability over a large number of users and a large
period of time.
It is important to underline that the measured probability PTradi (good/init_B) which
is constantly null does not mean that, in a global context, the router would always choose
the link with most loss. However, it does mean that there is no switchover mechanism
with the basic configuration used. Microsoft recommends a packet loss inferior to 1% for
Skype use [61]. Even at 15% added loss, i.e. a whole order of magnitude above the
recommended limit, the lossy link is still used: it is not a satisfactory performance.
SteelConnect performed well for packet loss switchover: at 0,5% added loss it
started sometimes using the healthier link (3 out of 10 times) and at 1% added packet loss
the probability of using the lossy link is almost null. If this added loss is considered to be
the actual packet loss (instead of the Iperf value), this means that SC is close to
Microsoft’s criterion for packet loss. The maximum value measured is 5,28% packet loss
but the maximal third quartile of all the test series is 1,34% packet loss. This means that
for all series, at least 75% of the UDP traffic had less than 1,34% packet loss. This is a
good result.
The Talari set-up has the best performance and is therefore tested against very low
values of packet loss. For smallest loss emulated, i.e. 0,001%, both link A and B are used.
This cannot be seen from the Iperf loss values because the tool is not precise enough. It
was however verified by looking at each path’s individual traffic on the Talari portal. At
0,005% packet loss, both links are about equally used and the packet loss is noticed by
Iperf, with an average of 0,03% loss. At 0,01% packet loss, the lossless link is used 80%
of the time and at 0,05% it is used without fail. This threshold is more than ten times
better than for SteelConnect and infinitely better than for the traditional set-up. It vouches
for a very precise QoS detection system.
Here again, the switchover capacities of the traditional are not satisfactory. Both
SD-WAN solutions perform well, with Talari being one level of precision above SC.
4.1.2.2 Packet loss with one link
The failover experiment tests the set-ups capacity to quickly detect the failure of a link
and execute a failover. The results are presented in Figure 11, Figure 12 and Figure 13.
• General Comments
Two observations should be made on the traditional installation. Firstly, one should be
careful to use the right order for the routes in the router’s configuration file. Indeed, the
results for the traditional solution were much worse than the ones displayed here at first.
There were some seemingly illogical behaviors: for instance when disconnecting one

| Results and Discussion
42
link, both tunnels would go down; then, after several seconds, the tunnel corresponding
to the healthy link would come up again. This was solved by inverting the order of the
routes in the configuration: the two default routes should be in the same order as the two
tunnels routes, at least for a load-balancing solution. In this case, the link B is listed first.
After this modification, the behavior was as expected: when disconnecting a cable, only
the corresponding tunnel went down.
Still regarding the traditional case, when reconnecting link A the ping losses do
not happen immediately. At first everything continues as before and, after less than a
minute, the interface of link A gets an IP address from the DHCP server. Immediately
after, the pings fail (with the ping loss count specified in the table) before finally
succeeding again. The ping loss values focus on downtime, so this latency is not taken
into account here. It is however included in the time measures since the timing starts when
plugging in the cable and stops when the link came up.
TRADITIONAL SOLUTION Median Average
Third
Quartile Minimum Maximum
Standard
Deviation
Disconnect link A (pings lost) 124 111 127 46 128 25,5
Disconnect link B (pings lost) 7 6,6 7 6 7 0,517
Connect link A (pings lost) 65 65,2 80,8 30 106 23
Connect link B (pings lost) 0 0 0 0 0 0
Time before link A up again (s) 218 204 240 94 279 56,2
Time before link B up again (s) 161 158 177 116 191 25
Figure 11 – Results of the failover test for the traditional solution
STEELCONNECT
SOLUTION Median Average
Third
Quartile Minimum Maximum
Standard
Deviation
Disconnect link A (pings lost) 0 0 0 0 0 0
Disconnect link B (pings lost) 11 12,8 11,8 5 36 8,48
Connect link A (pings lost) 0 0 0 0 0 0
Connect link B (pings lost) 0 1,6 0 0 15 4,72
Time before link A up again (s) 1 1,2 1 1 2 0,422
Time before link B up again (s) 24 47,4 81,5 2 140 50,6
Figure 12 – Results of the failover test for the SteelConnect solution

Results and Discussion |
43
TALARI SOLUTION Median Average
Third
Quartile Minimum Maximum
Standard
Deviation
Disconnect link A (pings lost) 0 0,1 0 0 1 0,316
Disconnect link B (pings lost) 0 0,4 1 0 1 0,516
Connect link A (pings lost) 0 0 0 0 0 0
Connect link B (pings lost) 0 0 0 0 0 0
Time before link A up again (s) 70 70,3 75,8 33 134 28,6
Time before link A good again (s) 42 42,5 42,8 33 62 7,85
Time before link B up again (s) 73 67,3 79,5 41 89 18,5
Time before link B good again (s) 42 43,7 43 41 60 5,79
Figure 13 – Results of the failover test for the Talari solution
For the Talari results there are two additional columns, namely “Time before link A (resp.
B) is good”. Indeed, the Talari controller does have a memory of link states, as surmised
for SteelConnect. The Talari Theory of Operation clearly states that a link which has been
observed to have bad performance will not be used “until it has been observed to be stable
for a significant period” [62]. This was observed during the experiment: when connecting
a link, both corresponding unidirectional paths go from the “Dead” state to “Bad”. After
having been Bad for 10ms, the path then changes to “Good”. In the beginning of the test,
this change to “Good” was simultaneous with the WAN link coming up. After about three
tests on each link, there was an additional delay of about 40ms introduced between these
two events. For this reason, both values are noted separately.
• Routing bias
For the traditional set-up, there are on average 16,8 times more lost pings when pulling
out link A than when pulling out link B. This indicates that the load balancing was not
perfectly even during the test, but rather that link A was favored. This is corroborated by
the fact that when re-plugging link B, no ping loss occurred, whereas when re-plugging
link A there were on average 65,2 pings lost. This signifies that the router tries to switch
the routing back over link A as soon as it comes up again. Such a biased load-balancing
technique makes the results both better and worse: better when the link B is degraded,
and worse when the link A is degraded, because it will always be the one in use and hence
affected by the link worsening. Therefore, the data obtained when modifying link B is
only moderately relevant because it represents an ideal condition scenario. It is not an
extremely unlikely scenario, but a blackout failover solution should focus on the worst-
case scenario to minimize the maximum downtime values. Thus the focus will be on the
data obtained when modifying link A.
A similar situation occurred with the SteelConnect set-up. Indeed, SC performed
exceedingly well for link A: the latter took on average 1s to come up again (with a
standard deviation of 0,422s) and when experiencing a black-out there was never a single
ping lost. These numbers are too good to be true, especially considering the discrepancy

| Results and Discussion
44
with the other link’s results. Instead, they indicate that the SteelConnect used almost
exclusively link B, which explains why changing conditions on link A have little to no
impact and conversely for link B. The two links were indicated with the same priority in
the GUI set-up, however it was manually specified in the QoS criteria that the Bahnhof
link has much more bandwidth available. The bandwidth was limited using the WAN
emulator but since SteelConnect does not have automatic bandwidth detection it must
have still used the theoretic values. It seems likely that SteelConnect used this as the
decisive criteria when choosing how to route the traffic. To make sure that this preference
towards link B was not due to a default favoring of WAN 1, additional tests were run with
link B connected on the port “WAN 2” and the link A on “WAN 1”. The results were
much the same as with the opposite ports. This means that the most significative results
of the test are the ones when link B is changing because that is when an actual failover is
taking place.
• Comparison
Regarding the duration of the blackout, i.e. the number of pings lost, the results are worst
for the traditional set-up. Indeed, when link A fails it leads to blackouts lasting 1min51
on average (111 pings lost). For SC the results are one order of magnitude smaller, with
an average of 12,8s of blackout (but with a high standard deviation at 8,48s). Finally,
Talari has the best results with an average of downtime under half-a-second (0,1s and
0,4s respectively for each link).
All in all, the Talari set-up performs best in case of a blackout. The traditional set-
up has the worst performance, but its results could likely be improved by implementing
more sophisticated features such as SLA tracking on the router. Azure strongly limits the
ping and traceroute utilities on all of their services for security reasons, but it is possible
to ping the private addresses inside the Azure network when going through the tunnel.
Hence it should be possible to set-up the SLA tracking by regularly pinging the Ubuntu
VM. However this tracking would only be on the Stockholm side; it cannot currently be
implemented on the Azure gateway (to the best of the author’s knowledge). The routing
behavior of Azure in such a scenario would need to be tested to ascertain the validity of
this option. Otherwise BGP can also be implement for failover, as mentioned in the
description of traditional set-up, but this would necessitate more physical appliances on
site.

Results and Discussion |
45
4.1.3 Bandwidth
4.1.3.1 Using new links quickly
The failover test presented in 4.1.2. show that the set-ups take more or less time to detect
new links and use them. Utilizing links as soon as they are available means efficiently
exploiting the bandwidth resource available.
• Pings lost when connecting
When connecting a link again, the solutions performed in the same order. The Talari never
experienced any loss of connectivity during such an operation. This would be the
expected behavior since the connectivity is already established and the tester is simply
adding an additional link. However, for the traditional and the SC set-up, this causes some
losses: respectively 65,2 and 1,6 pings were lost on average, with a maximum of 106 resp.
15 pings lost. This either means that the routing switches to the new link before it is fully
functional, or that the switching process is so slow that it creates some downtime
(unlikely). The unbiased routing of these two solutions could be a reason for this
seemingly premature switchover. Such down-time can be especially dangerous because
it is unexpected. When troubleshooting or preparing for a network change, an
administrator would typically not anticipate that an additional functional link could cause
downtime.
• Time before link up
As mentioned previously, DHCP incurs some additional latency for the link coming up
in the traditional set-up: on average, link A takes 46s longer to come up than link B. In
both cases this time is quite high (204s resp. 158s) and with a high standard deviation
(56,2s resp. 25s). This long delay represents a waste of usable resources.
Regarding the SC set-up, the time it takes for link B to come up again is quite high
– 47,4s on average – but, more remarkably, the values are very scattered. This is clearly
showcased by the difference between the median and the average (24s versus 47,4s) and
the very high standard deviance of 50,6s. During the experiments the link came up again
quickly at first but, as the test continued, the delay grew longer. This hints at a memory
mechanism inside the SteelConnect, in which it trusts the link less with every failure and
tests it more thoroughly each time it comes up again, before putting it in use. When
waiting a long time (about an hour) and redoing only one blackout test, the performance
was better again. This is a good behavior: that memory is an asset and allows for a prompt
use of a new link, except for when said link is flapping at a high frequency. This exception
spares computing resources and offers a better performance by limiting the number of
switchovers to be executed.
Regarding the Talari set-up, the time before the link is good again is relatively
constant and similar for both links, with an average of 42,8s for link A (resp. 43,0s for
link B) and a standard deviance of 7,85s (resp. 5,79s). This delay is similar to the one for
the SteelConnect solution (47,4s) and it is about 3,6 times smaller than for the traditional
solution.

| Results and Discussion
46
The interval for getting the link up is much more variable, with an average at 75,8s
for link A (resp. 79,5 for link B) and a standard deviance of 28,6s (resp. 18,5). Here the
standard deviance is at about 40% of the considered data whereas it is only at 18% for the
“link good” notice. This is because, like for SteelConnect, the data is very spread and the
delay increases with the number of failures. The memory seems to be rather short-term
because as soon as the tests were more separated in time, this interval went down again.
For instance, after waiting 10 minutes it was down to a 5s delay.
When comparing SC and Talari, the links take slightly longer to come up for
Talari. While their average values are quite similar when using the link good event for
Talari, the minimum time before link B is up for SC is only 2s whereas it is 33s for link
A (and 41s for link B) in the Talari case. Moreover, the actual link up event for Talari
takes longer than the link good, and is on average 145% longer than SC. However, it was
seen previously that SC sometimes creates downtime when a new link is added whereas
Talari does not. It might be better for a set-up to take longer before using a link if it
guarantees an uninterrupted connectivity.
4.1.3.2 Using present links optimally
Using the available links optimally means being able to detect the bandwidth available
on each link and executing load-balancing to send traffic in the corresponding
proportions.
The link aggregation experiment tests how much traffic the set-ups can send
through the links for a UDP connection. The average bitrate values for each series of ten
tests is presented in Figure 14 and Figure 15.
From Azure to Stockholm:
Bandwidth on
link B (Mbps)
Number of
parallel clients
Traditional:
Bitrate (Mbps)
SteelConnect:
Bitrate (Mbps)
Talari: Bitrate
(Mbps)
10 1 9,19 8,86 18,3
10 2 15,8 8,82 18,2
10 4 15,1 8,31 18,2
5 1 4,59 4,57 12,9
5 2 15,5 4,56 13,2
5 4 15,3 4,48 13,3
1 1 0,915 0,871 9,9
1 2 12,1 0,872 10,3
1 4 12,1 0,795 10,4
Figure 14 – Results of the link aggregation test from Azure to Stockholm

Results and Discussion |
47
From Stockholm to Azure:
Bandwidth on
link B (Mbps)
Number of
parallel clients
Traditional:
Bitrate
(Mbps)
SteelConnect:
Bitrate (Mbps)
Talari: Bitrate
(Mbps)
1 1 0,848 0,849 0,865
1 2 0,907 0,873 0,861
1 4 0,943 0,866 0,875
Figure 15 – Results of the link aggregation test from Stockholm to Azure
• Load-balancing:
Regarding SteelConnect, its load-balancing technique is based on the source and
destination IP addresses [63]. Since the test sends traffic between two fixed endpoints
using the same IP addresses, the SteelConnect appliances only ever use one link at a time.
Thus, the SC performance is the worst of the three and simply correspond to link B’s
bandwidth capacity; there is no true link aggregation. However, in a real-life scenario
there would most likely be several users trying to access multiple resources on Azure, so
this load-balancing technique could be efficient. It is a simple but trusted method that
often works well enough. It does reach its limit in the case of one user having a very high
usage of one resource. Prospective clients need to identify which use-case is closest to
their needs and determine whether this is a viable solution for them. Alternatively, when
using a SteelHead appliance, the load-balancing technique is more sophisticated and
relies on Application IDs rather than IP addresses [64]. This enables a more agile load-
balancing.
The Talari solution is the only one to do per-packet load-balancing. Thus, even
when there is only one Iperf TCP session, the appliance is able to use both ISP links.
When link B is at 5Mbps for example, it can achieve a bitrate of 12,0Mbps for one TCP
connection, while both other solutions only achieve 4,59Mbps and 4,57Mbps. As a
consequence, the Talari performance is the same for one, two or four TCP streams.
When comparing the traditional and the Talari (in the cases where both use the
two links), Talari only reaches about 86% of the bitrate achieved by the traditional set-
up. This could partly be due to test imprecisions, but not only (the highest relevant
standard deviation is at 0,427Mbps). Another factor could be that the Talari appliance
uses the proprietary Talari Reliable Protocol (TRP) to encapsulate every packet, which
adds a packet tag with, amongst others, a time stamp and sequence numbers for both the
path level and the application session level. This offers superior performance for traffic
management, but it adds some overhead. Talari also reserves a small part of the available
bandwidth for some applications, e.g. VoIP. Here the default settings were left as is, so
there is a 100Kbps reservation in both directions for the internet on link B, and a 180Kbps
reservation in both directions for the internet on link A. This slightly limits the bandwidth
available for Iperf. Lastly another possible reason could be a higher use of the links at the
time of the tests. Yet this is unlikely since only link B was used by others and it has a
very high bandwidth capacity, so that any influence by other users should be negligible.
Regarding the traditional set-up, the behavior is different in each direction. From
Azure to Stockholm, i.e. when the Azure VPN Gateway is making the routing decisions,

| Results and Discussion
48
there is load-balancing per-session but not per-packet. For instance with link B at
10Mbps, one session goes over one link with 9,19Mbps whereas two sessions use both
links and achieve 15,8 Mbps.
From Stockholm to Azure however, there is no load-balancing observed. The
results are about the same for one, two or four TCP streams. Although the one-stream
bitrate is slightly lower, the tunnels’ traffic was checked during each test and it is certain
that only one link was used at a time. This is because the simplest configuration was used
for the Cisco router, with two static routes. By default, a Cisco router uses the Cisco
Express Forwarding (CEF) with per-destination load-balancing [65]. It would be possible
to manually change it to per-packet load-balancing but Cisco recommends against it since
it highly increases the risk for out-of-sequence (OOS) packets. In a traditional solution
there is not necessarily a correction system, it depends on the type of traffic (e.g. coping
system inbuilt in TCP but not UDP). Hence, these OOS packets could, amongst other,
lead to poor VoIP quality. For this reason, the per-destination option was kept for load-
balancing, resulting in a performance inferior by 56% to the Talari set-up. Like the load-
balancing solution of SC, a distribution of traffic would however be observed in a more
global context with many users.
On a side note, it is very surprising that the traditional set-up reaches the same
performance for 10Mbps and 5Mbps on link B: in both cases it achieves about 15Mps. It
means that either it was not fully utilizing the links with 10Mbps or it over-evaluated the
throughput for 5Mbps. Logically it is the value for link B at 10Mbps which is too low.
For one client it reaches 9,19Mbps (using link B), so with two clients it should be able to
fully utilize link A which offers about 10Mbps for the downlink. Thus the total bitrate
should be closer to 19Mbps than the observed 15Mbps. In the detail of the distribution
over the parallel links, Iperf indicates that it sent on average 8,8Mbps on one link and
7,0Mbps on the other for the 10Mbps case; for the 5Mbps it was a 4,6Mbps and 10,9Mbps
distribution. This proves that the Azure VPN GW can fully utilize the link A. Admittedly
the latter’s bandwidth varies slightly over time: it is possible that during this particular
test the bandwidth available was somewhat lower, which could lead to these results. In
any case, this value should be taken with a critical mindset.
• Detection of limited bandwidth and choice of best available link
One surprising fact is that, for the traditional and SC set-ups, if only one link is used then
it is always link B, even when it has a much lower bandwidth than link A. For instance
when link B is limited to 5Mbps, it is still preferred to the 10Mbps link A. For
SteelConnect, this could be due to the “interactive metric” type of Iperf, which prioritizes
the link with lower latency, i.e. link B. Another option could have been to use
differentiated services point codes (DSCP) to mark the Iperf traffic as either Streaming
Media (50% bandwidth, assured forwarding) or Best Effort (default mode, 100%
bandwidth, good for file transfers for example). However, SC does not have automatic
bandwidth detection: it will always refer to the values manually entered in the QoS
configuration, i.e. 100Mbps and 10Mbps in this case. Therefore, even if the traffic type
were changed, link B would still systematically be the one chosen.

Results and Discussion |
49
For the Azure VPN Gateway, the decision process for routing in this load-
balancing configuration is opaque. No rule was added by the administrator, the behavior
observed is the default one. The bandwidth capacities are not entered in the configuration
set-up so that cannot be the reason. One very simple explanation could be that the link B
gateway and tunnel were configured first during the set-up. Thus, the Azure GW could
try the routes sequentially, following the chronological order. This would explain why
link B is generally favored in all of the tests.
4.2 Other criteria
Some considerations obtained from the laboratory tests are summarized in Figure 16
using user scores. The individual considerations are detailed in the next sub-sections.
All the previous considerations regarding installation, monitoring and level of control are
summarized in Figure 16 using a user score between 1 and 5 for each criterion.
Figure 16 – User score for the three solutions

| Results and Discussion
50
4.2.1 Security
• Rogue internet links
One interviewed company reported that frustrated employees at remote sites decided to
take matters into their own hands and installed rogue local internet connections
[Appendix C]. In such a case, the IT team loses a considerable amount of network
overview and has no way to intervene. The self-installed internet breakouts are likely to
be basic and without any security measure, thus making the network vulnerable to attacks.
The risks can be limited by keeping the internet link separated from the internal network,
e.g. by having employees switch the cable connection when using so as not to have a
simultaneous connection to both. Yet as the IT team has no control whatsoever and the
staff’s use-method cannot be supervised, having a rogue internet connection will always
be more dangerous. Such a situation is also likely to be suboptimal in terms of economy:
the local employees having purchased the link do not necessarily have experience in this
domain so they might choose a bad deal, e.g. a bad price/quality ratio. Moreover, if the
link was acquired by the official company IT team, they could probably get interesting
discounts if purchasing several links from one ISP implanted in several locations. Lastly
if this additional internet link was officially added to the WAN design it could be used to
the fullest of its capacity by using it for load-balancing, for failover, etc. This lowers the
link price in respect to its use.
• MPLS intrinsic security
Regarding the security of the MPLS network itself, some companies feel that MPLS is a
more secure solution than public links, even without any additional security feature
installed and when simply sending unencrypted traffic. Indeed, the traffic is on a
physically separate network belonging to the carrier, so this de-facto strongly limits the
number of people having access to it. However, the MPLS provider has multiple
customers so it is not impossible that there would be a malevolent user on the same
network. Moreover, in addition to trusting all the other users from the network, this also
means trusting the service provider itself. Yet numerous cases have been coming to light
over the last years, about carriers selling their customer data or simply using it to their
own profit.
The latest scandal, the Securus case (which is still ongoing) was revealed by The
New York Times in May 2018 [66], and involved major American carriers selling their
client data to third parties. Yet the chain of data reselling was not correctly verified, which
enabled Securus to allow the police to track all mobile users of these carriers without their
consent and without a warrant. To make matters worse, Securus was then hacked,
spreading sensitive information outside of the police force [67]. When faced with this
revelation, Verizon immediately promised to terminate the problematic partnership, but
AT&T, T-Mobile and Sprint needed to be prompted by Senator Wyden first before
committing to investigate [68]. Even when faced with opprobrium, companies are slow
to change their practices: in January 2019, Senator Wyden called out the carriers on their
“empty promises to consumers” in a tweet and condemned their lack of responsiveness
to the problem [69]. Consequently, it appears safer not to trust carriers and to secure data
as much as possible, ideally end-to-end.

Results and Discussion |
51
In some cases, carrier’s use of data can be somewhat regulated by setting up
rigorous contracts in the beginning of the partnership [Appendix C], but even then there
can always be cases where a higher authority has precedence. For instance, in some
countries, all carriers are legally forced to submit all their client data to the government
upon request.
In the EU the retention of data is quite regulated presently, with the Right to Be Forgotten
and the General Data Protection Regulation (GDPR). The targeted retention of data can
be accepted in some cases, but any blanket indiscriminate data retention is considered
unlawful by the EU Court of Justice [70]. However, a few years ago there used to be the
EU Data Retention Directive (DRD) which forced all service providers to keep customer
data between six months to two years. This was applicable to all EU citizens and was in
force between 2006 and 2014, date at which the EU Court of Justice annulled the
directive. This means that, up to this point, all European users who were sending
unencrypted traffic over MPLS were unwittingly giving away all of their data to be stored
by the provider and readily available, at least to the government, for up to two years.
In the USA there is currently no obligatory data retention for ISPs and
telecommunication providers. However, carriers do often keep information for their own
benefit and this use is not regulated in the USA. The Federal Communications
Commission (FCC) had accepted in 2016 to limit the automatically recorded data to only
IP and MAC addresses, and require explicit consent for data such as browsing history and
app usage. However, this rule was repealed in 2017 under the Trump administration, a
few months before it would have gone into effect. This means that all carriers are free to
retain as much information as they want; and if they do, the US government can then
easily access it by issuing a warrant or a non-disclosable National Security Letter (i.e. an
administrative subpoena) [71].
Thus, it is still better to have encryption in place, for instance by configuring IPsec
tunnels over the MPLS network. These tunnels should be installed by the client on their
appliances on-site in order to have security all the way, last-mile included. However this
requires a lot of manual configuration by the IT-team, especially if it wants to have a full-
mesh network: a network with 20 sites would need n =20∗19
2= 190 tunnels, which
means configuring 380 tunnel endpoints. Some more advanced solutions such as dynamic
multipoint VPN (DMVPN) are possible to bypass the need for manual configuration, but
they are more complex.
Even if many encryptions could still be broken given the proper means, it is
always better to lower the risk of breach. This is all the more so in a context where there
can be political conflicts, e.g. for a company having partnerships with rival nations as
seen in one interview [Appendix C].
• SD-WAN intrinsic security
It has been established that the backhauling design is often used because it enables the
company to only install extensive security stacks at the hub sites; this design can be
improved by using SD-WAN appliances. Since application recognition is an intrinsic part
of SD-WAN, most vendors allow for the configuration of white-listed apps that are
directly sent out on the internet, while sending unrecognized or suspicious traffic to the
security appliances at the nearest hub, in a process called service chaining. This allows

| Results and Discussion
52
for good connectivity to cloud applications without the need for additional security
measures at every site. For internet access in general, some sites can be white-listed but
this method should be used with caution since attackers can try to imitate traffic from the
whitelisted services and thus bypass security measures.
All SD-WAN appliances have at least basic security measures inbuilt (e.g. stateful
firewall, encryption), and sometimes even more advanced features such as deep packet
inspection and integrated next generation firewalls. All vendors offer VPN tunnels
automatically built between the Edges. This security is however not all-encompassing: it
can be enough for small office sites, but it should be complemented with additional
measures at locations with internet breakouts and at sensitive sites such as the DC
[Appendix C].
SD-WAN also offers other alternatives: it greatly facilitates the use of service
chaining with automation, notably with cloud security solutions such as Zscaler or Palo
Alto’s GlobalProtect. These alternatives are a way to have internet breakout at every site
for an added cost but with simple logistics.
4.2.2 Ease and speed of installation
The considerations obtained from the laboratory tests are summarized in Figure 16 using
user scores.
• Physical appliances
The physical appliances are all very similar: they are of comparable size, have about the
same amount of ports (this also depends on the model size chosen) and the same use of
the diodes. However, the SteelConnect appliance used has a power inlet situated at the
front and the DC power cable sits quite loosely. As a result, when pulling out a WAN
cable for the failover test, it happened several times that the power cable got disconnected.
Higher SteelConnect models such as the SDI-330 have an AC power supply inlet at the
back [72], which is a much better option.
The Talari E100 has a useful small screen that can for example display status
information or the management address configured.
• Traditional installation
Regarding the Stockholm side of the traditional implementation, the set-up was like any
usual configuration of a Cisco router with VPN tunnels connections. It was made easier
by the configuration file available on the Azure GUI. This automated configuration for
site-to-site VPN is currently available for Cisco, Juniper and Ubiquiti appliances [73]. As
seen in the analysis for the traditional failover test, some configurations can seem to work
but actually be faulty, leading to a tricky troubleshooting. When the routes were in the
wrong order during the lab, no error message came up. Consequently, the IT team needs
to have a good skill level: it is not a beginner-user friendly solution.

Results and Discussion |
53
Regarding the Azure side of the traditional set-up, there are three main ways to
proceed. An administrator can either use the GUI i.e. the Azure portal, the Azure
PowerShell or the Azure CLI. Only the first option was used during this study. The GUI
is good for a first approach since it is intuitive. Here there were few instances to configure
so the portal suited the task perfectly. However, in a context with many appliances
needing to be deployed with similar configurations, choosing a command-line based
option would be more appropriate and time-saving. This section does not comment the
entirety of the Azure interactions since many of them were the same for all set-ups (e.g.
creating a virtual machine, assigning IP addresses, creating nets and subnets, etc.). Rather,
it focuses on the specificities of each solution.
Setting up the Azure VPN gateway was very easy. A redundant manual
configuration was however required for the local side: the local gateway and the on-site
side of the tunnel need to be configured both on the physical router and on the Azure
portal. However, this drawback is alleviated by the automated configuration file
previously mentioned.
The online help documentation and forums are not yet very furnished so that it
can be difficult to find information if one wants to implement a set-up different from the
official documentation. Typically, the only set-up with failover found in the
documentation is the one with BGP [74]. As explained earlier, this thesis chose not to
implement BGP and to do a more basic set-up by simply configuring both VPN tunnels.
Even if the effective routing tables of each NIC card are viewable on the portal and give
a good indication of what will happen, the gateway is still somewhat of a black box. It
wasn’t until after running some tests that it became certain that the VPN Gateway indeed
uses both links with the configuration chosen.
The traditional implementation is the one with the smallest learning curve since it
only builds on Azure knowledge (which is needed for all three solutions) and Cisco router
knowledge. It is highly likely that the IT team already has the necessary skills for this;
otherwise they could also choose whichever vendor they are more comfortable with, with
a preference for Juniper or Ubiquiti since they are the two other vendors with available
automatic scripting.
A drawback of the traditional solution is that it does not allow for automatic
DHCP address discovery. Every time the system is set up again, link A gets a new IP
address assigned by the DHCP and the configurator needs to manually replace the
configured IP both on the router and on the “local gateway” instance on Azure. It is a
redundant and tedious task. A workaround could be to assign one IP address from the
DHCP pool to the tunnel in order to always keep the same address. This however requires
some additional configuration steps and it diminishes the dynamicity of the network.
This solution requires the presence of a qualified IT-employee on site. In theory,
the router can be configured by distance via ssh but this is difficult to execute when it still
has a blank configuration, it should ideally at least already have a public IP address.
Another possibility could be to have an administrator manually configure the router at the
headquarters and then ship it to the local site. However, this technique presents some
security problems, e.g. if the appliance is stolen during transport. Moreover, it is not very
efficient since it its highly likely that there will be some troubleshooting needed, which
will be hard to execute remotely.
| Results and Discussion
54
• SteelConnect installation
The SteelConnect is very easy to set up. Configuration is done via a GUI portal, which is
located on AWS in this case. This means that the monitoring and managing platform is
always available, even if all the appliances are shut down. The configuration is first
executed on the portal, by declaring all the sites, WANs, links, SC appliances, etc., and
then the Azure account is linked to the SC one using identification numbers and a secret
key. All the Azure nets and subnets then appear on the SC manager, and a ready-to-use
virtual SC can be deployed with one click. Hence the installation process is very intuitive:
it only takes several minutes to deploy the SD-WAN connection to Azure and get a
functioning tunnel. This one-click installation for Azure integration is one of
SteelConnect’s strong points; it hides all the complexity from the user and is very fast
and efficient. Some could argue that it diminishes the administrator’s level of control by
reducing the number of options made available; however, these can be still be changed
afterwards by going on the Azure portal and changing the parameters of the objects
created by Riverbed.
The SteelConnect solution supports automatic DHCP detection and does not
require the presence of a technical expert on site. Indeed, the SC appliance simply needs
to be plugged in (easily achievable by any staff member with the help of pictures
[Appendix C]); the appliance then downloads the configuration automatically.
• Talari installation
The virtual Talari appliance needs to be created on the Azure portal, along with the correct
NIC cards, the correct routing tables, the correct security groups, etc. as detailed in the
documentation. This configuration is slightly redundant with the one on the Talari
manager, where the administrator also needs to indicate all the IP addresses, routes, etc.
The Talari set-up configuration is less intuitive than for SC as it has many options
and a less graphical interface: this solution is the one with the highest learning curve. The
configuration can be done via an “Advanced” interface which contains a comprehensive
list of all the possible options, or via a “Basic” interface which limits the options to the
essential ones and uses some automation. The second mode is much more user-friendly
and appropriate for a first approach to the Talari manager. It is however recommended to
use the Advanced mode later on since Talari’s numerous configuration possibilities are
its strong suit. With experience it is easy to set-up exactly what the client wants, up to the
smallest detail.
The Talari solution offers automatic DHCP client address detection for client
appliances (not for the NCN). Like for SC, this set-up does not require the presence of an
IT-employee on site: using an internet connection with DHCP and DNS, a client
appliance can automatically download the configuration file without the need for any
manual configuration [75]. The employee at the site simply needs to correctly plug in the
cables.
• Installation of MPLS links
MPLS takes a long time to install and is therefore not dynamic – no change in the network
can be made with immediacy. The interviewed companies experienced delays of up to 6
months to get MPLS connectivity at a new site. One company even mentioned that the
move from one building to another in the same street in the USA took half a year; in the
Results and Discussion |
55
mean time they were forced to use a VPN over internet [Appendix C]. The higher the
bandwidth capacity of the purchased link, the more this installation time will increase.
This strong inertia also means that there is a vendor lock-in. Considering the delay it
would take to get the same MPLS network connectivity with another provider, changing
provider is not a realistic option and is avoided. Therefore, the VPN solution mentioned
is another option to for companies to consider.
• Availability of internet links
For very isolated locations, internet is not always available [Appendix B]. In such cases,
MPLS is more flexible since the provider can come and install the necessary cables –
provided the company is ready to pay the price. However, internet access is constantly
being improved and there are numerous projects of new infrastructure installations. The
EU has for instance set a Digital Agenda where it aims to provide all European
households with access to fast broadband (i.e. at least 30Mbps) by 2020 and even to
provide at least 50% of them with ultra-fast broadband (i.e. more than 100Mbps).
Internet performance and coverage are especially good in Europe and in big cities,
meaning companies implemented there can rely more heavily on internet links. Yet the
coverage is not uniform and some areas remain behind. A 2018 report by the European
Court of Auditors about “Broadband in the EU Member States” found that not all areas
will achieve the fast broadband target by 2020. Specifically, both France and Greece were
only at about 50% coverage in 2017 due to problematic rural areas, and thus had the worst
results.
4.2.3 Visualization and monitoring
The considerations obtained from the laboratory tests are summarized in Figure 16 using
user scores.
• Traditional solution
The graphics and statistics available on the Azure portal are quite exhaustive and user-
friendly. Due to Azure explicating all price expenses, it offers very particular information
such as the number of bytes in and out of the network, the CPU usage, etc. For the tests,
a graphic with the average bandwidth separated by remote IP allowed to see the individual
traffic of each tunnel.
However, the graphics are not totally instantaneous: there are several minutes of latency,
with the latest values only being shown as dotted lines instead of continuous lines. This
can be an issue if the monitoring needs to be exactly real-time.
Some usual troubleshooting utilities such as ping and traceroute are directly
present on the Azure portal. Their use is very intuitive and easy, although there is again
a non-negligible delay before getting the results (e.g. a couple of minutes to get the ping
results). Some more complex troubleshooting is also possible, such as the VPN
connection troubleshooting which can for example warn if there is a key mismatch. The
visibility on the local site is the same as for a usual Cisco router; everything happens via
CLI.

| Results and Discussion
56
• SteelConnect Solution
The Riverbed portal has a very graphical design. It is very good for application
recognition and categorization, with 25 groups already predefined by default (Business,
News, Social networking, Cloud storage, etc.). It has health notification as well as an
event manager. Although the portal design is helpful for the configuration, it can be
confusing for monitoring due to too many entwined tabs. The loss and congestion values
are for example not easy to find. The best method found was to go inside the WAN uplink
tab and click on one particular link; yet even there only real-time values are shown, there
is no timeline of the past performance. The portal is almost too simplistic in some regards:
the graphics and statistics data included are not very precise. For instance to observe the
amount of traffic it is not possible to see which link of the WAN is being used, they are
not distinguished.
• Talari Solution
The Talari portal is very detailed. It can show many information and very precisely, such
as the bandwidth, jitter, latency or packet loss of a unidirectional link or of the entire
conduit (i.e. the aggregation of both links). It has an entire section called Reports, which
contains detailed data and graphics on WAN link usage and performance. It has a default
memory setting which allows for an activity timeline view over more than 24 hours. It
also has detailed reports with goodtime, uptime, badtime, downtime and incidents for
each unidirectional link. The portal contains some integrated troubleshooting tools such
as ping, traceroute, testing the available bandwidth of a link, etc. Although there are many
side-tabs, the search bar always allows for an easy and direct access to each page.
The Talari solution was found to be the solution with the best monitoring
possibilities during the experiments and did not necessitate any other third party utility
for analysis. Conversely the SteelConnect set-up was did not provide sufficient
information regarding the link usage and had to be complemented e.g. with the
monitoring tool of the WAN emulator.
4.2.4 Level of control
The considerations obtained from the laboratory tests are summarized in Figure 16 using
user scores.
The Azure VPN gateway has very little control possibilities when compared to
the other two solutions. It is only possible to specify routes for specific subnetworks, not
based on applications or ports for instance. It is not possible to add traffic rules to specify
whether a traffic is more sensitive to packet loss, latency, etc. The solution is mostly a
black box that is used as is. On the Stockholm side there are more possibilities, depending
on the appliance used. Here, the Cisco router could have implemented more precise
routing rules by using Policy Based Routing. However, this would only apply to the traffic
originating from the Stockholm site.

Results and Discussion |
57
SteelConnect has more options that can be configured by an administrator. It has
a very good application detection system and allows for an easy set-up of various traffic
rules for each application or application class. However, as mentioned in the SC set-up
description, if two links are configured as part of the same WAN, then they cannot be
dissociated for routing rules. Conversely, if they are set up as part of two different WANs,
an administrator can specify which link is used for what traffic, but there will no longer
be automatic failover and switchover. This was the main limitation observer in terms of
control possibilities.
The inner algorithms of the Talari solution are opaque for proprietary reasons, but in the
advanced configuration mode, every parameter used by the controller for computation
can be specified by the administrator. An administrator can for example configure
whether port pairs should be fail-to-wire or fail-to-block, specify the maximal delay
admissible for each WAN link, reserve some bandwidth on each link, decide on the use-
share of each type of traffic for each link (used in case the link are congested), etc. The
Talari set-up is the most configurable of the three tested in this thesis.
4.2.5 Price
The comparison executed is between the tree set-ups, so the price of elements that are the
same everywhere (e.g. the price of a public IP, of data transfers, etc.) are not considered.
• Traditional set-up
The VPN Gateway VpnGw1 (which is the lowest option that supports BGP and has a
bandwidth of 650Mbps) costs 0,19 USD/hour i.e. 1678 USD/year [76]. The Cisco router
costs about 400 USD (average price found on Amazon). Therefore, the total price for a
year is 2078 USD. The price without hardware is 1678 USD.
• SteelConnect set-up
The physical SDI-130, i.e. the SC hardware, costs 850 USD and a Riverbed license of
25Mbps costs 1164 USD/year (prices provided by Curitiba). On Azure marketplace, the
price for the low-entry recommended machine DS2V2 is 0,346 USD per hour [77]
(including both the infrastructure and software cost), i.e. 1478 USD per year. Therefore,
the total price for a year is 3492 USD. The price without hardware is 2642 USD.
• Talari set-up
The physical E100 costs 3295 USD and a Talari license of 20Mbps costs 1645 USD/year
plus 329 USD/year for support (prices provided by Curitiba). The low-entry instance
recommended is DS3V2 and costs 0,293 USD/hour [78] (only for the infrastructure, the
license needs to be purchased directly from Talari), i.e. 2566,68 USD per year. Therefore,
the total price for a year is 9480 USD. The price without hardware is 6185 USD.

| Results and Discussion
58
• Analysis
As expected, the SD-WAN set-ups are pricier than a traditional solution: SC and Talari
are respectively 1,68 and 4,56 times more expensive when considering the total price for
the laboratory set-up. The price difference is surprisingly low for SteelConnect, but it is
very marked for Talari. The gap diminishes slightly when comparing the yearly cost
without hardware: Talari is then only 3,69 times more expensive. The difference in Total
Cost of Ownership (TCO) will be somewhere between these two values; it depends on
over how many years the set-up will be amortized.
A company could limit the SD-WAN expenses by using virtual machines on site:
Talari is for example also available for Hyper-V and VMware ESXi. The exact price for
these appliances is not known but it is likely lower. The cloud infrastructure costs can be
reduced by shutting down the virtual Talari and SC instances when they are not being
used, e.g. at night. This simply requires clicking on one button and waiting a couple of
minutes for the machine to shut down or spin up. It is not a complex operation and it is
realistic to do it daily (it was done during the course of testing). This is not yet possible
with the Azure VPN Gateway.
Even with these added tricks, the SD-WAN will still be more expensive.
However, this is only the price for this particular site to cloud connection. It should not
be forgotten that a traditional network contains mostly expensive MPLS links, many of
which can be spared with an SD-WAN set-up. Indeed, the current MPLS network of the
company is very costly, and even more so with the backhauling design. A considerable
sum would be spared by not routing all internet traffic via expensive links to the breakout
site.
The cost of the workforce should also be included in a total price analysis, be it
the time spent configuring and managing the network or getting help from system
integrators.
4.2.6 Conclusion regarding the need for SD-WAN
The considerations from sections 4.1 and 4.2 are summarized in Figure 17 by placing the
different solutions on a graphic using their price and QoE results.
Local internet breakout is preferable to MPLS backhauling in terms of QoS.
Companies are often reluctant to equip sites with local internet access due to the risk
exposure, the resulting security costs and the lack of QoS guarantee for internet links. Yet
with the increase of internet- and cloud-directed traffic, the current traditional network is
no longer satisfactory.
An SD-WAN Edge appliance can use any type of links to build the SD-WAN
fabric. Consequently, a company can chose for every site whether it wants to use MPLS
links or cheaper internet links. The individual link quality will be the same as for the
traditional set-up, but a connection over multiple links will be much more resilient with
SD-WAN appliances. The two SD-WAN solutions tested consistently performed better
than the traditional solution in terms of link-aggregation, failover, switchover due to
packet loss or high latency, speed and ease of set-up, and monitoring capabilities.

Results and Discussion |
59
Evidently this resiliency also depends on the links available to the SD-WAN appliance;
but already two links are usually enough to offer near-constant uptime since it is unlikely
that all available links would fail simultaneously – assuming that they are from different
providers. Moreover, any problem can be detected immediately thanks to the monitoring,
facilitating a quick resolution.
From the tests executed, it cannot be concluded that SD-WAN offers a better
connection price-wise but it is not an excluded possibility when taking into consideration
the whole network. In cases where MPLS can be completely dropped, many vendors
boast that they can offer a return on investment (ROI) within one year. However, this is
not always the case. Nowadays, the main motivation for switching to SD-WAN is often
an improvement of QoE rather than a financial gain [Appendix C]. As a side note
regarding the two SD-WAN vendors tested, the Talari solution is more advanced
technically, but SC is less complex to use and is cheaper.
All in all, SD-WAN is an appropriate solution to improve the network of the
considered company. It will facilitate the switch to more internet use: combining internet
links with SD-WAN offers cheaper links with more bandwidth, without the disadvantage
of internet’s unreliable performance. Only two specific SD-WAN solutions were tested
here, but there are many more vendors on the market. Therefore, the next part addresses
how to select the appropriate SD-WAN solution.
Figure 17 – Qualitative comparison between different WAN solutions

| Results and Discussion
60
4.3 SD-WAN choice
4.3.1 Type of SD-WAN
The first decision to be made is which of the three SD-WAN types (SD-WAN as a NaaS,
managed SD-WAN or DIY SD-WAN) corresponds best to the company’s needs.
SD-WAN as a NaaS is an interesting solution but it is not the appropriate one for
the case studied. Indeed, with NaaS the last mile is usually left up to the company and is
not part of the SD-WAN fabric. This configuration is interesting for companies with a
very large footprint, since the logistics of link aggregation is cumbersome and the middle
mile can cause many performance issues. However, the considered company only has a
few sites which are far away. For the shorter links, it is usually the last mile which is most
problematic. A 2018 study found that the latency over the internet middle-mile could
fluctuate by up to 143%, while it fluctuates up to 196% for the last-mile [79]. Thus the
middle-mile is more stable than the last mile: the overall degradation caused by the
middle-mile is only superior mile in some cases because it is used for a greater part of the
path (for long distances). Yet here the company has problems with sites close in relatively
close geographic proximity (within Europe), so it is not suitable.
It should be noted that some SD-WAN NaaS vendors are starting to extend their
capabilities to the last-mile: Cato networks for example announced general availability
of its new Last Mile Management for 1Q19 [80]. This service should monitor and profile
each last-mile link using tools such as ping, traceroute, DNS, HTTP.
The SD-WAN as a managed service solution is well adapted to the company
considering the size of its IT team. The next step is to observe which vendors offer both
internet and MPLS connections at the site locations, along with some possible WAN
optimization and security features. According to one company’s WAN chief, this is can
be tricky to find: there is a restricted choice and the vendors who fit the requirements are
very expensive [Appendix C]. A TeleGeography 3Q18 survey found that the total cost of
ownership for a managed solution is on average two to three times more expensive than
for an unmanaged solution [81]. This price can be prohibitive depending on the
company’s network budget. For the interviewed company, it was enough to make them
seriously consider a DIY solution instead and see if it would be feasible. Adding this to a
general skepticism from the technical community regarding carrier’s expertise in the
domain [38] and the lower reliability of the network due to it using mainly one ISP and
backbone, this solution is not selected here for the considered company. However, these
solutions should not be generally dismissed as the vendors are gaining more experience.
Ultimately, a DIY SD-WAN solution fits the needs of the company best. Its
complexity and relatively high price can be compensated by a gradual or even partial
implementation. However, the considered company has a small IT team, so it seems
unrealistic that they could entirely implement this new solution themselves. Since the
need for additional IT workforce is only temporary the company will not hire more IT
staff but rather rely on system integrators. The incurred additional cost will diminish over
time: as opposed to a managed SD-WAN where the extra costs justified by management
and a ready-to-use solution will always be present, the SI will mostly help in the
beginning, for the set-up. After that, the company can acquire the necessary in-house
competence to monitor and manage the solution itself.

Results and Discussion |
61
4.3.2 Vendor comparison
The sources used for the comparison tables are the vendor sites and user guides [82] [83]
[55] [84] [85] [86], observations from the laboratory as well as third party surveys from
Gartner [87] [88], NSS Labs [89] and IHS [53].
4.3.2.1 Identity features
Vendor Cisco Riverbed Talari VMware
SD-WAN Cisco SD-WAN
by Viptela SteelConnect
Talari
SD-WAN
VMware SD-WAN
by VeloCloud
SD-WAN Edges (all
available both on cloud
& on-prem, physical &
virtual)
vEdge SteelConnect
Gateway
Talari
Appliance SD-WAN Edge
SD-WAN Controller vSmart controller
(in the cloud)
SteelConnect
Manager (in the
cloud or on-
premise)
Talari
Controller (in
the cloud or on-
premise)
VMware SD-WAN
Orchestrator (in the
cloud)
4.3.2.2 Technical features for compatibility
Vendor Cisco Riverbed Talari VMware
Link types supported T1/E1 (on IOS XE, not
vEdge), Cable, DSL, LTE
Cable, DSL,
LTE
Cable, DSL,
LTE
Cable, DSL,
LTE
IPv6 compatible Yes Yes No No
Dynamic routing
protocol supported
BGP, OSPF, EIGRP (for
XE, not vEdge) BGP, OSPF BGP, OSPF BGP, OSPF
Backward
compatibility with
vendor existing
appliances
Yes, upgrade Cisco IOS XE
(even though will not get all
the Viptela features).
Cisco doesn’t recommend
to mix physical vEdges with
upgraded IOS XE routers at
the same location
Yes, upgrade
possible for
SteelHead CX
appliances
No No

| Results and Discussion
62
4.3.2.3 Performance related features
Vendor Cisco Riverbed Talari VMware
Number of
applications
recognized
2300 1300 N/A 2500
WAN
Optimization
Yes, TCP
optimization,
FEC (only for
IPsec, not GRE
tunnels)
Yes with
proprietary SDR
using SteelHead,
experts in that
domain (packet
deduplication,
etc.)
Yes, TCP
offload and
optimization,
Data
deduplication
and
compression,
congestion
control, packet
reordering
Yes, TCP
optimization,
FEC, congestion
control, packet
reordering using
proprietary
Dynamic
Multipath
Optimization
(DMPO)
Packet
Duplication Yes No
Yes, selective
packet
replication
Yes
Automatic
bandwidth
detection
No, need to
manually run a
speed test
No, can only
measure the real-
time throughput
Yes Yes
Bandwidth
reservation
No, can only limit
the bandwidth
used by a class
No Yes No
Cloud integration Cloud on Ramp
for SaaS
One-click native
cloud integration
solution for
AWS and Azure
Talari Cloud
Connect for
direct
integration with
partner services;
Manual
installation for a
virtual instance
on cloud
Globally
deployed
VMware SD-
WAN Gateways
for good cloud
connectivity (as
option)

Results and Discussion |
63
Vendor Cisco Riverbed Talari VMware
Continuous link
monitoring
Yes, uses BFD
session between
vEdge routers
Yes, ICMP-
based check
every 10s
Yes Yes
Unidirectional
link QoS
performance
measurement
No, only
bidirectional
No, only
bidirectional
Yes, using the
proprietary
Talari Reliable
Protocol
Yes, using
proprietary
Dynamic
Multipath
Optimization
Dynamic path
selection Yes Yes Yes Yes
Sub-second traffic
steering No No Yes
Yes (300-
500ms)
Per-flow load-
balancing
Yes, default
mode
Yes, based on
application ID if
using SteelHead,
otherwise load-
balancing based
on IP addresses
Yes Yes
Per-packet load-
balancing Yes No Yes Yes
Security
Zero-trust,
whitelisting,
DDOS protection,
segmentation,
DPI, AES256.
Cisco has full line
of security
product (Snort
IPS/IDS with
Talos signatures,
URL filtering,
DNS monitoring)
AES256,
segmentation,
firewall
AES256,
segmentation,
firewall
Deep Packet
Inspection
(DPI), integrated
NGFW,
AES256 and
Segmentation

| Results and Discussion
64
4.3.2.4 Management features
Vendor Cisco Riverbed Talari VMware
Zero Touch
Provisioning
Yes, downloads
configuration
file via vManage
and vBond
Yes, using shadow
appliances Yes Yes
Service Chaining Yes Yes Yes Yes
High-Availability
automated Yes Yes Yes Yes
4.3.2.5 Economic features
Vendors Cisco Riverbed Talari Vmware
Range of different
products
10 appliances,
from 100Mbps
to 20Gbps
16 appliances,
from 25Mbps to
10Gbps for
VPN
6 appliances from
100Mbps to 5Gbps
5 appliances, from
100Mbps to 5Gbps
Price Unavailable Medium-High High Unavailable
Subscription
Some perpetual
essential
features and
others need
licenses Cisco
DNA with three
tiers and 3 or 5-
year term
Monthly
subscription
based on
bandwidth
capacity chosen
Perpetual
subscription or
Pay-as-you-grow
(monthly or every
1, 2, or 3-year)
Unavailable

Results and Discussion |
65
4.3.2.6 Trust indicators
Vendors Cisco Riverbed Talari Vmware
Length of
experience for SD-
WAN
5 years 3 years 12 years 5 years
Estimated number
of clients 1000 1000 500 3000
Revenue in 4Q18
(from IHS market
study)
$48.8M (up by
29% since
3Q18)
$6.2M (up by
23% since
3Q18)
$7.9M (up by 13%
since 3Q18)
$73.2M (up by
36% since 3Q18)
Market share in
4Q18 (from IHS
market study)
0,14 0,017 0,022 20% (market
leader)
Quadrant survey
opinion
Technology
leader
N/A (not part
of survey)
Gaining market
traction
“The Clear
Technology
leader”
Gartner Magic
Quadrant for WAN
Edge Infrastructure
2018
Leader Challenger Niche Player Leader
Gartner Vendor
Score for
midsize/large/small
enterprise (scale
from 1 to 5)
3,64/3,59/3,46 3,48/3,62/3,07 3,51/3,41/3,05 4,19/4,10/3,78
NSS labs test Refused NSS
Labs test
N/A (Not part
of NSS Lab
test)
NSS Lab test:
status
“Recommended”,
TCO per Mbps
=$197;
Video Quality
=4,47;
VoIP Quality
=4,37
NSS Lab test:
status
“Recommended”,
TCO per Mbps
=$97;
Video Quality
=4,21;
VoIP Quality
=4,27
Communication
Service Provider
partners
Yes: British
Telecom,
Verizon, etc.
No No
Yes: AT&T,
Sprint,
Windstream, etc.
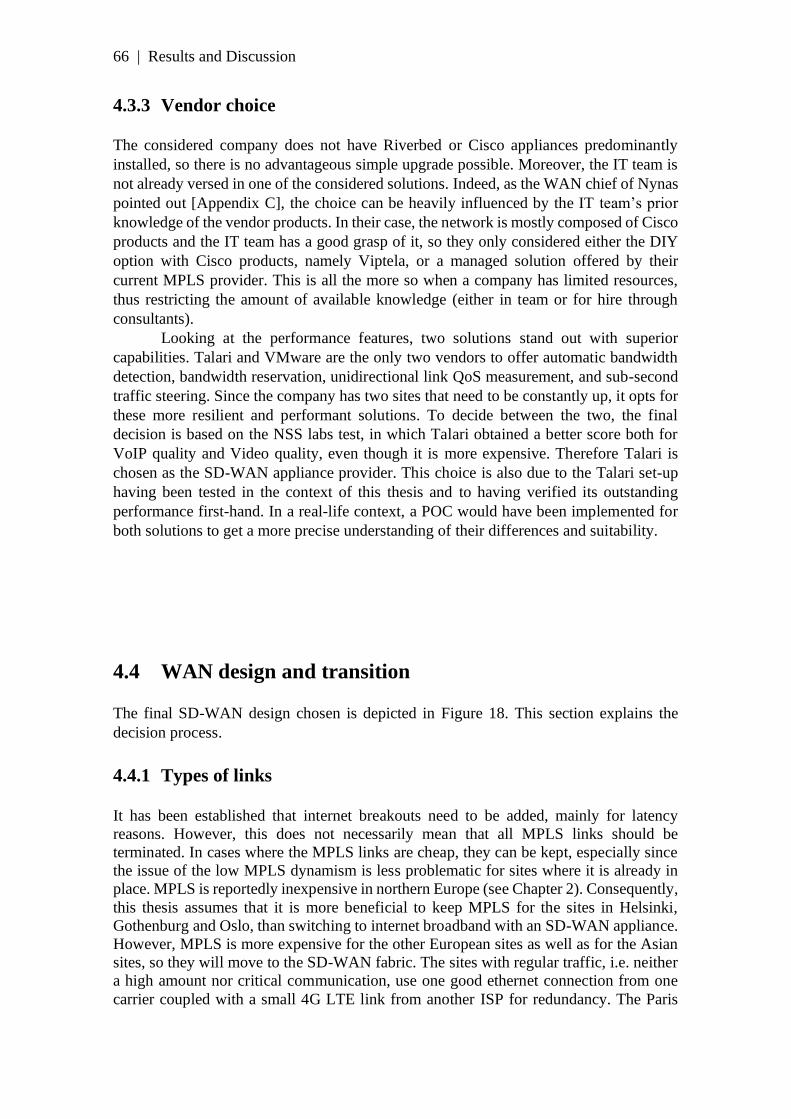
| Results and Discussion
66
4.3.3 Vendor choice
The considered company does not have Riverbed or Cisco appliances predominantly
installed, so there is no advantageous simple upgrade possible. Moreover, the IT team is
not already versed in one of the considered solutions. Indeed, as the WAN chief of Nynas
pointed out [Appendix C], the choice can be heavily influenced by the IT team’s prior
knowledge of the vendor products. In their case, the network is mostly composed of Cisco
products and the IT team has a good grasp of it, so they only considered either the DIY
option with Cisco products, namely Viptela, or a managed solution offered by their
current MPLS provider. This is all the more so when a company has limited resources,
thus restricting the amount of available knowledge (either in team or for hire through
consultants).
Looking at the performance features, two solutions stand out with superior
capabilities. Talari and VMware are the only two vendors to offer automatic bandwidth
detection, bandwidth reservation, unidirectional link QoS measurement, and sub-second
traffic steering. Since the company has two sites that need to be constantly up, it opts for
these more resilient and performant solutions. To decide between the two, the final
decision is based on the NSS labs test, in which Talari obtained a better score both for
VoIP quality and Video quality, even though it is more expensive. Therefore Talari is
chosen as the SD-WAN appliance provider. This choice is also due to the Talari set-up
having been tested in the context of this thesis and to having verified its outstanding
performance first-hand. In a real-life context, a POC would have been implemented for
both solutions to get a more precise understanding of their differences and suitability.
4.4 WAN design and transition
The final SD-WAN design chosen is depicted in Figure 18. This section explains the
decision process.
4.4.1 Types of links
It has been established that internet breakouts need to be added, mainly for latency
reasons. However, this does not necessarily mean that all MPLS links should be
terminated. In cases where the MPLS links are cheap, they can be kept, especially since
the issue of the low MPLS dynamism is less problematic for sites where it is already in
place. MPLS is reportedly inexpensive in northern Europe (see Chapter 2). Consequently,
this thesis assumes that it is more beneficial to keep MPLS for the sites in Helsinki,
Gothenburg and Oslo, than switching to internet broadband with an SD-WAN appliance.
However, MPLS is more expensive for the other European sites as well as for the Asian
sites, so they will move to the SD-WAN fabric. The sites with regular traffic, i.e. neither
a high amount nor critical communication, use one good ethernet connection from one
carrier coupled with a small 4G LTE link from another ISP for redundancy. The Paris

Results and Discussion |
67
site, which is outgrowing its link capacities, is equipped with one ethernet connection
with large bandwidth and one fiber connection, each from a different carrier. The Prague
site which runs critical operation should be available at all times. Moreover, Czechia does
not have the best performance in Europe for internet link quality. Therefore, as a security
measure, three links will be used: two ethernet and one 4G LTE links from three different
providers. All the mentioned links should not be too expensive: the fiber connection will
be the costliest, but it still has a reasonable price, especially in a metropolis like Paris. For
the Montpellier site, if possible (i.e. if made available by the owner of the rented office)
a second link will be added to ensure better switchover capacities since the internet is still
lacking in this area.
The Stockholm site will keep its cheap MPLS link (and thus ensure a close-by and
fast internet break-out for the other Scandinavian sites) and add an ethernet link of
sufficient bandwidth. The exact capacity can be adjusted with time, keeping in mind that
it is always very easy to upgrade an internet link in order to get more bandwidth whereas
it is harder to downgrade it.
Regarding the planned site in Malmö, even if it had been in a location with cheap
MPLS it would still be equipped with an SD-WAN appliance and internet links. It is not
worth wasting time to set-up the MPLS link and paying more for it: it is better to directly
invest in an SD-WAN solution that is much more adaptable and will eventually yield a
return on investment.
For the Asian cluster, the sites are equipped with Talari appliances and the MPLS
link is dropped. The MPLS link of Hong-Kong will however be kept at first. Indeed, the
Talari solution coupled with two good internet links should be enough for satisfactory
performance in theory, as assured by network professionals such as Steve Garson
(president at the consulting firm SD-WAN-Experts) [90]. However, companies are more
skeptical: one company interviewed was notably very dubious about dropping their
MPLS links outside of Europe [Appendix C]. Since the MPLS contract of the considered
company only ends in about one year, this time will be used to observe whether the MPLS
link is necessary or not – but only for the Hong-Kong site. If the long-distance internet
performance is too bad, the other Asian sites can still route traffic destined to Europe and
other far-away destinations via the Hong-Kong site and its private link. As an example of
degradations that can befall such links, a faulty router on the internet path between Santa
Cruz (USA) and Hawaii once resulted in 30% packet loss for 2 hours [91]; and one study
measured that an internet connection between the East coast of the USA and the Samoan
Islands (South Pacific Ocean) typically has about 15% packet loss [92]. It was proven in
the laboratory experiments that the Talari solution perfectly hides these issues if only one
link is affected. However, a scenario with both links being impacted was not tested, so
the company would need to monitor the performance during the first year. In the
beginning the Hong-Kong site will contract two ethernet links from two different
providers. Depending on whether the private link will be kept, one link could be dropped
or conversely another one added in the future.
The Chinese case is unique due to the Great Firewall of China (GFC) installed by
the Chinese government. This firewall affects all domestic internet access and incurs very
high latencies: Steve Garson mentions that the delay can fluctuate from 180ms to 600ms
in a day [90]. Therefore it makes no sense to use an internet link between the two Chinese
sites Beijing and Shanghai: a private MPLS link is used instead. The GFC does not apply
to Hong-Kong, which is a special administrative region.
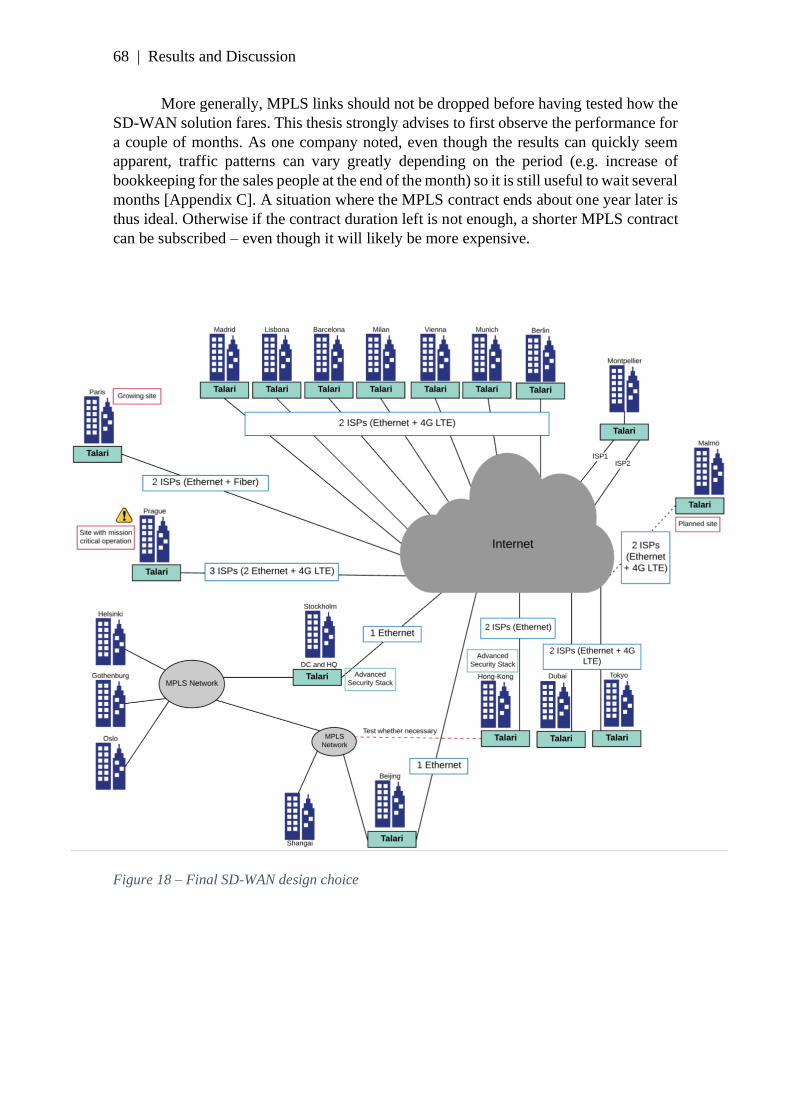
| Results and Discussion
68
More generally, MPLS links should not be dropped before having tested how the
SD-WAN solution fares. This thesis strongly advises to first observe the performance for
a couple of months. As one company noted, even though the results can quickly seem
apparent, traffic patterns can vary greatly depending on the period (e.g. increase of
bookkeeping for the sales people at the end of the month) so it is still useful to wait several
months [Appendix C]. A situation where the MPLS contract ends about one year later is
thus ideal. Otherwise if the contract duration left is not enough, a shorter MPLS contract
can be subscribed – even though it will likely be more expensive.
Figure 18 – Final SD-WAN design choice

Results and Discussion |
69
4.4.2 Security
Adding an internet access at a location increases the risk for attack, so security features
should always be implemented in parallel of an internet link. In an effort to minimize
complexity and costs, the level of security can be adjusted to the importance of a site. It
could for example be enough for a regular sales office to have firewalls, whereas a
location with servers or the datacenter should have much more comprehensive security
using features such as IDS/IPS or NGFW [Appendix C].
As a side note, if the SD-WAN vendor chosen is Cisco, it is recommended to use
the Cisco security stack. Indeed, Cisco has very good security services that are
recommended by NSS labs and maintained up to date thanks to its partnership with the
Talos group, which identifies the latest threats and attacks. It makes more sense to keep
the same provider as all the services are made to integrate well and automatically work
together. Moreover, there is often the possibility of getting a discount when purchasing
the whole solution package with Cisco.
Simple sales offices have a relatively low level of security required and often no
IT team on site. Therefore, this thesis suggests using third-party security services such as
Zscaler or Palo Alto’s (PA) Global Protect Cloud who offer the complete security stack
on cloud. Both of these offers comprise services such as NGFW, Sandbox, Advanced
Threat Protection, URL filters, in-line SSL inspection, DMZ as a service, etc. [93] [94]
Their effectiveness and security level have been verified by unbiased third-party testers:
in 2018, Zscaler received the Leader rank from Gartner’s Magic Quadrant of Secure Web
Gateway for the 8th consecutive time [93]. As for PA, it received the Leader rank from
Gartner’s Magic Quadrant of Enterprise Network Firewall. Its NGFW and Next
Generation Intrusion Prevention System also received the Recommended rating by the
NSS labs in 2018 [94]. The advantage of these cloud security solutions is that they can
be configured and managed from a distance which saves the administrator a trip to each
site. Moreover, they can easily be applied to many different sites and even to mobile
users, making for a fast deployment and sparing the administrator from executing a
repetitive task (which can often be a source of errors). These solutions are cheaper than
having on-site appliances at every site since they do not require any capital expenditures
and there will be no need to upgrade out-of-date hardware.
When using these cloud security solutions, the traffic will egress the company site
and reach the closest point of presence of the security service provider over an IPsec
tunnel on an internet link. There the security rules are enforced and the traffic then
continues to its final destination. Consequently, it is important that the security provider
be present close to the direct path between the site and the destination, otherwise there
will be a too high additional latency – similarly to when all the traffic is backhauled to
the HQ. Moreover, it is best for the security filtering to happen early on to avoid wasting
bandwidth. Hence the most efficient location for the security service to be is close to each
company site. Security providers are well aware of this and they are working on
establishing their global presence. Their exact locations can be found online and
compared to the coordinates of the company sites. Zscaler has 53 Cloud Enforcement
Nodes locations and more than 100 datacenters [93]. Moreover, it directly peers with

| Results and Discussion
70
Microsoft at major exchange DCs, enabling it to offer users connectivity to Microsoft 365
in 10ms or less [93]. GlobalProtect only has cloud infrastructure in 15 cities worldwide,
mainly in central Europe, the USA and Asia [94].
For the considered company, Zscaler appears better due to its larger footprint.
However, both options offer good security so if there is a price difference which is
superior to the surmised better latency performance of Zscaler; the final choice could also
very well be GlobalProtect. Both solutions have a partnership with Talari which facilitates
the configuration and integration to the solution.
A skeptical analyst could point out that the security provider’s PoP is a possible
bottleneck for bandwidth. However, both Zscaler and GP are sufficiently established and
have proven their capabilities in unprejudiced tests, so that they can be trusted. They both
also keep increasing their network capacities as their client base grows, so it should not
become a problem in the future either.
Ultimately cloud security is slightly less effective than having directly all the
security inspections on-site. The latter would enable a better security analysis since the
traffic would be coherent, and it would not need rerouting. Yet having such security
appliances would be too expensive and require too much human resources. Another
alternative could have been to have regional hubs with security features on-site and use
service chaining; but this would present the same drawbacks as cloud security since it
also implies to deviate from the most direct path and creates bottlenecks.
In the previous network design, the datacenter could be configured to be accessed
only via the private internal network. However, it now needs to be accessible through
internet as well, since many sites are no longer connected to the private MPLS network.
Consequently, the advanced security stack already present at the DC should be verified
to make sure the servers are well protected.
4.4.3 SD-WAN appliances
SD-WAN appliances can be either physical or virtual, on-site or on-cloud. The choice of
virtual or physical has limited consequences: one company mentioned often using virtual
appliances due to space consideration but not having any real preference otherwise.
Virtual appliances can spare the company some capital expenditures, but the physical
appliances are easier to manipulate, especially for non-IT staff. Therefore, the considered
company will use physical appliances here, which it can easily ship to the remote offices
and then instruct the employees on how to plug it in.
The on-site or on-cloud decision has more repercussions: when a company has
the appliances on-site, it de-facto has total control over them – which is not the case for
on-cloud appliances. One interviewed company was initially leaning towards purchasing
the Viptela SD-WAN solution on-cloud due to convenience. Yet they deal among others
with a nation that is currently at odds with the USA and for whom the American
government has declared a business embargo. Even though they got an exclusion from it
through the Embassy’s negotiations and are therefore in a lawful position, the situation is
still precarious. Therefore, when they learned that Cisco could at any time shut down

Results and Discussion |
71
some appliances if they were to choose a cloud solution, they promptly settled on on-site
appliances [Appendix C]. Here, the considered company will choose on-site appliances
as well. The Talari appliance in Stockholm is chosen as the Network Control Node, i.e.
the Talari controller.
4.4.4 Transition
The design chosen includes 16 Talari appliances to be added. These cannot be added all
at once due to the company’s limited resources; and that should not be the goal either.
The best approach is to start with a handful of sites among the most problematic ones.
This was the method used by both interviewed companies. This allows the solution to be
tested for all the smaller configuration details. It also gives employees the opportunity to
get familiar with the solution and gain experience, which will make future deployments
faster. In this case, the company will begin with the sites in Stockholm (because it is the
HQ and DC location), in Hong-Kong (because it is the point of internet breakout for
Asia), Montpellier (because the performance is unsatisfactory), Paris (because it is
outgrowing its link capabilities) and Prague (because it needs better redundancy). Three
of these five sites already have internet connections, so this will facilitate the change
process.
The transition should begin before the MPLS contract reaches its end, so that the
company has some time to observe the performance of both the internet link and the
MPLS link. It can compare them and note which link is preferred by the SD-WAN
controller. When the contract does reach its end, the company can decide with confidence
whether to get rid of MPLS or not, as it knows exactly what impact it will have on the
network performance. This is a good example of a safe and progressive move towards a
modern SD-WAN structure.

| Conclusion
72
Chapter 5
Conclusion
Company’s network requirements have strongly evolved in the last years, notably with
the cloud revolution – be it through PaaS, SaaS or IaaS. Nowadays almost all companies
use the public cloud and need to offer employees a quick access to it. As for the IoT
transition, it is still underway: the change is more progressive because it pervades more
domains. Yet, it is just as significant and also requires ubiquitous internet access. All of
this means that companies should provide all their sites with a dynamic and flexible
network, with a fast access to the internet backbone and the key datacenters of the many
service players. The traditional network, predominantly based on MPLS, was designed in
a different epoch and fits the needs of a company with mostly branch-to-branch
communication; it no longer suits a contemporary company network. Enterprises with a
global footprint have already started adding some local or regional internet breakout, but
this is only a stopgap solution. It creates a patchwork network where each site needs to
be handled individually, monitoring and troubleshooting are arduous, and the
performance is still lacking. SD-WAN offers a good solution to these problem by creating
a unified all-encompassing platform and offering superior QoS capabilities.
Although SD-WAN will probably not wipe out MPLS, it allows companies to
strongly reduce their use of MPLS networks in favor of cheaper internet links. In 2019,
SD-WAN has now been available long enough for the market to have mostly stabilized –
at least for the DIY vendors – with the most successful start-ups having been bought and
integrated into bigger vendor solutions. The years of experience and market presence
have also helped consolidate clients’ trust in the SD-WAN performance. Enterprises are
predominantly convinced of its efficiency; a majority of them is now in the process of
installing or evaluating an SD-WAN solution.
Ultimately, SD-WAN is a necessary change for global companies using the cloud
as well as IoT devices. It is a recommended technology for companies seeking to get more
redundancy, better performance or to lower their costs. However, no general promises
can be made for these goals. Indeed, SD-WAN in itself is a broad term that encompasses
very different types of solutions. Their characteristics strongly differ, from their price and
performance to their managerial style. The solution designed for the typical company
considered here is based on a DIY SD-WAN using Talari appliances with the help of a
SI team. However, it is by no means a universal solution. As SD-WAN implementation
will continue to increase in the coming years, it is important that companies do not simply
switch over to it because it is the current trend. With a reasoning like the one presented,
each company should examine its needs and resources to determine the best fit. It is all
the more crucial for them to truly analyze the offers since some incur high initial capital
expenditures which might be wasted if the solution turns out not to be appropriate.
Managed SD-WAN solutions should not be dismissed in the selection: their market share

Conclusion |
73
should increase as providers gain experience and small companies also start acquiring
SD-WAN solutions. SD-WAN will keep being more and more implemented, with 21%
additional companies predicted to have started the move by the end of 2019. This
transition is swift: 75% of the enterprises will already be hallway through their SD-WAN
implementation by 2020 [18]. Finally, the range of services it offers will also keep
increasing. VMware is for instance foreseeing a change from SD-WAN-as-a-
Connectivity to SD-WAN-as-a-Platform, with amongst others a merge between their
SDN and SD-WAN solutions and an increasing amount of security being directly
integrated into the SD-WAN solution [95].

| References
74
References
[1] T. Corbett, L. Pierce and D. Young, “SD-WAN Early Findings Yield Surprises”,
Gartner Survey, ID: G00343588, Nov. 2017
[2] S. Khurana et al., “RFC 4689: Terminology for Benchmarking”, IETF, 2006
[3] ITU-T, "Rec. E.800: Definitions of terms related to quality of service," 2008
[4] S. Möller, P. Le Callet and A. Perkis, "Qualinet White Paper on Definitions of Quality
of Experience," European Network on Quality of Experience in Multimedia Systems and
Services (COST Action IC 1003), 2013
[5] V. Alwayn, “Advanced MPLS Design and Implementation”, Cisco Press,
ISBN: 1-58705-020-x, 2002
[6] The NIST Definition of Cloud Computing, U.S. Department of Commerce, SP 800-
145, 2011. [Online]. Available:
https://nvlpubs.nist.gov/nistpubs/Legacy/SP/nistspecialpublication800-145.pdf
[7] KPMG, “Journey to the Cloud”, KPMG Study, 2017. [Online]. Available:
https://assets.kpmg/content/dam/kpmg/xx/pdf/2017/02/the-creative-cios-agenda-
journey-to-cloud.PDF
[8] Gartner prediction for public cloud market, April 2019. [Online]. Available:
https://www.gartner.com/en/newsroom/press-releases/2019-04-02-gartner-forecasts-
worldwide-public-cloud-revenue-to-g
[9] Gartner Glossary, definition of Public Cloud Computing [Online]. Available:
https://www.gartner.com/it-glossary/public-cloud-computing/ [Last accessed May 2019]
[10] Flexera, “Rightscale 2019 State of the Cloud Report”, February 2019. [Online].
Available: https://www.rightscale.com/blog/cloud-industry-insights/cloud-computing-
trends-2019-state-cloud-survey
[11] Salesforce official site [Online]. Available: https://www.salesforce.com/
[12] Microsoft Documentation on data move [Online]. Available:
https://docs.microsoft.com/en-us/office365/enterprise/request-your-data-move [Last
accessed May 2019]
[13] Azure documentation on Microsoft Multi-Geo [Online]. Available:
https://docs.microsoft.com/en-us/office365/enterprise/office-365-multi-geo [Last
accessed May 2019]
[14] Microsoft Documentation on Azure Global Network. [Online]. Available:
https://azure.microsoft.com/en-us/global-infrastructure/global-network/ [Last accessed
May 2019]
[15] Microsoft Documentation on Office 365 Connectivity Principles. [Online].
Available: https://docs.microsoft.com/en-us/office365/enterprise/office-365-network-
connectivity-principles [Last accessed May 2019]
[16] ThousandEyes, 2018 Public Cloud Performance Benchmark Report, Study by
ThousandEyes. [Online]. Available: https://www.thousandeyes.com/resources/2018-
public-cloud-performance-benchmark-report
[17] IETF, MPLS Status Page https://tools.ietf.org/wg/mpls/
[18] Nemertes 2018-19 WAN Economics Research Study, Q3 2018 [Online].
Available: https://nemertes.com/webinar-replay-wan-economics-the-business-of-
disrupting-your-wan/

References |
75
[19] MEF 3.0 SD-WAN [Online]. Available: https://www.mef.net/mef-3-0-sd-wan [Last
accessed May 2019]
[20] Casado et al., “Ethane: Taking Control of the Enterprise”, Stanford University, 2007.
[Online]. Available:
http://cs.brown.edu/courses/csci2950-u/s14/papers/Casado07Ethane.pdf
[21] SDN Definition by the ONF. [Online]. Available:
https://www.opennetworking.org/sdn-definition/ [Last accessed May 2019]
[22] S. Jain et al., “B4: Experience with a Globally-Deployed Software-Defined WAN”,
Google, 2013. [Online]. Available:
https://cseweb.ucsd.edu/~vahdat/papers/b4-sigcomm13.pdf
[23] Metzler, “The 2015 Guide to SDN and NFV”, Network World, 2016. [Online].
Available: https://www.networkworld.com/article/3019863/survey-shows-growing-
interest-in-sdn-where-and-how-companies-might-deploy-the-tech.html
[24] European Union Agency for Network and Information Security, “Threat Landscape
and Good Practice Guide for Software Defined Networks/5G”, December 2015. [Online].
Available: www.enisa.europa.eu
[25] A. Gottlieb, “Who was the first SD-WAN vendor”, Talari, August 2015. [Online].
Available: https://www.talari.com/blog/who-was-the-first-sd-wan-vendor/
[26] “ONUG Software-Defined WAN Use Case”, white paper from the ONUG SD-WAN
working group, October 2014. [Online]. Available:
https://www.onug.net/app/uploads/2018/03/ONUG-SD-WAN-WG-Whitepaper_Final1-
1.pdf
[27] ONUG Open SD-WAN Exchange, OSE API Interworking Progress (ONUG Spring
2018) https://datatracker.ietf.org/meeting/102/materials/slides-102-rtgwg-sessb-onug-
open-sdwan-exchange-ose-api-interworking-progress-00]
[28] ONUG official website, SD-WAN Working Group updates (last consulted May
2019) https://www.onug.net/blog/ma-and-sd-wan-2-0-working-group-updates/
[29] “YANG Data Model for SD-WAN OSE Service Delivery, IETF draft by RTWG
working group, March 2019. [Online]. Available:
https://tools.ietf.org/id/draft-wood-rtgwg-sdwan-ose-yang-00.html
[30] Definition of SD-WAN as a Service by SDXcentral (April 2019)
https://www.sdxcentral.com/sd-wan/definitions/sd-wan-service/
[31] L. Doyle, “How do SD-WAN as a service and managed SD-WAN differ”,
SearchNetworking, August 2018. [Online]. Available:
https://searchnetworking.techtarget.com/answer/How-do-SD-WAN-as-a-service-and-
managed-SD-WAN-differ
[32] AT&T Report, “AT&T Bridging 5G and SD-WAN with VMware SD-WAN by
VeloCloud for a New Layer of Control at the Edge”, February 2019. [Online]. Available:
https://about.att.com/story/2019/att_5g_sdwan.html
[33] BT press release “BT Launches New Managed Service with Cisco SD-WaN” June
2018. [Online]. Available:
https://www.globalservices.bt.com/en/aboutus/news-press/bt-launches-new-global-
managed-service
[34] Silver Peak press release, “Silver Peak and Masergy Partner to Deliver Managed SD-
WAN Service” September 2016. [Online]. Available:
https://www.silver-peak.com/news/press-releases/silver-peak-and-masergy-service-
provider-partner-deliver-managed-sd-wan-services

| References
76
[35] Frost & Sullivan Report on “The Critical Role of Hybrid Networks in SD-WAN
Deployments, sponsored by AT&T”, February 2019. [Online]. Available:
https://www.business.att.com/content/dam/attbusiness/briefs/hybrid-networks-in-sd-
wan-att-frost-and-sullivan-brief.pdf
[36] U.S. News report, “FCC: Over 12,000 911 Calls Failed During AT&T Outage”
March 2017. [Online]. Available: https://www.usnews.com/news/best-
states/florida/articles/2017-03-23/fcc-over-12-000-911-calls-failed-during-at-t-outage
[37] Channel Partners News report, “FCC Investigating Widespread CenturyLink
Outage”, January 2019. [Online]. Available:
https://www.channelpartnersonline.com/2019/01/02/fcc-investigating-widespread-
centurylink-outage/
[38] M. Conran, “Why Carriers aren’t ready for SD-WAN services”, Network World,
April 2018. [Online]. Available: https://www.networkworld.com/article/3269460/why-
carriers-arent-ready-for-sd-wan-services.html
[39] Aryaka Website. Available: https://www.aryaka.com [Last accessed May 2019]
[40] CRN article, Interview with the SVP of Aryaka, March 2019. [Online]. Available:
https://www.channelweb.co.uk/crn-uk/news/3072503/we-invented-the-sd-wan-space-
aryaka-global-channel-boss
[41] Cato Networks official website. Available: https://www.catonetworks.com [Last
accessed May 2019]
[42] IHS Market study for SD-WAN vendors in 4Q18, March 2019. [Online]. Available:
https://www.sdxcentral.com/articles/news/ihs-sd-wan-market-reaches-359m-vmware-
dominates-over-cisco-and-aryaka/2019/03/
[43] Cato Networks pricing on the Gov.uk digital marketplace [Online]. Available:
https://www.digitalmarketplace.service.gov.uk/g-cloud/services/277600018433156
[Last accessed June 2019]
[44] P. Chen, “5 Common Myths About WAN Optimization that Slow your Business”,
Aryaka, September 2018. [Online]. Available: https://www.aryaka.com/blog/5-common-
myths-about-wan-optimization-that-slow-your-business/
[45] Microsoft Documentation, “Where is your data located?”. [Online]. Available:
https://products.office.com/en-us/where-is-your-data-located?geo=Europe#Europe [Last
accessed May 2019]
[46] Azure documentation about BGP with Azure VPN Gateways [Online]. Available:
https://docs.microsoft.com/bs-latn-ba/azure/vpn-gateway/vpn-gateway-bgp-overview
[Last accessed May 2019]
[47] Route Selection in Cisco Routers, Cisco Documentation. [Online]. Available:
https://www.cisco.com/c/en/us/support/docs/ip/enhanced-interior-gateway-routing-
protocol-eigrp/8651-21.html [Last accessed May 2019]
[48] Riverbed support, Section “Topologies” . [Online]. Available:
https://support.riverbed.com/bin/support/static/hgc5k5odj0e955sd2uk2qr4ir5/html/7h0c
pt4lqflt1k1pfdpth18at9/sc_ug_html/index.html#page/sc_ug%2Ftopologies.html [Last
accessed May 2019]
[49] “Talari WAN Implementation Guide”, Talari Networks, April 12, 2016
[50] “Virtual Talari Appliance VT800, Requirements and Installation Guide”, Talari
Networks, December 7, 2018
[51] Talari Virtual SD-WAN Appliance, Azure Marketplace. [Online]. Available:
https://azuremarketplace.microsoft.com/en-gb/marketplace/apps/talari-networks.talari-
networks-virtual-appliance [Last accessed May 2019]

References |
77
[52] “RFC 2544 Benchmarking Methodology for Network Interconnect Devices”, IETF,
March 1999. Available: https://tools.ietf.org/html/rfc2544
[53] “Edge Connectivity Strategies North American Enterprise”, IHS Market survey,
February 2019. [Online]. Available: https://techblog.comsoc.org/2019/03/11/sd-wan-
revenue-hits-359-million-in-q4-2018-data-center-networking-highlights/
[54] “Cisco Completes Acquisition of Viptela”, Cisco news release, August 1, 2017.
[Online]. Available: https://newsroom.cisco.com/press-release-
content?type=webcontent&articleId=1870481
[55] VMware official website (last consulted in May 2019) https://www.vmware.com/
[56] Oracle official website. Available:
https://www.oracle.com/corporate/acquisitions/talari/
[57] J. Coffey, “Latency in optical fiber systems”, Commscope, 2017
[58] Dotcom-Tools: Network Latency monitor by Dotcom Monitor. Available:
https://www.dotcom-tools.com/internet-backbone-latency.aspx [Last accessed May
2019]
[59] K. Raaen and T-M. Grønli, “Latency Thresholds for Usability in Games: a Survey”,
2014
[60] Mathis et al., “The Macroscopic Behavior of the TCP Congestion Avoidance
Algorithm”, ACM SIGCOMM Computer Communication Review, v27 n3, 1997
[61] Microsoft documentation on Media Quality and Network Connectivity Performance.
Available: https://docs.microsoft.com/sv-se/skypeforbusiness/optimizing-your-
network/media-quality-and-network-connectivity-performance [Last accessed May
2019]
[62] “Talari Theory of Operation”, Talari Networks, April 22, 2016
[63] Riverbed documentation on topologies for SteelConnect. [Online]. Available:
https://support.riverbed.com/bin/support/static/hgc5k5odj0e955sd2uk2qr4ir5/html/7h0c
pt4lqflt1k1pfdpth18at9/sc_ug_html/index.html#page/sc_ug/topologies.html [Last
accessed May 2019]
[64] Riverbed Documentation on SteelHead. [Online]. Available:
https://support.riverbed.com/bin/support/static/hgc5k5odj0e955sd2uk2qr4ir5/html/7h0c
pt4lqflt1k1pfdpth18at9/sc_ug_html/index.html#page/sc_ug/SteelHead_compatibility.ht
ml [Last accessed May 2019]
[65] Cisco documentation on Configuring a Load-Balancing Scheme. [Online].
Available: https://www.cisco.com/c/en/us/td/docs/ios-
xml/ios/ipswitch_cef/configuration/15-mt/isw-cef-15-mt-book/isw-cef-load-
balancing.html [Last accessed May 2019]
[66] J. Valentino-DeVries, “Service Meant to Monitor Inmates’ Calls Could Track You,
Too”, The New York Times, May 2018. [Online]. Available:
https://www.nytimes.com/2018/05/10/technology/cellphone-tracking-law-
enforcement.html
[67] Letter of AT&T to Senator Ron Wyden about the Securus Scandal, June 15, 2018.
[Online]. Available:
https://www.wyden.senate.gov/imo/media/doc/at&t%20letter%20to%20RW%206.15.p
df
[68] S. Meyer, “Can mobile carriers be trusted with location data?”, CPO Magazine, June
2018. [Online]. Available: https://www.cpomagazine.com/data-privacy/can-mobile-
carriers-be-trusted-with-location-data/

| References
78
[69] Tweet by Senator Ron Wyden on January 8, 2019 Available:
https://twitter.com/RonWyden/status/1082691563447304194
[70] E. Massé and L. Krahulcova, “Time’s up! …for data retention mandates across the
EU”, AccessNow, January 2017. [Online]. Available: https://www.accessnow.org/times-
data-retention-mandates-across-eu/
[71] “Collection of user data by ISPs and telecom providers, and sharing with third
parties”, IVPN, March 2018. [Online]. Available: https://www.ivpn.net/blog/collection-
of-user-data-by-isps-and-telecom-providers-and-sharing-with-third-parties
[72] Riverbed, “SteelConnectTM Gateway Hardware Installation Guide (SDI-130, SDI-
330, SDI-1030)”, February 2019
[73] Azure documentation on Downloading VPN Device Configuration Scripts.
Available: https://docs.microsoft.com/sv-se/azure/vpn-gateway/vpn-gateway-download-
vpndevicescript [Last accessed May 2019]
[74] Azure documentation on BGP with Azure VPN Gateway. Available:
https://docs.microsoft.com/en-us/azure/vpn-gateway/vpn-gateway-bgp-overview [Last
accessed May 2019]
[75] Talari, “APN Appliance E100, Hardware Guide”, Talari Networks, February 2019
[76] Azure marketplace, VPN Gateway. [Online]. Available:
https://azure.microsoft.com/sv-se/pricing/details/vpn-gateway/ [Last accessed May
2019]
[77] Azure marketplace, Riverbed SteelConnect Gateway. [Online] Available:
https://azuremarketplace.microsoft.com/en-
us/marketplace/apps/riverbed.riverbed_steelconnect_gw [Last accessed May 2019]
[78] Azure marketplace, Talari virtual SD-WAN Appliance. [Online]. Available:
https://azuremarketplace.microsoft.com/en-en/marketplace/apps/talari-networks.talari-
networks-virtual-appliance?tab=PlansAndPrice [Last accessed May 2019]
[79] S. Garson, “Testing Identifies Source of SD-WAN Internet Performance Problems”,
SD-WAN Experts, May 29, 2018. [Online]. Available: https://www.sd-wan-
experts.com/blog/report-source-of-sd-wan-internet-performance-problems/
[80] “Cato Introduces Intelligent Last-Mile Management for SD-WAN Services”, Cato
Networks, November 19, 2018. [Online]. Available:
https://www.catonetworks.com/news/cato-introduces-intelligent-last-mile-management-
for-sd-wan-services/
[81] B. Boudreau, “You’re Going to be Reading More About Managed SD-WAN”,
TeleGeography, February 29, 2019. [Online]. Available:
https://blog.telegeography.com/youre-going-to-be-reading-more-about-managed-sd-
wan.-heres-why
[82] Talari official website. Available: https://www.talari.com/ [Last accessed May 2019]
[83] Cisco official website. Available: https://www.cisco.com/ [Last accessed May 2019]
[84] Riverbed official website. Available: https://www.riverbed.com/ [Last accessed May
2019]
[85] VeloCloud official website. Available: https://www.velocloud.com/ [Last accessed
May 2019]
[86] “SteelConnect Manager User’s Guide for the SCM v2.7”, Riverbed documentation.
[Online]. Available:
https://support.riverbed.com/bin/support/static/hgc5k5odj0e955sd2uk2qr4ir5/html/7h0c
pt4lqflt1k1pfdpth18at9/sc_ug_html/index.html#page/sc_ug%2Fpreface.html%23
[87] “Gartner Magic Quadrant for WAN Edge Infrastructure”, Gartner, October 2018

References |
79
[88] “Critical Capabilities for WAN Edge Infrastructure Report”, Gartner, December 3,
2018. [Online]. Available: https://sharplink.co/wp-content/uploads/Gartner-SD-WAN-
Report-12.03.18.pdf
[89] T. Skybakmoen, “SD-WAN Comparative Report”, NSS Labs, August 8, 2018.
[Online]. Available:
https://insidecybersecurity.com/sites/insidecybersecurity.com/files/documents/2018/aug
/cs2018_0342.pdf
[90] “How to select SD-WAN”, Packet Pusher podcast (April 2016)
[91] R. I. Kibrick and al., “Operating a Wide-Area High-Availability Collaborative
Remote Observing System for Classically-Scheduled Observations at the WM Keck
Observatory”, January 2011. [Online]. Available:
https://www.researchgate.net/publication/228664934_Operating_a_wide-area_high-
availability_collaborative_remote_observing_system_for_classically-
scheduled_observations_at_the_WM_Keck_Observatory
[92] Network Latency and Packet Loss Emulation, Calomel, January 2017. [Online].
Available: https://calomel.org/network_loss_emulation.html
[93] Zscaler official website. Available: https://www.zscaler.com [Last accessed May
2019]
[94] Palo Alto Global Protect official website. Available:
https://www.paloaltonetworks.com/products/globalprotect/overview [Last accessed May
2019]
[95] S. Zoo, “The Evolution of SD-WAN as a Platform”, Webinar from VMware, June
5, 2019
[96] OECD Broadband Statistics, February 2019. [Online]. Available:
https://www.oecd.org/sti/broadband/broadband-statistics-update.htm

| Appendix A – Test Results
80
Appendix A: Test results
Results for the failover test For the traditional set-up:
TRADITIONAL
SOLUTION
Disconnect
link B (pings
lost)
Disconnect
link A (pings
lost)
Connect
link B
(pings
lost)
Connect link
A (ping lost)
Time
before link
A up again
(s)
Time
before
link B up
again (s)
7 121 0 41 139 155
6 103 0 68 199 191
6 127 0 87 250 135
6 126 0 59 241 175
7 100 0 63 219 166
7 46 0 30 94 177
7 126 0 106 279 116
6 101 0 85 237 153
7 127 0 67 165 129
7 128 0 46 216 184
Median 7 124 0 65 218 161
Average 6,6 111 0 65,2 204 158
Third Quartile 7 127 0 80,8 240 177
Minimum 6 46 0 30 94 116
Maximum 7 128 0 106 279 191
Standard Deviation 0,517 25,5 0 23 56,2 25
For the SteelConnect set-up:
STEELCONNECT
SOLUTION
Disconnect
link A
(pings lost)
Disconnect
link B (pings
lost)
Connect
link A
(pings lost)
Connect
link B (pings
lost)
Time
before
link A up
again (s)
Time
before
link B up
again (s)
0 10 0 0 2 3
0 36 0 0 1 3
0 9 0 0 1 2
0 5 0 15 1 26
0 11 0 0 2 83
0 14 0 0 1 109
0 11 0 0 1 10
0 9 0 0 1 77
0 12 0 0 1 140
0 11 0 1 1 22 Median 0 11 0 0 1 24
Average 0 12,8 0 1,6 1,2 47,4
Third Quartile 0 11,8 0 0 1 81,5
Minimum 0 5 0 0 1 2
Maximum 0 36 0 15 2 140
Standard Deviation 0 8,48 0 4,72 0,422 50,6

Appendix A – Test Results |
81
For the Talari set-up:
TALARI
SOLUTION
Disconnect
link A
(pings lost)
Disconnect
link B
(pings
lost)
Connect
link A
(pings
lost)
Connect
link B
(pings
lost)
Time
before
link A
up
again
(s)
Time
before
link A
good
again (s)
Time
before
link B
up again
(s)
Time
before
link B
good
again
(s)
0 0 0 0 62 62 41 41
0 1 0 0 34 34 43 43
0 0 0 0 33 33 41 41
0 0 0 0 76 45 84 42
0 1 0 0 60 42 80 60
1 1 0 0 134 41 89 41
0 0 0 0 71 42 74 43
0 1 0 0 89 42 71 42
0 0 0 0 75 41 72 41
0 0 0 0 69 43 78 43
Median 0 0 0 0 70 42 73 42
Average 0,1 0,4 0 0 70,3 42,5 67,3 43,7
Third Quartile 0 1 0 0 75,8 42,8 79,5 43
Minimum 0 0 0 0 33 33 41 41
Maximum 1 1 0 0 134 62 89 60
Standard Deviation 0,316 0,516 0 0 28,6 7,85 18,5 5,79
Results for the latency test
For the traditional set-up:
Additional
delay on
link B
(ms)
Traditional:
RTT (ms)
Average
(ms)
Standard
Deviation
(ms)
0 45,84 46,23 45,96 45,79 46,6 46,25 45,83 45,74 46,15 46,08 46,05 0,2642
20 66,13 65,86 65,92 66,38 66,6 66,4 65,93 65,82 65,94 66,37 66,13 0,274
40 86,03 86,24 85,95 85,86 86,2 86,31 85,75 86,06 85,94 86,89 86,12 0,3207
70 115,9 116 116,3 115,8 116 115,9 116,4 116,3 115,9 115,7 116 0,2413
100 145,9 145,8 146,4 146,2 146 145,7 146,3 145,9 146,1 146,4 146 0,2513
130 175,9 176,3 176,2 175,9 176 176,4 175,9 175,9 176,4 176,4 176,1 0,2542

| Appendix A – Test Results
82
For SteelConnect: Additional
delay on
link B (ms)
SteelConnect:
RTT (ms)
Average
(ms)
Standard
Deviation
(ms)
0 45,23 45,61 46,02 45,73 45,39 45,24 45,87 45,57 46,63 45,84 45,71 0,4175
30 75,87 75,59 76,44 75,62 75,93 75,81 75,58 76,42 76,07 75,98 75,93 0,3117
60 105,9 105,6 105,6 105,9 106,5 105,8 106,4 106,8 105,8 106,3 106,1 0,4115
80 126,5 125,8 125,3 126,1 125,7 125,4 126,4 126,4 125,7 127,6 126,1 0,6773
90 135,9 136 135,7 135,6 135,8 135,7 136,3 136,1 135,7 135,6 135,8 0,2319
100 145,7 145,9 146,4 145,9 145,7 146,3 145,6 145,8 146,5 145,6 145,9 0,3373
105 150,5 150,8 151,4 150,8 150,9 150,5 150,8 150,4 151,4 151,1 150,9 0,3534
108 153,7 153,7 153,6 153,6 154,3 154 153,8 153,7 57,4 57,1 134,5 40,71
110 57,38 57,42 58,68 57,41 57,83 57,3 58,04 57,86 57,44 57,83 57,72 0,4248
130 58,43 57,95 57,31 57,79 57,84 58,24 57,4 59,24 57,43 57,45 57,91 0,5992
For the Talari set-up:
Additional
delay on
link B
(ms)
Talari:
RTT
(ms)
Average
(ms)
Standard
Deviation
(ms)
0 46,25 45,62 45,39 45,47 46,25 45,86 45,63 45,68 45,8 45,74 45,77 0,2897
12 57,72 57,85 56,26 56,94 55,23 55,63 56,38 56,84 55,7 56,75 56,53 0,8664
13 58,62 58,04 57,84 56,49 56,74 57,36 57,81 57,6 56,28 56,72 57,35 0,7643
15 56,73 57,38 56,35 56,83 57,48 57,83 58,81 57,79 57,58 58,31 57,51 0,7416
20 56,72 57,84 57,38 58,8 57,32 57,37 57,84 56,96 57,32 57,45 57,5 0,5696
60 57,43 56,74 57,85 57,29 58,27 57,28 57,74 56,83 57,47 56,97 57,39 0,4774
130 57,72 57,42 58,3 59,36 57,82 57,14 56,88 57,95 56,85 57,43 57,69 0,7494
Results for the packet loss
For the traditional set-up:
Added
packet
loss
(%)
Traditional:
Packet Loss
(%)
Average
(%)
Median
(%)
Third
quartile
(%)
Maximum
(%)
Standard
Variance
(%)
0 0 0 0 0 0 0 0 0 0 0 0 0 0 0 0
0,2 0,487 0,649 0,185 0,473 0,584 0,423 0,618 0,739 0,392 0,176 0,473 0,48 0,606 0,739 0,187
0,5 0,852 0,738 1,04 0,964 0,627 0,843 1,27 0,948 1,31 0,868 0,946 0,908 1,02 1,31 0,215
1 1,24 1,63 1,87 2,05 1,97 1,48 2,47 1,73 2,14 1,92 1,85 1,9 2,03 2,47 0,35
3 5,86 7,43 6,86 7,19 6,38 5,72 7,93 7,48 6,49 5,94 6,73 6,67 7,37 7,93 0,768
5 8,65 10,4 8,95 9,67 10,3 8,69 9,62 8,74 10,5 8,4 9,39 9,29 10,1 10,5 0,796
10 21,6 21 19,6 21,4 19,6 19,6 21,1 20,9 19 19,6 20,3 20,25 21,1 21,6 0,944
15 32 30,7 28,5 29,7 30,4 28,6 28,3 31,1 30,8 30,2 30 30,3 30,8 32 1,23

Appendix A – Test Results |
83
For SteelConnect: Added
packet
loss
(%)
Steel-
Connect:
Packet
Loss (%)
Average
(%)
Median
(%)
Third
Quartile
(%)
Max
(%)
Standard
Variance
(%)
0 0 0 0 0 0 0 0 0 0 0 0 0 0 0 0
0,2 0,447 0,668 0,564 0,39 0,45 0,166 0,438 0,786 0,427 0,268 0,46 0,443 0,536 0,786 0,18
0,4 0,778 0,658 1,11 0,898 0,89 0,98 0,664 0,739 0,838 0,633 0,819 0,808 0,896 1,11 0,155
0,5 1,44 0 0 1,16 0,78 1,17 0,772 0,968 1,03 0 0,732 0,874 1,13 1,44 0,541
0,6 1,11 1,06 1,16 1,06 1,06 0 0 0 1,23 0,898 0,757 1,06 1,1 1,23 0,53
0,7 1,19 2,12 0 0 0 1,39 1,45 0 0 0 0,615 0 1,34 2,12 0,828
1 2,18 0 0 0 0 0 0 0 0 0 0,218 0 0 2,18 0,89
3 0 5,28 0 0 0 0 0 0 0 0 0,528 0 0 5,28 1,67
5 0 0 0 0 0 0 0 0 0 0 0 0 0 0 0
For Talari:
Added
packet
loss
(%)
Talari:
Packet
Loss
(%)
Average
(%)
Median
(%)
Third
Quartile
(%)
Maximum
(%)
Standard
Deviance
(%)
0 0 0 0 0 0 0 0 0 0 0 0 0 0 0 0
0,001 0 0 0 0 0 0 0 0 0 0 0 0 0 0 0
0,005 0 0 0,1 0 0 0,1 0 0 0 0,1 0,03 0 0,075 0,1 0,048
0,01 0 0 0 0,02 0,05 0 0 0 0 0 0,01 0 0 0,05 0,016
0,05 0 0 0 0 0 0 0 0 0 0 0 0 0 0 0
Results for the bandwidth test
For the traditional set-up:
From Azure to Stockholm
BW on
link B
(Mbps)
Nb of
parallel
clients
Tradi:
Bitrate
(Mbps)
Average
(Mbps)
Median
(Mbps)
Standard
Deviation
(Mbps)
10 1 9,19 9,19 9,19 9,19 9,18 9,19 9,19 9,19 9,19 9,19 9,19 9,19 0,00316
10 2 15,9 15,7 15,9 15,9 15,8 15,8 15,9 15,7 15,8 15,8 15,8 15,8 0,0789
10 4 15,1 15,1 15,1 15 15 15,1 15 15,1 15,2 15,1 15,1 15,1 0,0632
5 1 4,58 4,59 4,59 4,58 4,58 4,59 4,59 4,59 4,57 4,58 4,59 4,59 0,00699
5 2 15,5 15,4 15,5 15,4 15,5 15,5 15,4 15,5 15,5 15,2 15,4 15,5 0,0966
5 4 15,2 15,3 15,3 15,4 15,3 15,3 15,3 15,5 15,3 15,3 15,3 15,4 0,0789
1 1 0,916 0,912 0,916 0,914 0,915 0,915 0,913 0,916 0,915 0,915 0,915 0,915 0,00134
1 2 12,1 12,1 12 12,1 12,1 12,1 12 12,1 12,1 11,9 12,1 12,1 0,00699
1 4 12 12,1 12,1 12,1 12,2 12,1 12,1 12,1 12,1 12,1 12,1 12,1 0,0471
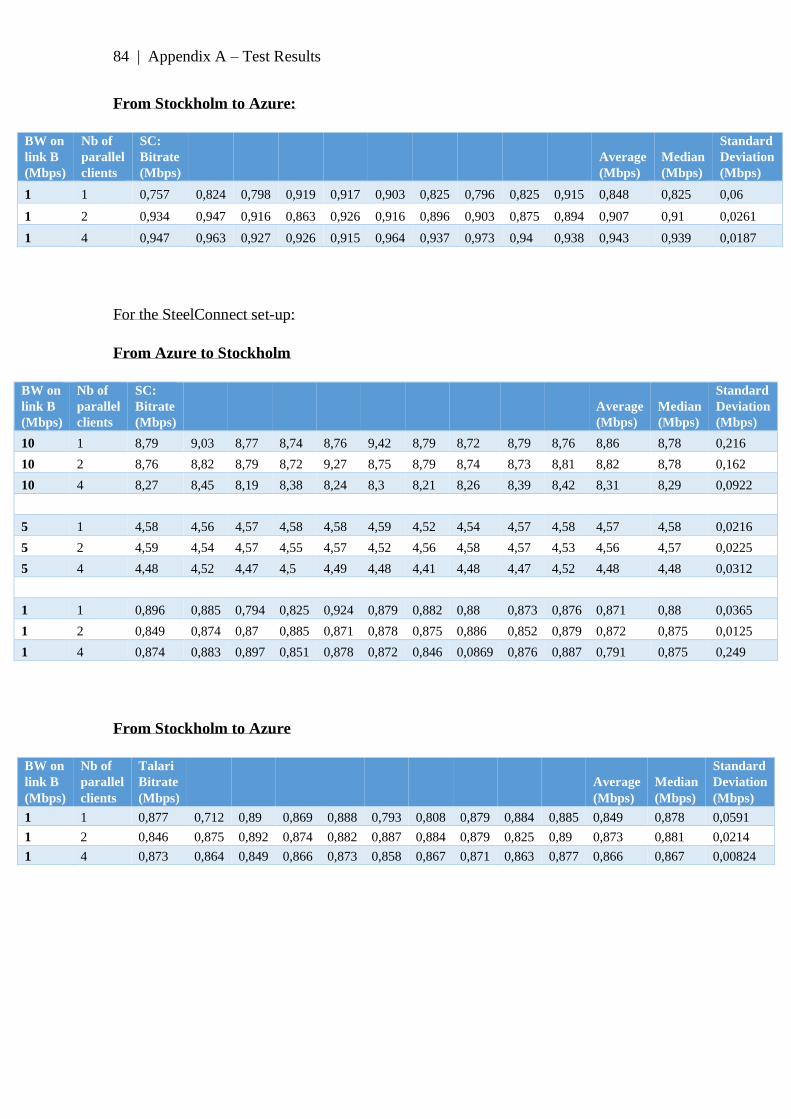
| Appendix A – Test Results
84
From Stockholm to Azure:
BW on
link B
(Mbps)
Nb of
parallel
clients
SC:
Bitrate
(Mbps)
Average
(Mbps)
Median
(Mbps)
Standard
Deviation
(Mbps)
1 1 0,757 0,824 0,798 0,919 0,917 0,903 0,825 0,796 0,825 0,915 0,848 0,825 0,06
1 2 0,934 0,947 0,916 0,863 0,926 0,916 0,896 0,903 0,875 0,894 0,907 0,91 0,0261
1 4 0,947 0,963 0,927 0,926 0,915 0,964 0,937 0,973 0,94 0,938 0,943 0,939 0,0187
For the SteelConnect set-up:
From Azure to Stockholm
BW on
link B
(Mbps)
Nb of
parallel
clients
SC:
Bitrate
(Mbps)
Average
(Mbps)
Median
(Mbps)
Standard
Deviation
(Mbps)
10 1 8,79 9,03 8,77 8,74 8,76 9,42 8,79 8,72 8,79 8,76 8,86 8,78 0,216
10 2 8,76 8,82 8,79 8,72 9,27 8,75 8,79 8,74 8,73 8,81 8,82 8,78 0,162
10 4 8,27 8,45 8,19 8,38 8,24 8,3 8,21 8,26 8,39 8,42 8,31 8,29 0,0922
5 1 4,58 4,56 4,57 4,58 4,58 4,59 4,52 4,54 4,57 4,58 4,57 4,58 0,0216
5 2 4,59 4,54 4,57 4,55 4,57 4,52 4,56 4,58 4,57 4,53 4,56 4,57 0,0225
5 4 4,48 4,52 4,47 4,5 4,49 4,48 4,41 4,48 4,47 4,52 4,48 4,48 0,0312
1 1 0,896 0,885 0,794 0,825 0,924 0,879 0,882 0,88 0,873 0,876 0,871 0,88 0,0365
1 2 0,849 0,874 0,87 0,885 0,871 0,878 0,875 0,886 0,852 0,879 0,872 0,875 0,0125
1 4 0,874 0,883 0,897 0,851 0,878 0,872 0,846 0,0869 0,876 0,887 0,791 0,875 0,249
From Stockholm to Azure
BW on
link B
(Mbps)
Nb of
parallel
clients
Talari
Bitrate
(Mbps)
Average
(Mbps)
Median
(Mbps)
Standard
Deviation
(Mbps)
1 1 0,877 0,712 0,89 0,869 0,888 0,793 0,808 0,879 0,884 0,885 0,849 0,878 0,0591
1 2 0,846 0,875 0,892 0,874 0,882 0,887 0,884 0,879 0,825 0,89 0,873 0,881 0,0214
1 4 0,873 0,864 0,849 0,866 0,873 0,858 0,867 0,871 0,863 0,877 0,866 0,867 0,00824

Appendix A – Test Results |
85
For the Talari set-up:
From Azure to Stockholm
BW on
link B
(Mbps)
Nb of
parallel
clients
Talari
Bitrate
(Mbps)
Average
(Mbps)
Median
(Mbps)
Standard
Deviation
(Mbps)
10 1 18,4 18,3 18,1 18,2 18,4 18,2 18 18,3 18,3 18,5 18,3 18,3 0,149
10 2 17,9 18,4 18 18,1 18,6 18,1 18,4 18,3 18,1 18,4 18,23 18,2 0,221
10 4 18,5 18,6 18,4 18,1 18,1 18 18,1 18,3 18,1 18 18,2 18,1 0,215
5 1 11,6 13,3 11,19 13,5 12,5 13,4 13,4 13,2 14 12,7 12,9 13,25 0,89
5 2 12,7 13,2 13,8 13,8 12,5 13,5 13 13 13,3 13,2 13,2 13,2 0,427
5 4 13,9 13,6 12,9 13,2 13,2 13 13,2 13,5 13,3 13,2 13,3 13,2 0,294
1 1 9,87 9,98 9,99 9,96 9,78 10,2 9,74 9,94 10,3 8,77 9,853 9,95 0,417
1 2 10,6 10 10,8 10,4 10,2 10,4 9,86 10,3 10,4 10,2 10,3 10,4 0,273
1 4 10,2 10,6 10,2 10,4 10,2 10,5 10,3 10,4 10,6 10,4 10,4 10,4 0,155
From Stockholm to Azure:
BW on
link B
(Mbps)
Nb of
parallel
clients
Talari
Bitrate
(Mbps)
Average
(Mbps)
Median
(Mbps)
Standard
Deviation
(Mbps)
1 1 0,795 0,872 0,855 0,881 0,88 0,862 0,883 0,993 0,863 0,767 0,865 0,868 0,0595
1 2 0,839 0,867 0,828 0,859 0,885 0,832 0,97 0,858 0,795 0,874 0,861 0,859 0,0465
1 4 0,863 0,892 0,826 0,921 0,878 0,853 0,913 0,837 0,894 0,877 0,875 0,878 0,0311

| Appendix B – Interview 1
86
Appendix B: Interview 1
Interview with Björn Sandvall, manager of Infrastructure Services at Boliden
This transcript will refer to the interviewee Björn Sandvall as “S” and to the interviewer
as “I”.
I: To give some context about your company, do you have any particular requirements,
any specificities that should be mentioned?
S: I would say we are like most companies: we have sites in different locations and need
reliable communication between them. We decided to have all the resources needed to
keep the production running at each site, so therefore all the production-related
infrastructure is present at each site and needs to be available 24/7.
I: When did you first heard of SD-WAN? When did you start installing it and why?
S: I personally first heard of it in 2014 but didn’t work at Boliden at the time. I think that
Boliden started using SD-WAN in 2015, mostly to achieve redundancy. Boliden didn’t
want to double the costs for a redundant MPLS connection, so we saw SD-WAN as an
opportunity to get redundancy at a relatively low price.
I: Why did you choose to start with these 4 sites? (Boliden, Tara, Odda, Dublin)
S: For redundancy reasons: on these sites the MPLS connections are more expensive.
In Swedish sites or in Nordic countries we can buy redundancy as a service from the
MPLS operators at an acceptable price. However, for the Tara mines in Ireland for
instance, the MPLS connection costs about 3.000 euros a month, so doubling that cost is
not an option.
I: Why use Talari? Why use Riverbed optimization, why not buy more internet link
capacities?
S: We have no opinion about the vendors and left it up to the system integrators Curitiba.
We chose Curitiba specifically; the technical platform was secondary in our choice so we
let Curitiba choose their preferred supplier.
We didn’t buy more internet because we had mainly latency issues and this cannot be
solved by adding more bandwidth.
I: Do you plan to keep your MPLS links?
S: We do not aim to get rid of MPLS, but we see it as an option for sites where the MPLS
solution is very expensive. To stop using MPLS and use only SD-WAN instead would
simply be a way to reduce costs
We would want to test the SD-WAN solution for between 6 to 12 months without MPLS
before trusting it enough to actually stop the MPLS contract.

Appendix B – Interview 1 |
87
I: Did you notice a shift in your relationship with your MPLS provider since
implementing SD-WAN?
S: In some way. We have quarterly meetings with them and when we mention that we
could start using SD-WAN instead of MPLS they get insecure. They were comfortable
with the knowledge that MPLS is the only way to achieve a stable communication, but
that is not a fact anymore. However, their awareness is not very good, they don’t have
much knowledge about SD-WAN – at least concerning our contact person for the MPLS
provider.
We have not yet observed a concrete change such as a discount, but our present agreement
will end in the end of August and we are in a renegotiation process right now. Hopefully
we will be able to put some pressure on them. It would have been ideal if we had started
to perform the SD-WAN tests early on, for instance at Tara, to shut down the MPLS
connections for a longer period of time. Now it might be a bit short, we might not be able
to perform all the tests before we will go on the new agreement with the MPLS provider.
I: Is one of the reasons for keeping MPLS that it takes a long time to install?
S: Yes, I would say that it is because of simplicity. It is very easy to keep using a service
that we have already in place and have been working with for about a decade. Another
thing is that our operations are located at mines sites in the middle of nowhere and the
only reason why we have a communication, for example a fiber access out there, is that
when the site was established we had a cooperation with the power company or the local
communication company like Telia in Sweden, and they are the only provider available
at the site. It’s possible for us to shift provider but it would involve a lot of work and
would maybe not end up in a situation where we actually lower our costs. Now we are
using Telia, and for instance if we would like to use Tele2 (another Swedish company),
then they might have to rent capacity in Telia’s network and that means we would have
to pay more than we do today. We have an operation in this company where we are
located in very faraway places so it is very hard for us to put pressure on the providers. It
is a totally different situation if you are located in cities where you can chose from five
different providers and there is less monopoly.
I: Do you know how long it took to set up these links?
S: At the most remote sites it can take about 6 months to put up a connection. Sometimes
there is no fiber available and they have to install everything. When we are establishing
a mine there is not even a postal address there, we have to provide them with the GPS
coordinates.
I: And when you get new internet connections in cities like Dublin, how long does that
typically take?
S: It is much faster because you already have all the infrastructure in place, you just need
to order it. It would typically take a few weeks.
I: Now that you have been using SD-WAN for a while, have you noticed any change (in
QoE, performance, price, etc.)

| Appendix B – Interview 1
88
S: We haven’t noticed a change performance-wise yet, but since we have introduced
redundancy we are not as vulnerable if the primary connection goes down. We are still
operational, and we can continue our daily operation as if nothing happened. Price-wise,
it has also not been long enough to tell a difference yet.
I: Any clear advantage or issue with SD-WAN?
S: No, we are very happy working with Curitiba. They have been taking care of all the
installations and helping us along the way so no issues. We are totally satisfied.
I: What would be your ideal relationship with SD-WAN: as a company do you prefer
outsourcing it all?
S; Yes, when it comes to SD-WAN we are satisfied with buying it as a service for now.
We have other focus areas where we really want to keep the competence in house and
work with it ourselves, but we can’t be good at everything so when we have a more
isolated service that we can buy from outside it is very useful.
If SD-WAN was to become more present in our set-up, say about 50%, we would want
to be more involved, have more control and insight into what is happening. But for now,
it is perfect.
I: For now you still manage the internet connections and the buying of links yourself.
There are new solutions where you also have internet service providers who themselves
provide that. What would think of that? This usually implies trading some expertise
against ease of use.
S: I think we would prefer to stay with the current situation, where we buy the links from
an ISP and we cooperate with Curitiba providing the SD-WAN service.
I: Regarding security, what do you think is the best approach: would you want to
incorporate more security in the new SD-WAN solution, maybe using cloud security
where you don’t have physical appliances on site, or do you want to keep physical
appliances on every site?
S: Not necessarily. We could go with virtualization of firewalls. It would also be
interesting in the future to look at virtualized WAN optimization services as well. For
instance regarding Microsoft Azure services, it would be interesting to implement a
virtual optimization service there and see what we can do in order to optimize the traffic
between our local sites and Microsoft Azure. We have no preference a priori, it is more
about the price and reliability. Of course if we are still working with Curitiba and we have
Talari and Riverbed products we would want to use that also in virtualized environments.
I: What do you see for the future of SD-WAN, both in general and for your company?
S: The SD-WAN set-ups will continue to grow and slowly push away MPLS since it is
more flexible and more cost-efficient. However, in the Nordic countries MPLS will still
be a good alternative as it has an acceptable price.

Appendix C – Interview 2 |
89
Appendix C: Interview 2
Interview with Anders Norrman and Christer Söderberg, respectively Technical
Infrastructure Owner LAN/WAN/Datacenter and Network Security Governor at
Nynas AB
This transcript will refer to the interviewer as “I” and to the answers of both Nynas
employees as “N”
I: Would you like to begin by briefly presenting your company, both its activity and its
network?
N: We are an old petrol company from the 1920s. We deal with special petrol, i.e. no the
one you can burn but rather the one used in the industry. We are present in the whole
world: we have between 40 and 50 sales offices spread globally. Their size can range
from 2 to 200 people. We buy our MPLS network from GTT. We have been using it for
six years now. Over all, most of our sites use MPLS, and MPLS terminates here in
Stockholm in the datacenters. For each DC we have two links of 200Mbps for redundancy
(both if one link goes down or if one DC goes down). Some sites cannot be equipped with
MPLS; in these cases we use VPNs.
I: What are the typical reasons for this?
N: Sometimes it is too expensive (like for Dubai), sometimes GTT simply says it is not
possible and sometimes the office is located in a rented office space and the tenants do
not allow for an MPLS cable to be installed. This is for example the case for our Houston
and Canada site, where we can only use the internet link which the owner gives us.
N: All of our sites have WAN accelerators today. They are Riverbed products and we
bought them via the SI company Curitiba. Every site also has a switch and Wi-fi (covering
between one room and several buildings depending on the site-size). We have global
surveillance: GTT monitors their own routers but we monitor everything (switch, router,
WAN accelerators).
We have two datacenters here in Stockholm where we have our servers. In the beginning
we had servers scattered globally but that did not work very well for us, because it
required someone to be there physically to manage them and deal with all the problems
such as end-of-life, the hardware breaking down, etc. Therefore we decided on the current
centric structure and we will keep it. It works well, our only problem is that it entails
delays for clients when they want to access the servers.
More and more services are being moved to the cloud, whether we want to or not. Some
of the cloud services which we use most are Office 365 (especially for mails), Sharepoint,
Salesforce and ServiceNow. We also use Azure. That is the reason why we want to go
out on the internet as fast as possible today, it would solve many of our problems.

| Appendix C – Interview 2
90
We are also seeing a more pregnant use of IoT devices such as the booking board for the
conference rooms, defibrillators, etc. These also need internet access, but we do not want
to have them on our internal network. That is another incentive for local internet
breakouts.
I: When did you start to move your services to the cloud?
N: About 2-3 years ago: it began seriously with Office 365 in 2016. Today, 9 out of 10
services that we use are on the cloud, but we still have one in-house service in the DC. It
is our own business system and it will continue to stay here in Stockholm, we have no
plan to move it to the cloud. This in-house service is one of the reasons why we have the
WAN accelerators – which by the way are also a challenge since they are so expensive,
whether we buy them directly or as a service.
I: Regarding internet breakouts, do you have some outside of Stockholm or just the one?
N: We have three internet breakouts location: European sites go out via Stockholm,
American sites via New-York, and Asian sites via Hong-Kong. As a side note, Germany
has its own internet breakout because there they do their own DMVPN solution: they use
primarily the MPLS and if it goes down it switches to a tunnel over the internet. We added
these breakouts in Hong-Kong and New-York because, about 3 or 4 years ago, we noticed
that our users needed to go out on the internet much earlier than they did by going via the
DC. We also noticed that many offices got their own internet links without notifying us,
simply because the provided internet via the DC is too slow. When doing so, these sites
didn’t set up any security measures. We know that there are currently 9 or 10 sites with
such independently acquired internet and we have no control over it. The only thing we
could ask them is not to connect it to our internal network. We were clear about the fact
that they can for example set it up as Guest Wi-fi if they really need faster access or a
local access for banks and such, but they must keep it separate.
We have been slowly coming closer to an SD-WAN solution with these internet
breakouts. Now we have reached the point where we think users should come out on the
internet even earlier, and that is why we are currently examining two SD-WAN solutions.
N: The first one is GTT’s fully managed SD-WAN solution. We have made inquiries and
know all the relevant information (e.g. the possible options, the cost). GTT is one of the
few vendors we have found which can provide internet and MPLS, fully managed, with
also firewalls and wan accelerators. We also appreciate that they offer all-in-one boxes:
when installing the appliances in normal conference rooms, we want to have a solution
as simple as possible, easily usable by non-IT staff. So this would be a perfect solution
for us; however, it is very expensive.
The second solution is Cisco’s Viptela DIY SD-WAN. We would configure it ourselves,
and then the link monitoring could be done by GTT or the local sites. We have already
gotten one router and installed the primary services we need, so we will start testing it
very soon. We will also send one appliance to Singapore to test the performance over that
connection. It is the perfect site to test it with because it is far away and already has an
internet link.

Appendix C – Interview 2 |
91
I: How did you first hear about SD-WAN?
N: We have been approached by many different providers, both operators and appliance
vendors, who want to sell their services. They all claim that it works like a charm and that
it enables big cost savings by being able to cut MPLS.
We refused the offered POC demonstration for most of them because we do believe that
they all work, our problem is more about the price. Moreover we do not have the time to
test all of them.
I: Do you mean that you believe in all vendors equally and that you simply want to make
a fast decision? How much does the fact that you are already familiar with Cisco and use
their products factor into that?
N: If we buy everything as a service it could be from anyone, we have no prior preference.
It is of no consequences since someone else will manage it.
However, it is different regarding the DIY SD-WAN. We got an offer from Citrix for
example, which looks good. Yet we have no in-house Citrix competence so it would be
too complicated to buy it as a DIY SD-WAN. On the other hand we are familiar with the
Cisco brand since we use predominantly Cisco products (for our datacenters, switches,
wi-fi, etc.). It Is the basis of our set-up. Moreover, we have several sites that use the
upgradable Cisco routers. That is an additional argument in favor of Viptela as opposed
to the other vendors: we would only need to by the license, the hardware is already on
spot. However, when we bought Umbrella it was not because we were already thinking
about possibly using their SD-WAN as well. It is simply that we know the products
enough that we would feel comfortable with buying Cisco’s SD-WAN as a DIY solution.
Ultimately, we are open to all vendors but we still take into account the advantage of
already knowing the hardware and even possessing it.
N: I do not think that SD-WAN is such a revolution: all the elements were already present
before, although not all in one box. There was for example VPN in one appliance, routing
for MPLS and internet on another one and then you combined them. But regardless, SD-
WAN is the only solution for us. We have not yet decided on which SD-WAN we will
implement, but we are 100% certain that we will implement one, ideally on every site if
the price allows it.
We are only the two of us responsible for the whole network. Thus we try to buy as much
as possible as a service. We do not have time to handle everything ourselves, e.g. to deal
with tickets and call people when a link is down. That is why we are considering GTT’s
SD-WAN, even though it is very expensive. Yet the price remains a big hurdle, especially
since we think that, once the solution is up and running, there won’t be much poking
needed. Thus the managed service would be expensive with regards to how little
management it actually requires.
I: Do you have a schedule you want to follow, e.g. dates by which you want to have
implemented a certain amount of SD-WAN sites?
N: We aim to have 5 to 10 sites with SD-WAN by the end of the year. Three fourth of
our computers are still running on Windows 7, so we have a big upgrade to Windows 10
under way, and it should be finished at the latest by the end of the year. This upgrade is
done over the internet and SD-WAN will help us not to overload our inner network with

| Appendix C – Interview 2
92
it. But of course it is hard to give a precise estimation: if the SD-WAN implementation
goes very well for the first sites, we could also equip even more sites faster.
I: How are you going to choose between the two solutions?
N: The ultimate decision is highly dependent on the price. Right now our financial
situation is slightly complicated. Indeed, we are partially owned by the Venezuelan state
because we get our crude oil from there, and have been doing so since the 1920s. This oil
has a special chemical composition and we have adapted all our refining process to it.
Hence it would be hard for us to start working with oil from a different provenance. Yet
Venezuela is in turmoil right now and the U.S.A have decided on a business embargo.
Nynas has gotten an exclusion from this thanks to the dealings of the American and
Swedish Embassies. However, despite this exception, many banks do not want to take a
risk and refuse to work with us.
Regarding political issues, we also had the problem of Skype being banned in Dubai. It
was still technically possible to use the application by sending the traffic through the VPN
back to Sweden, but the question remained whether it was unlawful to do so. It is still a
bit of a grey area but there seems to be some leniency now towards western companies.
These limitations installed by foreign countries are an example of why we want to have
an independent solution.
I: With which sites would you start the SD-WAN implementation?
N: We would start with the sites that are far away since they already have problems with
delay and thus have the most need for it. Such sites are for example Brisbane (Australia),
Jakarta (Indonesia), Singapore, Mumbai (India), Sao Paulo (Brasil), Buenos Aires
(Argentina), Mexico City (Mexico).
I: Do you think you could entirely get rid of MPLS?
N: No, we don’t think it will be like that, especially not for South America, some places
in Asia and such, i.e. the places that cannot get good internet. The whole of Europe has
come very far in terms of internet quality, but otherwise it varies a lot depending on the
countries and regions. Sometimes Nynas is also present in small cities, small ports, not
just big cities: then it is not sure at all that they have a good infrastructure and we will
need to keep going with MPLS. Moreover, even if we get a 100Mbps link from a local
operator, it is not 100Mbps all the way, it can become worse when it goes to the cloud or
to our DC.
So for now we believe we will be able to get rid of MPLS within Europe, but we are more
skeptical for other regions. However, we still feel that we can save a lot of money by
taking away MPLS in Europe and buying cheap internet links instead. Indeed we know
that we can get cheap and good internet in Europe, which is not the case everywhere else:
in Mexico for example the internet is very expensive for a medium quality.
Our contract with GTT only ends in 2020 so we will have some time to see if we should
keep MPLS or not, use internet or MPLS or both. We will make this choice on a site-per-
site basis. We do not plan to add a second redundant internet link; we think one will be
enough. We already have several sites with only one internet link today and it works well:
the redundant internet is the exception. Moreover some offices already have an
independently bought internet – even though we have no idea what quality it is. So we

Appendix C – Interview 2 |
93
could ourselves buy a good quality internet link, get rid of MPLS (if realistic) and then
possibly use this second link for redundancy if needed.
Redundancy does not supersede the price consideration for us. We had some sites with
redundant MPLS connections in the past but we had to take them away for cost savings.
Indeed, the office sites are not so critical that they outbalance the costs. Most workers
there have portable computers and, using VPN, they could work from home, a library, a
nearby internet-café, etc. But of course that is not the case for our DC in Stockholm which
needs to always be accessible. It is all about the right balance. Moreover, we can always
adapt: if a site goes down several times and the link is clearly not reliable then we can
buy a link from a different operator. Especially since there is rarely a long contract time
period for internet, so it is much easier to quickly change if the link is not satisfactory.
I: How long would you like to test the SD-WAN set-up before deciding whether to get
rid of the MPLS links or not?
N: It is hard to say exactly, but about 6 months. We expect to notice it quite quickly, both
by observing the monitoring and by talking with users. However it is good to test it for a
while since there can be different types of traffic depending on the period, typically in the
beginning and at the end of a month for the sales people. We are curious to see which link
the controller will chose, whether there will be many cases where the internet is preferred
over MPLS.
I: Regarding link quality, how is the internet link quality for your site in China
(Shanghai)?
N: When we got the internet breakout there to go to Hong-Kong, we used GTT’s own
internet connection in Hong Kong. We had a lot of problems in the beginning due to the
great wall of China. We and other GTT clients all complained and notified GTT that the
connection did not work well. GTT made some changes: we do not precisely know what,
they somehow changed the integration with other Chinese providers and made it work.
Now we have VPN tunnels there and it works well enough that we believe we could have
only internet there, and local internet breakout to reach the cloud directly.
I: Do you have examples of how long it takes to set up links, be it MPLS or internet?
N: Yes. MPLS takes a long time to set up, especially outside of Europe. We have had
some bad experiences with it: it sometimes took half a year. In Houston we moved to a
different building on the same street, and it took half a year to get the link up. During all
this time we were provided an internet link by our MPLS provider and had to use a VPN
solution for 6 months. This was an extreme case.
It is much faster for internet: in Jakarta (Indonesia) we changed the internet not too long
ago, and we had a new provider on site in two weeks. This extreme difference can
partially be explained by the fact that, with MPLS you are guaranteed bandwidth whereas
for internet you only get “up to” and best-effort performance.
This speed of installation is also why we think that SD-WAN is really good. Internet is
available everywhere: before you even move your office somewhere, there is already
internet there. Then if we have to wait a couple of months before MPLS arrives it is fine
for us. And then when it finally arrives, all the appliances and everything is already

| Appendix C – Interview 2
94
installed, so we only need to activate the MPLS links and we immediately get both
redundancy and best path steering.
I: Do you have any preferences regarding physical vs. virtual appliances, in-house or in
the cloud?
N: We do not care whether the appliance is physical or virtual. In our datacenters we have
95% of virtual appliances, mostly because of space considerations. The sites in New-
York and Hong-Kong are entirely virtual, they use no hardware (for routers, firewalls,
WAN accelerators, etc.). Thus, we never need to go there, we simply rent space from for
a monthly fee. This is a very convenient solution which allows us to handle it all from
Stockholm with basically a 2-people team (plus some consultants).
In theory we would prefer cloud appliances. For instance regarding Viptela’s solution,
we were initially leaning towards the cloud implementation. However, we realized that
the USA would then have the right to shut down our appliances if they consider that we
are going against an embargo. Nynas is present in many countries that are not necessarily
allies with the USA, hence we do not want to take the risk that Cisco could simply cut off
some regions, and we would now prefer to have an in-house architecture.
I: Regarding Microsoft’s cloud services, what is your approach for the solution?
N: Microsoft says that one should go out on the internet as fast as possible and then from
there on it will go as fast as possible on their Microsoft backbone to their datacenters. As
Microsoft clients, we need to do as they say: we have no other choice, otherwise users
complain that it is not going fast enough – as they are doing today.
We bought Microsoft’s ExpressRoute via GTT, so for example the site in Moscow can
go directly from GTT’s MPLS to ExpressRoute to the cloud. But we do not route
everything over ExpressRoute, only the most critical traffic, namely ADFS (Active
Directory Federation Services). We buy 200Mbps for ExpressRoute and do not find it too
expensive (around 5000-6000kr/month). We do not use it that much since we have had a
limited use of Azure until now, for cost reasons. Indeed, Azure uses asymmetrical costs:
when uploading and sending data to Azure it is very cheap but whenever we want to
download traffic it is much more expensive, making it cheaper to use our in-house
infrastructure until now.
I: Could you imagine having security services on the cloud such as Zscaler?
N: Yes. We currently have some physical firewalls to protect our industry equipment as
well as virtual and physical firewalls for the local internet breakouts, but we also have
Cisco Umbrella, which is a cloud security service provided by Cisco. It is constantly
updated on new threats via their Telos team. We have been using Umbrella for about a
year now and it works very well, so we are open to on-cloud security. We even think it
would be sufficient security if we were to choose Cisco’s Viptela SD-WAN since on most
of our sites we only have clients, meaning no servers or sensitive appliances like that. On
every site which has a server we always install an additional firewall and will continue to
do so (physical or virtual)..Moreover, Umbrella is a part of Cisco’s Viptela solution so it
is an advantage that we already have it in place.
Appendix C – Interview 2 |
95
I: When you are outsourcing security services to third parties, do you have no worries
related to them having access to your data? Is there no sensitive information or conflict
of interest?
N: No. We already have such services today, and these considerations are clearly handled
in the contract. We have very good lawyers that help us with it. We also have an external
company that looks into our IDS, the logs of our firewall, etc., 24/7 for us. We buy it as
a service because we do not have sufficient resources to do it in-house. Moreover, we are
not expert for that either, so we prefer to delegate it to specialists.
I: What are your thoughts about managed SD-WAN, NaaS, DIY, etc.?
N: All in all, we think that someone else has to manage the network. We want to have
only one point of contact in case of a problem. We would even like to delegate the task
of notifying the provider to the local branch which is being impacted, with the help of
clearly defined protocols which we would have established in advance. This would be to
further unburden our in-house IT team which is already stretched thin. We ourselves
simply want to manage the end-points: the datacenters and the routers.
I: If you buy SD-WAN as a managed service, which interaction would you like to have
with the provider and at what frequency?
We would like to only get a cable from them and then reports, ideally once a month. That
is the current frequency which we have for the MPLS reports, where we go through the
achieved up-time, whether the SLA was satisfied, what problems there were, how long
the tickets took to be solved (if there were any), etc.
I: To finish, do you have any thoughts you would like to add about SD-WAN in general
and its future?
N: I do not yet see the point for a company with only sites within Sweden to implement
SD-WAN, especially since MPLS is cheap in Sweden (and the internet as well: cheap
with good quality). I consider SD-WAN to be primarily for international companies: the
more globally the company is deployed, the more they will benefit from this technology.
One possible benefit justifying SD-WAN for such a company would be the easy any-to-
any communication. This could possibly be an advantage within Sweden: if you have
many small offices and you use SD-WAN then they can directly talk to each other without
needing to go over a central hub. But that is not one of our needs: in our network it is not
like that: the sites do not communicate with each other. They all simply talk with the DC
and the cloud.
I also think that the market is not totally consolidated yet: from what I see, everyone is
talking about SD-WAN but not so many have actually implemented it. Moreover, Cisco
is still releasing new versions so they have not yet settled on the final solution.
Ultimately, I think that SD-WAN is not so revolutionary in reality as it simply regroups
in one box services that were already being provided by several appliances; however it is
what we need at Nynas. There is no other alternative for us, and it will improve the
situation for both the users and the administrators. Yet even with SD-WAN, some
countries will always be a source of problems, as they already are today.

| Appendix D – Cisco Router Configuration
96
Appendix D: Configuration of the Cisco
router
Current configuration : 4314 bytes
version 15.1
service timestamps debug datetime msec
service timestamps log datetime msec
no service password-encryption
hostname Router
boot-start-marker
boot-end-marker
no aaa new-model
crypto pki token default removal timeout 0
ip source-route
ip cef
no ipv6 cef
multilink bundle-name authenticated
license udi pid CISCO891-K9 sn FCZ1621C1JY
!
crypto ikev2 proposal Azure-Stkm-ADSL-proposal
encryption aes-cbc-256
integrity sha1
group 2
crypto ikev2 proposal Azure-Stkm-Tunnel-proposal
encryption aes-cbc-256
integrity sha1
group 2
!
crypto ikev2 policy Azure-Stkm-ADSL-policy
match address local 213.112.7.143
proposal Azure-Stkm-ADSL-proposal
crypto ikev2 policy Azure-Stkm-Tunnel-policy
match address local 85.24.133.87
proposal Azure-Stkm-Tunnel-proposal
!
crypto ikev2 keyring Azure-Stkm-Tunnel-keyring
peer 52.169.83.102
address 52.169.83.102
pre-shared-key SDwan101
!
!
crypto ikev2 keyring Azure-Stkm-ADSL-keyring
peer 52.169.83.102
address 52.169.83.102
pre-shared-key SDwan202
!
!
!
crypto ikev2 profile Azure-Stkm-Tunnel-profile
match address local 85.24.133.87
match identity remote address 52.169.83.102 255.255.255.255
authentication local pre-share
authentication remote pre-share
keyring Azure-Stkm-Tunnel-keyring
lifetime 3600
dpd 10 5 on-demand
!
crypto ikev2 profile Azure-Stkm-ADSL-profile

Appendix D – Cisco Router Configuration |
97
match address local 213.112.7.143
match identity remote address 52.169.83.102 255.255.255.255
authentication local pre-share
authentication remote pre-share
keyring Azure-Stkm-ADSL-keyring
lifetime 3600
dpd 10 5 on-demand
!
crypto ipsec transform-set Azure-Stkm-Tunnel-TransformSet esp-gcm 256
crypto ipsec transform-set Azure-Stkm-ADSL-TransformSet esp-gcm 256
!
crypto ipsec profile Azure-Stkm-ADSL-IPsecProfile
set transform-set Azure-Stkm-ADSL-TransformSet
set ikev2-profile Azure-Stkm-ADSL-profile
!
crypto ipsec profile Azure-Stkm-Tunnel-IPsecProfile
set transform-set Azure-Stkm-Tunnel-TransformSet
set ikev2-profile Azure-Stkm-Tunnel-profile
!
!
interface Tunnel11
ip address 10.0.0.62 255.255.255.224
ip tcp adjust-mss 1350
tunnel source 85.24.133.87
tunnel mode ipsec ipv4
tunnel destination 52.169.83.102
tunnel protection ipsec profile Azure-Stkm-Tunnel-IPsecProfile
!
interface Tunnel22
ip address 10.0.0.162 255.255.255.224
ip tcp adjust-mss 1350
tunnel source 213.112.7.143
tunnel mode ipsec ipv4
tunnel destination 52.169.83.102
tunnel protection ipsec profile Azure-Stkm-ADSL-IPsecProfile
!
interface FastEthernet0
no ip address
!
interface FastEthernet1
no ip address
!
interface FastEthernet2
no ip address
!
interface FastEthernet3
no ip address
!
interface FastEthernet4
no ip address
!
interface FastEthernet5
no ip address
!
interface FastEthernet6
no ip address
!
interface FastEthernet7
no ip address
!
interface FastEthernet8
ip address dhcp
ip nat outside
ip virtual-reassembly in

| Appendix D – Cisco Router Configuration
98
duplex auto
speed auto
!
interface GigabitEthernet0
ip address 85.24.133.87 255.255.255.0
ip nat outside
ip virtual-reassembly in
duplex auto
speed auto
!
interface Vlan1
ip address 192.168.100.11 255.255.255.0
ip nat inside
ip virtual-reassembly in
!
interface Async1
no ip address
encapsulation slip
!
ip forward-protocol nd
!
!
no ip http server
no ip http secure-server
ip nat inside source route-map fastE8 interface FastEthernet8 overload
ip nat inside source route-map giga0nat interface GigabitEthernet0 overload
ip route 0.0.0.0 0.0.0.0 85.24.133.65 254
ip route 0.0.0.0 0.0.0.0 213.112.4.1 254
ip route 10.0.0.0 255.255.255.0 Tunnel11
ip route 10.0.0.0 255.255.255.0 Tunnel22
!
!
route-map giga0nat permit 10
match interface GigabitEthernet0
!
route-map fastE8 permit 10
match interface FastEthernet8
!
control-plane
!
mgcp profile default
!
!
line con 0
line 1
modem InOut
stopbits 1
speed 115200
flowcontrol hardware
line aux 0
line vty 0 4
login
transport input all
!
end

Appendix E – Talari Configuration |
99
Appendix E: Talari configuration
Here are the relevant parts of the configuration (the default sections were omitted).
define application_match_collection
{
add application_match
name=Iperf
{
set application_match_properties
application_category=Other
application_classification=interactive_p1
response_time_normal_ms=100
response_time_warning_ms=200
probing_interval_s=0
;
add application_match_criteria
ip_addrn1=10.0.0.0/24
ip_addrn2=192.168.100.0/24
port_num1=5001
;
}
}
define site
name=Azure
{
add appliance
name=Azure-VT800
{
set appliance_properties
model=vt800
appliance_mode=primary_ncn
;
add interface_group
{
set properties
bypass_mode=fail_to_block
;
add ethernet_interface
device=1
;
add virtual_interface
name=vTalari-LAN
vlan_id=0
;
}
add interface_group
{
set properties
secure_zone=untrusted
bypass_mode=fail_to_block
;
add ethernet_interface
device=2
;
add virtual_interface

| Appendix E – Talari Configuration
100
name=vTalari-WLAN
vlan_id=0
firewall_zone=Untrusted_Internet_Zone
;
}
add virtual_ip_addrn
virtual_interface_name=vTalari-LAN
ip_addrn=10.0.0.132/29
is_identity=true
;
add virtual_ip_addrn
virtual_interface_name=vTalari-WLAN
ip_addrn=10.0.0.140/29
is_identity=true
is_private=true
;
add route
net=10.0.0.0/27
gw_ip_addr=10.0.0.129
service=local
;
add virtual_wan_link
name=Azure-WL-1
{
set properties
access_type=public_internet
wan_ingress_physical_rate_kbps=20000
wan_egress_physical_rate_kbps=20000
wan_ingress_permitted_rate_kbps=20000
wan_egress_permitted_rate_kbps=20000
public_ip_addr=40.85.135.254
;
add access_interface
name=Azure-WL-1-AI-1
virtual_interface_name=vTalari-WLAN
virtual_ip_addr=10.0.0.140
gw_ip_addr=10.0.0.137
conduit_mode=primary
;
add conduit_usage
remote_site_name=Stockholm
wan_egress_rate_fair_share=1000
wan_ingress_rate_fair_share=1000
service_group_name=Default
autopath_group_name=Default
;
add net_usage
service_type=internet
wan_egress_rate_fair_share=1000
wan_ingress_rate_fair_share=1000
service_group_name=Default
;
add service_group
name=Default
wan_ingress_rate_fair_share=1000000
wan_egress_rate_fair_share=1000000
;
}
}
}
define site

Appendix E – Talari Configuration |
101
name=Stockholm
{
add appliance
name=Stockholm-E100
add interface_group
{
set properties
bypass_mode=fail_to_block
;
add ethernet_interface
device=1
;
add virtual_interface
name=Stockholm-LAN
vlan_id=0
;
}
add interface_group
{
set properties
bypass_mode=fail_to_block
;
add ethernet_interface
device=2
;
add virtual_interface
name=Stockholm-Bahn
vlan_id=0
;
}
add interface_group
{
set properties
secure_zone=untrusted
bypass_mode=fail_to_block
;
add ethernet_interface
device=4
;
add virtual_interface
name=Stockholm-ADSL
vlan_id=0
firewall_zone=Untrusted_Internet_Zone
is_dhcp_client=true
;
}
add virtual_ip_addrn
virtual_interface_name=Stockholm-Bahn
ip_addrn=85.24.133.87/25
is_identity=true
;
add virtual_ip_addrn
virtual_interface_name=Stockholm-LAN
ip_addrn=192.168.100.11/24
is_identity=true
;
add virtual_wan_link
name=Stkm-ADSL
{
set properties
access_type=public_internet

| Appendix E – Talari Configuration
102
wan_ingress_physical_rate_kbps=1500
wan_egress_physical_rate_kbps=15000
wan_ingress_permitted_rate_auto_learn=true
wan_egress_permitted_rate_auto_learn=true
enable_public_ip_learning=true
;
add access_interface
name=Stkm-ADSL-AI-1
virtual_interface_name=Stockholm-ADSL
conduit_mode=primary
;
add conduit_usage
remote_site_name=Azure
wan_egress_rate_fair_share=1000
wan_ingress_rate_fair_share=1000
service_group_name=Default
autopath_group_name=Default
;
add net_usage
service_type=internet
wan_egress_rate_fair_share=1000
wan_ingress_rate_fair_share=1000
service_group_name=Default
use=balance
;
add service_group
name=Default
wan_ingress_rate_fair_share=1000000
wan_egress_rate_fair_share=1000000
;
}
add virtual_wan_link
name=Stkm-Bahn
{
set properties
access_type=public_internet
wan_ingress_physical_rate_kbps=100000
wan_egress_physical_rate_kbps=100000
wan_ingress_permitted_rate_auto_learn=true
wan_egress_permitted_rate_auto_learn=true
enable_public_ip_learning=true
minimum_acceptable_bandwidth_for_abd_pct=10
;
add access_interface
name=Stkm-Bahn-AI-1
virtual_interface_name=Stockholm-Bahn
virtual_ip_addr=85.24.133.87
gw_ip_addr=85.24.133.65
conduit_mode=primary
;
add conduit_usage
remote_site_name=Azure
wan_egress_rate_fair_share=1000
wan_ingress_rate_fair_share=1000
service_group_name=Default
autopath_group_name=Default
;
add net_usage
service_type=internet
wan_egress_rate_fair_share=1000
wan_ingress_rate_fair_share=1000

Appendix E – Talari Configuration |
103
service_group_name=Default
use=balance
;
add service_group
name=Default
wan_ingress_rate_fair_share=1000000
wan_egress_rate_fair_share=1000000
;
}
}
}

www.kth.se
TRITA-EECS-EX-2019:795