from in vivo intracellular recordings determination of...
TRANSCRIPT

Journal of Visualized Experiments www.jove.com
Copyright © 2016 Journal of Visualized Experiments February 2016 | 108 | e53829 | Page 1 of 14
Video Article
Determination of Photoreceptor Cell Spectral Sensitivity in an Insect Modelfrom In Vivo Intracellular RecordingsKyle J. McCulloch1, Daniel Osorio2, Adriana D. Briscoe1
1Department of Ecology and Evolutionary Biology, University of California, Irvine2School of Life Sciences, University of Sussex
Correspondence to: Adriana D. Briscoe at [email protected]
URL: http://www.jove.com/video/53829DOI: doi:10.3791/53829
Keywords: Neuroscience, Issue 108, neurophysiology, intracellular recording, electrophysiology, insect, butterfly, opsin, rhodopsin, photoreceptorcell, compound eye, color vision
Date Published: 2/26/2016
Citation: McCulloch, K.J., Osorio, D., Briscoe, A.D. Determination of Photoreceptor Cell Spectral Sensitivity in an Insect Model from In VivoIntracellular Recordings. J. Vis. Exp. (108), e53829, doi:10.3791/53829 (2016).
Abstract
Intracellular recording is a powerful technique used to determine how a single cell may respond to a given stimulus. In vision research,intracellular recording has historically been a common technique used to study sensitivities of individual photoreceptor cells to different lightstimuli that is still being used today. However, there remains a dearth of detailed methodology in the literature for researchers wishing to replicateintracellular recording experiments in the eye. Here we present the insect as a model for examining eye physiology more generally. Insectphotoreceptor cells are located near the surface of the eye and are therefore easy to reach, and many of the mechanisms involved in vision areconserved across animal phyla. We describe the basic procedure for in vivo intracellular recording of photoreceptor cells in the eye of a butterfly,with the goal of making this technique more accessible to researchers with little prior experience in electrophysiology. We introduce the basicequipment needed, how to prepare a live butterfly for recording, how to insert a glass microelectrode into a single cell, and finally the recordingprocedure itself. We also explain the basic analysis of raw response data for determining spectral sensitivity of individual cell types. Although ourprotocol focuses on determining spectral sensitivity, other stimuli (e.g., polarized light) and variations of the method are applicable to this setup.
Video Link
The video component of this article can be found at http://www.jove.com/video/53829/
Introduction
The electrical properties of cells such as neurons are observed by measuring ion flow across cell membranes as a change in voltage or current.A variety of electrophysiological techniques have been developed to measure bioelectric events in cells. Neurons found in the eyes of animalsare accessible and their circuitry is often less complex than in the brain, making these cells good candidates for electrophysiological study.Common applications of electrophysiology in the eye include electroretinography (ERG)1,2 and microelectrode intracellular recording. ERGinvolves placing an electrode in or on the eye of an animal, applying a light stimulus, and measuring the change in voltage as a sum of theresponses of all nearby cells3-6. If one is specifically interested in characterizing spectral sensitivities of individual photoreceptor cells, oftenmultiple cell types simultaneously respond at different strengths to a given stimulus; thus it can be difficult to determine the sensitivities ofspecific cell types from ERG data especially if there are several different kinds of spectrally-similar photoreceptor cells in the eye. One potentialsolution is to create transgenic Drosophila with the photoreceptor (opsin) gene of interest expressed in the majority R1-6 cells in the eye andthen perform ERGs7. Potential drawbacks of this method include no to low-expression of the photoreceptor protein8, and the long time frame forthe generation and screening of transgenic animals. For eyes with fewer kinds of spectrally distinct photoreceptors, adaptation of the eye withcolored filters can help with lowering the contribution of some cell types to the ERG, thereby permitting estimation of spectral sensitivity maxima9.
Intracellular recording is another technique where a fine electrode impales a cell and a stimulus is applied. The electrode records only thatindividual cell's response so that recording from and analyzing multiple individual cells can yield specific sensitivities of physiologically differentcell types10-14. Although our protocol focuses on analysis of spectral sensitivity, the basic principles of intracellular recording with sharpelectrodes are modifiable for other applications. Using a different preparation of a specimen, for instance, and using sharp quartz electrodes, onemay record from deeper in the optic lobe or other regions in the brain, depending on the question being asked. For example, response times ofindividual photoreceptor cells15, cell activity in the optic lobes16 (lamina, medulla or lobula17), brain18 or other ganglia19 can also be recorded withsimilar techniques, or color stimuli could be replaced with polarization20-22 or motion stimuli23,24.
Phototransduction, the process by which light energy is absorbed and converted into an electrochemical signal, is an ancient trait common tonearly all present day animal phyla25. The visual pigment found in photoreceptor cells and responsible for initiating visual phototransduction isrhodopsin. Rhodopsins in all animals are made up of an opsin protein, a member of the 7 transmembrane G protein-coupled receptor family,and an associated chromophore which is derived from retinal or a similar molecule26,27. Opsin amino acid sequence and chromophore structureaffect the absorbance of rhodopsin to different wavelengths of light. When a photon is absorbed by the chromophore the rhodopsin becomesactivated, initiating a G-protein cascade in the cell that ultimately leads to the opening of membrane-bound ion channels28. Unlike most neurons,

Journal of Visualized Experiments www.jove.com
Copyright © 2016 Journal of Visualized Experiments February 2016 | 108 | e53829 | Page 2 of 14
photoreceptor cells undergo graded potential changes that can be measured as a relative change in response amplitude with changing lightstimulus. Typically a given photoreceptor type expresses only one opsin gene (though exceptions exist8,10,29-31). Sophisticated color vision, of thekind found in many vertebrates and arthropods, is achieved with a complex eye of hundreds or thousands of photoreceptor cells each expressingone or occasionally more rhodopsin types. Visual information is captured by comparing responses over the photoreceptor mosaic via complexdownstream neural signaling in the eye and brain, resulting in the perception of an image complete with color and motion.
After measuring the raw responses of a photoreceptor cell to different wavelengths of light via intracellular recording, it is possible to calculateits spectral sensitivity. This calculation is based on the Principle of Univariance, which states that a photoreceptor cell's response is dependenton the number of photons it absorbs, but not on the particular properties of the photons it absorbs32. Any photon that is absorbed by rhodopsinwill induce the same kind of response. In practice, this means that a cell's raw response amplitude will increase due to either an increase inlight intensity (more photons to absorb), or to a shift in wavelength toward its peak sensitivity (higher probability of rhodopsin absorbing thatwavelength). We make use of this principle in relating cellular responses at known intensity and the same wavelength to responses at differentwavelengths and the same intensity but unknown relative sensitivity. Cell types are often identified by the wavelength at which their sensitivitypeaks.
Here we show one method for intracellular recording and analysis of spectral sensitivity of photoreceptors in the eye of a butterfly, with a focuson making this method more accessible to the wider research community. Although intracellular recording remains common in the literature,particularly with respect to color vision in insects, we have found that descriptions of materials and methods are usually too brief to allow forreproduction of the technique. We present this method in video format with the aim of permitting its easier replication. We also describe thetechnique using easily obtainable and affordable equipment. We address common caveats that often are not reported, which slow down researchwhen optimizing a new and complex technique.
Protocol
All animals were treated as humanely as possible. Insects were shipped as pupae from Costa Rica Entomological Supply, Costa Rica.
1. Heliconius Pupae Care
1. Hang all pupae spaced 2-3 cm apart in a humidified chamber using insect pins.2. After eclosion, allow wings to dry then keep butterflies alive for at least 1 day in a humidified chamber and feed a dilute honey solution daily
before recording.1. Dilute honey with water to about a 20% honey solution by volume, and pour into a shallow Petri dish.2. Bring individual butterflies to the Petri dish, one by one. Upon touching the solution with their front tarsi, the butterflies will automatically
extend their proboscides and drink from the Petri dish. If their proboscis does not automatically extend, use forceps to pull theproboscis out and introduce it to the honey solution.
2. Optical Track, Calibration, and Measurement of Experimental Light Conditions
1. Place a 150 W Xenon arc lamp with housing and universal power supply and an attached condenser lens assembly on one end of a table atleast one meter long to deliver bright white light.
CAUTION: Xenon arc lamps produce extremely bright light with strong UV intensities. Protective eyewear should be worn at all times and thelamp should be used as directed by the manufacturer to prevent accumulation of ozone caused by interaction of UV light with atmosphericoxygen.
2. Set up an optical track one meter in length for the light exiting the housing assembly to pass through (Figure 1).1. Place in the following order on the optical track with approximate distances apart: 1) a convex silica or quartz lens 40 cm from the
condenser assembly, 2) a neutral density filter wheel (with no filters currently in the light path) 22 cm further along the track, 3) ashutter with drive unit 14 cm from the ND filters, 4) a concave silica or quartz lens immediately adjacent following the shutter, and 5) acollimating beam probe 6 cm further along the far end of the track.
2. Affix a 600 µm diameter fiber optic cable to the collimating beam probe.
Note: Depending on light intensity, a 5-10 mm diameter fiber optic cable may be required to deliver enough light to other preps and maybe substituted for this.
3. Adjust the distance, height and angle of each optical element so that the light beam exiting the assembly is at the highest intensitypossible.
4. As optical track elements may differ slightly with different applications, ensure that all elements transmit light in the UVA and visiblerange (315-700 nm).
3. Once the optical track is assembled, measure the light that passes through the setup using a spectrometer. Calibrate the spectrometer firstusing a calibration lamp with a known spectrum and the manufacturer's software.
Note: We describe the following set up using Ocean Optics products for clarity but other manufacturers (e.g., Avantes) sell comparableproducts.
1. Turn on the tungsten calibration lamp at least 45 min before taking measurements.2. To calibrate, attach the spectrometer via USB to a computer with the associated software installed. Then connect the spectrometer to
the tungsten calibration lamp via a UV-visible transmitting cosine corrector.3. Select "New Absolute Irradiance Measurement" from the "File" tab, and select the spectrometer as the "Source."4. Follow the prompts to create a new calibration "cal" file. When prompted, load the provided data file for the known spectrum of the
tungsten calibration lamp in the visible light range (300-800 nm) into the software, which automatically calculates the correctedspectrum from the spectrometer output.

Journal of Visualized Experiments www.jove.com
Copyright © 2016 Journal of Visualized Experiments February 2016 | 108 | e53829 | Page 3 of 14
5. Save the calibration file. Load this file when initializing the software for all future measurements of light spectra using the spectrometer.
4. Once the spectrometer is calibrated, use this to record the light spectra from the experimental setup. Hereafter when the software is opened,select "New Absolute Irradiance Measurement" and load the previously saved calibration file. Next take a dark spectrum by blocking all lightto the spectrometer.
1. With the spectrometer currently measuring the desired experimental light conditions, adjust the integration time (4 msec), scansto average (5), and boxcar width (5), so the spectrum is properly scaled and smoothed. Keep the settings the same for all spectralmeasurements, so that light intensities from different measurements can be compared.
5. Measure spectra for unattenuated white light, for all neutral density filters to be used during experiments, and for each bandpass interferencefilter (Figure 2).
1. Measure the white light spectrum without any filters in the light path by affixing the free end of the fiber optic cable from step 2.2.2 tothe spectrometer. With the calibration file loaded from step 2.3, save the white light spectrum using the spectrometer's software as atext file.
Note: Spectra saved as text files list the wavelength (x coordinates) in one column and the intensity of light (y coordinates) in thesecond column, so that the data may be loaded into a spreadsheet for step 2.6.
2. Using the same setup as step 2.5.1, record the spectrum from each optical density (OD) (0-3.5 OD) used during experiments byrotating the neutral density (ND) filter wheel in the optical track, and save the text file for each OD.
3. Using the same setup as step 2.5.1, place the 10 nm half bandwidth interference filters one by one into the light path and record thespectrum observed for each filter. Repeat this procedure for each of 41 different interference filters with peak transmittances spacedevery 10 nm from 300 to 700 nm. Filters spaced further apart (20 nm) are acceptable for most applications (for spectra, see Figure 2).
6. Correct for differences in intensity of light when interference filters are placed in the light path. Each interference filter allows a different totalnumber of photons to pass, and the low transmission of some filters makes it difficult to further attenuate intensity so that all filters allow equalnumbers of photons.
1. To calculate the relative intensity (I) for each 10 nm bandwidth interference filter, solve for I in the expression, I = T/sec, where T is thearea under the spectral curve of each 10 nm interference filter (from 2.5.3), and s is the maximum absolute irradiance (y value of savedtext file from 2.5.1) of white light at the peak wavelength of each filter (See Figure 2 for an example at 520 nm).
2. Divide all calculated intensities by the max intensity value calculated in 2.6.1 to normalize to one, and take the reciprocal of the relativenormalized values for use as a correction factor applied to the raw sensitivity at each wavelength (see Step 6.4).
7. Perform steps 2.1 through 2.6 only once before a set of experiments. Over the course of an experiment periodically record the absoluteirradiance of the Xenon arc lamp under bright light and neutral density filters, to make sure the intensity of the light stimulus does not change.
8. During the course of an experiment, if any cellular response to light transmitted through the interference filters approaches the maximumresponse amplitude, use the ND filters to attenuate the signal. If ND filters are used during an experiment, account for the correspondingdecrease in intensity during the calculation of spectral sensitivity.
9. Set up optical track, calibration, and filters days or weeks before experiments begin. Keep filters covered to prevent dust accumulation.
3. Recording Equipment Setup
1. Feed the same fiber optic cable used for calibration through a Faraday cage and mount on a goniometric device such as a Cardan armperimeter (see Figure 3 for diagram). The cable will be about 10 cm away from the eye of the specimen.
2. Place a metal stage on a vibrationally isolated table with an electrode holder mounted directly above the stage under control of amicromanipulator (Figure 4). Place the Cardan arm so that the specimen's head is at the center of the sphere created by the arm's rotationalmovement.
3. Using an intracellular preamplifier system, which includes an amplifier (outside the Faraday cage) and preamplifier (headstage, near the prepinside the Faraday cage) mount the headstage above the metal stage where the specimen will be placed.
1. Connect a coaxial cable to the headstage via a BNC connection. Split open only the tip on the other end of the coaxial cable, andseparate the outer metal sheath of the cable from the inner wire.
2. Solder the outer sheath (kept at ground potential) to one end of an insulated copper wire with an alligator clip on the other end. Thisalligator clip will attach to the metal reference electrode on the specimen platform (Step 5.1.4).
3. Solder the inner wire of the coaxial cable to a thin silver wire, to serve as the recording electrode. This wire should be thin enough to befed into the solution-filled glass electrode in Step 5.2.3.
4. Place a stereomicroscope attached to a swinging arm and base on the wooden bench outside the Faraday cage, so that it may be swung into lower the electrode into the eye, and swung back out again once the electrode is in the eye.
5. Make sure everything metal inside the Faraday cage is properly grounded.6. Outside the Faraday cage, attach the preamplifer to the input of a 50-60 Hz noise reducer (optional), and connect the output to one channel
of an oscilloscope using a BNC T-adapter.7. Using the other end of the T-adapter, connect the signal passing through the oscilloscope to one channel of the hardware. Attach this
hardware to a computer by a USB cable, which will allow responses recorded with the preamplifier to be read by software on the computer.8. Attach the shutter driver from the optical track to the second channel of the oscilloscope using another T-adapter and connect this to a pulse
generator that will control the frequency and duration of light flashes delivered to the eye (Step 5.5).
Note: Setup of the rig itself should only need to be done once. Break here until ready to begin recordings.
4. Prep on the Day of Recording
1. Turn on the Xenon lamp at least 45 min before the experiment and turn on the glass microelectrode puller at least 30 min before pulling glasselectrodes.

Journal of Visualized Experiments www.jove.com
Copyright © 2016 Journal of Visualized Experiments February 2016 | 108 | e53829 | Page 4 of 14
2. Turn on all recording equipment (shutter, amplifier, noise eliminator, pulse generator, oscilloscope, and data acquisition hardware) and makesure the shutter is closed by default so no light passes through the fiber optic cable.
3. Pull fine borosilicate (or aluminosilicate) glass microelectrodes (100-250 MΩ resistance is ideal) using a glass microelectrode puller. Useglass electrodes within only a few hr of being pulled.
4. Backfill the electrodes with 3 M Potassium chloride (KCl). Note that this solution may be modified according to the researcher's needs, e.g.dye injection.
5. Specimen Prep and Recording Procedure
1. Prepare the Specimen1. Affix an individual butterfly inside a small plastic tube with hot wax so the head is immobile and protruding from one end of the tube.
Wax down proboscis, antennae, and wings (Figure 5).2. Hold down the abdomen with a dry piece of wax and keep the tube humidified by placing a wet tissue inside the tube behind the
abdomen. Make sure the specimen is completely immobile.3. Mount the tube using a small piece of wax onto a small platform with a ball-and-socket joint that is attached to a magnetic base.4. Under a dissecting microscope, insert a silver wire of 0.125 mm diameter into the head via the mouthparts to be used as the reference
electrode. Before the experiment, permanently fix the wire to the platform in such a way that the copper wire in Step 3.3.2 may clip onto it once the platform is placed on the stage for recording.
5. Once the reference electrode is in a suitable position it may be kept in place by quickly melting and then cooling wax around the wire.6. Using a breakable carbon steel razor blade, grip part of the blade with a blade holder and break off a small piece to use for cutting the
cornea.7. Cut a small hole (~10 ommatidia in diameter) in the left cornea using the razorblade and seal the hole with Vaseline to prevent
desiccation.
2. Once the cornea is cut, insert the recording electrode into the eye as quickly as possible because hemolymph in the eye will quickly hardenand make it impossible to insert an electrode. If possible perform the dissection in the rig where the recording will take place.
Note: Vaseline should not be smeared on the rest of the eye as this will defocus the optics.1. If not already on the stage, place the mounted specimen and platform onto the stage in the recording rig. Connect the headstage
ground wire from step 3.3.2 to the reference electrode on the specimen platform using alligator clips.
Note: If possible use a red filter to illuminate the animal.2. Use a light source with gooseneck attachments to briefly light the specimen under a stereoscope while lowering the recording electrode
into the eye.3. Insert the silver wire connected to the headstage from step 3.3.3 into the KCl solution in the back of a glass microelectrode. Mount the
glass electrode on the electrode holder.4. Adjust the electrode holder so the microelectrode is directly over the hole previously cut in the cornea, about a millimeter above the
cornea. Lower the microelectrode into the eye using the micromanipulator until a circuit is completed, as shown by a large change inpotential (mV) on the oscilloscope.
3. Once in the eye, swing the stereoscope outside the Faraday cage, and turn off the light source illuminating the specimen. The room shouldbe kept dark so the eye becomes dark adapted.
4. Check the resistance of the electrode by applying a 1 nA current from the amplifier and noting the change in voltage. Resistance shouldtypically be in the range between 100-250 MΩ. Higher resistances are indicative of blockage or bending of the electrode, and low resistancesof electrode breakage.
5. Activate the pulse generator so the shutter opens allowing a flash of light with a 50 msec duration every 0.5 sec, and allow it to continueflashing for the duration of the experiment.
1. Adjust the pulse generator so it allows flashes of up to 50 msec duration. This duration and 0.5 sec pause between flashes keeps thespecimen as near to dark adapted as possible during the experiment. Fifty msec is close to the shortest flash duration that will elicit thesame amplitude in response as longer flash durations.
2. Re-measure responses at both the beginning and end of the experiment (Step 5.16). Over the course of about a twenty minuteexperiment, these flash settings do not degrade the response over time. Different preps may require adjustments to these flashsettings.
6. Position the Cardan arm so that the fiber optic cable is directed toward the eye.7. Check the oscilloscope for voltage change with each light flash. A negative change in voltage signifies that the electrode has not yet entered
a cell.8. Move the Cardan arm around the specimen until it is positioned at an angle to the eye at which there is a maximum voltage response.9. Rotate the micromanipulator back and forth, causing very small vertical movements of the electrode in both directions while lightly tapping
the base of the electrode holder or using the Buzz function on the preamplifier. Continue making small adjustments until a depolarizing lightresponse appears on the oscilloscope (Figure 6).
10. Adjust the Cardan arm again to find the angle of incidence where a flash of light produces the largest depolarizing signal. Make smalladjustments with the micromanipulator and use the Buzz function on the amplifier as needed to make sure the electrode is stably recordingthe cell and that it will stay in the cell for the whole experiment (See Step 5.11).
11. Once the setup is stable, begin recording. A stable recording should have little to no change in resting potential, low background noise, and aconsistently large depolarizing response (at least a 10:1 signal to noise ratio).
1. Run the software on the computer, and begin a "new experiment," which will open a pop up window with four channels.2. Adjust the voltage scale at the top right corner of the software window to 500 mV. The first channel will display the responses recorded
from the electrode in real time, while the second channel will record the square wave produced by the function generator, if the signal isfed to the data acquisition hardware via the oscilloscope, showing when the shutter is open. The other two channels are unneeded.

Journal of Visualized Experiments www.jove.com
Copyright © 2016 Journal of Visualized Experiments February 2016 | 108 | e53829 | Page 5 of 14
3. Click "Start" at the bottom right hand corner to begin recording, and allow the software to run for the duration of the experiment. Adjustthe zoom of the x (time) and y (voltage) axes so that the responses are clear.
12. First, with white light, record up to 10 individual responses with the ND filter wheel at 3.5 OD (about 5-10 sec).13. Next record the same number of responses at 3.3 OD, then 3.1, 3.0, 2.5, 2.3, 2.1, etc. in every combination until 0.0 OD. These response
amplitudes to the ND filter series will provide the response-log intensity curve in Section 6. If bleaching occurs, use fewer flashes of brightstimuli during the course of the experiment.
14. Record the response of the cell to all wavelengths, using the interference filters.1. First find the peak wavelength. Without ND filters in the light path (0.0 OD), place a UV transmitting filter in the light path and briefly
observe the response amplitude. Repeat with a blue transmitting filter, a green transmitting filter, and a red transmitting filter, whichshould give some idea of where the peak response will be.
2. Use filters at about 350, 450, 550, 650 nm to find the general region of peak sensitivity in step 5.14.1. The exact wavelength does notmatter in this initial search phase because all wavelengths will be recorded in the next step. If estimates exist of peak sensitivities, orthey have been previously recorded, use known wavelengths to quickly identify the peak response.
3. Once the peak response or close to it is identified, record at this wavelength for 10 responses (about 5 sec).4. After recording at the wavelength of peak response, record with the other interference filters, from 300-700 nm at 10 nm steps. Start
from the peak and step out toward both shorter and longer wavelengths by swapping the filters out from the light path one by one (e.g.if the peak response is at 520 nm, record responses at this wavelength first, then 510 nm, followed by 530 nm, 500 nm, 540 nm, 490nm, 550 nm, and so on until no there is no response).
5. Allow for up to 10 responses per filter (5 sec each). When swapping interference filters, allow the cell to respond to 1-2 flashes ofwhite light without any filter in the light path, which is helpful to monitor whether the peak response is degrading over time. Reduce thenumber of responses or increase the OD if bleaching occurs.
15. If the response under any interference filter is too close to the maximum response under white light at 0 OD, then attenuate with ND filters.The interference filters and size of the fiber optic cable used in this experiment greatly attenuate the intensity of light and so ND filters aretypically not needed.
16. If the recording remains stable, re-record wavelengths around the peak response, which serves as a pseudoreplicate for confirming previousresponse amplitudes and helps to ensure the response has not degraded over time. Once all wavelengths are recorded, re-record theresponses under the ND series, as in step 5.12.
17. Once recording is complete click "Stop" on the software, and save the recording for analysis.18. After an experiment, sacrifice the individual by freezing, or cooling for several minutes followed by swiftly severing the head and crushing the
thorax.19. Shut down all equipment. Break here if needed before doing the analysis.
6. Spectral Sensitivity Analysis
1. With the software used to record raw responses, calculate the mean response amplitude of 10 individual responses for each filter in the NDseries and for each interference filter.
2. Create a response-log intensity (VlogI) function from the ND filter series recorded in Steps 5.12-5.13 (Figure 7). Do this by plotting log unitsof intensity (OD) on the X axis, and response to each intensity on the y axis.
1. To derive spectral sensitivity of the cell at different wavelengths, typically fit the Naka-Rushton equation to the data from step 6.2, anduse this equation to relate experimentally obtained spectral responses of different wavelengths to relative photons required to elicit thatresponse under a constant wavelength (in this case white light).
Note: The Naka-Rushton equation is: V/Vmax = In/(In + Kn), where I is the stimulus intensity, V is the response amplitude, Vmax is themaximum response amplitude, K is the stimulus intensity giving ½ Vmax, and n is the exponential slope. Various methods can be usedto fit this equation to the VlogI data, including curve fitting software, or code-based statistical packages.
2. To fit the Naka-Rushton equation using simple calculations and a spreadsheet program, transform the VlogI response data for eachstimulus intensity: log[(Vmax/V) - 1]. Then perform linear regression on the transformed data to get the equation of the line of best fit.
Note: Vmax must be greater than any measured responses; to keep this consistent, this method estimates Vmax as 1% greater than thehighest measured response.
3. From the equation of the regression line, estimate the exponent (n) by taking the negative slope, and log(K) = y-intercept/n.
3. Once the parameters for Vmax, n, and K have been estimated, determine the relative number of photons required to elicit the spectralresponse of the cell at each wavelength by plugging in the measured spectral response at a given wavelength as (V) and solving for I.
4. Multiply the calculated stimulus intensity (I) from step 6.3 by the correction factor for each interference filter (from step 2.4.3) at eachwavelength.
5. To get sensitivity, all intensities must be related to the V log-I curve so they can be compared. Do this by relating each wavelength intensity to½ Vmax or K, calculated in Step 6.2.3.
1. Subtract each corrected wavelength intensity (Step 6.4) from K. 2. Then for each wavelength intensity, add this “distance from K” value to K, and multiply by (-1). 3. Next bring all data points positive by adding the absolute value of the lowest data point in the series to each wavelength.
6. Find sensitivity at each wavelength by taking the reciprocal of all newly calculated intensities from Step 6.5.1. Transform the data so that thesensitivity spectrum falls between 0 and 1.
7. After recording from more than one cell of the same type average the final responses and plot with standard error bars or 95% confidenceintervals (Figure 8).
Journal of Visualized Experiments www.jove.com
Copyright © 2016 Journal of Visualized Experiments February 2016 | 108 | e53829 | Page 6 of 14
Representative Results
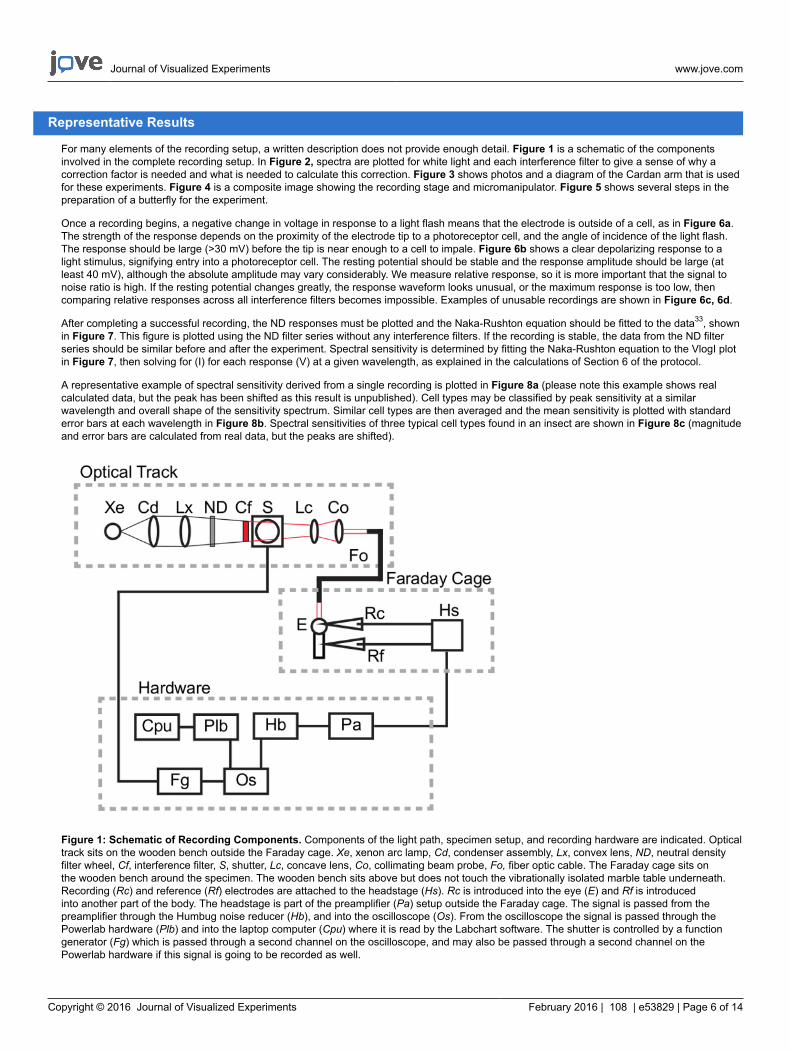
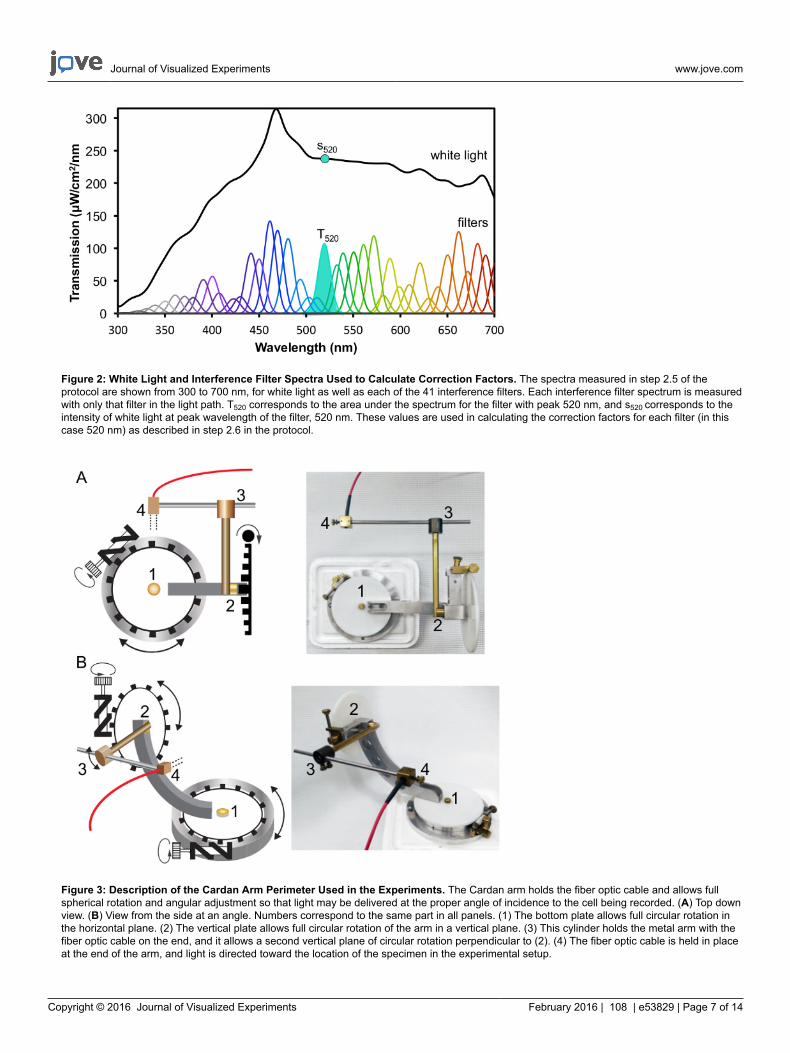
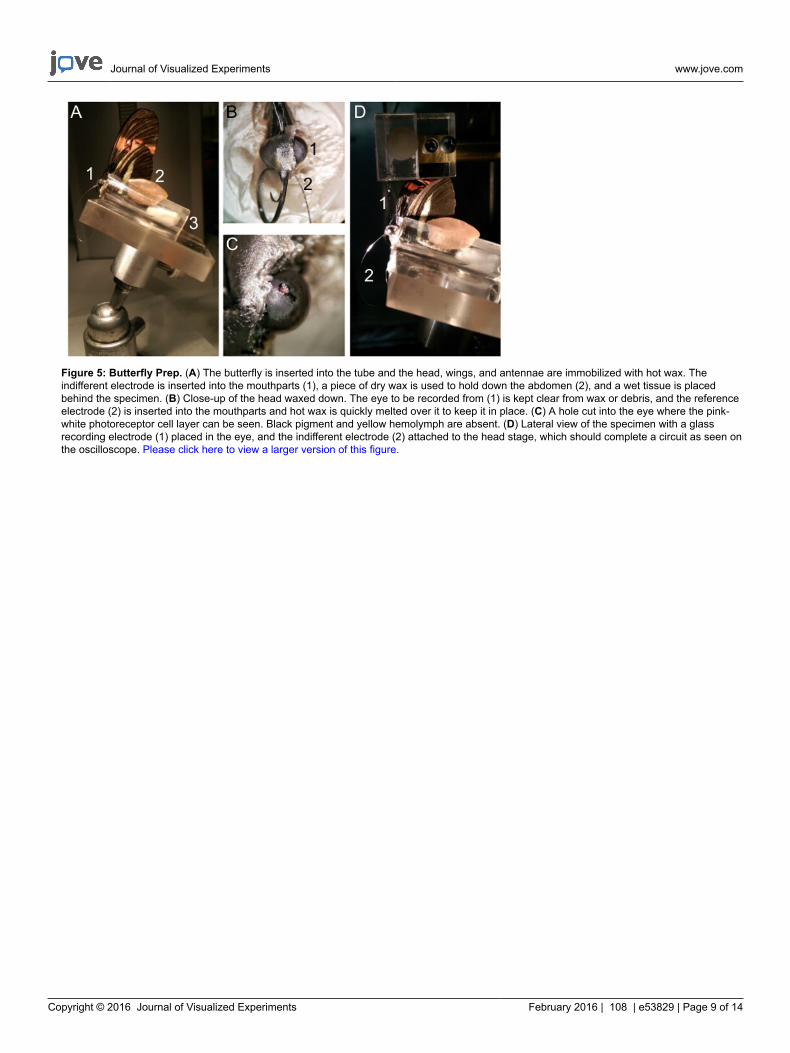
For many elements of the recording setup, a written description does not provide enough detail. Figure 1 is a schematic of the componentsinvolved in the complete recording setup. In Figure 2, spectra are plotted for white light and each interference filter to give a sense of why acorrection factor is needed and what is needed to calculate this correction. Figure 3 shows photos and a diagram of the Cardan arm that is usedfor these experiments. Figure 4 is a composite image showing the recording stage and micromanipulator. Figure 5 shows several steps in thepreparation of a butterfly for the experiment.
Once a recording begins, a negative change in voltage in response to a light flash means that the electrode is outside of a cell, as in Figure 6a.The strength of the response depends on the proximity of the electrode tip to a photoreceptor cell, and the angle of incidence of the light flash.The response should be large (>30 mV) before the tip is near enough to a cell to impale. Figure 6b shows a clear depolarizing response to alight stimulus, signifying entry into a photoreceptor cell. The resting potential should be stable and the response amplitude should be large (atleast 40 mV), although the absolute amplitude may vary considerably. We measure relative response, so it is more important that the signal tonoise ratio is high. If the resting potential changes greatly, the response waveform looks unusual, or the maximum response is too low, thencomparing relative responses across all interference filters becomes impossible. Examples of unusable recordings are shown in Figure 6c, 6d.
After completing a successful recording, the ND responses must be plotted and the Naka-Rushton equation should be fitted to the data33, shownin Figure 7. This figure is plotted using the ND filter series without any interference filters. If the recording is stable, the data from the ND filterseries should be similar before and after the experiment. Spectral sensitivity is determined by fitting the Naka-Rushton equation to the VlogI plotin Figure 7, then solving for (I) for each response (V) at a given wavelength, as explained in the calculations of Section 6 of the protocol.
A representative example of spectral sensitivity derived from a single recording is plotted in Figure 8a (please note this example shows realcalculated data, but the peak has been shifted as this result is unpublished). Cell types may be classified by peak sensitivity at a similarwavelength and overall shape of the sensitivity spectrum. Similar cell types are then averaged and the mean sensitivity is plotted with standarderror bars at each wavelength in Figure 8b. Spectral sensitivities of three typical cell types found in an insect are shown in Figure 8c (magnitudeand error bars are calculated from real data, but the peaks are shifted).
Figure 1: Schematic of Recording Components. Components of the light path, specimen setup, and recording hardware are indicated. Opticaltrack sits on the wooden bench outside the Faraday cage. Xe, xenon arc lamp, Cd, condenser assembly, Lx, convex lens, ND, neutral densityfilter wheel, Cf, interference filter, S, shutter, Lc, concave lens, Co, collimating beam probe, Fo, fiber optic cable. The Faraday cage sits onthe wooden bench around the specimen. The wooden bench sits above but does not touch the vibrationally isolated marble table underneath.Recording (Rc) and reference (Rf) electrodes are attached to the headstage (Hs). Rc is introduced into the eye (E) and Rf is introducedinto another part of the body. The headstage is part of the preamplifier (Pa) setup outside the Faraday cage. The signal is passed from thepreamplifier through the Humbug noise reducer (Hb), and into the oscilloscope (Os). From the oscilloscope the signal is passed through thePowerlab hardware (Plb) and into the laptop computer (Cpu) where it is read by the Labchart software. The shutter is controlled by a functiongenerator (Fg) which is passed through a second channel on the oscilloscope, and may also be passed through a second channel on thePowerlab hardware if this signal is going to be recorded as well.
Journal of Visualized Experiments www.jove.com
Copyright © 2016 Journal of Visualized Experiments February 2016 | 108 | e53829 | Page 7 of 14
Figure 2: White Light and Interference Filter Spectra Used to Calculate Correction Factors. The spectra measured in step 2.5 of theprotocol are shown from 300 to 700 nm, for white light as well as each of the 41 interference filters. Each interference filter spectrum is measuredwith only that filter in the light path. T520 corresponds to the area under the spectrum for the filter with peak 520 nm, and s520 corresponds to theintensity of white light at peak wavelength of the filter, 520 nm. These values are used in calculating the correction factors for each filter (in thiscase 520 nm) as described in step 2.6 in the protocol.
Figure 3: Description of the Cardan Arm Perimeter Used in the Experiments. The Cardan arm holds the fiber optic cable and allows fullspherical rotation and angular adjustment so that light may be delivered at the proper angle of incidence to the cell being recorded. (A) Top downview. (B) View from the side at an angle. Numbers correspond to the same part in all panels. (1) The bottom plate allows full circular rotation inthe horizontal plane. (2) The vertical plate allows full circular rotation of the arm in a vertical plane. (3) This cylinder holds the metal arm with thefiber optic cable on the end, and it allows a second vertical plane of circular rotation perpendicular to (2). (4) The fiber optic cable is held in placeat the end of the arm, and light is directed toward the location of the specimen in the experimental setup.

Journal of Visualized Experiments www.jove.com
Copyright © 2016 Journal of Visualized Experiments February 2016 | 108 | e53829 | Page 8 of 14
Figure 4: Components of the Recording Setup. (A) Plastic tube used to hold the specimen. (B) Overhead view of the platform on which thespecimen and tube are mounted. (C) Side view of ball-and-joint platform with magnetic base (1). Reference electrode kept immobile with glueand wax on side of platform (2). Reference electrode wrapped around alligator clip and soldered in place, providing an attachment area wherethe headstage reference electrode can clip (3). (D) Electrode tip under 20X magnification. Scale bar, 25 µm. (E) Stage, electrode holder, andmicromanipulator setup. The headstage (1) is fixed above the apparatus with the silver recording wire (2), and the reference electrode withalligator clip (3) attached. The electrode holder (4) is fixed to a manual micromanipulator (5) with a post below that may be adjusted with a knobfor vertical movement or may be pushed or pulled for horizontal movement of the electrode holder. The magnetic platform with specimen sits onthe stage (6) just below the electrode holder. (F) The Faraday cage surrounds the recording setup with a screen that can be pulled up or down inthe front. Aluminum foil is placed underneath all equipment with rubber pads on top. The fiber optic cable (1) leads into the cage from the opticaltrack outside, and is directed by the Cardan arm (2) toward the stage (3). The recording stage and manipulator apparatus is placed in a sand box(4) resting on a marble table underneath the setup. All other equipment rests on the wooden bench top that does not touch the marble table. Thesand box sits on top of the marble table in a hole cut out of the wooden table, so that the specimen is completely vibrationally isolated from theequipment on the wooden tabletop. Please click here to view a larger version of this figure.
Journal of Visualized Experiments www.jove.com
Copyright © 2016 Journal of Visualized Experiments February 2016 | 108 | e53829 | Page 9 of 14
Figure 5: Butterfly Prep. (A) The butterfly is inserted into the tube and the head, wings, and antennae are immobilized with hot wax. Theindifferent electrode is inserted into the mouthparts (1), a piece of dry wax is used to hold down the abdomen (2), and a wet tissue is placedbehind the specimen. (B) Close-up of the head waxed down. The eye to be recorded from (1) is kept clear from wax or debris, and the referenceelectrode (2) is inserted into the mouthparts and hot wax is quickly melted over it to keep it in place. (C) A hole cut into the eye where the pink-white photoreceptor cell layer can be seen. Black pigment and yellow hemolymph are absent. (D) Lateral view of the specimen with a glassrecording electrode (1) placed in the eye, and the indifferent electrode (2) attached to the head stage, which should complete a circuit as seen onthe oscilloscope. Please click here to view a larger version of this figure.

Journal of Visualized Experiments www.jove.com
Copyright © 2016 Journal of Visualized Experiments February 2016 | 108 | e53829 | Page 10 of 14
Figure 6: Raw Responses from Sample Recordings. Each response corresponds to a single light flash of 50 msec duration (black bars).(A) An example of the large negative voltage change that should be seen just before entering a cell. (B) A clean recording should have littlebackground noise and a large depolarizing response, typically of at least 40 mV. (C) An example of a poor recording due to the negative potentialchange after the main peak (arrowheads). (D) Another example of a bad recording. The resting potential is undergoing large fluctuations (redbar) and the large amount of background noise can obscure the amplitude of response (arrowhead).

Journal of Visualized Experiments www.jove.com
Copyright © 2016 Journal of Visualized Experiments February 2016 | 108 | e53829 | Page 11 of 14
Figure 7: Response-Intensity Log-Linear Function. Solid circles show the measured responses of a cell from 3.5 to 0 OD, for thisexperimental setup. Light intensity is on a logarithmic scale. At very high intensities the response is saturated, and at very low intensities a smallresponse persists instead of dropping to zero along the line. The Naka-Rushton equation33 is fitted to this non-linear shape (dotted line).

Journal of Visualized Experiments www.jove.com
Copyright © 2016 Journal of Visualized Experiments February 2016 | 108 | e53829 | Page 12 of 14
Figure 8: Spectral Sensitivity Examples. (A) A single representative cell's responses were recorded and relative spectral sensitivity wascalculated. The peak of this cell is at 440 nm, meaning it responds best to blue light. Single cell data may look noisy (peak at 380 nm). (B) Cellswith the same relative peak and shape are averaged together and standard error bars are added. Here, seven blue cells from seven individualswere averaged providing strong evidence that a cell type exists in this species maximally sensitive to light at 440 nm. (C) This process can berepeated for all cell types found, and plotted together. Insect eyes vary widely in their spectral sensitivities but a typical insect may have peaksshown here, at 370 nm, 440 nm, and 510 nm. Note, these spectral sensitivities are all calculated using real data, but the peaks have been shiftedbecause the data is not yet published for this species.
Discussion
Intracellular recording can be a difficult technique to master due to the many technical steps involved. For successful experiments severalimportant points must be considered. First, it is important to have a properly vibrationally-isolated table on which the experiment is performed.Many researchers use air tables, which completely separate the tabletop from the base, giving superior vibration isolation. Our setup involvesa thick marble table with a sandbox on top, into which is placed the micromanipulator/electrode holder/specimen stage apparatus. This is aneffective and more affordable alternative to an air table, especially if access to in-house gas or compressed air is a limitation. Additional vibration-absorbing measures may be taken such as passive air suspension, or the addition of cushioning elements to the table legs (e.g., opened tennisballs, bike tubes, thick gel pads). Furthermore, it is essential that the experimental setup be inside a Faraday cage with everything properlygrounded. The Faraday cage should have a metal mesh screen in the front that can be removed when working inside the cage and replacedeasily when recording. Even a small amount of ambient electrical noise (especially 50 Hz noise from the main AC power supply) can make anotherwise good recording unusable.
When preparing the specimen, hemolymph and pigment layers surrounding the ommatidia may prevent successful recordings. If the hole inthe cornea is cut too large, normal pumping of hemolymph in the body causes the liquid surface to move up and down at the cut site, resultingin an unstable recording. Once the hole is cut, hemolymph and surface pigment layers will clot rapidly into an impenetrable scab even whensealed with petroleum jelly, so it is important to get the electrode into the eye as soon as possible. Ringer's solution may also be used instead ofVaseline. The ground electrode may be introduced into the mouthparts or into the stump of a cut antenna.

Journal of Visualized Experiments www.jove.com
Copyright © 2016 Journal of Visualized Experiments February 2016 | 108 | e53829 | Page 13 of 14
Additionally, it is often helpful to keep the animal as dark-adapted as possible. For this method, steps include keeping the recording room verydark, blocking stray light from the Xenon lamp from entering the Faraday cage, short duration stimulus flashes (30-50 msec), and a low enoughfrequency between flashes (0.5 or greater). When a visual pigment absorbs a photon, the chromophore in rhodopsin switches from 11-cis-3-hydroxyretinal to all-trans-retinal, inducing the conformational change of the opsin protein, and activating the entire complex as metarhodopsin,which initiates the G protein cascade. Photo-bleaching occurs when high intensity light causes the chromophore to physically separate fromthe opsin protein. Time is a limiting factor in this experiment because the electrode will only stably record responses from within the cell for acertain period of time before it falls out or the membrane is damaged. For this reason we do not break to allow the cell to recover, but we do usea flash duration and frequency that we have found does not degrade the cell's response over time. It is important to decrease both frequency andintensity of light if photo-bleaching occurs.
During recording, a large electrode tip or large movement by the electrode may damage the cell when penetrating the membrane. Only finetips (at least ~100 MΩ) and small movements should be used when approaching a cell for recording. If intracellular recording is applied to otherapplications, such as brain recordings, extremely fine, sturdy electrodes may be pulled using quartz glass, but a specialized puller must be usedfor these electrodes. When first making an electrode pulling program, we checked tip resistance by backfilling the electrode, securing it to theelectrode holder in a mock setup, and placing the tip and ground electrode in saline solution. Next we applied a current to measure change involtage on the oscilloscope. To move the electrode tip we use a manual micromanipulator that moves along two axes. Other manipulators existincluding digital ones that allow movement along all three axes and these may be used for this or more complex applications. There are manyways to build a stage for recording, and there are many different types of hardware and software used in recording and analyzing the observeddata. Our setup represents one simple, easy, and affordable setup of the recording rig.
In constructing the VlogI curve, functions developed by Naka and Rushton33 and others34,35 account for the non-linear portions of the plottedresponses. Various methods are used to fit this curve to the data, and we plotted the results of one such method that does not require curve-fitting software, though other methods are also suitable36,37 (Figure 7). It may also be useful to compare spectral sensitivities to models ofrhodopsin absorbance at a given peak wavelength. Several published models aim to reproduce rhodopsin absorbance spectra38,39. A moreprecise idea of the absorbance spectrum of the visual pigment expressed in an insect photoreceptor cell may be modeled by taking into accountommatidial properties such as filtering pigments, but this requires measurement of additional physiological and anatomical parameters11,40.
One limitation of the method is that if the study organism expresses more than one genetically similar opsin in the eye, it can be difficult toidentify which opsin mRNA likely corresponds to which spectral class of photoreceptor cell. To overcome this problem, this method has beencombined with dye-injections and in situ hybridization or immunohistochemistry to successfully identify the opsins expressed in recorded cells10.
Our method is simple and accessible for researchers unfamiliar with visual electrophysiology. This technique is common in neuroscience, butspecific and clear methods are absent in the literature, making this method difficult to reproduce. Although many variations of this techniqueexist, we offer a straightforward way to measure spectral sensitivity in the compound eye. The physiological data is an important piece ofevidence in stories of visual ecology and evolution41. Opsin sequence variation is linked closely with the sensitivity of a photoreceptor cell,making this method ideal for studies examining the genetic basis for phenotypic change. Measurement of photoreceptor cell sensitivities mayalso be paired with behavioral color discrimination assays, showing the physiological basis for important discrimination thresholds in colorvision42-46. In genetic or therapeutic manipulations in Drosophila for example, this technique can be a good way to measure proper physiologicalfunction of the eye or brain as well47,48. Although ours is not the first or the most complex method of intracellular recording in the eye, our hope isthat we can make this method more easily available for reproduction and integration in research programs outside of formal neuroscience.
Disclosures
The authors declare that they have no competing financial interests.
Acknowledgements
We thank the late Rudy Limburg for fabricating the cardan arm perimeter, Kimberly Jamison, Matthew McHenry, and Raju Metherate for lendingus equipment, and Almut Kelber and Kentaro Arikawa, for encouragement. This work was supported by a National Science Foundation (NSF)Graduate Research Fellowship to KJM and NSF grant IOS-1257627 to A.D.B.
References
1. Beckmann, H. et al. Spectral sensitivity in Onychophora (velvet worms) revealed by electroretinograms, phototactic behaviour and opsin geneexpression. J. Exp. Biol. 218, 915-922 (2015).
2. Leboulle, G. et al. Characterisation of the RNA interference response against the long-wavelength receptor of the honeybee. Insect Biochem.Mol. Biol. 43, 959-969 (2013).
3. Martinez-Harms, J. et al. Evidence of red sensitive photoreceptors in Pygopleurus israelitus (Glaphyridae: Coleoptera) and its implications forbeetle pollination in the southeast Mediterranean. J. Comp. Physiol. A. 198, 451-463 (2012).
4. Knox, B. E. et al. Heterologous expression of Limulus rhodopsin. J. Biol. Chem. 278, 40493-40502 (2003).5. Salcedo, E., Zheng, L., Phistry, M., Bagg, E. E., & Britt, S. G. Molecular basis for ultraviolet vision in invertebrates. J. Neurosci. 23,
10873-10878 (2003).6. Salcedo, E. et al. Blue- and green-absorbing visual pigments of Drosophila: ectopic expression and physiological characterization of the R8
photoreceptor cell-specific Rh5 and Rh6 rhodopsins. J. Neurosci. 19, 10716-10726 (1999).7. Vilinsky, I., & Johnson, K. G. Electroretinograms in Drosophila: a robust and genetically accessible electrophysiological system for the
undergraduate laboratory. J. Undergrad. Neurosci. Educ. 11, A149-157 (2012).8. Hu, X., Leming, M. T., Whaley, M. A., & O'Tousa, J. E. Rhodopsin coexpression in UV photoreceptors of Aedes aegypti and Anopheles
gambiae mosquitoes. J. Exp. Biol. 217, 1003-1008 (2014).

Journal of Visualized Experiments www.jove.com
Copyright © 2016 Journal of Visualized Experiments February 2016 | 108 | e53829 | Page 14 of 14
9. Telles, F. J. et al. Out of the blue: the spectral sensitivity of hummingbird hawkmoths. J. Comp. Physiol. A. 200, 537-546 (2014).10. Arikawa, K., Mizuno, S., Kinoshita, M., & Stavenga, D. G. Coexpression of two visual pigments in a photoreceptor causes an abnormally
broad spectral sensitivity in the eye of the butterfly Papilio xuthus. J. Neurosci. 23, 4527-4532 (2003).11. Arikawa, K. et al. An ultraviolet absorbing pigment causes a narrow-band violet receptor and a single-peaked green receptor in the eye of the
butterfly Papilio. Vision Res. 39, 1-8 (1999).12. Cronin, T. W., Jarvilehto, M., Weckstrom, M., & Lall, A. B. Tuning of photoreceptor spectral sensitivity in fireflies (Coleoptera: Lampyridae). J.
Comp. Physiol. A. 186, 1-12 (2000).13. Skorupski, P., Doring, T. F., & Chittka, L. Photoreceptor spectral sensitivity in island and mainland populations of the bumblebee, Bombus
terrestris. J. Comp. Physiol. A. 193, 485-494 (2007).14. Stalleicken, J., Labhart, T., & Mouritsen, H. Physiological characterization of the compound eye in monarch butterflies with focus on the dorsal
rim area. J. Comp. Physiol. A. 192, 321-331 (2006).15. Skorupski, P., & Chittka, L. Photoreceptor processing speed and input resistance changes during light adaptation correlate with spectral class
in the bumblebee, Bombus impatiens. PLoS One. 6, e25989 (2011).16. Yang, E.-C., & Osorio, D. Spectral sensitivities of photoreceptors and lamina monopolar cells in the dragonfly, Hemicordulia tau. J. Comp.
Physiol. A. 169 (1991).17. Yang, E. C., Lin, H. C., & Hung, Y. S. Patterns of chromatic information processing in the lobula of the honeybee, Apis mellifera. L. J. Insect
Physiol. 50, 913-925 (2004).18. Rosner, R., & Homberg, U. Widespread sensitivity to looming stimuli and small moving objects in the central complex of an insect brain. J.
Neurosci. 33, 8122-8133 (2013).19. Trager, U., & Homberg, U. Polarization-sensitive descending neurons in the locust: connecting the brain to thoracic ganglia. J. Neurosci. 31,
2238-2247 (2011).20. Heinze, S., & Reppert, S. M. Sun compass integration of skylight cues in migratory monarch butterflies. Neuron. 69, 345-358 (2011).21. Greiner, B., Cronin, T. W., Ribi, W. A., Wcislo, W. T., & Warrant, E. J. Anatomical and physiological evidence for polarisation vision in the
nocturnal bee Megalopta genalis. J. Comp. Physiol. A. 193, 591-600 (2007).22. Stowasser, A., & Buschbeck, E. K. Electrophysiological evidence for polarization sensitivity in the camera-type eyes of the aquatic predacious
insect larva Thermonectus marmoratus. J. Exp. Biol. 215, 3577-3586 (2012).23. Osorio, D. Directionally selective cells in the locust medulla. J. Comp. Physiol. A. 159, 841-847 (1986).24. Nordström, K., Barnett, P. D., Moyer de Miguel, I. M., Brinkworth, R. S., & O'Carroll, D. C. Sexual dimorphism in the hoverfly motion vision
pathway. Curr. Biol. 18, 661-667 (2008).25. Plachetzki, D. C., Fong, C. R., & Oakley, T. H. The evolution of phototransduction from an ancestral cyclic nucleotide gated pathway. Proc.
Biol. Sci. 277, 1963-1969 (2010).26. Feuda, R., Hamilton, S. C., McInerney, J. O., & Pisani, D. Metazoan opsin evolution reveals a simple route to animal vision. Proc. Natl. Acad.
Sci. U.S.A. 109, 18868-18872 (2012).27. Palczewski, K. et al. Crystal structure of rhodopsin: A G protein-coupled receptor. Science. 289, 739-745 (2000).28. Hardie, R. C., & Raghu, P. Visual transduction in Drosophila. Nature. 413, 186-193 (2001).29. Katti, C. et al. Opsin co-expression in Limulus photoreceptors: differential regulation by light and a circadian clock. J. Exp. Biol. 213,
2589-2601 (2010).30. Smith, W. C., Price, D. A., Greenberg, R. M., & Battelle, B. A. Opsins from the lateral eyes and ocelli of the horseshoe crab, Limulus
polyphemus. Proc. Natl. Acad. Sci. U.S.A. 90, 6150-6154 (1993).31. Sison-Mangus, M. P., Bernard, G. D., Lampel, J., & Briscoe, A. D. Beauty in the eye of the beholder: the two blue opsins of lycaenid
butterflies and the opsin gene-driven evolution of sexually dimorphic eyes. J. Exp. Biol. 209, 3079-3090 (2006).32. Rushton, W. Review Lecture. Pigments and signals in colour vision. J. Physiol. 220, 1-31 (1972).33. Naka, K. I., & Rushton, W. A. S-potentials from luminosity units in the retina of fish (Cyprinidae). J. Physiol. 185, 587-599 (1966).34. Lipetz, L. E. in Principles of Receptor Physiology. Vol. 1 Handbook of Sensory Physiology. (ed W. R. Loewenstein) Ch. 6, 191-225, Springer
Berlin Heidelberg, (1971).35. Matić, T., & Laughlin, S. B. Changes in the intensity-response function of an insect's photoreceptors due to light adaptation. J. Comp. Physiol.
A. 145, 169-177 (1981).36. Evans, L. S., Peachey, N. S., & Marchese, A. L. Comparison of three methods of estimating the parameters of the Naka-Rushton equation.
Documenta Ophthalmologica. 84, 19-30 (1993).37. Aylward, G. W. A simple method of fitting the Naka-Rushton equation. Clinical Vision Sciences. 4, 275-277 (1989).38. Stavenga, D. G., Smits, R. P., & Hoenders, B. J. Simple exponential functions describing the absorbance bands of visual pigment spectra.
Vision Res. 33, 1011-1017 (1993).39. Bernard, G. D. Red-absorbing visual pigment of butterflies. Science. 203, 1125-1127 (1979).40. Ogawa, Y. et al. Coexpression of three middle wavelength-absorbing visual pigments in sexually dimorphic photoreceptors of the butterfly
Colias erate. J. Comp. Physiol. A. 198, 857-867 (2012).41. Briscoe, A. D., & Chittka, L. The evolution of color vision in insects. Annu. Rev. Entomol. 46, 471-510 (2001).42. Kelber, A., Thunell, C., & Arikawa, K. Polarisation-dependent colour vision in Papilio butterflies. J. Exp. Biol. 204, 2469-2480 (2001).43. Kelber, A., Balkenius, A., & Warrant, E. J. Scotopic colour vision in nocturnal hawkmoths. Nature. 419, 922-925 (2002).44. Koshitaka, H., Kinoshita, M., Vorobyev, M., & Arikawa, K. Tetrachromacy in a butterfly that has eight varieties of spectral receptors. Proc. Biol.
Sci. 275, 947-954 (2008).45. Blackiston, D., Briscoe, A. D., & Weiss, M. R. Color vision and learning in the monarch butterfly, Danaus plexippus (Nymphalidae). J. Exp.
Biol. 214, 509-520 (2011).46. Sison-Mangus, M. P., Briscoe, A. D., Zaccardi, G., Knuttel, H., & Kelber, A. The lycaenid butterfly Polyommatus icarus uses a duplicated blue
opsin to see green. J. Exp. Biol. 211, 361-369 (2008).47. Schneuwly, S. et al. Drosophila ninaA gene encodes an eye-specific cyclophilin (cyclosporine A binding protein). Proc. Natl. Acad. Sci. U.S.A.
(1989).48. Luan, Z., Reddig, K., & Li, H. S. Loss of Na(+)/K(+)-ATPase in Drosophila photoreceptors leads to blindness and age-dependent
neurodegeneration. Exp. Neurol. 261, 791-801 (2014).