from constant prices to chain-linked prices: what
TRANSCRIPT
June 2007 9
From constant prices to chain-linkedprices: what consequences?
Franck ArnaudGuillaume Mordant
Bertrand LhommeauChristelle Minodier
Franck CachiaFrédéric Tallet
Divisions
- Quarterly National Accounts- Business Survey- Short-Term Economic Analysis
Until the start of 2007, the volume series of the quarterlynational accounts were published in constant
base-year prices (in this case, the base year was 2000). Tomeasure economic reality more accurately and meetEuropean Union (EU) requirements, the series willhenceforth be calculated at chain-linked prices. The firstpublication concerned was the set of initial results for Q12007, released on May 15, 2007. From now on,“Conjoncture in France” will therefore be based on thesenew series.
Our article reviews the implications of this importantchange for the reinterpretation of growth and itsdeterminants, and for tools used in short-term forecasting.The study is divided into three parts: (I) description ofdifferent concepts used to determine volumes; (II) analysisof the impact of the switch to chain-linked prices on theinterpretation of the recent past; (III) examination ofimplications for econometric forecasting tools.
The transition to chain-linked prices gives a slightlydifferent image of France’s recent past: the external-tradecontribution to GDP growth is less negative because thenew approach allows for the relative decrease in prices ofimported capital goods. By contrast, householdconsumption explains a smaller share of growth.Investment is practically unaffected by the change ofconcept. For short-term analysis, the adoption ofchain- l inked pr ices has an occasional—butmarginal—impact on the econometric tools in currentuse.

I - Chain-linked prices provide abetter description of economicreality
There are two ways of measuring economicaggregates: in “nominal” or “value” terms, i.e. atcurrent prices, or in “volume” or “real” terms, i.e.,excluding inflation effects. While it is relatively easyto measure volume for a specific product (numberof kilograms of peaches, number of units of thesame car model, number of visits to thehairdresser, and so on), the procedure is morecomplex if we are examining an aggregate ofdifferent products: how do we add kilograms ofpeaches and visits to the hairdresser?1
Volumes at constant prices are based on data invalue terms for a base year (e.g., value of peachconsumption), updated by the volume growth ratefor each product (e.g., increase in consumption ofkilograms of peaches). The resulting volumes aresimply summed to obtain an aggregate. Themeasure called “volume” is thus a variableobtained by applying an earlier-period price to“elementary” volumes.
Until the results published on May 15, 2007, thiswas the system used in the French quarterlynational accounts, 2000 being the reference year.The method made it easy to compute sums ordifferences between aggregates and preserveaccounting identities at all aggregation levels.Here are two examples: (I) if we know theconsumption volumes for all goods and services,we can directly calculate total consumptionvolume by summing the two quantities; (II) involume terms, the method directly preserves theaccounting identity between the sum of supplycomponents (production + imports) and demandcomponents (consumption + investment +exports + changes in inventories).
However, the estimation of aggregates in volumeterms at constant prices has a disadvantage: ityields figures that may give an imperfect image ofeconomic reality when we are looking at a yearsome distance away from the base year. Thereason is that the relative weight of each product ina volume aggregate depends on the structure ofproduct prices observed in the base year. But theprice structure can change considerably over time.As a result, the greater the distance from the baseyear, the less each product’s relative weight in anaggregate is relevant to describing currenteconomic reality.
For example, “in 2000, household consumption”of sound and image receiving, recording, andreproduction equipment (“HiFi-TV” for short here)accounted for 0.8% of total consumptionexpenditures on goods and services, in bothvolume and value terms. Six years later,
consumption of these products more than tripled involume terms.2 By 2006, given the changes inother products, household consumption of HiFi-TVequipment accounted for 1.7% of their totalconsumption volume in constant prices. But as theprices of these devices had fallen by half since2000, their consumption represented only 0.9% ofthe total in value terms (if we rebased the accountsto 2006, 0.9% is thus the weight we would assign toconsumption of HiFi-TV equipment whendetermining consumption volume for 2007).
An alternative solution, therefore, is to replacevolume weights by the value weights observed in theprevious quarter or year. We adopted the secondapproach—based on volumes calculated atchain-linked prices—for French quarterly nationalaccounts starting with the results published on May15, 2007. There are different well-knowntechniques for chain-linking quarterly data. Wehave chosen the annual-overlap method,recommended by Eurostat and used by most EUMember States.
The new method provides a truer description ofeconomic changes. It involves aggregating the“elementary” volumes on the basis of the mostrecent price structure available—in our case, theprevious year’s. Chain-linking consists in choosinga reference year (essential for defining levels) andannually updating the structure of relative prices ofelementary series (number of kilograms of peaches,of cars, of visits to the hairdresser, and so on). Byconstructing volume series at chain-linked prices,we can therefore incorporate changes in theaggregates’ relative prices over time. Butchain-linking deprives us of the additivity propertyof the elementary series. Similarly, unlike historicalseries at constant prices, chain-linked prices do notpreserve the classic identity, mentioned earlier,between the sum of the economy’s sources (GDP +imports) and the sum of final uses (finalconsumption + investment + exports + changes ininventories). We need to shift to an interpretation interms of contributions of demand components toGDP growth.
The advantages and drawbacks of the alternativemethods for determining aggregates in volumeterms are summarized in Table 1.
The transition to chain-linked prices is thus aninvitation to analyze the changes in theinterpretation of macroeconomic series and in thetools used for short-term analysis.
10 Conjoncture in France
From constant prices to chain-linked prices: what consequences?
1. For some sophisticated products with fast-changingtechnical specifications, such as computers andautomobiles, we need to adjust volume for the change inproduct quality—not always a simple task.2. In the elementary series, volumes at constant prices areequal, whichever of the two concepts is used.

II - The switch to chain-linked pricesslightly modifies the analysis of therecent past
GDP growth differentials concentrated in theinitial quarters
In Q1 2007, French GDP rose 0.5% atchain-linked prices but 0.6% at constant prices, adifference of 0.1 points. The contribution ofhousehold consumption expenditures to growth is0.17 points smaller at chain-linked prices than atconstant prices. It is exactly offset by a 0.17-pointincrease in the contribution of external trade.Changes in inventories contributed 0.1 points tothe GDP growth differential.
The overall 0.1-point gap in GDP growth is notnegligible, particularly viewed against thedifferences calculated for the recent period: thequarterly differential over the past seven years(2000-2006) is a modest 0.03 points of growth onaverage. In the 1980s and 1990s, by contrast, thegaps are wider—in some exceptional cases, ashigh as 0.3-0.5 points (Chart 1).
A larger contribution from external trade, asmaller one from domestic demand
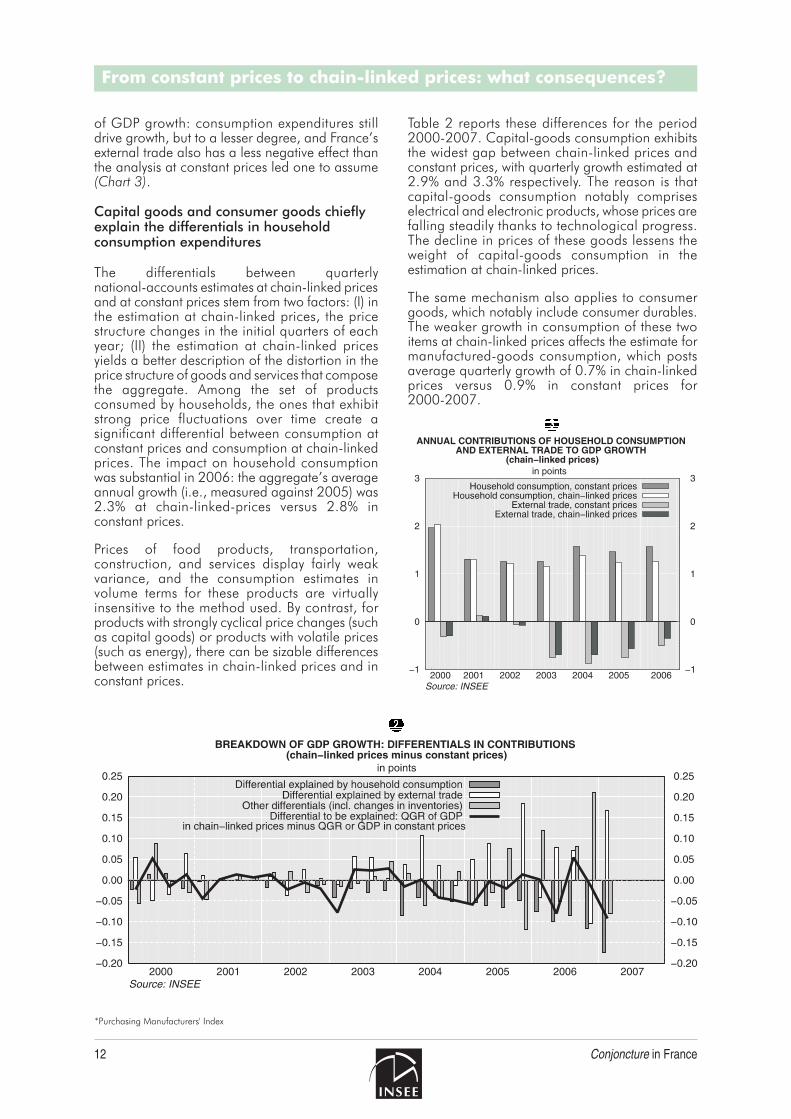
While the differentials for GDP growth are rathersmall, demand components are significantlyaffected by the switch to chain-linked prices, asshown in Chart 2. The gap between chain-linkedprices and constant prices represents thecontributions of the main GDP components to itsgrowth at chain-linked prices, net of contributionscomputed in constant prices.
We find substantial differences in the contributionsof household consumption and external trade inthe recent period: household consumptionexpenditures contribute less to GDP growth atchain-linked prices than at constant prices. Bycontrast, external trade explains a larger share ofGDP growth. For the other components, notablyinvestment, the impact of the transition tochain-linked prices is virtually negligible.
There is a sizable shift in the breakdown betweendomestic demand and external trade in the recentpast. The switch to chain-linked prices thereforesignificantly modifies the analysis of the breakdown
June 2007 11
From constant prices to chain-linked prices: what consequences?
Table 1Advantages and drawbacks of switch to chain-linked prices
Advantages Drawbacks
Additivity of elementary series, allowingeasy construction of aggregates andpreservation of accounting identities at theaggregate level, particularly suitable formacroeconomic modeling
Volumes at constantbase-year prices
Growth in aggregates economically lessrelevant, as it may be disrupted by sharpswings in relative prices of certainelementary products
Growth in aggregates economically morerelevant, being based on a price structureby product revised annually
Volumes at previous-yearchain-linked prices
Loss of additivity property of elementaryseries
Source: INSEE
of GDP growth: consumption expenditures stilldrive growth, but to a lesser degree, and France’sexternal trade also has a less negative effect thanthe analysis at constant prices led one to assume(Chart 3).
Capital goods and consumer goods chieflyexplain the differentials in householdconsumption expenditures
The differentials between quarterlynational-accounts estimates at chain-linked pricesand at constant prices stem from two factors: (I) inthe estimation at chain-linked prices, the pricestructure changes in the initial quarters of eachyear; (II) the estimation at chain-linked pricesyields a better description of the distortion in theprice structure of goods and services that composethe aggregate. Among the set of productsconsumed by households, the ones that exhibitstrong price fluctuations over time create asignificant differential between consumption atconstant prices and consumption at chain-linkedprices. The impact on household consumptionwas substantial in 2006: the aggregate’s averageannual growth (i.e., measured against 2005) was2.3% at chain-linked-prices versus 2.8% inconstant prices.
Prices of food products, transportation,construction, and services display fairly weakvariance, and the consumption estimates involume terms for these products are virtuallyinsensitive to the method used. By contrast, forproducts with strongly cyclical price changes (suchas capital goods) or products with volatile prices(such as energy), there can be sizable differencesbetween estimates in chain-linked prices and inconstant prices.
Table 2 reports these differences for the period2000-2007. Capital-goods consumption exhibitsthe widest gap between chain-linked prices andconstant prices, with quarterly growth estimated at2.9% and 3.3% respectively. The reason is thatcapital-goods consumption notably compriseselectrical and electronic products, whose prices arefalling steadily thanks to technological progress.The decline in prices of these goods lessens theweight of capital-goods consumption in theestimation at chain-linked prices.
The same mechanism also applies to consumergoods, which notably include consumer durables.The weaker growth in consumption of these twoitems at chain-linked prices affects the estimate formanufactured-goods consumption, which postsaverage quarterly growth of 0.7% in chain-linkedprices versus 0.9% in constant prices for2000-2007.
12 Conjoncture in France
From constant prices to chain-linked prices: what consequences?
*Purchasing Manufacturers' Index

Energy prices do not move in the same patterns asprices of consumer goods and equipment, but theirshort-term fluctuations, combined with changes inprice structure, generate differentials that can besignificant in certain quarters. For 2000-2007, wefind a total difference of 0.6 points in absolutevalue. All the other consumption items published atthis level of aggregation display very similarmovements in chain-linked and constant prices.
Another distinction between chain-linked-pricesand constant-prices methodologies is wellillustrated by household consumption ofmanufactured goods: the differentials widen as thedistance from the base year increases (Chart 4).For goods and services, the household-consumption growth differential betweenchain-linked prices and constant prices movedfrom positive before 2000 to zero in 2001 (byconstruction) to increasingly negative thereafter.
The gaps are typically somewhat wider in the earlyquarters, as the price structures are changed everyyear at that time.
Investment differentials are negligible
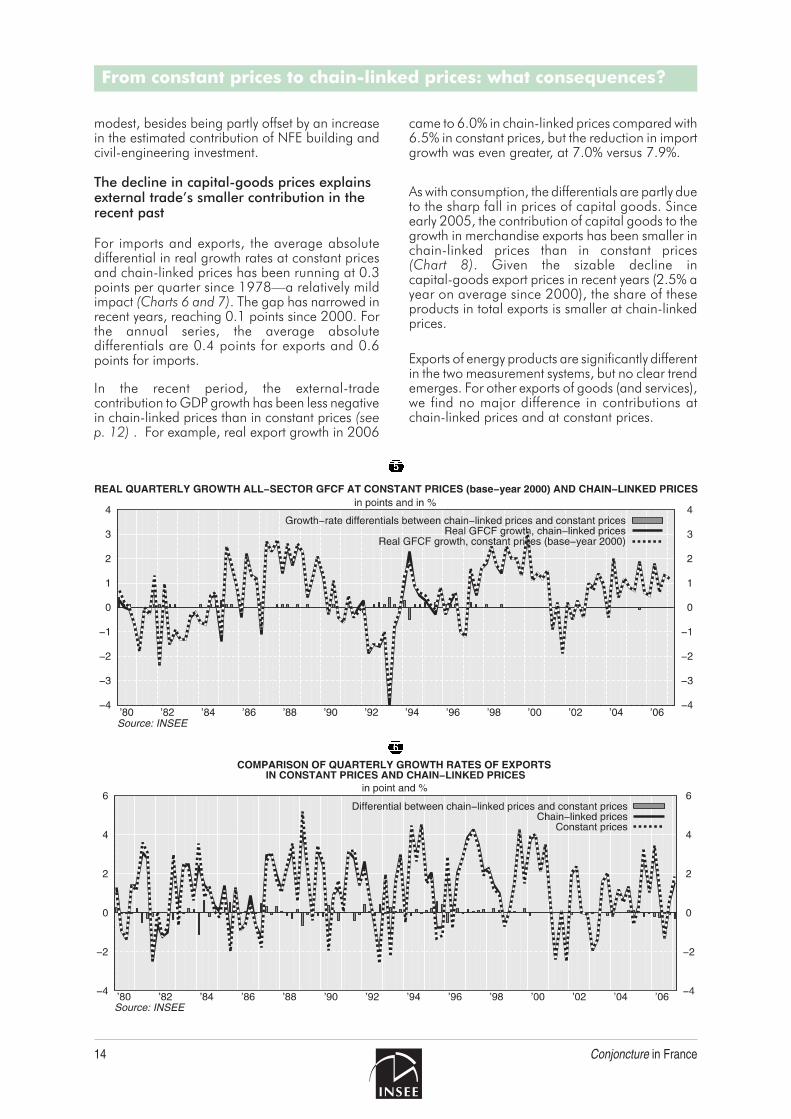
The switch to chain-linked prices barely modifiesthe measure of quarterly volume in the totaleconomy’s gross fixed capital formation (GFCF).In the recent period, the average differentialsbetween the two measures are negligible anddisplay no specific trend (Chart 5).
The breakdown of these minimal gaps by broadinstitutional sector fails to reveal any notablechanges. At most, the contribution of total GFCFby non-financial enterprises (NFEs) to GDP growthhas been mildly understated since 2005 whenmeasured in chain-linked prices. This reflects adecreased contribution of NFE investment incapital goods. However, the phenomenon is very
June 2007 13
From constant prices to chain-linked prices: what consequences?
Table 2Main differences between chain-linked prices and constant prices for household consumptionitems
For the period2000-2007
Quarterly trend atchain-linked
prices(percentage)
Quarterly trend atconstant
prices(percentage)
Averagedifferential
(percentage)
Maximumdifferential
(percentage)
Manufactured goods 0.7 0.9 -0.2 -0.5
of which Consumer goods 0.8 0.9 -0.1 -0.6
Automobiles 0.3 0.3 0.0 0.0
Capital goods 2.9 3.3 -0.4 -1.3
Intermediate goods 0.2 0.2 0.0 -0.1
Energy 0.0 0.0 0.0 -0.6
How to read this table: Between Q1 2000 and Q1 2007, household consumption of manufactured goods grew at an average quarterlypace of 0.7% in chain-linked prices and 0.9% in constant prices—a negative gap of 0.2 points for the new method. The quarterly growthrate of manufactured-goods consumption in chain-linked prices was up to 0.5 points (in absolute value) below the figure estimated atconstant prices.
Source: INSEE
modest, besides being partly offset by an increasein the estimated contribution of NFE building andcivil-engineering investment.
The decline in capital-goods prices explainsexternal trade’s smaller contribution in therecent past
For imports and exports, the average absolutedifferential in real growth rates at constant pricesand chain-linked prices has been running at 0.3points per quarter since 1978—a relatively mildimpact (Charts 6 and 7). The gap has narrowed inrecent years, reaching 0.1 points since 2000. Forthe annual series, the average absolutedifferentials are 0.4 points for exports and 0.6points for imports.
In the recent period, the external-tradecontribution to GDP growth has been less negativein chain-linked prices than in constant prices (seep. 12) . For example, real export growth in 2006
came to 6.0% in chain-linked prices compared with6.5% in constant prices, but the reduction in importgrowth was even greater, at 7.0% versus 7.9%.
As with consumption, the differentials are partly dueto the sharp fall in prices of capital goods. Sinceearly 2005, the contribution of capital goods to thegrowth in merchandise exports has been smaller inchain-linked prices than in constant prices(Chart 8). Given the sizable decline incapital-goods export prices in recent years (2.5% ayear on average since 2000), the share of theseproducts in total exports is smaller at chain-linkedprices.
Exports of energy products are significantly differentin the two measurement systems, but no clear trendemerges. For other exports of goods (and services),we find no major difference in contributions atchain-linked prices and at constant prices.
14 Conjoncture in France
From constant prices to chain-linked prices: what consequences?

As with exports, the lesser growth of imports inchain-linked prices is largely due to the weakercontribution of capital goods. Indeed, thecontribution differential is even more negative forimports than for exports (Chart 9). This gap reflectsthe downtrend in prices of importedhigh-technology products such as computers andcellphones.
The differential in energy-product contributions issignificant in the period 1978-2006—averaging0.3 points in absolute value—but has fallensubstantially in the recent period. For otherimports, the contribution differentials arenegligible, ranging between 0.01 and 0.04 points.
III - Consequences of the switchto chain-linked priceson forecasting tools
The conversion of the quarterly national accountsand “Conjoncture in France” to chain-linked pricesrequires us to re-estimate our forecasting tools onthe chain-linked series. One of the main tools iseconometric estimation using short-term indicators.For this, we construct equations based onbusiness-trend and household-confidence surveys.The aim is to extract the maximum amount of“leading information” so that we can forecastquarterly aggregates such as GDP and householdconsumption.
The following analysis assesses the impact of theswitch to chain-linked prices on estimation quality.The main results are set out in Table 3. To makethem easier to read, we begin by presenting theoverall results, indicating whether the conversion tochain-linked prices has had an influence or not.
June 2007 15
From constant prices to chain-linked prices: what consequences?

We then give a fuller description of the modelsexhibiting differences between chain-linked pricesand constant prices.
There is a wide choice of criteria for assessingestimation quality. We have selected RMSE (RootMean Square Error), which—as its nameimplies—measures the mean forecasting error. Alow RMSE, particularly with respect to the standarddeviation of the variable to be explained, denotesthat the model possesses a good explanatoryquality.
( )RMSEN
Actual Estimated= −⎡⎣⎢
⎤⎦⎥
1 212
* ,
where N is the number of data points in theestimation period
Most of the estimates in constant prices remainvalid in chain-linked prices: with some exceptions,there is no need to rewrite the model specificationor introduce new determinants or remove existingones. The coefficients associated with thedeterminants are very close or even, in somecases, identical. The residuals—that is, thedifferences between the modeled variable and itsestimate—display nearly identical profiles. In sum,the switch to chain-linked prices has not had a verysignificant impact on the tools currently used atINSEE.
There is nothing surprising about this conclusion,given the great similarity in growth rates atchain-linked prices and constant prices for most ofthe variables studied. In fact, the example ofhousehold consumption shows that surveyvariables and quantitative short-term indicatorsare more in sync with chain-linked price series thanwith constant-price series.
In the following section, we comment on theestimations that have been slightly altered by theswitch to chain-linked prices.
Few changes in the estimation of householdconsumption of manufactured goods
The estimation used to forecast quarterly growth inhousehold consumption of manufactured goods(written QGR consump) relies on (1) data from themonthly survey of the situation and outlook in theretail trade (balance of opinion on expectedworkforce, written EXPWF) and (2) the statisticaloverhang for growth in household consumptionexpenditures on manufactured goods in the firstmonth of the quarter (written OVHNG).
For each estimate, the corresponding coefficients inconstant prices are shown in parentheses under thecoefficients at chain-linked prices. The estimationof the equation in chain-linked prices (inparentheses: in constant prices) gives the followingresults:
QGR consump in quarter q = 0.95(0.94)
- 0.25 * QGR consump in quarter q-1(- 0.26)
- 0.15 * QGR consump in quarter q-3(0.15)
- 0.26 * QGR consump in quarter q-4(- 0.25)
+ 0.67 * OVHNG(0.66)
+ 0.11 * EXPWF(0.12)
RMSE = 0.77 (0.73)
16 Conjoncture in France
From constant prices to chain-linked prices: what consequences?

Judging from the RMSE, the model in chain-linkedprices seems slightly inferior in quality. However, ifwe look at the end-of-period residuals, it displays abetter forecasting performance in the recent period(Chart 10). This is shown by the residuals of theconstant-prices model, which have beenconsistently positive since 2006. In the recentperiod, the model provides a better fit withhousehold consumption when chain-linked pricesare used. This is hardly surprising, as householdconsumption is lower at chain-linked prices than inconstant prices at the end of the period owing tothe fuller inclusion of the fall in prices of ICTs(information and communications technologies).
The estimation of total GFCF is less sensitiveto interest-rate movements
The estimated quarterly growth rate of total GFCFby NFEs is explained by the following three factors:
● The quarterly-revisions indicator (REVISION)drawn from INSEE’s Industrial Investment Survey.This supplies a robust estimate of the revision ininvestment projects for all manufacturingindustries between two successive surveys.
● The capacity utilization rate (CUR) obtainedfrom the Bank of France’s monthly businesssurvey. A rise in this indicator denotes tension inthe production system.
● The nominal 10-year interest rate, deflated bythe year-on-year change in producer prices forall goods and services.
Parameters estimated for the period1992Q2-2005Q4 at chain-linked prices(in parentheses: at constant prices):
Total GFCF in quarter q-1 =
0.89 REVISION in quarter q(0.85)
+ 0.39 REVISION in q-1(0.41)
+ 0.26 acceleration of CUR in q-1(0.25)
- 0.36 first difference in real interest rate in q-3(-0.45)
RMSE = 0.96 (0.96)
The model’s overall estimation quality is notaffected by the transition to chain-linked prices.The RMSE remains identical (Table 3). In the periodoutside the estimation —that is, since Q1 2006—the residuals sequence does not indicate a majorchange either (Chart 11).
June 2007 17
From constant prices to chain-linked prices: what consequences?
Table 3Impact of switch to chain-linked prices on quality of econometric-equation estimate
Variable to beexplained
Standard deviation RMSE (root mean squared error) Impact of switchto chain-linked
pricesConstant prices Chain-linkedprices Constant prices Chain-linked
prices
Gross domesticproduct
0.42 0.43 0.22 0.23 No impact
Manufacturingoutput
1.37 1.38 0.80 0.81 No impact
Householdconsumptionexpenditures onmanufacturedgoods
1.54 1.56 0.73 0.77Estimation ofchain-linked
prices better inrecent period
Total gross fixedcapital formationby NFEs
1.62 1.60 0.96 0.96 No impact
Gross fixed capitalformation by NFEsin manufacturedgoods
2.00 2.05 1.20 1.33Estimation ofchain-linked
prices slightly in-ferior
Manufacturedexports
2.49 2.39 1.87 1.79Change of
specificationneeded
Manufacturedimports
2.27 2.28 1.52 1.50 No impact
Source: INSEE

All the estimated parameters remain significantand the values taken are very similar, except forthat of the interest rate. Estimated investment nowseems slightly less sensitive to interest rates inchain-linked prices.
The estimation of GFCF in manufacturedgoods shows a slight quality loss and is alsoless sensitive to the interest rate
To explain quarterly growth of GFCF inmanufactured goods (GFCFMFG), we use thesame type of regressors as in the estimation of totalGFCF, plus actual growth of GFCF inmanufactured goods two quarters previously.
Parameters estimated for the period1992Q1-2005Q4 at chain-linked prices(in parentheses: at constant prices):
GFCFMFG in quarter q =
0.38 GFCFMFG in q-2(0.41)
+ 0.62 REVISION in q(0.57)
+ 0.68 first difference of CUR in q(0.69)
- 0.43 first difference of real interest rate in q-2(- 0.54)
RMSE = 1.33 (1.20)
The quality of the estimate of GFCF in
18 Conjoncture in France
From constant prices to chain-linked prices: what consequences?

manufactured goods has deteriorated slightly withthe switch to chain-linked prices. Admittedly, thevariance of GFCF in manufactured goods is alsosomewhat greater in the estimation period, risingfrom 2.00 to 2.05. This worsening of theestimation is reflected in the slightly higherresiduals for chain-linked prices (Chart 12). Themodel’s tendency to mildly overstate actual valuesin constant prices in the recent period is thussomewhat aggravated.
However, all the estimated parameters remainsignificant and their values are close. The soleexception is interest rates. The response of GFCF inmanufactured goods to interest rates diminisheswith chain-linked prices, as does that of total GFCF.
No meaningful impact on the estimation ofmanufactured exports
The estimation of the quarterly growth inmanufactured exports uses data from the monthlybusiness survey in industry (i.e., essentiallymanufacturing), monthly customs data (nominal),and the real effective exchange rate.
The estimation of the equation in chain-linkedprices (in parentheses: at constant prices) for theperiod 1992Q3-2005Q4 yields the followingresults:
EXP(q) = 0.013 + 0.25* EXP_CUSTOMS (q-1)(0.015) (0.56)
+ 0.001* OPFO _1(q-1)(0.001)
+ 0.001* OPFO _2(q-1)(0.001)
- 0.64*REER _1(q)
- 0.54*REER _1(q-1)(0.61)
- 0.61*REER _3(q-1)(0.79)
RMSE = 1.79 (1.87)
Notations:
EXP(q): real quarterly growth of manufacturedexports at chain-linked prices (quarter q)
EXP_CUSTOMS (q): nominal quarterly growth ofmanufactured exports goods, from customssources (quarter q)
OPFO_i (q): monthly first difference of foreignorders (balance of opinion from INSEE IndustrySurvey) in month i of quarter q
REER_i(q): monthly growth in France’s real effectiveexchange rate in month i of quarter q.
The shift to chain-linked prices does not seem tohave affected the quality of the estimation ofmanufactured exports (Table 3). The slight declinein RMSE should be viewed in conjunction with thedecrease in the standard deviation of the series atchain-linked prices (2.4 versus 2.5 for the series inconstant prices).
By contrast, the switch to chain-linked prices hassignificantly impacted the model’s determinants aswell as their coefficients: for example, EXP(q-1),which was present in the constant-prices model, isabsent from the model in chain-linked prices.Conversely, the current exchange rate REER_1(q)appears in the equation in chain-linked prices. Atthe same time, the growth in manufactured exportsis less sensitive to the lagged variablesREER_1(q-1) and REER_3(q-1). On balance,however, the real effective exchange rate has asimilar influence on manufactured exports in bothmodels.
June 2007 19
From constant prices to chain-linked prices: what consequences?

20 Conjoncture in France
From constant prices to chain-linked prices: what consequences?