from cameron street to wayne avenue street from cameron street to wayne avenue ... and the whole...
TRANSCRIPT
Pedestrian Road Safety Audit
Fenton Street From Cameron Street to Wayne Avenue
December 2014
Montgomery County
Department of Transportation
Fenton Street Pedestrian Road Safety Audit
Table of Contents i
Table of Contents
1. Introduction ............................................................................................................................................................... 1
1.1 Objective ........................................................................................................................................................... 1
1.2 Background ........................................................................................................................................................ 1
1.3 Organization of the Report ................................................................................................................................ 3
1.4 Existing Conditions ............................................................................................................................................ 4
2. Road Safety Audit Findings ...................................................................................................................................... 14
2.1 Safety Benefitys of Existing Roadway Features ............................................................................................... 14
2.2 Observed Issues, Contributing Factors, and Opportunities for Improvements .............................................. 16
2.3 Summary of Issues and Suggestions ................................................................................................................ 22
List of Figures
Figure 1: Study Area ...................................................................................................................................................... 2
Figure 2: Study Area Peak Hour Lane Geometry ........................................................................................................... 5
Figure 3: Study Area Bus Ridership ................................................................................................................................ 8
Figure 4: Pedestrian Crashes on Fenton Street between Cameron Street and Wayne Avenue 2007 – 2012 ............. 10
Figure 5: Study Area Crash Frequency 2007 – 2012 .................................................................................................... 11
Figure 6: Pedestrian Crashes by Crash Severity 2007 – 2012 ...................................................................................... 11
Figure 7: Vehicle Movement Prior to Pedestrian Crash 2007 – 2012 .......................................................................... 12
Figure 8: Pedestrian Movement Prior to Pedestrian Crash 2007 – 2012 .................................................................... 12
Figure 9: Pedestrian Crashes by Age 2007 - 2012........................................................................................................ 13
Figure 10: Pedestrian Crashes by Illumination 2007 - 2012 ........................................................................................ 13
Figure 11: Pedestrian Crashes by Road Surface Conditions 2007 - 2012 .................................................................... 14
Figure 12: Pedestrian-Vehicle Conflicts ...................................................................................................................... 16
Figure 13: Uncontrolled Midblock Crossings .............................................................................................................. 17
Figure 14: Limited Pedestrian Compliance with Signals ............................................................................................. 18
Figure 15: Pedestrian Facility Limitations ................................................................................................................... 19
Figure 16: Drainage Conditions................................................................................................................................... 20
Figure 17: Maintenance Issues ................................................................................................................................... 21
List of Tables
Table 1: 2012 AADT ....................................................................................................................................................... 7
Table 2: Traffic Count Data ............................................................................................................................................ 7
Fenton Street Pedestrian Road Safety Audit
1 | P a g e
1. Introduction
1.1 Objective The objective of this study was to complete a Pedestrian Road Safety Audit (PRSA) for Fenton
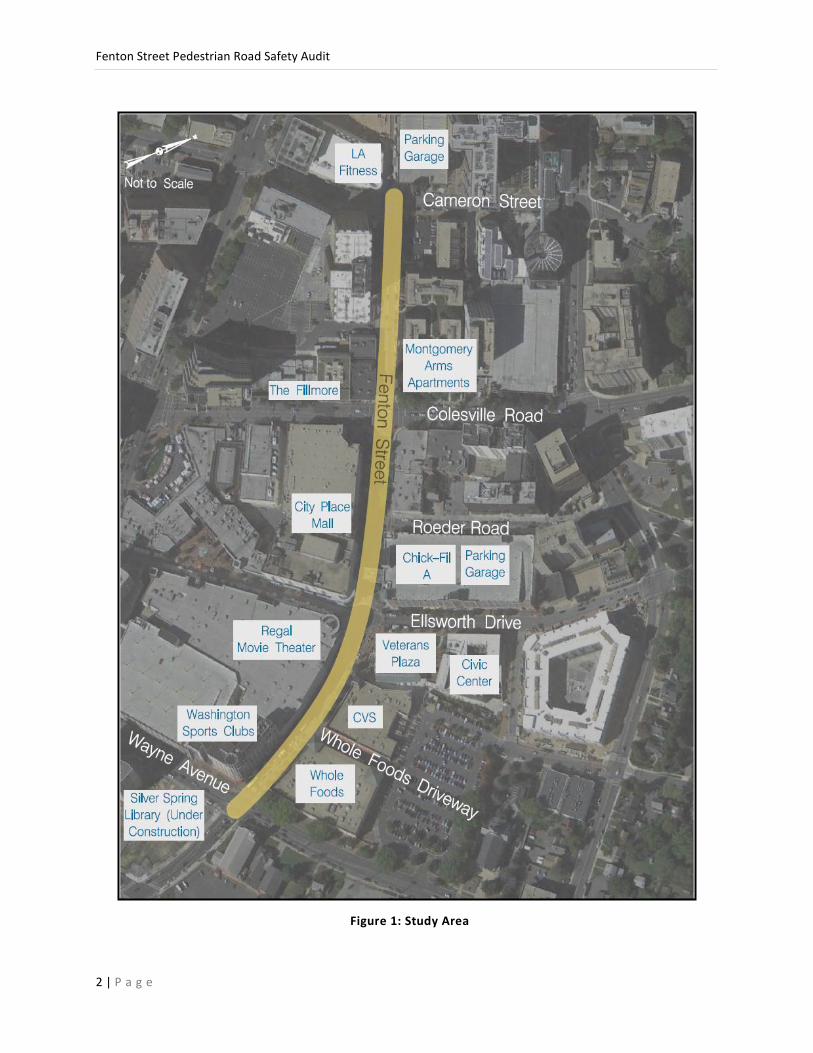
Street between Cameron Street and Wayne Avenue in Silver Spring, Maryland. The study limits
are shown in Figure 1. The corridor was selected for a PRSA based on its inclusion on
Montgomery County Department of Transportation’s (MCDOT) list of High Incidence Areas
(HIA), and the audit was conducted to identify safety issues related to pedestrian and bicycle
safety in the study area. As a result of the audit, the PRSA team has identified a variety of issues
related to pedestrian and bicycle safety and developed a number of suggestions to improve
overall safety in the audit area.
1.2 Background
The study area is an approximately 0.32 mile segment of Fenton Street located in a high-activity
zone in downtown Silver Spring supporting multiple land uses, including a mixture of retail and
residential uses. For the purpose of this report, Fenton Street is assumed to run east-west, and
all references to direction are consistent with this assumption. Fenton Street is an undivided
roadway, with street parking in both directions between Cameron Street and Colesville Road
and in the westbound direction between Ellsworth Drive and Wayne Avenue. The roadway
section varies from two to four lanes. The study area includes four signalized intersections, at
Cameron Street, Colesville Road, Ellsworth Drive, and Wayne Avenue, and two unsignalized
intersections at Roeder Road and the Whole Foods Driveway. The study area experiences
significant pedestrian activity, generated by the adjacent commercial and residential land uses
as well as the proximity to public transit.
The Fenton Street study area was identified as an HIA for pedestrian-related crashes, as part of
the Montgomery County Executives’ pedestrian safety initiative. Based on crash data provided
by MCDOT and the Maryland State Highway Administration (MDSHA), 21 pedestrian crashes
occurred during the study period of January 2007 through December 2012. The purpose of this
PRSA is to identify safety issues that may be contributing to the observed pedestrian crashes in
the study area.
The PRSA was performed on October 8 and October 10, 2013 during daytime and nighttime
hours. The PRSA team consisted of seven members with expertise in pedestrian and bicycle
safety and traffic engineering representing:
MCDOT,
MDSHA,
Arlington County Division of Transportation, and
STV Incorporated, the PRSA consultant.
Fenton Street Pedestrian Road Safety Audit
2 | P a g e
Figure 1: Study Area

Fenton Street Pedestrian Road Safety Audit
3 | P a g e
1.3 Organization of the Report This report first presents a description of the existing geometric, operational and safety conditions for the
study area based on field reviews and available data. Next, the report details the existing conditions and
general issues throughout the corridor identified by the PRSA team. Finally, the report presents
suggestions for pedestrian safety improvements based on the issues identified throughout the corridor.
This report has served as a resource to MDSHA and MCDOT, as well as other stakeholders, for
implementing pedestrian safety improvements within the audit area. There has been an ongoing vetting
of the suggestions and recommendations in this report with collaboration among agencies and
stakeholders to implement short- and intermediate-term recommendations and to assess the feasibility
and constructability of long-term projects. Ultimately, as a result of this process, a range of pedestrian
safety recommendations will be implemented.
Fenton Street Pedestrian Road Safety Audit
Page | 4
1.4 Existing Conditions
1.4.1 Site Characteristics
The study area along Fenton Street ranges from a two lane to four lane undivided minor arterial roadway,
with street parking in both directions between Cameron Street and Colesville Road and in the westbound
direction between Ellsworth Drive and Wayne Avenue. The posted speed limit on Fenton Street is 25
miles per hour throughout the study area. The lane geometry throughout the corridor is shown in Figure
2. The study area includes four signalized intersections:
Fenton Street at Cameron Street,
Fenton Street at Colesville Road,
Fenton Street at Ellsworth Drive, and
Fenton Street at Wayne Avenue.
Two unsignalized intersections are also included within the study area:
Fenton Street at Roeder Road, and
Fenton Street at the Whole Foods Driveway.
Fenton Street offers a number of pedestrian accommodations including sidewalks, which are present
along both sides of Fenton Street throughout the study area. Marked crosswalks are provided at each of
the study intersections; however, the west leg of the intersection of Fenton Street at Cameron Street and
the north leg of the intersection of Fenton Street at the Whole Foods Driveway do not have marked
crosswalks. Accessible pedestrian signals are provided at each of the signalized intersections. The
roadways intersecting Fenton Street at the study intersections are summarized below:
Cameron Street
Three-lane local roadway that services downtown Silver Spring and runs in the north-south
direction
Approximately 0.35 miles long and extends from 2nd
Avenue to just north of Spring Street
Consists of a dedicated left-turn lane and a shared through/right-turn lane in the north- and
southbound approaches at Fenton Street
The northwest corner includes a public parking garage entrance
On-street parking is provided in both directions

Fenton Street Pedestrian Road Safety Audit
Page | 5
Figure 2: Study Area Peak Hour Lane Geometry

Fenton Street Pedestrian Road Safety Audit
Page | 6
Colesville Road
Six-lane roadway that runs in the north-south direction
Also known as US 29, it connects Washington, D.C. to I-70, west of Baltimore, Maryland
Consists of three travel lanes in both the north- and southbound directions during off-peak hours
All turns are from shared lanes with the exception of the northbound left turn, which is restricted
during the PM peak period
Controlled by a reversible lane system to provide additional lane capacity for traffic traveling in
the direction of the heaviest travel during the peak periods, southbound during the AM peak and
northbound during the PM peak
The southbound approach at Fenton Street consists of four through lanes during the AM peak
hour and two through lanes during the PM peak hour
The northbound approach at Fenton Street consists of two through lanes during the AM peak
hour and four through lanes during the PM peak hour
The northbound approach consists of three dedicated through lanes and a shared through/right-
turn lane during the PM peak hour.
Roader Road
Two-lane local roadway that serves downtown Silver Spring and runs in the north-south direction
Approximately 0.12 miles long and connects Fenton Street to Spring Street
Consists of a single shared left/right-turn lane in the southbound direction
On-street parking is provided in both directions
Ellsworth Drive
Two-lane local roadway that serves downtown Silver Spring and runs in the north-south direction
Consists of a shared through/right/left-turn lane and on-street parking in both directions in the
southbound direction
Consists of a shared through/right/left-turn lane in the northbound direction
The northbound approach is often closed to vehicles during the weekday lunch period and during
special events held on weekends
Whole Foods Driveway
One-way, two-lane roadway that runs in the southbound direction
Originates at the Whole Foods parking lot and extends to Fenton Street
Consists of a dedicated left-turn lane and a dedicated right-turn lane in the southbound direction
Fenton Street Pedestrian Road Safety Audit
Page | 7
Wayne Avenue
Five-lane local roadway that serves Silver Spring and runs in the north-south direction
Consists of one dedicated left-turn lane, one through lane, and a shared through/right-turn lane
in the southbound direction
Consists of a two-way left-turn lane, one through lane, and a shared through/right-turn lane in
the northbound direction
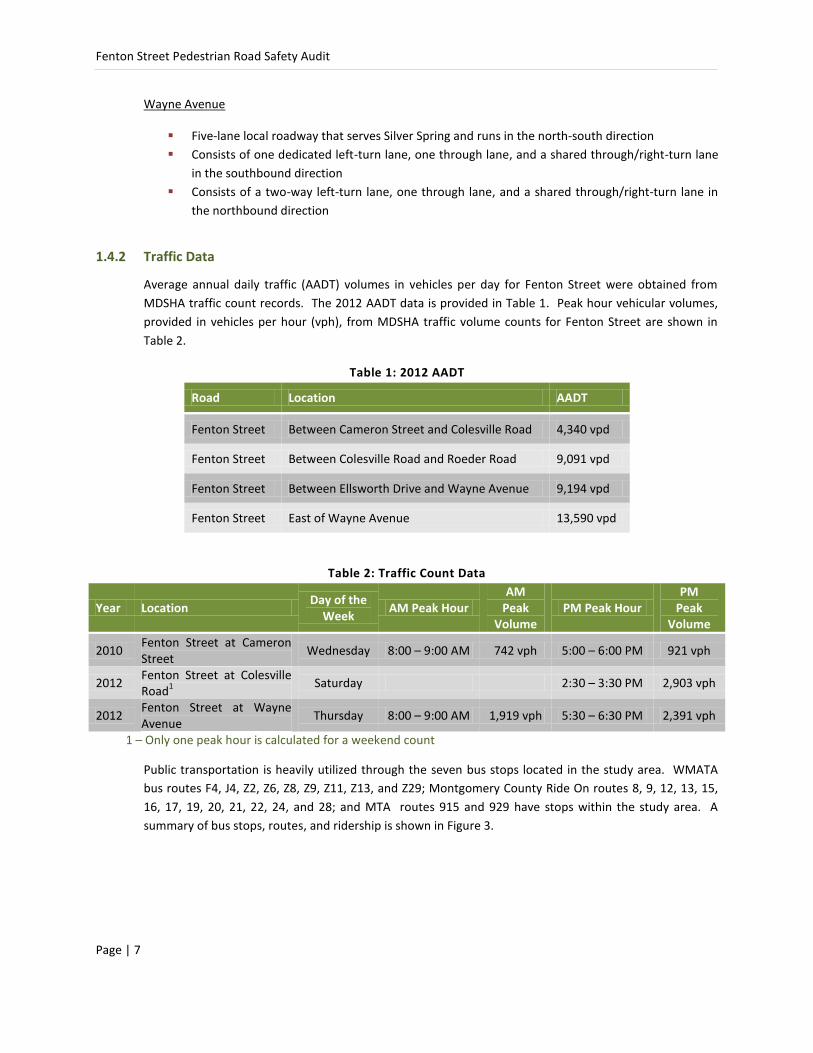
1.4.2 Traffic Data
Average annual daily traffic (AADT) volumes in vehicles per day for Fenton Street were obtained from
MDSHA traffic count records. The 2012 AADT data is provided in Table 1. Peak hour vehicular volumes,
provided in vehicles per hour (vph), from MDSHA traffic volume counts for Fenton Street are shown in
Table 2.
Table 1: 2012 AADT
Road Location AADT
Fenton Street Between Cameron Street and Colesville Road 4,340 vpd
Fenton Street Between Colesville Road and Roeder Road 9,091 vpd
Fenton Street Between Ellsworth Drive and Wayne Avenue 9,194 vpd
Fenton Street East of Wayne Avenue 13,590 vpd
Table 2: Traffic Count Data
Year Location Day of the
Week AM Peak Hour
AM Peak
Volume PM Peak Hour
PM Peak
Volume
2010 Fenton Street at Cameron Street
Wednesday 8:00 – 9:00 AM 742 vph 5:00 – 6:00 PM 921 vph
2012 Fenton Street at Colesville Road
1 Saturday 2:30 – 3:30 PM 2,903 vph
2012 Fenton Street at Wayne Avenue
Thursday 8:00 – 9:00 AM 1,919 vph 5:30 – 6:30 PM 2,391 vph
1 – Only one peak hour is calculated for a weekend count
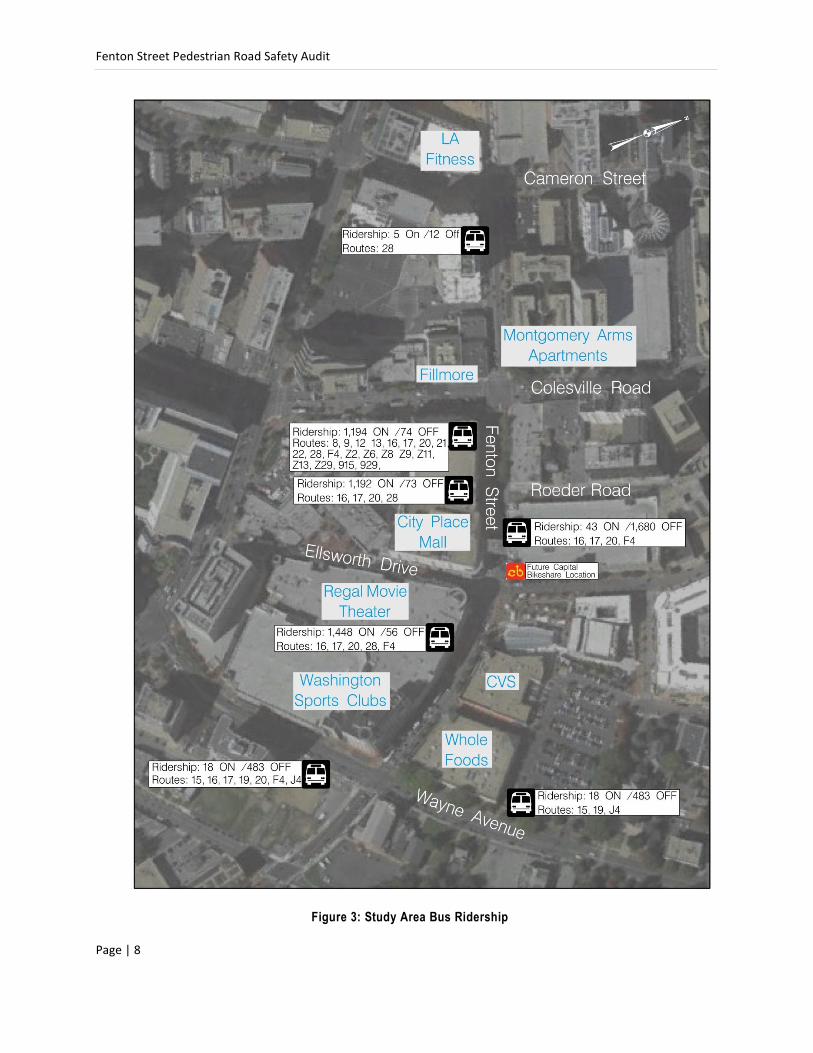
Public transportation is heavily utilized through the seven bus stops located in the study area. WMATA
bus routes F4, J4, Z2, Z6, Z8, Z9, Z11, Z13, and Z29; Montgomery County Ride On routes 8, 9, 12, 13, 15,
16, 17, 19, 20, 21, 22, 24, and 28; and MTA routes 915 and 929 have stops within the study area. A
summary of bus stops, routes, and ridership is shown in Figure 3.
Fenton Street Pedestrian Road Safety Audit
Page | 8
Figure 3: Study Area Bus Ridership
Fenton Street Pedestrian Road Safety Audit
Page | 9
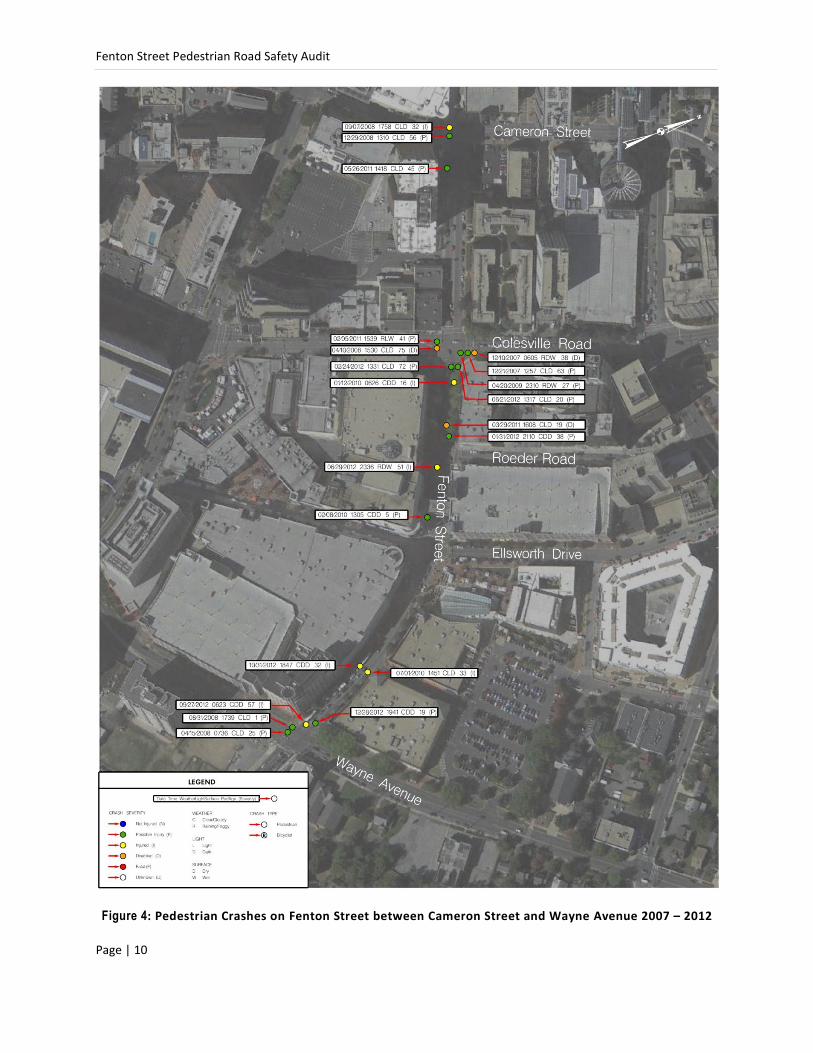
1.4.3 Crash Data
The PRSA team reviewed all crash records collected by Montgomery County Police in the study area
during the study period from 2007 through 2012 to identify the location of all reported pedestrian and
bicyclist crashes within the corridor. Figure 4 summarizes the location, date, time, severity, type, and
ambient conditions of each reported pedestrian and bicyclist crash. As shown in Figure 5, 21 pedestrian-
related crashes occurred during the study period. Zero crashes involving bicyclists were reported during
the study period.
Fenton Street Pedestrian Road Safety Audit
Page | 10
Figure 4: Pedestrian Crashes on Fenton Street between Cameron Street and Wayne Avenue 2007 – 2012

Fenton Street Pedestrian Road Safety Audit
Page | 11
Figure 5: Study Area Crash Frequency 2007 – 2012
Crash data indicates that of the 21 pedestrian crashes, all resulted in injuries or possible injuries, as shown
in Figure 6. Although there were no pedestrian fatalities, three crashes resulted in disabling injuries, six
crashes resulted in non-incapacitating injuries, and 12 crashes resulted in possible injuries.
Figure 6: Pedestrian Crashes by Crash Severity 2007 – 2012
0
5
10
15
20
25
30
35
40
Pedestrian Crashes
Vehicle Crashes
2007 2008 2009 2010 2011 2012* Vehicle Crash Listing not provided for 2012.
Possible Injury, 12, 57%
Injured, 6, 29%
Disabled, 3, 14%
Fenton Street Pedestrian Road Safety Audit
Page | 12
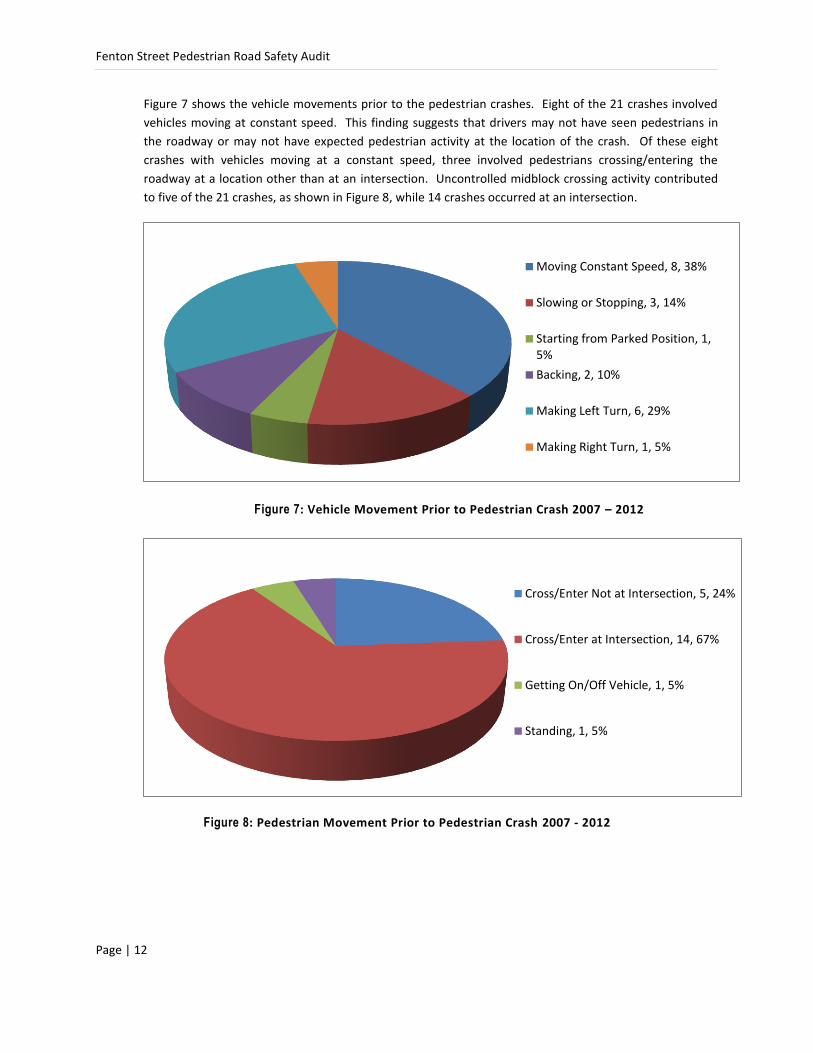
Figure 7 shows the vehicle movements prior to the pedestrian crashes. Eight of the 21 crashes involved
vehicles moving at constant speed. This finding suggests that drivers may not have seen pedestrians in
the roadway or may not have expected pedestrian activity at the location of the crash. Of these eight
crashes with vehicles moving at a constant speed, three involved pedestrians crossing/entering the
roadway at a location other than at an intersection. Uncontrolled midblock crossing activity contributed
to five of the 21 crashes, as shown in Figure 8, while 14 crashes occurred at an intersection.
Figure 7: Vehicle Movement Prior to Pedestrian Crash 2007 – 2012
Figure 8: Pedestrian Movement Prior to Pedestrian Crash 2007 - 2012
Moving Constant Speed, 8, 38%
Slowing or Stopping, 3, 14%
Starting from Parked Position, 1, 5%
Backing, 2, 10%
Making Left Turn, 6, 29%
Making Right Turn, 1, 5%
Cross/Enter Not at Intersection, 5, 24%
Cross/Enter at Intersection, 14, 67%
Getting On/Off Vehicle, 1, 5%
Standing, 1, 5%
Fenton Street Pedestrian Road Safety Audit
Page | 13
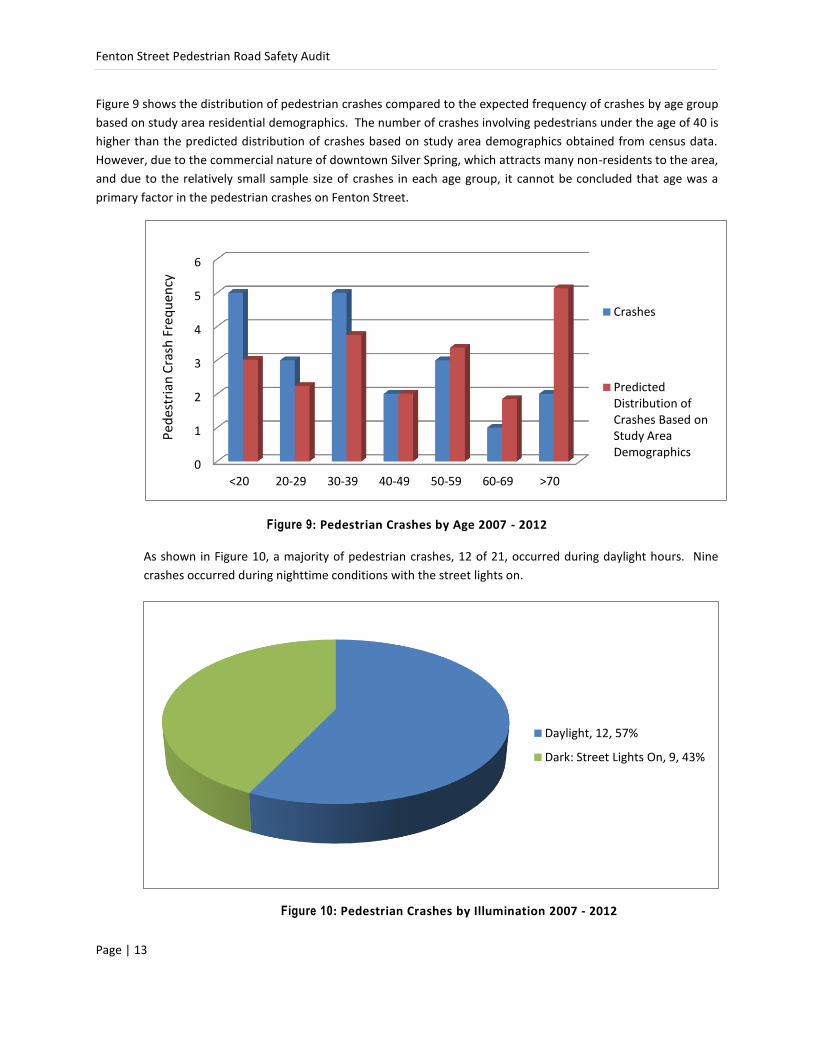
Figure 9 shows the distribution of pedestrian crashes compared to the expected frequency of crashes by age group
based on study area residential demographics. The number of crashes involving pedestrians under the age of 40 is
higher than the predicted distribution of crashes based on study area demographics obtained from census data.
However, due to the commercial nature of downtown Silver Spring, which attracts many non-residents to the area,
and due to the relatively small sample size of crashes in each age group, it cannot be concluded that age was a
primary factor in the pedestrian crashes on Fenton Street.
Figure 9: Pedestrian Crashes by Age 2007 - 2012
As shown in Figure 10, a majority of pedestrian crashes, 12 of 21, occurred during daylight hours. Nine
crashes occurred during nighttime conditions with the street lights on.
Figure 10: Pedestrian Crashes by Illumination 2007 - 2012
0
1
2
3
4
5
6
<20 20-29 30-39 40-49 50-59 60-69 >70
Crashes
Predicted Distribution of Crashes Based on Study Area Demographics
Ped
estr
ian
Cra
sh F
req
uen
cy
Daylight, 12, 57%
Dark: Street Lights On, 9, 43%
Fenton Street Pedestrian Road Safety Audit
Page | 14
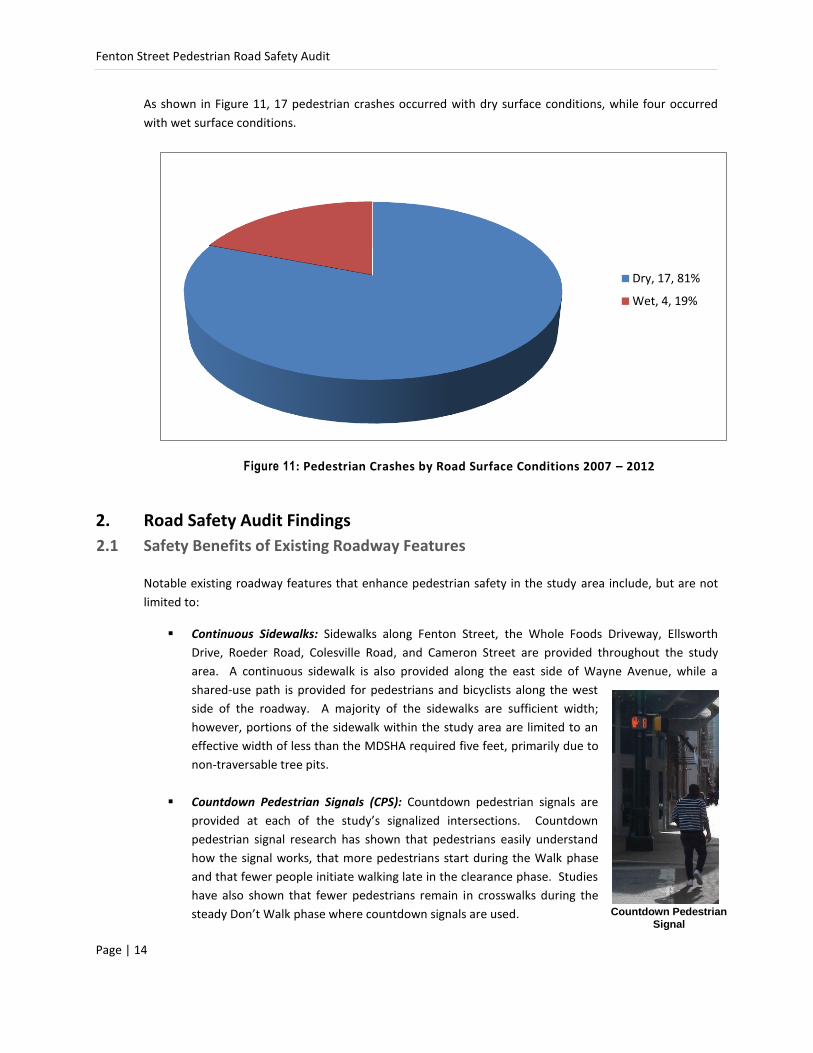
As shown in Figure 11, 17 pedestrian crashes occurred with dry surface conditions, while four occurred
with wet surface conditions.
Figure 11: Pedestrian Crashes by Road Surface Conditions 2007 – 2012
2. Road Safety Audit Findings
2.1 Safety Benefits of Existing Roadway Features
Notable existing roadway features that enhance pedestrian safety in the study area include, but are not
limited to:
Continuous Sidewalks: Sidewalks along Fenton Street, the Whole Foods Driveway, Ellsworth
Drive, Roeder Road, Colesville Road, and Cameron Street are provided throughout the study
area. A continuous sidewalk is also provided along the east side of Wayne Avenue, while a
shared-use path is provided for pedestrians and bicyclists along the west
side of the roadway. A majority of the sidewalks are sufficient width;
however, portions of the sidewalk within the study area are limited to an
effective width of less than the MDSHA required five feet, primarily due to
non-traversable tree pits.
Countdown Pedestrian Signals (CPS): Countdown pedestrian signals are
provided at each of the study’s signalized intersections. Countdown
pedestrian signal research has shown that pedestrians easily understand
how the signal works, that more pedestrians start during the Walk phase
and that fewer people initiate walking late in the clearance phase. Studies
have also shown that fewer pedestrians remain in crosswalks during the
steady Don’t Walk phase where countdown signals are used.
Dry, 17, 81%
Wet, 4, 19%
Countdown Pedestrian
Signal

Fenton Street Pedestrian Road Safety Audit
Page | 15
Pedestrian Bridge
Fencing to Deter Midblock
Crossing
Accessible Pedestrian Signals (APS): Accessible pedestrian signals are provided at each of the
study area’s signalized intersections. Accessible pedestrian signals provide direction through
audible and tactile signals which help pedestrians with hearing and visual impairments to cross
the street safety.
Right Turn on Red (RTOR) Restrictions: Within the study area,
RTOR restrictions have been implemented at each of the
signalized intersections. Research suggests allowing RTOR
movements at intersections increases the risk for pedestrian
crashes.
Pedestrian Connections to Private Properties: A pedestrian
access bridge is provided midblock between Ellsworth Drive
and Roeder Road. The bridge crosses Fenton Street and
connects the City Place Mall to the Town Square Garage.
Pedestrian Signage: Pedestrian crossing and advance pedestrian crossing signs are located along
east- and westbound Fenton Street leading to the unsignalized pedestrian crossings at Roeder
Road and Whole Foods Driveway.
Non-traversable Features: Fencing has been installed along the
south side of Fenton Street, between Ellsworth Drive and the
Whole Foods Driveway, to deter pedestrians from crossing
Fenton Street at a midblock location. This fencing encourages
pedestrians to cross Fenton Street at the marked crosswalks at
either Ellsworth Drive or Whole Foods Driveway.
Red Light Camera: A camera has been installed at the intersection
of Fenton Street at Colesville Road to record vehicles violating the red light traffic signal
indications on the southbound approach of Colesville Road. Red light violation cameras help to
reduce vehicle speeds and deter aggressive driving behaviors that may result in angle and
pedestrian crashes.
Fenton Street Pedestrian Road Safety Audit
Page | 16
2.2 Observed Issues, Contributing Factors, and Opportunities for Improvements
The Fenton Street PRSA team identified a number of pedestrian safety issues in the study area during the
audit. These issues were discussed by the team and prioritized based on which issues present the
greatest challenges to pedestrian safety in the study area. This section describes the observed safety
issues identified by the PRSA team.
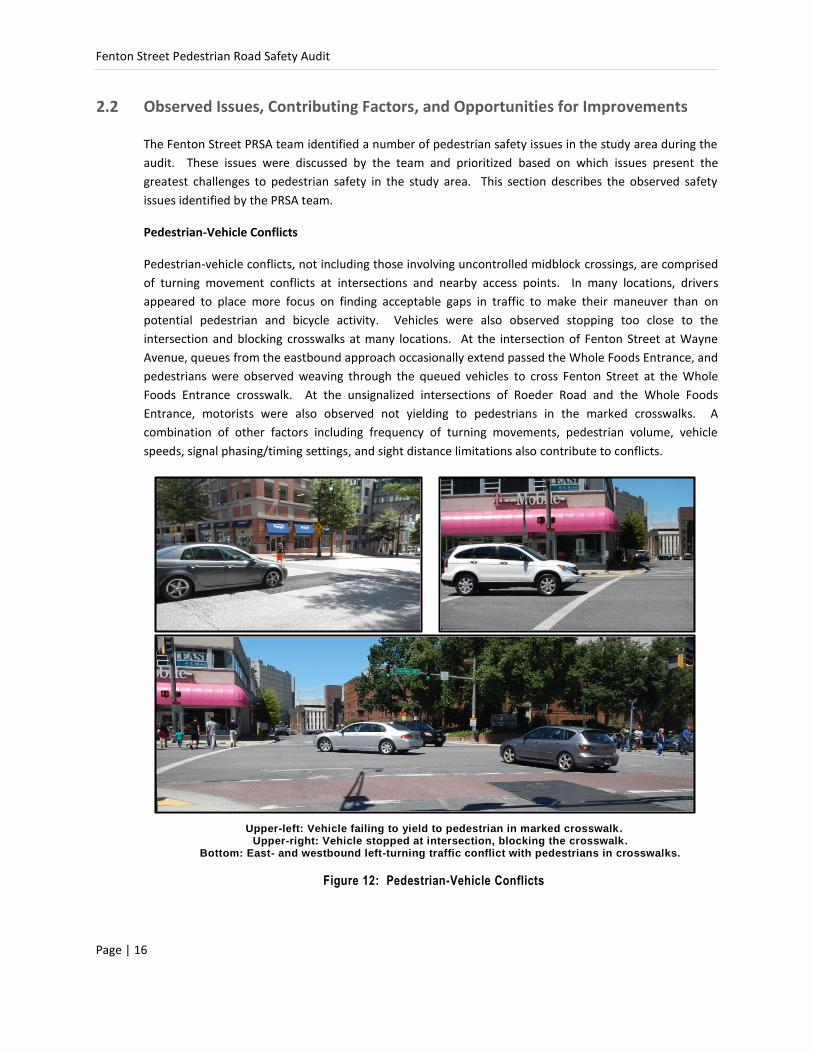
Pedestrian-Vehicle Conflicts
Pedestrian-vehicle conflicts, not including those involving uncontrolled midblock crossings, are comprised
of turning movement conflicts at intersections and nearby access points. In many locations, drivers
appeared to place more focus on finding acceptable gaps in traffic to make their maneuver than on
potential pedestrian and bicycle activity. Vehicles were also observed stopping too close to the
intersection and blocking crosswalks at many locations. At the intersection of Fenton Street at Wayne
Avenue, queues from the eastbound approach occasionally extend passed the Whole Foods Entrance, and
pedestrians were observed weaving through the queued vehicles to cross Fenton Street at the Whole
Foods Entrance crosswalk. At the unsignalized intersections of Roeder Road and the Whole Foods
Entrance, motorists were also observed not yielding to pedestrians in the marked crosswalks. A
combination of other factors including frequency of turning movements, pedestrian volume, vehicle
speeds, signal phasing/timing settings, and sight distance limitations also contribute to conflicts.
Upper-left: Vehicle failing to yield to pedestrian in marked crosswalk.
Upper-right: Vehicle stopped at intersection, blocking the crosswalk. Bottom: East- and westbound left-turning traffic conflict with pedestrians in crosswalks.
Figure 12: Pedestrian-Vehicle Conflicts
Fenton Street Pedestrian Road Safety Audit
Page | 17
The PRSA team identified a number of suggestions to reduce pedestrian-vehicle conflicts. Such
improvements include:
Installing signage and stop bars to improve driver awareness of pedestrians at intersections
Installing signage to direct left turning vehicles to yield to pedestrians
Relocating any bus stops that currently cause buses to block crosswalks when loading or
unloading
Installing flex-posts at unsignalized intersections to prevent street parking that may impede the
visibility of pedestrians
Relocating any bus stops that are blocked by existing street parking or prohibit street parking
Installing signage where grates and pavers are present along the sidewalk to warn pedestrians of
possible slippery conditions
Considering potential geometric roadway improvements to reduce pedestrian crossing distances,
improve pedestrian refuge spaces, and/or reduce vehicle turning speeds, particularly between
Colesville Road and Wayne Avenue
Evaluating and coordinating signal improvements with MDSHA, such as traffic signal
reconstruction to improve signal head visibility and signal phasing modifications to better serve
the pedestrian traffic
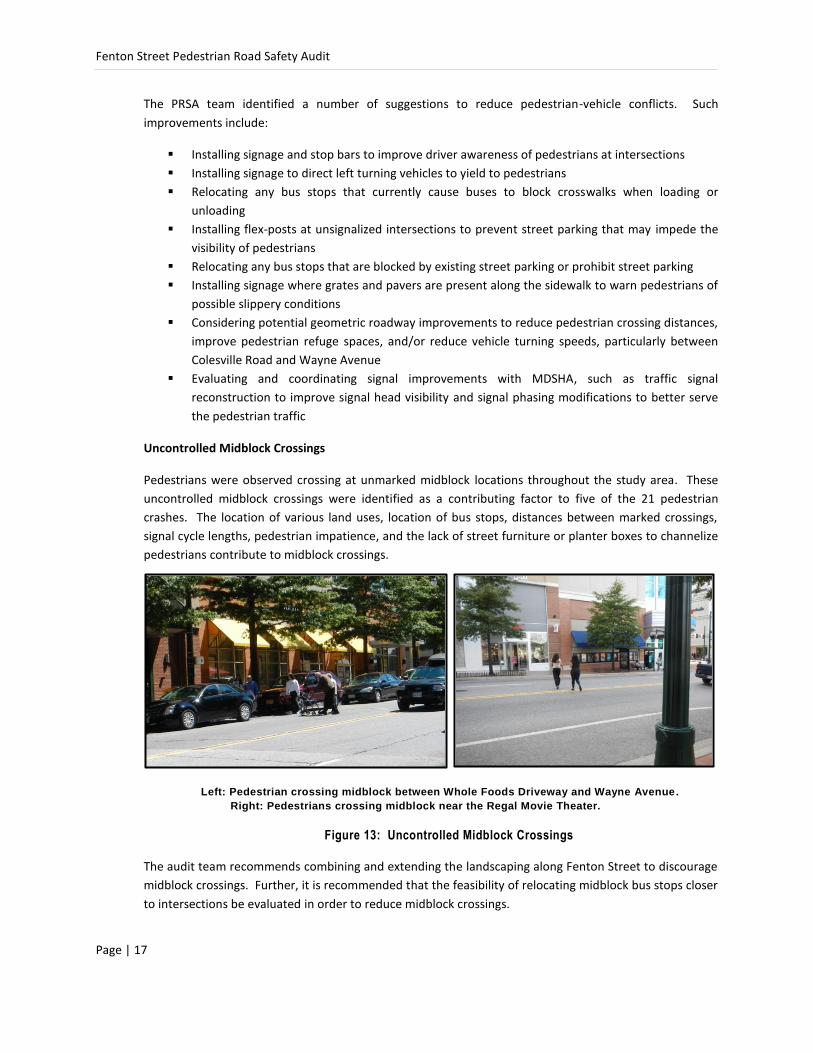
Uncontrolled Midblock Crossings
Pedestrians were observed crossing at unmarked midblock locations throughout the study area. These
uncontrolled midblock crossings were identified as a contributing factor to five of the 21 pedestrian
crashes. The location of various land uses, location of bus stops, distances between marked crossings,
signal cycle lengths, pedestrian impatience, and the lack of street furniture or planter boxes to channelize
pedestrians contribute to midblock crossings.
Left: Pedestrian crossing midblock between Whole Foods Driveway and Wayne Avenue.
Right: Pedestrians crossing midblock near the Regal Movie Theater.
Figure 13: Uncontrolled Midblock Crossings
The audit team recommends combining and extending the landscaping along Fenton Street to discourage
midblock crossings. Further, it is recommended that the feasibility of relocating midblock bus stops closer
to intersections be evaluated in order to reduce midblock crossings.
Fenton Street Pedestrian Road Safety Audit
Page | 18
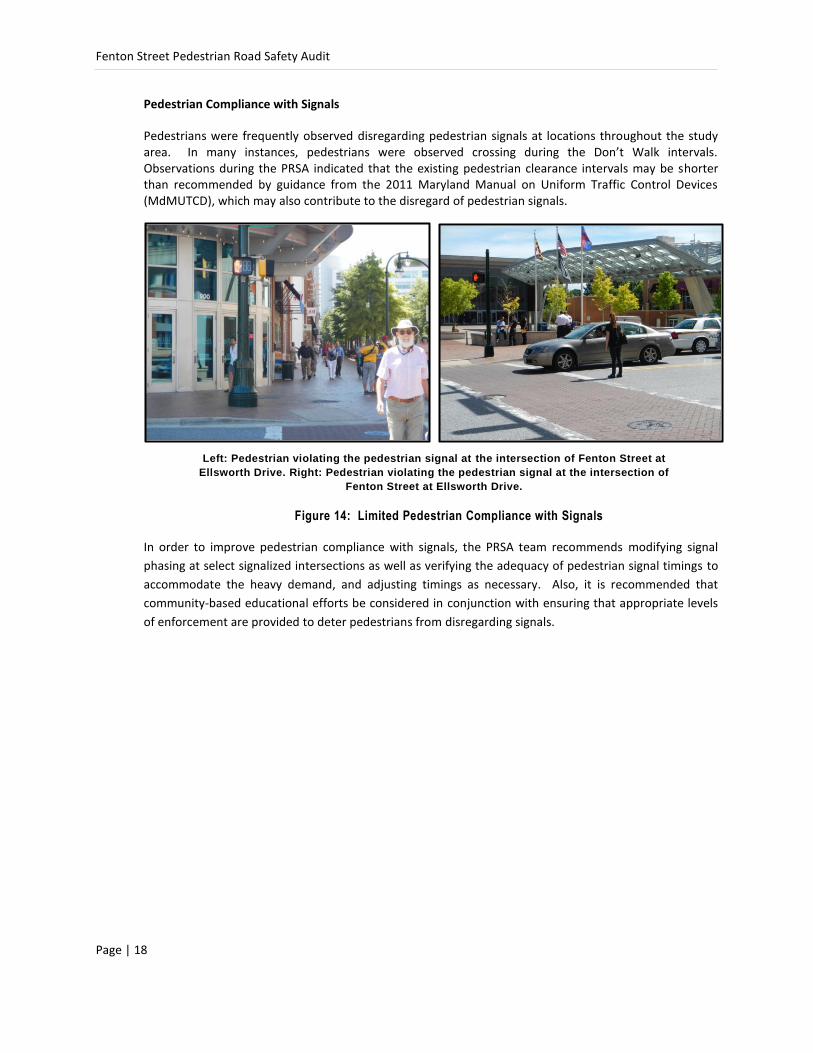
Pedestrian Compliance with Signals
Pedestrians were frequently observed disregarding pedestrian signals at locations throughout the study area. In many instances, pedestrians were observed crossing during the Don’t Walk intervals. Observations during the PRSA indicated that the existing pedestrian clearance intervals may be shorter than recommended by guidance from the 2011 Maryland Manual on Uniform Traffic Control Devices (MdMUTCD), which may also contribute to the disregard of pedestrian signals.
Left: Pedestrian violating the pedestrian signal at the intersection of Fenton Street at
Ellsworth Drive. Right: Pedestrian violating the pedestrian signal at the intersection of
Fenton Street at Ellsworth Drive.
Figure 14: Limited Pedestrian Compliance with Signals
In order to improve pedestrian compliance with signals, the PRSA team recommends modifying signal
phasing at select signalized intersections as well as verifying the adequacy of pedestrian signal timings to
accommodate the heavy demand, and adjusting timings as necessary. Also, it is recommended that
community-based educational efforts be considered in conjunction with ensuring that appropriate levels
of enforcement are provided to deter pedestrians from disregarding signals.
Fenton Street Pedestrian Road Safety Audit
Page | 19
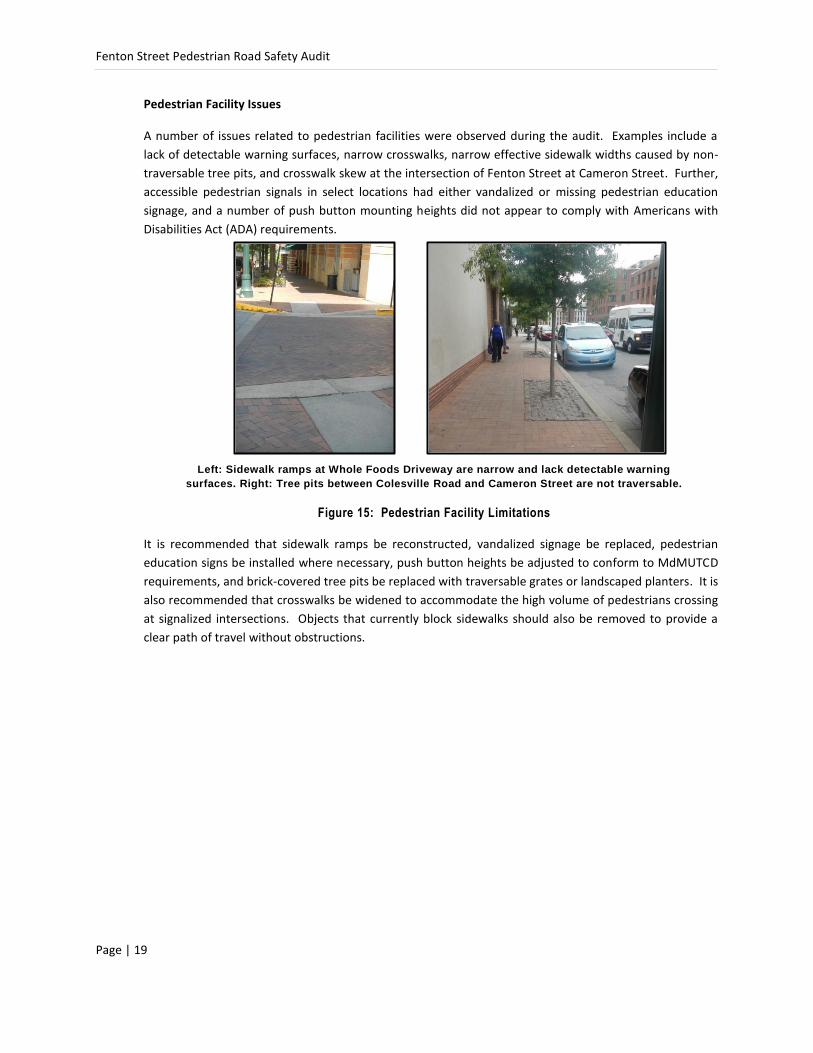
Pedestrian Facility Issues
A number of issues related to pedestrian facilities were observed during the audit. Examples include a
lack of detectable warning surfaces, narrow crosswalks, narrow effective sidewalk widths caused by non-
traversable tree pits, and crosswalk skew at the intersection of Fenton Street at Cameron Street. Further,
accessible pedestrian signals in select locations had either vandalized or missing pedestrian education
signage, and a number of push button mounting heights did not appear to comply with Americans with
Disabilities Act (ADA) requirements.
Left: Sidewalk ramps at Whole Foods Driveway are narrow and lack detectable warning
surfaces. Right: Tree pits between Colesville Road and Cameron Street are not traversable.
Figure 15: Pedestrian Facility Limitations
It is recommended that sidewalk ramps be reconstructed, vandalized signage be replaced, pedestrian
education signs be installed where necessary, push button heights be adjusted to conform to MdMUTCD
requirements, and brick-covered tree pits be replaced with traversable grates or landscaped planters. It is
also recommended that crosswalks be widened to accommodate the high volume of pedestrians crossing
at signalized intersections. Objects that currently block sidewalks should also be removed to provide a
clear path of travel without obstructions.

Fenton Street Pedestrian Road Safety Audit
Page | 20
Drainage Conditions
A number of drainage issues were observed during the audit, including ponding at several intersections. A downspout at the intersection of Fenton Street at Colesville Road discharged water into the intersection and stormwater collected along the hiker-biker trail near the intersection of Fenton Street at Wayne Avenue was observed pouring into the intersection. Further, the Whole Foods Roof discharged water onto the sidewalk adjacent to the Whole Foods Driveway, leading to slippery sidewalk conditions.
Left: Ponding near the intersection of Fenton Street at Colesville Road. Right: Drainage along the
hiker-biker trail discharging into the intersection of Fenton Street at Wayne Avenue.
Figure 16: Drainage Conditions
In order to improve drainage conditions, the PRSA team recommends coordinating with local business
owners to modify or relocate rain gutters and drainage pipes to prevent stormwater from pouring onto
the sidewalks. It is expected that the resurfacing project currently planned for Fenton Street will improve
the existing ponding issues along the corridor.
Lighting Conditions
During the study period, nine of the 21 pedestrian crashes occurred during dark conditions while the
street lights were on. The visibility of pedestrians may be reduced due to limited lighting near
unsignalized intersections, uncontrolled midblock crossing locations, and along the sidewalks. During the
nighttime audit, the team observed insufficient lighting in multiple areas throughout the study area.
Lighting throughout the study area can be improved by inspecting street lighting for repair, requesting
temporary lighting be installed where construction is or will be occurring, replacing fixtures along the
corridor that do not match fixtures east of Colesville Road, and trimming trees where street lighting is
impeded. The audit team also recommends that the need for additional street-lighting be evaluated.
Fenton Street Pedestrian Road Safety Audit
Page | 21
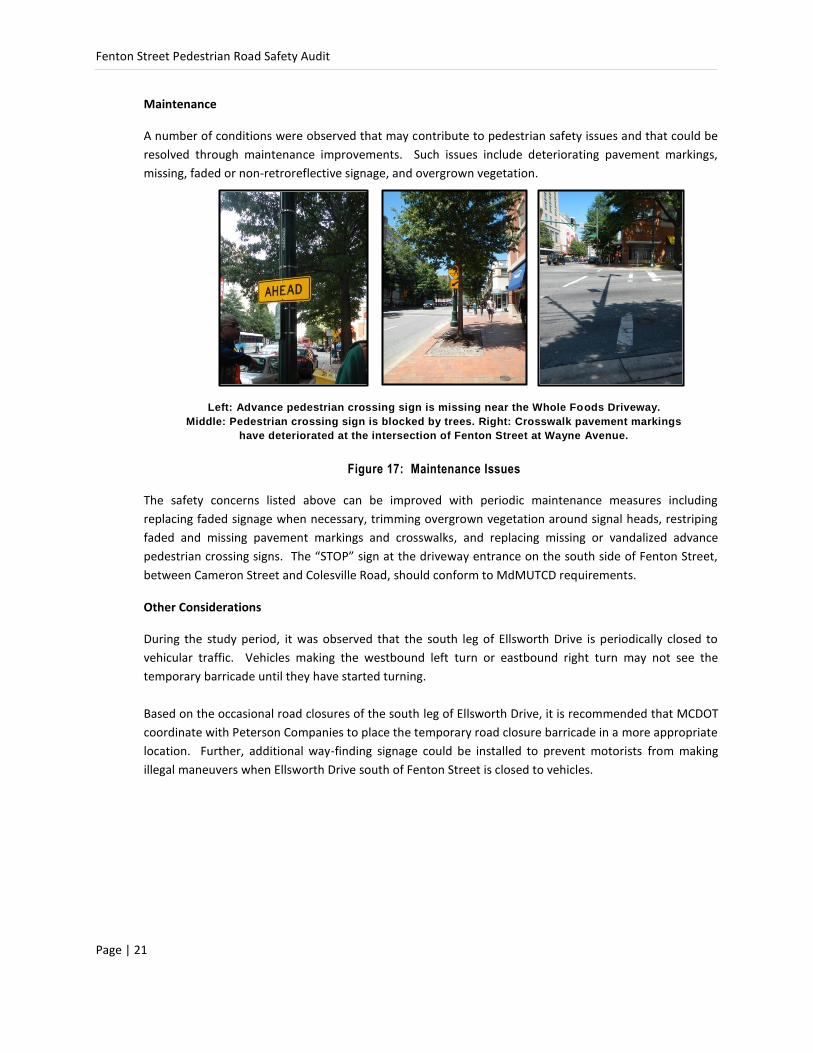
Maintenance
A number of conditions were observed that may contribute to pedestrian safety issues and that could be
resolved through maintenance improvements. Such issues include deteriorating pavement markings,
missing, faded or non-retroreflective signage, and overgrown vegetation.
Left: Advance pedestrian crossing sign is missing near the Whole Foods Driveway.
Middle: Pedestrian crossing sign is blocked by trees. Right: Crosswalk pavement markings
have deteriorated at the intersection of Fenton Street at Wayne Avenue.
Figure 17: Maintenance Issues
The safety concerns listed above can be improved with periodic maintenance measures including
replacing faded signage when necessary, trimming overgrown vegetation around signal heads, restriping
faded and missing pavement markings and crosswalks, and replacing missing or vandalized advance
pedestrian crossing signs. The “STOP” sign at the driveway entrance on the south side of Fenton Street,
between Cameron Street and Colesville Road, should conform to MdMUTCD requirements.
Other Considerations
During the study period, it was observed that the south leg of Ellsworth Drive is periodically closed to
vehicular traffic. Vehicles making the westbound left turn or eastbound right turn may not see the
temporary barricade until they have started turning.
Based on the occasional road closures of the south leg of Ellsworth Drive, it is recommended that MCDOT
coordinate with Peterson Companies to place the temporary road closure barricade in a more appropriate
location. Further, additional way-finding signage could be installed to prevent motorists from making
illegal maneuvers when Ellsworth Drive south of Fenton Street is closed to vehicles.

Fenton Street Pedestrian Road Safety Audit
Page | 22
2.3 Summary of Issues and Suggestions The following section provides a summary of the issues identified during the PRSA process and the
suggestions for improvements at each location discussed in this report. The anticipated timeframe for
completion [Short Term (ST), Intermediate (I), and Long Term (LT)] is referenced after each suggestion.
Safety Issue Suggestion(s)
Pedestrian-Vehicle Conflicts
Consider modifying signal phasing at select signalized intersections to
better serve pedestrian traffic (ST).
Verify that all traffic signals meet vertical mounting heights per MdMUTCD
(ST).
Consider relocating any bus stops that currently cause buses to block
crosswalks when loading or unloading (ST).
Install stop bars and signage to direct motorists to yield to pedestrians (ST).
Install flex-posts at unsignalized intersections to prevent street parking that
may impede the visibility of pedestrians (ST).
Consider relocating any bus stops that are blocked by existing street parking
or prohibit street parking at these locations (ST).
Consider installing signage where grates and pavers are present along the
sidewalk to warn pedestrians of possible slippery conditions (ST).
Consider signal phasing modifications, additional pavement markings, and
additional signage to direct left turning vehicles to yield to pedestrians and
reduce conflicts between pedestrians and left turning vehicles (I).
Determine the feasibility of installing more easily traversable grating (LT).
Determine the constructability and feasibility of geometric roadway
improvements, particularly between Colesville Road and Wayne Avenue, to
reduce pedestrian crossing distances, improve pedestrian refuge spaces,
and/or reduce vehicle turning speeds (LT).
Uncontrolled Midblock Crossings
Combine and extend landscaping to discourage midblock crossings (I).
Determine the feasibility of relocating midblock bus stops closer to
intersections to reduce midblock crossings (LT).
Pedestrian Compliance with Signals
Verify the adequacy of pedestrian signal timings to accommodate heavy
demand, and adjust timings as necessary (ST).
Consider modifying signal phasing at select signalized intersections (ST).
Consider providing education and enforcement for pedestrian compliance
with signals (ST).

Fenton Street Pedestrian Road Safety Audit
Page | 23
Safety Issue Suggestion(s)
Pedestrian Facility Issues
Consider reconstructing sidewalk ramps to comply with ADA requirements
(ST).
Consider widening crosswalks to accommodate heavy pedestrian traffic
(ST).
Consider replacing any vandalized signage, and install pedestrian education
signs where necessary (ST).
Replace brick-covered tree pits with traversable grates or landscaped
planters with fencing (I).
Adjust push button heights to conform to MdMUTCD requirements (I).
Coordinate with PEPCO to have utility poles relocated where they block
sidewalk, crosswalk, or pedestrian indications (LT).
Drainage Conditions Coordinate with local businesses to modify or relocate rain gutters and
drainage pipes to prevent stormwater from pouring onto the sidewalk (ST).
Lighting Conditions Trim trees where street lighting is impeded (ST).
Inspect street lighting for repair (ST).
Request that temporary lighting be installed where construction is or will be
occurring (ST).
Evaluate the need for additional street lighting (LT).
Consider replacing fixtures along the corridor that do not match fixtures
east of Colesville Road (LT).
Maintenance Consider installing high-visibility pavement markings for crosswalks (ST).
Consider replacing faded signage (ST).
Trim trees where pedestrian crossing signs are blocked (ST).
Ensure “STOP” signs at unsignalized intersections conform to MdMUTCD
requirements (ST).
Replace any missing or vandalized advance pedestrian crossing signs (ST).
Other Coordinate with Peterson Companies to place the temporary road closure
barricade in a more appropriate location.
Install additional way-finding signage to prevent motorists from making
illegal maneuvers when Ellsworth Drive south of Fenton Street is closed to
vehicles (ST).