from adapting to transforming in a ch i tilithanging...
TRANSCRIPT
From adapting to From adapting to transforming in a transforming in a
h i tilith i tilitchanging utility changing utility industryindustryEelco de Jong
industryindustry
Georgia Tech Energy SeriesNovember 12th, 2014
Eelco de Jong
CONFIDENTIAL AND PROPRIETARYAny use of this material without specific permission of McKinsey & Company is strictly prohibited
Key themes for todayMCKINSEY PROPRIETARY AND CONFIDENTIAL
Transforming, not adapting
Disruption: glass half empty
Actions that define winners
McKinsey & Company | 1
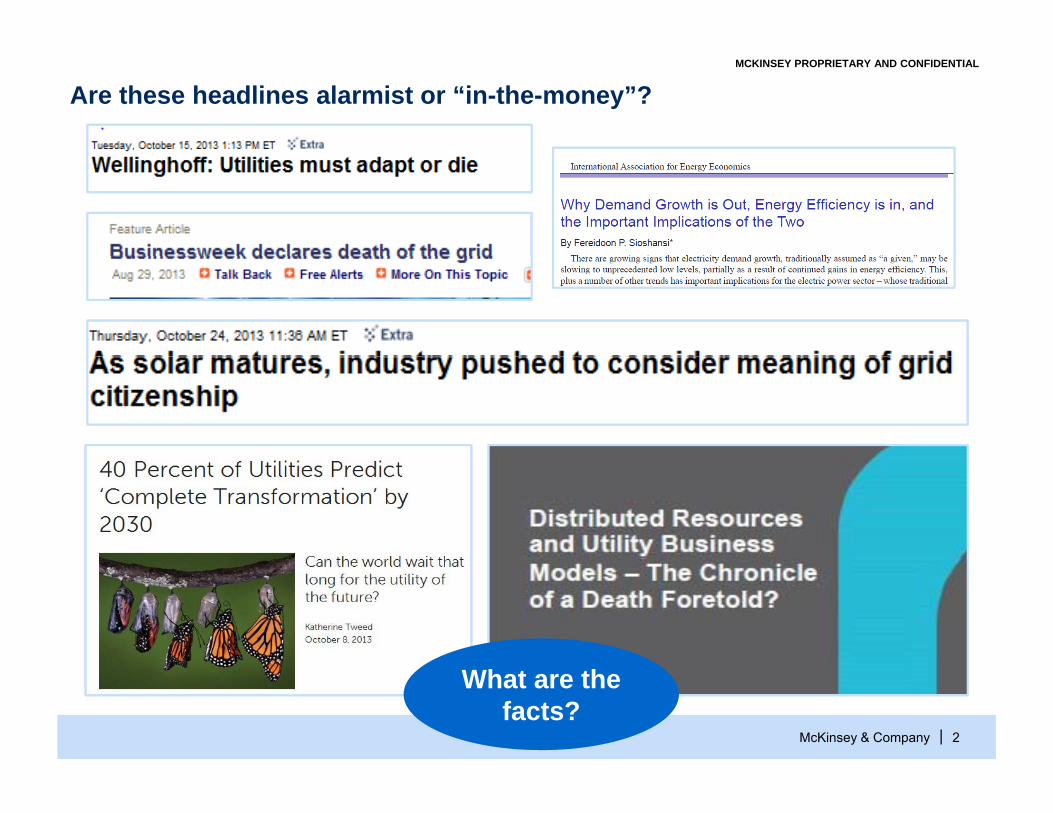
Are these headlines alarmist or “in-the-money”?MCKINSEY PROPRIETARY AND CONFIDENTIAL
McKinsey & Company | 2
What are the facts?

Demand growth forecasts are being adjusted… down
A f d i EIA AEO P
Historical growth rateLong-term electric consumptionannual growth rate1
2.62.4
As forecasted in EIA AEO, Percent
1.51.8
0.7
1.1 -1.1%
McKinsey & Company | 31 Normalized to 2005-25 CAGR for all AEOs
1960-1990 1990-2010 082004 06 2010

Five technology-based drivers are transforming the industryMCKINSEY PROPRIETARY AND CONFIDENTIAL
Unconventional gas and oil
New “economic pillar” that rebases the value of generation
Centralized renewables
Policy and technology curve leading to commercially competitive build
Distributed generation
Fast decreasing costs improve competitiveness causing relocation of generation to lower voltage
Energy efficiency
Innovations, policies and big data driving next wave of adoption; integrating customer into supply curve
Customer awareness
g g pp y
Customer expectations, experience and activity rising to unparalleled levels
McKinsey & Company | 4
levels

Views on transformation change
When you see a So, despite the risks that
MCKINSEY PROPRIETARY AND CONFIDENTIAL
When you see a disruptive technology
come into your space if you don’t
So, despite the risks that a rapidly growing level of
distributed energy resources penetration and space, if you don t
embrace it… the people who try and cling to the past get
resources penetration and other disruptive challenges
may impose, they are not currently being discussed cling to the past get
rolled overcurrently being discussed
by the investment community and factored
i t th l tiDavid Crane,
CEO NRG
into the valuation
Edison Electric Institute
McKinsey & Company | 5
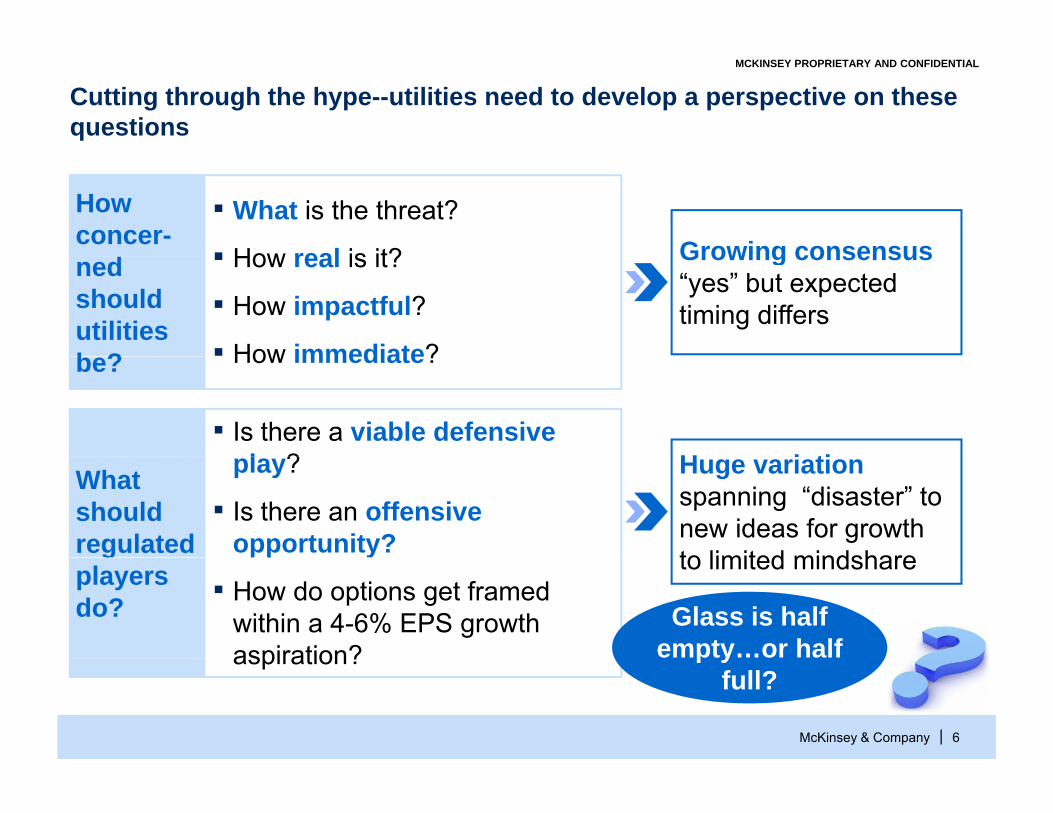
Cutting through the hype--utilities need to develop a perspective on these questions
MCKINSEY PROPRIETARY AND CONFIDENTIAL
Growing consensus▪ What is the threat?
▪ How real is it?
How concer- Growing consensus
“yes” but expected timing differs
▪ How real is it?
▪ How impactful?
▪ How immediate?
nedshould utilities b ? How immediate?be?
H i ti▪ Is there a viable defensive
l ? Huge variation spanning “disaster” to new ideas for growth to limited mindshare
play?
▪ Is there an offensive opportunity?
What should regulated to limited mindsharey
▪ How do options get framed within a 4-6% EPS growth aspiration?
gplayers do? Glass is half
empty…or half
McKinsey & Company | 6
aspiration? p yfull?
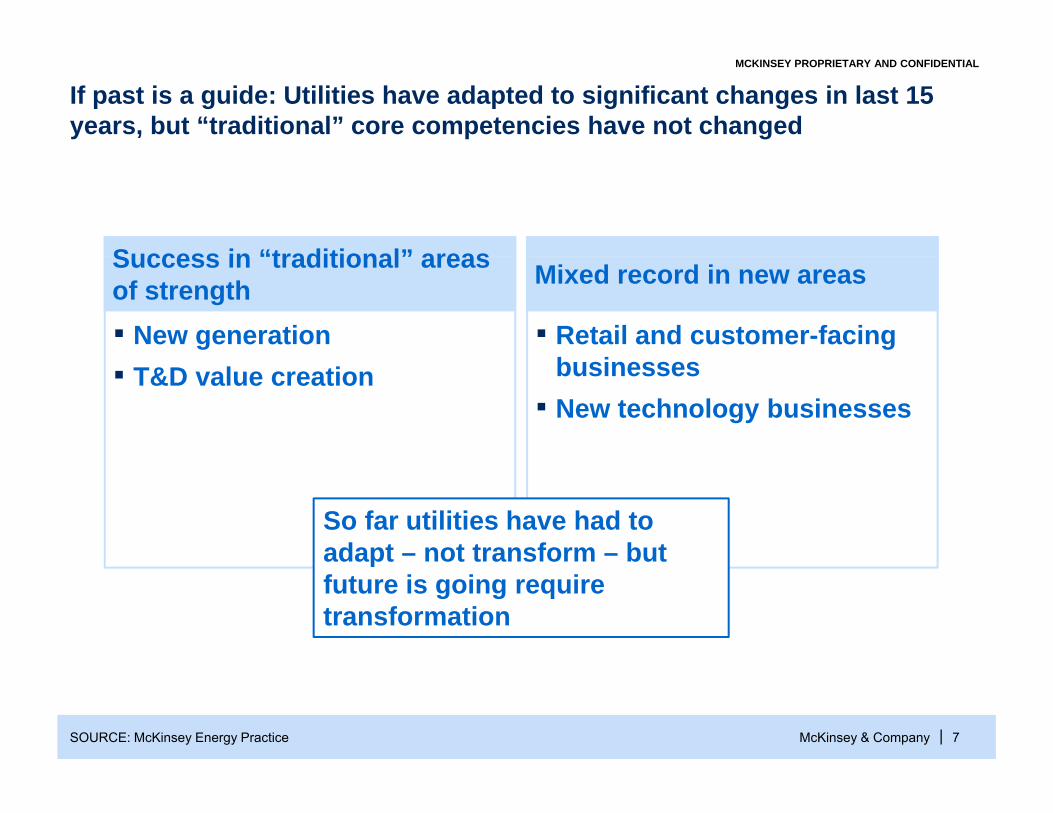
If past is a guide: Utilities have adapted to significant changes in last 15 years, but “traditional” core competencies have not changed
MCKINSEY PROPRIETARY AND CONFIDENTIAL
Success in “traditional” areasSuccess in “traditional” areas of strength Mixed record in new areas
▪ Retail and customer-facing ▪ New generationbusinesses
▪ New technology businesses▪ T&D value creation
So far utilities have had to adapt – not transform – butadapt not transform but future is going require transformation
McKinsey & Company | 7SOURCE: McKinsey Energy Practice
Key themes for todayMCKINSEY PROPRIETARY AND CONFIDENTIAL
Transforming, not adapting
Disruption: glass half empty
Actions that define winners
McKinsey & Company | 8

Trends are having a meaningful impact on load growthDEMAND DESTRUCTION MCKINSEY PROPRIETARY AND CONFIDENTIAL
100% = baseline load forecast for 2023 Kwh load
Calculated demand across selected US States
2%100%
5%
2%
18%
2%2%
-22%7%
83%
5%
Efficiency standards
Competitive efficiency b i
New energy efficient t h l
Utility EE programs /d d
Total demand
Distributed Solar PV
Co-generation
2023 demand
10 year growth
2012 demand
McKinsey & Company | 9SOURCE: McKinsey Electric Power Practice
business models
technology/demand elasticity

Price erosion the key enabler for residential LEDs
Compact fluorescent lights took off
ENERGY EFFICIENCY
… and LED bulbs are rapidly
CFL share1 and ASP
p garound $5-10 …
Retail price of LED retrofit bulb, Dollars
p yapproaching that price point
60
(USD)
60
(Percent)
40
50
40
50
20
30 30
20
0
10
’951990 ’05’00 ’10
10
0
McKinsey & Company | 10SOURCE: U.S. DOE, U.S. EPA, GE Web site
951990 0500 101 U.S. market shares on annual replacement sales.
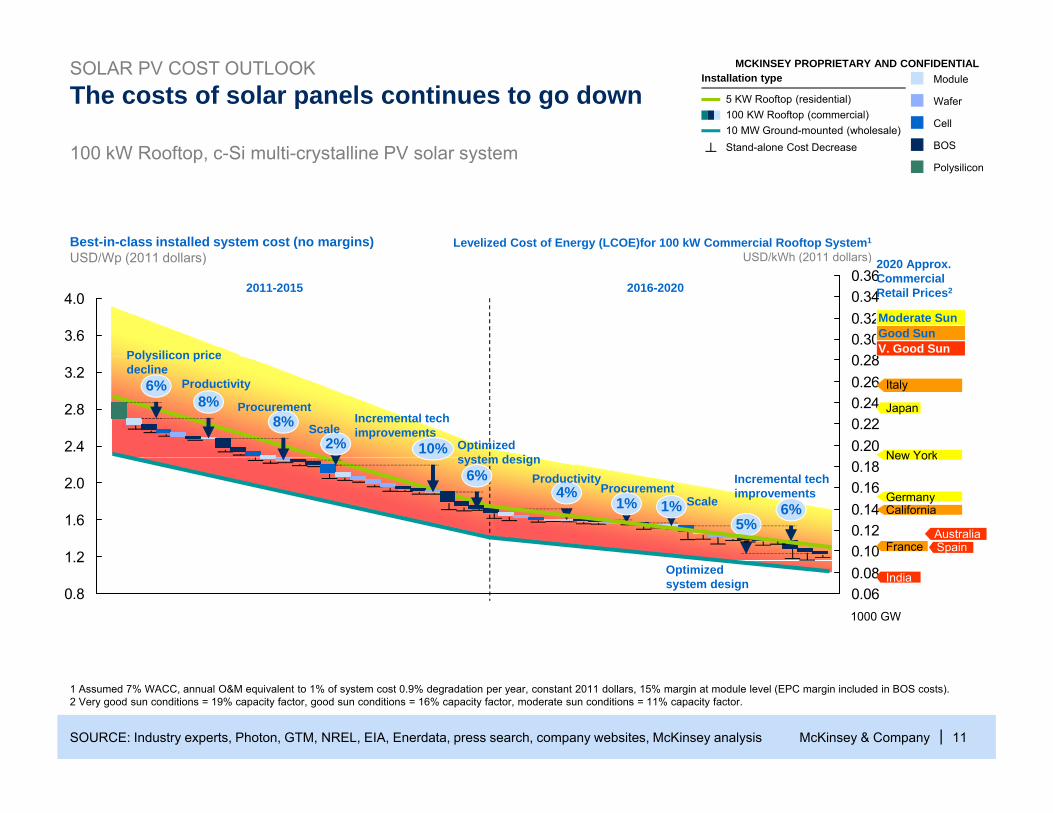
100 kW Rooftop c-Si multi-crystalline PV solar system
The costs of solar panels continues to go down Wafer
BOS
Cell
ModuleSOLAR PV COST OUTLOOK Installation type
5 KW Rooftop (residential)100 KW Rooftop (commercial)
Stand-alone Cost Decrease10 MW Ground-mounted (wholesale)
MCKINSEY PROPRIETARY AND CONFIDENTIAL
Best-in-class installed system cost (no margins)USD/Wp (2011 dollars)
100 kW Rooftop, c Si multi crystalline PV solar systemPolysilicon
Levelized Cost of Energy (LCOE)for 100 kW Commercial Rooftop System1
USD/kWh (2011 dollars)USD/Wp (2011 dollars)
0 280.300.320.340.36
3.6
4.02011-2015 2016-2020
Polysilicon price
USD/kWh (2011 dollars) 2020 Approx. Commercial Retail Prices2
V. Good SunGood SunModerate Sun
0.200.220.240.260.28
2.4
2.8
3.2
8%2%
6%8%
10%
Productivity
Procurement
Optimized s stem design
ScaleIncremental techimprovements
Polysilicon pricedecline
Italy
New York
Japan
0.100.120.140.160.18
1 2
1.6
2.01% 6%
6%4%
1%5%
system designProductivity
ProcurementScale
Incremental techimprovements Germany
California
FranceAustralia
New York
Spain
0.060.08
0.8
1.2Optimized system design India
1000 GW
McKinsey & Company | 11SOURCE: Industry experts, Photon, GTM, NREL, EIA, Enerdata, press search, company websites, McKinsey analysis
1 Assumed 7% WACC, annual O&M equivalent to 1% of system cost 0.9% degradation per year, constant 2011 dollars, 15% margin at module level (EPC margin included in BOS costs). 2 Very good sun conditions = 19% capacity factor, good sun conditions = 16% capacity factor, moderate sun conditions = 11% capacity factor.
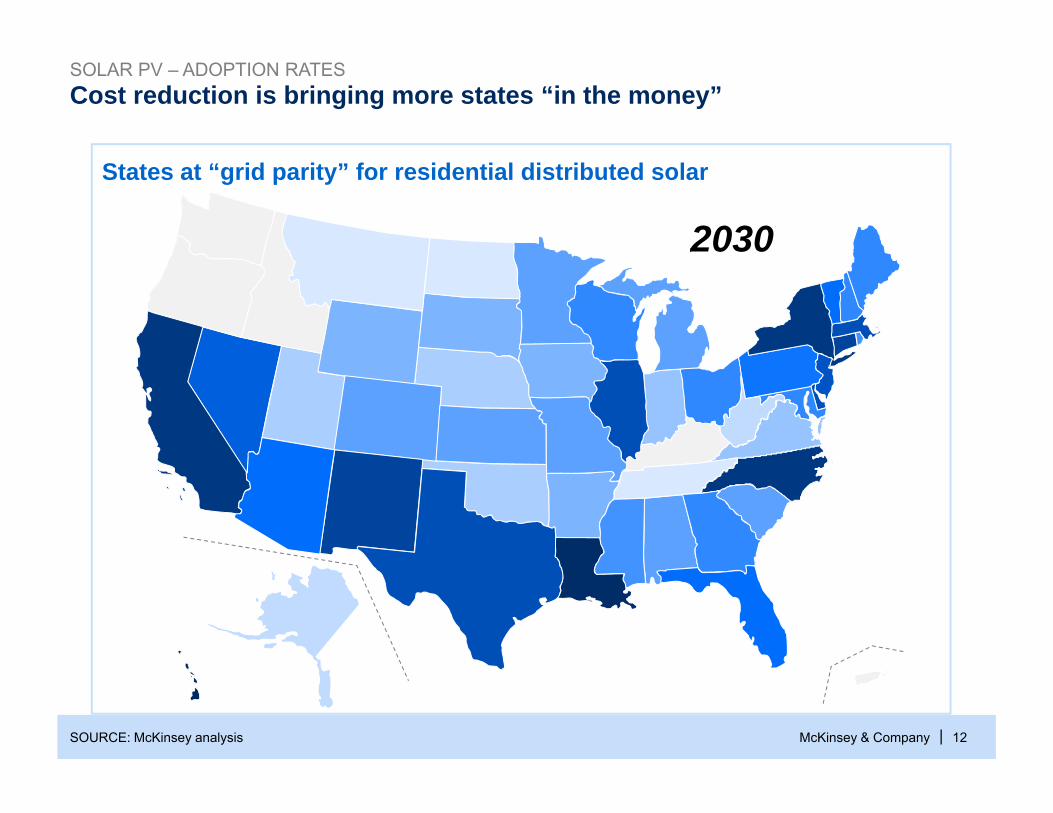
Cost reduction is bringing more states “in the money”SOLAR PV – ADOPTION RATES
20122013201420152016201920202021202220232024202520262027202820292030
States at “grid parity” for residential distributed solar
McKinsey & Company | 12SOURCE: McKinsey analysis

Actual observed installation rates: rapid solar uptake at “grid parity”SOLAR PV – ADOPTION RATES
5.0
Solar adoption rate% of total demand erosion in that year
HIAZ
3.0
2.5 NMNJ3
HI
1.5
2.0
NJ-Com3
GermanyNV
1.0
0.5
NJ Com
060400-20-40-60-140 20-30-50 10-10 30 50 70
McKinsey & Company | 13SOURCE: BMU, BSW, GTM Research, Ventyx Energy Velocity, press search; team analysis
Price discount %Solar LCOE (incl. incentives) vs. residential rate
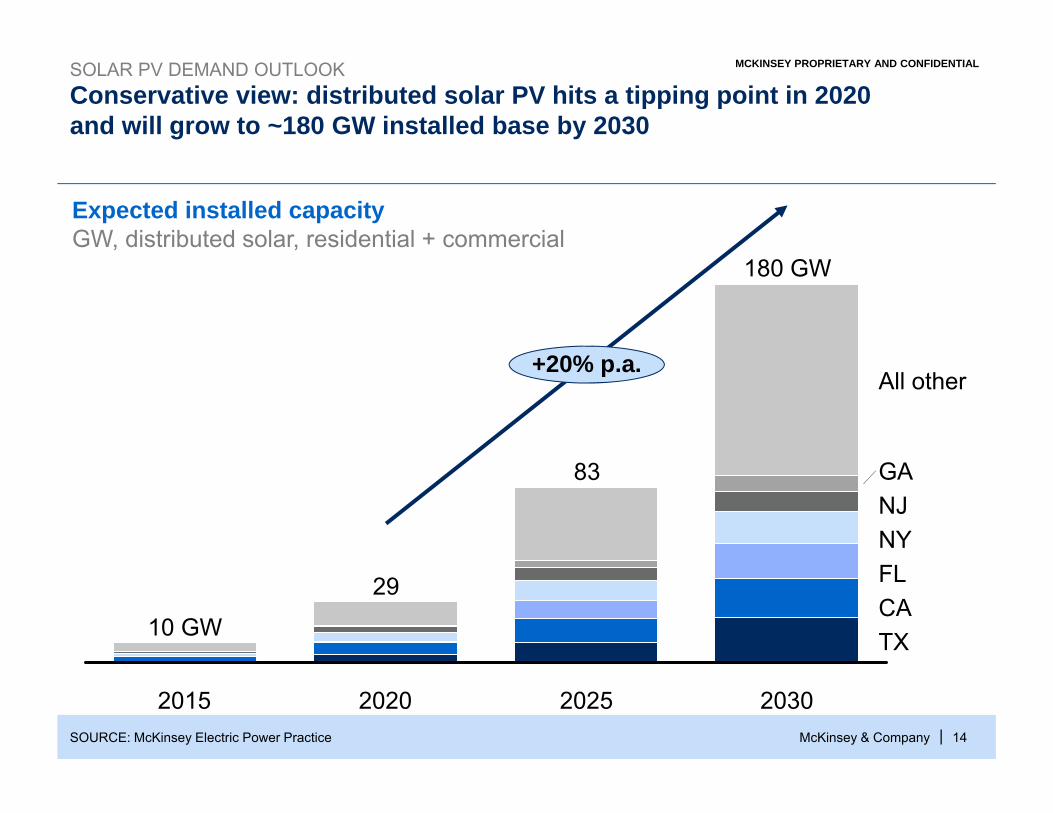
Conservative view: distributed solar PV hits a tipping point in 2020 and will grow to ~180 GW installed base by 2030
SOLAR PV DEMAND OUTLOOK MCKINSEY PROPRIETARY AND CONFIDENTIAL
Expected installed capacityGW, distributed solar, residential + commercial
20%
180 GW
+20% p.a.All other
GANJNY
83
29
10 GW TXCAFL
McKinsey & Company | 14
2015 203020252020SOURCE: McKinsey Electric Power Practice

Winning players are aggressively working down “soft costs” NORTH AMERICA SOLAR COST FOCUS MCKINSEY PROPRIETARY AND CONFIDENTIAL
3.32
Expected reduction in installed PV solar system costs – residential
USD/Wp
1.421.63
3.32
0.520.67
0 43
0.380.320.59 0.68
0.43
Installer margin
2011 Others1Installationlabor
Customer acquisition
2020
McKinsey & Company | 15SOURCE: McKinsey analysis, Expert interviews, NREL, LBNL
1 Includes Sales Tax, Permit Fees and PII (permitting inspection and interconnection)2 Variability based on sales tax cut realization of 50% in pessimistic scenario

Key themes for todayMCKINSEY PROPRIETARY AND CONFIDENTIAL
Transforming, not adapting
Disruption: glass half empty
A ti d fi i iActions defining winners
McKinsey & Company | 16
ImplicationsMCKINSEY PROPRIETARY AND CONFIDENTIAL
Players who continue to rely only on value from centralized generation and current utility model will struggle
Winners are beginning to stake out plans anchored in long-term growth perspective
Winners are redefining their risk profile – no silver bullet, need to make multiple bets
McKinsey & Company | 17
a e u p e be s

McKinsey’s view is that companies need to simultaneously manage “three horizons” to take the glass half-full approach
MCKINSEY PROPRIETARY AND CONFIDENTIAL
“Find ways to grow”
“Find new ways to change the industry”
“Sustain earnings growth to invest in the future”
“Find ways to grow”
Find new growth
Adopt new business models
Optimize the core
Find new growth opportunities
▪ Master new technologies and products
▪ Get close to the▪ Protect the core
b i ▪ Get close to the customer
▪ Innovate the business model – including rate
business▪ Invest in growth
opportunities: transmission,
▪ Optimize operational performance
▪ Sustain EPS in a tough structuresrenewables
▪ M&A?
genvironment
▪ Create headroom to fund future growth
McKinsey & Company | 18
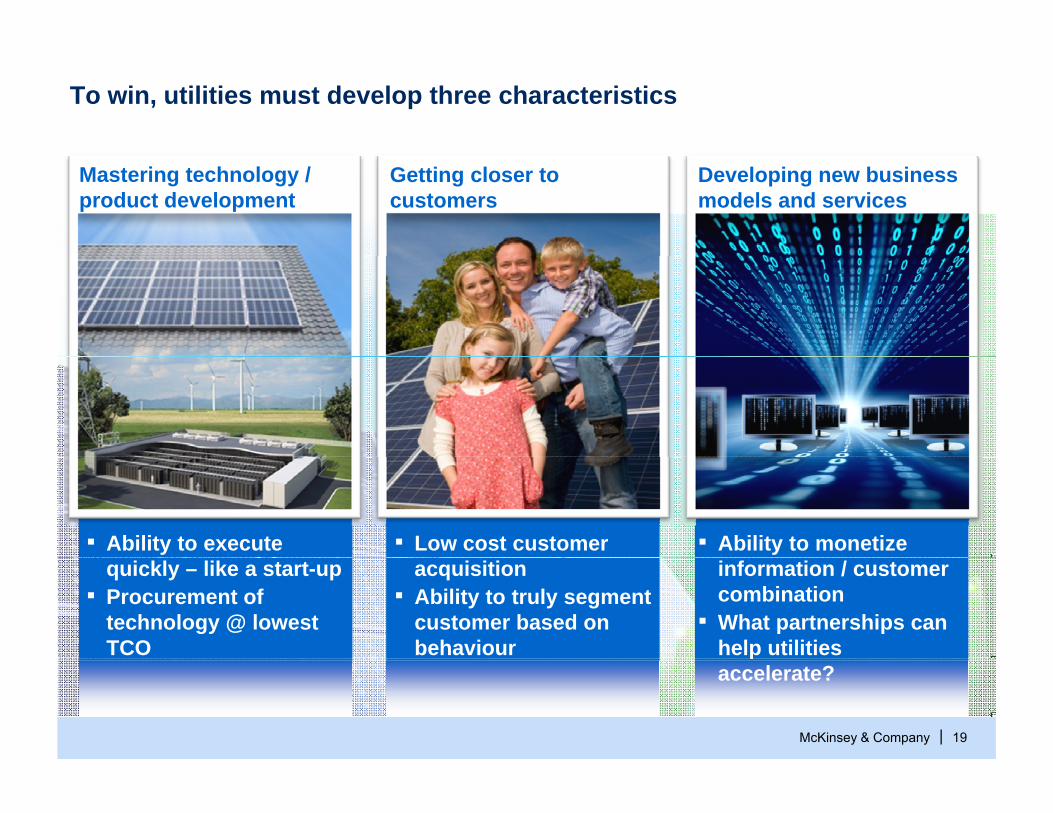
To win, utilities must develop three characteristics
Mastering technology / product development
Getting closer to customers
Developing new business models and services
▪ Ability to execute ▪ Low cost customer ▪ Ability to monetize quickly – like a start-up
▪ Procurement of technology @ lowest TCO
acquisition▪ Ability to truly segment
customer based on behaviour
information / customer combination
▪ What partnerships can help utilities
McKinsey & Company | 19
paccelerate?
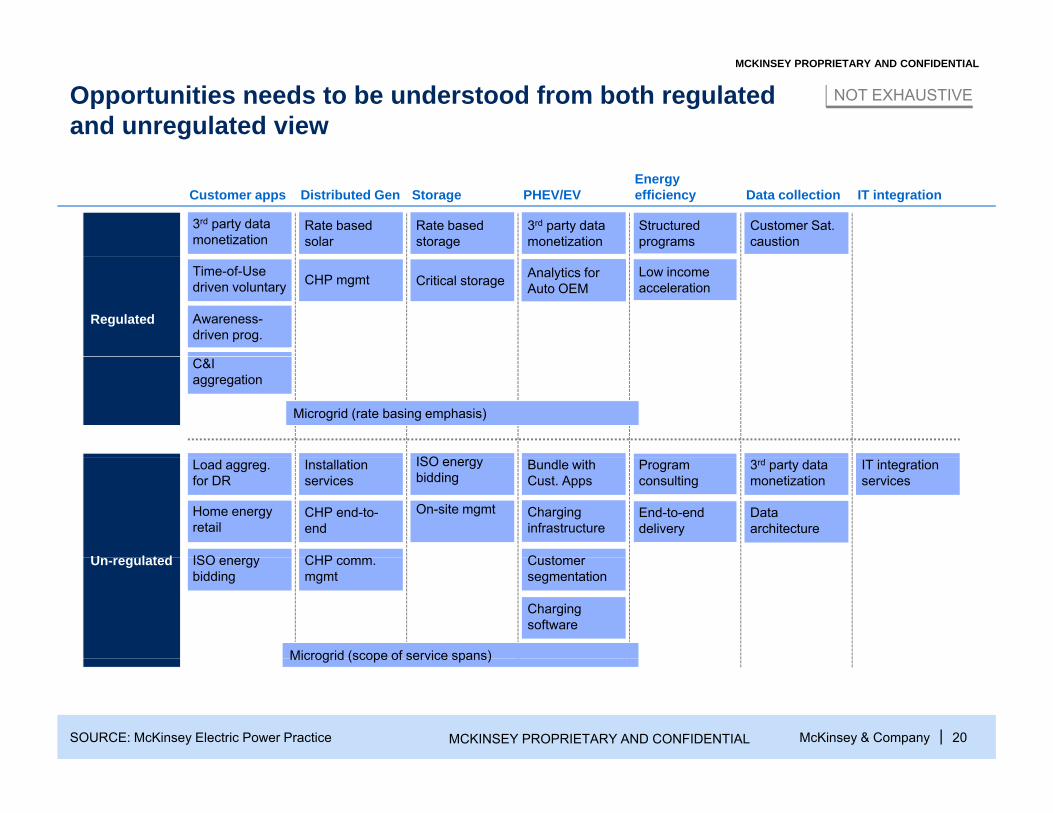
Opportunities needs to be understood from both regulated and unregulated view
NOT EXHAUSTIVE
MCKINSEY PROPRIETARY AND CONFIDENTIAL
Customer apps Distributed Gen Storage PHEV/EVEnergy efficiency Data collection IT integration
Rate based solar
3rd party data monetization
Rate based storage
3rd party data monetization
Structured programs
Customer Sat. caustion
Analytics for Auto OEM
Regulated
CHP mgmt Critical storageTime-of-Use driven voluntary
Awareness-driven prog.
Low income acceleration
Analytics for Auto OEM
C&I aggregation
ISO
Microgrid (rate basing emphasis)
U l t d
ISO energy bidding
Installation services
Load aggreg. for DR
Home energy retail
On-site mgmtCHP end-to-end
Bundle with Cust. Apps
Charging infrastructure
C tISO CHP
3rd party data monetization
IT integration services
Program consulting
End-to-end delivery
Data architecture
Un-regulated Customer segmentation
ISO energy bidding
CHP comm. mgmt
Charging software
Microgrid (scope of service spans)
McKinsey & Company | 20MCKINSEY PROPRIETARY AND CONFIDENTIALSOURCE: McKinsey Electric Power Practice
Microgrid (scope of service spans)
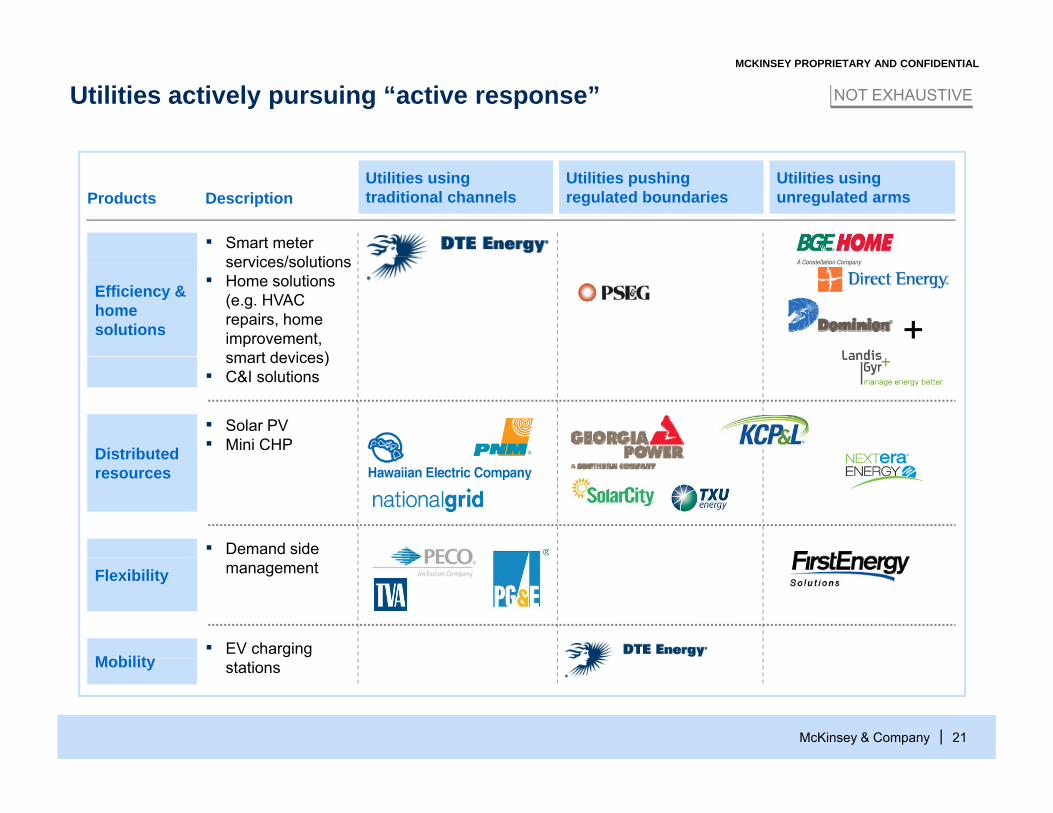
NOT EXHAUSTIVEUtilities actively pursuing “active response”MCKINSEY PROPRIETARY AND CONFIDENTIAL
Utilities using unregulated arms
Utilities pushing regulated boundaries
Utilities using traditional channelsProducts
▪ Smart meter i / l ti
Description
Efficiency & home solutions
services/solutions▪ Home solutions
(e.g. HVAC repairs, home improvement, smart devices)
+smart devices)
▪ C&I solutions
Distributed
▪ Solar PV▪ Mini CHPDistributed
resources
▪ Demand side
M bilit▪ EV charging
Flexibility management
McKinsey & Company | 21
Mobility stations

The challenge – utilities need to think “beyond commodities”
Energy retailers bundled free energy
Old model“The pure-play energy manager”
“
New model: make money on the added services
bundled free energy management and services products
▪ “Energy management package”: $8.99/month plus one-time $50 activation fee (on top of standard home security package)home security package)
▪ Includes 1 smart thermostat, 1 appliance control, 12 EE light bulbs and home energy monitoring/advice
“The digital home provider” ▪ Energy management controls and
monitoring bundled with home automation / security package from incumbent telco or cableco
McKinsey & Company | 22SOURCE: McKinsey Energy Practice
€/MWh €/customer

Companies are exploring alternatives to our current rate model
Challenge Examples
No accurate price▪ Can we sustain a volumetric rate vs. largely
fixed cost base?No accurate price signals ▪ Net metering -- who is paying for back-up and
grid?
No cost recovery of core services
▪ Services that are “free”: universal access, back-up power
▪ Are customers willing to pay the full costs of g p ythese?
▪ What if utilities were allowed to build distributed solar?Limited ability to play in
competitive sectorssolar?
▪ What would happen if utilities would be in charge of your energy efficiency?
McKinsey & Company | 23SOURCE: McKinsey
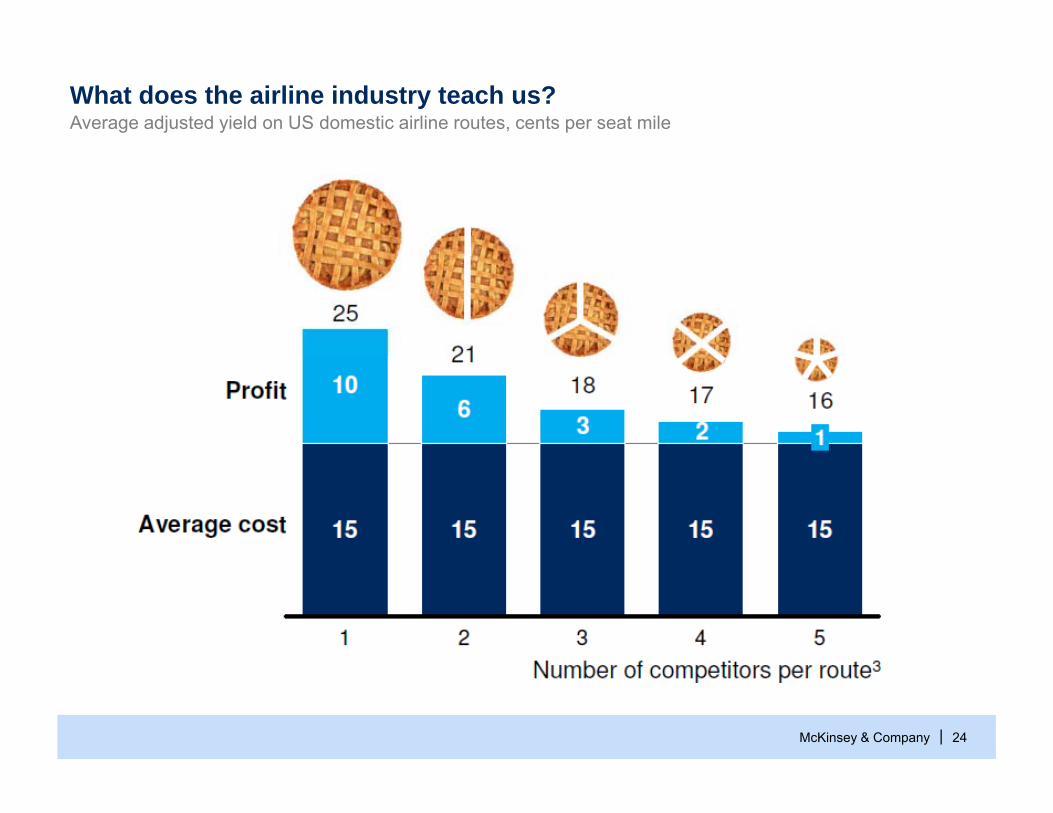
What does the airline industry teach us? Average adjusted yield on US domestic airline routes, cents per seat mile
McKinsey & Company | 24
Organized
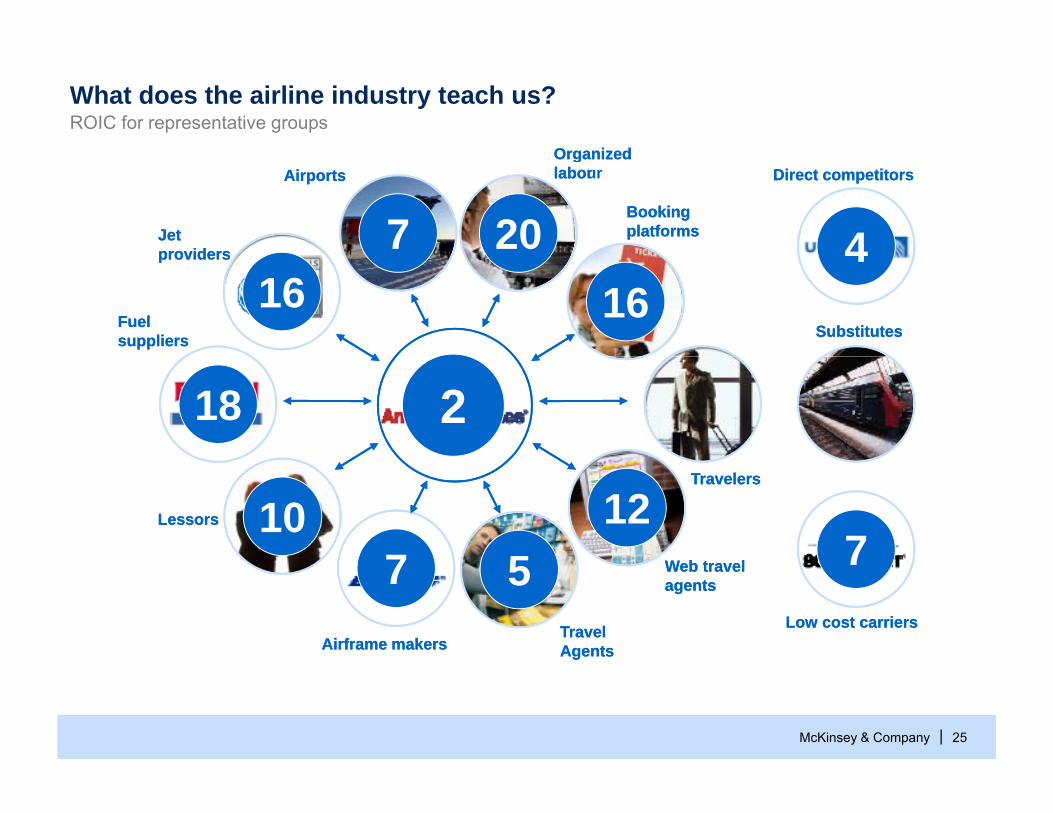
What does the airline industry teach us? ROIC for representative groups
Organized
Jet providers
Booking platforms
Organized labour Direct competitorsAirports
Jet providers
Booking platforms
Organized labor Direct competitorsAirports
207 4providers
Fuel suppliers Substitutes
providers
Fuel suppliers Substitutes
16 164
18 2
Lessors
Travelers
Lessors
Travelers
107 5
127
Airframe makersTravel Agents
Web travel agents
Low cost carriersAirframe makers
Travel Agents
Web travel agents
Low cost carriers
7 5 7
McKinsey & Company | 25
gg

Glass half full or half empty?
McKinsey & Company | 26