friedel–crafts acylation as a quality control assay for steroids
TRANSCRIPT

Volume 57, Number 7, 2003 APPLIED SPECTROSCOPY 7910003-7028 / 03 / 5707-0791$2.00 / 0q 2003 Society for Applied Spectroscopy
Friedel–Crafts Acylation as a Quality Control Assay forSteroids
JOE STUDER, NEIL PURDIE,* and JUSTIN A. KROUSEDepartment of Chemistry, Oklahoma State University, Stillwater, Oklahoma 74078-0447
The rapid Friedel–Crafts chromogenic acylation of alkene groupsat ambient temperatures using a 25:1 mixture of 98% acetyl chlo-ride and 70% perchloric acid is shown to have all the propertiesneeded to serve as a potential quality control reagent that can beused to routinely discriminate among steroid analogs. Although os-tensibly a non-selective reagent, from these and prior applicationson terpenes and polyunsaturated acid esters, it is seen that the re-action is capable of discriminating bewteen geometric isomers andeven enantiomers. The selectivity towards acylation of the a- overthe b-position at C-17 makes the method adaptable to screening foranabolic steroids. Reactions at that position produce the more un-usual results, including a positive color reaction for a-methyltestos-terone even though there is no alkene functional group in the vicin-ity of C-17. For molecules with more than one alkene, concurrentacylations are independent one from the other and, in the absenceof any interference s, their spectral properties are found to be ad-ditive.
Index Headings: Friedel–Crafts reactions; Alkene acylations; Ste-roids; Color derivatizations; Broad-band absorbance detection;Spectral evolutions with time as an option for screening for steroids.
INTRODUCTION
The screening for and measurement of steroids is amajor industry stretching to include the agricultural, clin-ical, forensic, health, and nutritional sciences.1–6 It hasattracted innovative developments that cover the fullgamut of analytical procedural techniques from elemen-tary spot tests, to immunoassays, to sophisticated chro-matographic separation techniques, and to UV-vis, � uo-rescence, infrared (IR), nuclear magnetic resonance(NMR), and mass spectrometry (MS) spectroscopic pro-cedures. The work in this article is an expansion uponthe UV-vis absorbance detection option. An experimentalprocedure is described that is a simple, routine, directchemical color test with a broad discriminatory base thatincludes distinguishing among structural and geometricisomers and, in a few instances, between enantiomers.
Chromogenic derivatization reactions can be classi� edas either direct, in which the analyte itself is integral tothe color development step, or indirect, in the sense thata by-product of the reaction with the analyte is involvedin a subsequent step in which the color intensity is stoi-chiometrically related to the amount of analyte. The twoclassi� cations can be described using assay proceduresfor cholesterol, a steroid that drew considerable interestbecause of its clinical signi� cance to heart disease andatherosclerosis in particular. The � rst recorded directchemical tests for cholesterol are attributed to Lieber-mann7 and Burchard.8 Others followed over the interven-
Received 1 January 2003; accepted 25 February 2003.* Author to whom correspondence should be sent. U.S. and European
patents applied for.
ing years.9–15 Visible absorbance spectra can be measured,but typically only data at the 620-nm maximum are usedfor quantitation in routine test procedures. Experimentalconditions for direct methods in general are consideredhostile with extra risks making them unsuitable for rou-tine applications. Although the test was discontinued asan option for routine serum cholesterol tests, a modi� edform of the original Abell–Kendall method,16 that usesthe Liebermann–Burchard reaction as the color inductionstep, was ordained by the Center for Disease Control(CDC) to be the primary standard method for serum cho-lesterol.
Routine assays are made less hostile by using enzyme-based procedures, e.g., the Allain method for serum cho-lesterol.17 The color is the result of a reaction of H2O2, abyproduct of the enzymatic oxidation of cholesterol, withan auxiliary reagent to form a quinonimine dye.18 Againan absorbance value measured at a single wavelength isthe basis for the total serum cholesterol determination.The test is subject to several interference factors and hasabsolutely no analytical discriminatory potential.
A factor inherent to direct chemical methods is theirpotential to discriminate among structurally related ana-logs by virtue of signi� cant, even characteristic, differ-ences in the full absorbance spectra for the individuals inthe series. This was demonstrated in a prior article for aseries of structurally related terpenes and a series of poly-unsaturated fatty acid (PUFA) esters.15 A common linkfor these two series to be included in a single study wasthe multiplicity in the number of ole� nic bonds. The onlyheteroatom was oxygen, present in an occasional ketone,alcohol, or carboxylic acid functional group. The directchemical derivatization was done via a Friedel–Crafts(FC) alkene acylating reagent, composed of a 25:1 binarymixture of 98% acetyl chloride (AC) and 70% perchloricacid (PA). The resultant colors varied from pale yellowto bright orange as the extent of polyunsaturation in-creased either with or without conjugation. Discriminat-ing among all of the analytes was accomplished fairlyeasily using only visual comparisons of differences in theraw absorbance data from spectra measured over thewavelength range from 350–650 nm. That analytical dif-ferentiation that can be achieved using a direct methodis a signi� cant advantage over enzyme-based indirectmethods that are limited by the selectivity of the partic-ipating enzymes. That an ostensibly non-selective ana-lytical reagent could discriminate among geometric iso-mers was an unexpected bonus.
With these goals in mind, the same reagent system wasapplied to a series of steroids. Because of their inherentlyrigid structures, the series offered additional discrimina-tory challenges that would be the basis for testing how

792 Volume 57, Number 7, 2003
¬
FIG. 1. Molecular structures for (1) cholesterol and its esters: (2) stig-masterol; (3) dihydrocholesterol; (4) 7-dehydrocholesterol; (5) a- andb-estradiols; (6) ergosterol; (7) stanozolol; (8) ergocalciferol; (9) noreth-ynadrel; (10) diosgenin; (11) testosterone; (12) 17-a-methyltestosterone;(13) 4-cholesten-3-one; (14) 5-cholesten-3-one; (15) 5-cholesten-3b-ol-7-one; (16) progesterone; (17) prednisone; (18) hydrocortisone; and (19)prednisolone.
general or how broad this chemical chromogenic reactionprocedure might be to use for the screening and qualitycontrol of unsaturated natural products, particularly lip-ids.
MATERIALS AND METHODS
Reagents. Based upon the success levels of analyticaldifferentiations achieved with the 25:1 AC/PA mixture inprior work,15 the same reagent was the primary choicefor this study, although the alternative AC with zinc ac-etate reagent, used on the terpenes and PUFAs, was alsoinvestigated for a number of the steroids. The AC andPA were both Sigma-Aldrich products. As the library ofalkenes increases in number in the future, alternative re-agents should not be overlooked as possible alternates.Stock solutions were prepared using spectroscopic-gradechloroform (Aldrich).
Analytes. The 25 steroid analytes chosen for the studywere cholesterol; cholesteryl acetate; cholesteryl chlo-ride; cholesteryl myristate; cholesteryl nonanoate; cho-lesteryl oleate; 7-dehydrocholesterol; dihydrocholesterol;stigmasterol; ergosterol; ergocalciferol (vitamin D2), di-osgenin; stanozolol; 17-a-estradiol; 17-b-estradiol; tes-tosterone; 17-a-methyltestosterone; 4-cholesten-3-one; 5-cholesten-3-one; 5-cholesten-3-ol-7-one; hydrocortisone;norethynadrel; prednisolone; prednisone; and progester-one. All were reagent-grade Sigma-Aldrich products. Forconvenient reference, their chemical structures are repro-duced in Fig. 1.
Procedure. Stock solutions were prepared at a con-centration of 0.02 M in chloroform. For an analysis, a 10mL volume aliquot of stock is placed in a 13 3 100 mmglass culture tube to which 1.0 mL of AC is added. A 40mL volume aliquot of PA (or a 0.10 g mass aliquot inthe case of ZnA) is then added to catalyze the reaction.Quantities were dictated by the con� guration of the spec-trophotometer cuvette but can be considerably reduced toa size that would be more practical and cost effective forroutine assays. If quantities are reduced, the prescribedproportions for the respective components must be main-tained since the color reactions are sensitive to dispro-portionate changes made in the amount of any one com-ponent. Care must be exercised when adding PA to safelydissipate the thermal energy of the AC hydrolysis reac-tion. The reaction mixture is immediately transferred toa 10-mm-path-length semi-micro glass cuvette, stop-pered, and placed in the sample holder of the spectro-photometer. The amount of analyte used in a single testis 2.0 3 1027 mole. AC and PA are added sequentiallybecause a standard stock reagent containing both com-ponents has a relatively short shelf life.
Using these conditions, AC is in large molar excessover the analytes, ensuring that reactions go to comple-

APPLIED SPECTROSCOPY 793
FIG. 2. Fifteen-minute spectra for the products of the AC/PA acylationreactions with: (a) cholesterol chloride; (b) diosgenin; (c) stigmasterol;(d ) cholesterol; (e) cholesteryl acetate; (f) cholesteryl oleate; (g) cho-lesteryl nonanoate; (h) cholesteryl myristate; and (i) the stigmasterolminus the cholesterol spectrum.
FIG. 3. (A) Fifteen-minute spectra for the products of the AC/PA ac-ylation reactions with: (a) cholesteryl linoleate; (b) cholesterol 1 methyllinoleate; (c) cholesterol; and (d ) methyl linoleate. (B) Fifteen-minutespectra for the products of the AC/PA acylation reactions with: (a)cholesterol linolenate; (b) cholesterol 1 methyl linolenate; (c) choles-terol; and (d ) methyl linolenate.
tion. A virtual endpoint to the color reaction is reachedfor each analyte after 15 min and is relatively indepen-dent of the identity of the analyte.
Measurements. Absorbance measurements were madeover the wavelength range 350–800 nm, under ambienttemperature conditions, using an HP 8452A diode-arrayspectro-photometer set at a 5-s integration time and aspectral resolution of 2 nm. Instrument blank and base-line spectra were measured using fresh AC at the begin-ning of each session. Measurements were made in dupli-cate. Spectra were automatically saved on-board the in-strument for later interpretation. The information-richwavelength range extends from 350–650 nm, reducingthe total number of points used for subsequent multivar-iate analysis trials from 225 to 150 points per scan.
With an acquisition time of only 5 s, the progress ofeach color reaction could be followed kinetically by mea-suring consecutive spectra at 1-min intervals over thecourse of the 15-min reaction. Zero time is � xed as theinstant the catalyst is added. The total number of usefulexperimental variables is now 2250 per sample over the350–650 nm wavelength range. The expectation was thatby including the kinetics patterns that arise from the timedependences of the spectral responses, the discriminatorycapabilities of the general assay procedure could be fur-ther enhanced.
Calibration curves of absorbance vs. concentration arelinear over the range 0.05–0.90 absorbance units with R 2
values typically 0.980 and better. Molar absorbance val-ues range from 250–9200, with the highest values beingassociated with cholesterol and its saturated esters, andwith d-estradiol. Limits of detection are on the order of0.01–0.08 mM.
RESULTS AND DISCUSSION
Steroids with -5-ene-3b-Substituents. Spectra mea-sured at the 15-min endpoint for the color developmentin steroids are shown in a series of � gures (Figs. 2–6),beginning in Fig. 2 with the data for cholesterol, its sat-urated esters, cholesteryl chloride (Fig. 1.1), stigmasterol
(Fig. 1.2), and diosgenin (Fig. 1.10). All eight moleculeshave the -5-ene and a 3b-substituent in common. Spectralpatterns for cholesterol and its saturated esters are entire-ly equivalent under equimolar conditions, indicating thatthe alcohol and saturated ester groups in the 3b-con� g-uration do not react and therefore have no in� uence onthe relative colors from the D5-alkene acylations. The pat-tern for the chloride derivative differs only slightly, witha 4-nm shift in the 520-nm maximum and a greater in-tensity throughout. There is also a spectral correspon-dence between equimolar solutions of cholesterol (Fig.1.1) and stigmasterol (Fig. 1.2), but only over the 470–550 nm range. Since the -5-en-3b-ol is common to bothmolecules, the difference in the spectra for equimolar so-lutions must be related directly to colored products fromthe acylation of the C-17 alkene in stigmasterol. Thispresupposes that spectra from acylations of different al-kene groups are additive. That they are additive was dem-onstrated for acylations of PUFA esters15 and will be sub-stantiated later in this article. The net spectrum, whichmight eventually turn out to be the response characteristicof the AC/PA acylation of a steroid D17-alkene, is shownas Fig. 2i.
The spectrum for diosgenin (Fig. 1.10) does not con-form in any way with the general format of the others(Fig. 2b). How this might be attributed to long-range ef-fects from saturated heterocyclic rings is dif� cult to com-prehend. Loss of ‘‘planarity’’ in the steroid template isthe only thought that has any margin of credibility.
Equimolar solutions of cholesterol and the cholesteryland methyl esters of the unsaturated linoleic and linolenicacids are the subjects of Figs. 3A and 3B. Superimposedon their 15-min spectra are composite spectra that aresums of the cholesterol spectrum plus the spectra formethyl linoleate and methyl linolenate, respectively, thatare reproduced from a prior study.15 The excellent cor-respondences between the actual spectra for the choles-teryl unsaturated esters and the composite spectra furthersubstantiate the fact that separate acylations are not mu-tually interfering and that the colors and the spectra are

794 Volume 57, Number 7, 2003
FIG. 4. Fifteen-minute spectra for the products of the AC/PA acylationreactions with: (a) 17-a-estradiol (at one-fourth the concentration); (b)ergosterol; (c) ergocalciferol (vitamin D); (d ) 7-dehydrocholesterol; (e)stanozolol; (f) 17-b-estradiol; and (g) dihydro-cholesterol.
FIG. 5. Difference spectra for (a) stigmasterol minus cholesterol, and(b) ergosterol minus 7-dehydrocholesterol. The spectra are representa-tive of the C-17 acylations in both stigmasterol and ergosterol. Theirdissimilarity might be a consequence of the cis-trans- isomerism dif-ference at C-17.
additive, whether they occur together either in the samemolecule or on different molecules in a mixture.
Other Sterol Types. Data for dihydrocholesterol (Fig.1.3), 7-dehydrocholesterol (Fig. 1.4), ergosterol (Fig.1.6), ergocalciferol (Fig. 1.8), the 17a and 17b-estradiols(Fig. 1.5), and stanozolol (Fig. 1.7), none of which hasonly -5-en-3b-ol substitutions, are shown in Fig. 4. Thespectrum for dihydrocholesterol (Fig. 4g) shows baselineabsorbance and is included only for the purpose of ver-ifying that unsaturation is essential. Spectra for productsfrom direct chemical reactions with conjugated alkenes,in the forms of 7-dehydrocholesterol (Fig. 4d), ergosterol(Fig. 4b), and ergocalciferol (vitamin D2, Fig. 4c), bearsome common resemblances, but the evidence suggeststhat additivity will fail when conjugation is extended orring cleavage occurs as they do in going from ergosterolto ergocalciferol, respectively.
The spectrum from the acylation of 17-a-estradiol (Fig.1.6) was so intense compared to the others that the con-centration of the test solution was reduced to one-fourth(or 5.0 3 1025 M) of the concentration used for all of theothers. Acylation of 17-b-estradiol (Fig. 1.6), on the otherhand, gives no visible color whatsoever and a ‘‘spec-trum’’ that is a little more than baseline in the 400–550nm range (Fig. 4f). There is clearly some inexplicablestereochemical advantage to acylating the 17-a-positionthat might only be revealed after a thorough study of themechanisms using other substituents besides the alcoholfunctional group. Information from past articles9,12,13 in-dicate the need for a methylene group immediately ad-jacent to the double bond in order to support a radicalintermediate in a several step mechanism, but for theisomerism around the rigid C-17 structure, there has tobe structural or directional factors that operate in additionto that simple requirement.
Stanozolol (Fig.1.7) is the only compound in the groupthat has an unsaturation that is not –C5C–. There is noparticular evidence in the spectrum that would indicatethat acylation of the –C5N– functional group has oc-curred (Fig. 4e). The single absorbance band with a max-imum at 370 nm is analogous to those observed for er-
gosterol (Fig. 1.7), etc., in Fig. 4, indicating perhaps thatthere is acylation of the alkene functional group only.
Thus far, there is the beginning of an accumulation ofspectral evidence that is enough to believe that alkenefunctional groups in the same molecule react indepen-dently and that the effects of multiple acylations are ad-ditive (see Ref. 15), and there is still another examplelater in this text. If this is generally true, net spectra forstigmasterol minus cholesterol (Fig. 2i and Fig. 5a), onthe one hand, and ergosterol minus 7-dehydrocholesterol(Fig. 5b), on the other, might be expected to be similarsince the residual unsaturation in the structure for both isthe C-17-alkene. While there is a suggestion of some re-semblance between Figs. 5a and 5b, the net spectra areactually the reverse of one another, an observation thatmight perhaps be related to the cis- vs. trans-geometrydifferences at the C-17 position in stigmasterol and er-gosterol, respectively, that supports the idea, already ob-served for the estradiols, that directional effects in� uencethe chemistry and provide a way to discriminate betweenisomers.
Sterones. Of the ten sterones selected for the study,only prednisolone (Fig. 1.19) and prednisone (Fig. 1.17)failed to produce any color response with the AC/PA re-agent, a result that might be attributable to their beingthe only compounds in the series with a di-enone struc-ture in the A-ring and a b-OH substituent at the reaction-sensitive C-17 position.
Spectra for acylation products for testosterone (Fig.1.11), 17-a-methyltestosterone (Fig. 1.12), 4-cholesten-3-one (Fig. 1.13), 5-cholesten-3-one (Fig. 1.14), hydrocor-tisone (Fig. 1.18), progesterone (Fig. 1.16), and norethy-nadrel (Fig. 1.9), all of which have a common 3-onestructure, share a common strong band that maximizes at370 nm (Figs. 6A and 6B). For testosterone (Fig. 1.11)and hydrocortisone (Fig. 1.18), that band is the only spec-tral feature and is indicative of no participation from C-17-b-OH substituents on either one. That the 4- and 5-cholesten-3-one (Figs. 1.13 and 1.14) isomers have es-sentially identical spectra was not anticipated since the4-ene is conjugated to the 3-one while the 5-ene is not.

APPLIED SPECTROSCOPY 795
FIG. 6. (A) Fifteen-minute spectra for the products of the AC/PA ac-ylation reactions with: (a) testosterone; (b) 5-cholesten-3-one; (c) pro-gesterone; (d ) 4-cholesten-3-one; and (e) hydrocortisone. (B) Fifteen-minute spectra for the products of the AC/PA acylation reactions with:(a) norethynadrel; (b) cholesten-3-ol-7-one; (c) 17-a-methyltestoster-one; and (d ) testosterone.
Both do, however, have a second band of much lowerintensity that maximizes at 520 nm. Progesterone (Fig.1.16) also has a low-intensity band with a maximum at592 nm that constitutes a distinguishing feature for itsqualitative identi� cation within the present limited poolof compounds. For 5-cholesten-3b-ol-7-one (Fig. 1.15),the spectrum is entirely different (Fig. 6B). That the com-pound does not share the strong absorbance at 370 nmlike the other 5-ene-3b-ols has to be a consequence ofthe fact that the acylation of the 5-ene group is modi� edby its being conjugated with the -7-one.
The susceptibility of C-17 a-substituents to acylationover b-substituents is manifest yet again by norethynadreland most surprisingly by 17-a-methyltestosterone (Fig.6B). That acylation of an alkyne group would producean intense color and very broad spectrum that extends toalmost 700 nm is not unexpected. Perhaps the single mostinteresting result in the entire study is the difference be-tween the spectra for 17-a-methyltestosterone and testos-terone (Fig. 6B). Because the testosterone spectrum isconsistent with the spectra for the other -5-ene-3b-ols(Fig. 6A), there is no tangible evidence to suggest thatacylation of the b-OH in testosterone is a factor in cre-ating a color. That conclusion is entirely consistent withthe observation that no color is produced when AC/PAis added to both b-estradiol and stanozolol. It has to beconcluded yet again that b-substituents at C-17 are notsusceptible to chromogenic acylation reactions.
The spectrum for 17-a-methyltestosterone (Fig. 1.11)has the strong 370-nm band typical of the -5-ene-3b-ols.However, two new major bands have appeared with max-imum absorbances at 492 and 580 nm, respectively.These bands can only be a consequence of reaction(s)that somehow involve the a-methyl group, or the a-meth-yl/b-OH groups in concert, with the methyl group servingas a possible center for a free radical. The exact overlayof the major band in the spectra of the two testosteroneanalogs is further proof that spectral features are char-acteristic of particular functional groups that are non-in-terfering and therefore additive. The spectrum that isequal to the difference in the spectra for testosterone and
17-a-testosterone derivatives would therefore be expect-ed to be characteristic of the reaction with the C-17 sub-stituent only. This could be exploited in screening forsynthetic anabolic steroids, many of which are C-17 de-rivatives of testosterone, and used as the basis for a rou-tine test to detect excessive levels of anabolic steroids inextracts of biological specimens.5 This subject is returnedto brie� y in the next section.
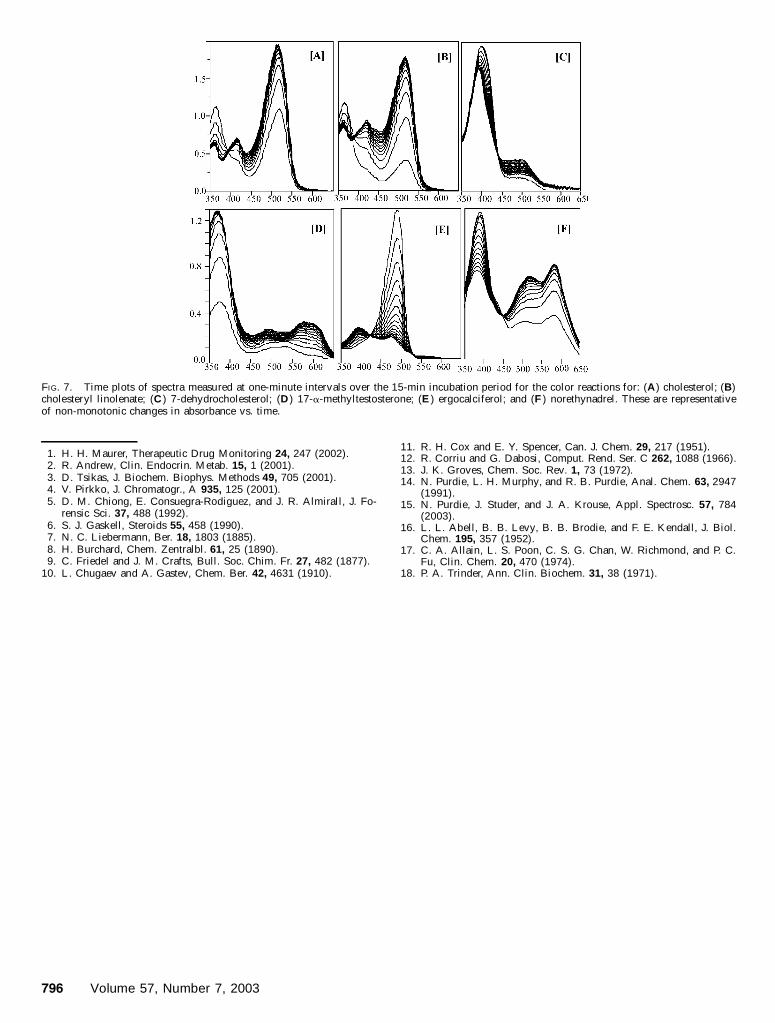
Time Plots. Changes in spectral intensities over thecolor incubation time are about equally divided betweenmonotonic and non-monotonic behaviors. There is nosingle simple structural reason for the distinction. A non-monotonic response might be more easily understood forsteroids that have more than one unsaturated center, butthere are exceptions on both sides that might be a con-sequence of multiple concurrent rather than consecutivereactions. Cholesterol and all its derivatives (Fig. 1.1),stigmasterol (Fig. 1.2), diosgenin (Fig. 1.10), ergocalcif-erol (Fig. 1.8), 7-dehydrocholesterol (Fig. 1.4), and 17-a-methyltestosterone (Fig. 1.12), constitute part of thenon-monotonic set. Six illustrations of non-monotonicbehavior are shown in Fig. 7.
Spectra for cholesterol (Fig. 7A) and its linolenate ester(Fig. 7B) show similar trends with time in the short andthe long wavelength ranges. A maximum intensity isreached for the short wavelength band after 8 min, whilethe 520 nm absorbance increases monotonically. They dodiffer in the 390–420 nm range, where the in� uence fromthe concurrent acylation of the unsaturated PUFA esterbecomes evident. Changes in the intensities with time forthe two major bands in the spectra for the diene analogs7-dehydrocholesterol (Fig. 7C) and ergocalciferol (Fig.7E) are directly opposed. The added value from usingtime-dependent data for analysis is easily seen when theinitial spectrum for ergocalciferol (Fig 7C) is comparedwith its enlarged 15-min spectrum in Fig. 4c. Time-de-pendent changes in the spectra for 17-a-methyltestoster-one (Fig. 7D) and 17-a-norethynadrel (Fig. 7F) followsimilar trends. Three distinct maxima appear at corre-sponding wavelengths for both analytes within the � rstfew minutes, yet the � nished spectra are very character-istically different. The greater � nal intensity over the450–600 nm range in Fig. 7F is attributed to continuedacylation of the ethyne group.
The broad range of kinetic response patterns repre-sented here are characteristic of speci� c steroids. Kineticsdata could conceivably be exploited for screening for ste-roids, and most especially among the 17-a-(anabolic) ste-roids.
CONCLUSION
Putting the results from this study into perspective withresults in a prior article on terpenes and PUFA esters,15
it is apparent that FC acylations, done using the AC/PAreagent under less hostile ambient conditions, is turningout to be a proli� c analytical reagent for the speciationand quantitation of unsaturation in many forms of naturalproducts. The fact that absorbance spectra created by theproducts of concurrent chromogenic FC reactions are ad-ditive could mean that future prospects for the analysisof complex mixtures will be signi� cantly simpli� ed.
796 Volume 57, Number 7, 2003
FIG. 7. Time plots of spectra measured at one-minute intervals over the 15-min incubation period for the color reactions for: (A) cholesterol; (B)cholesteryl linolenate; (C ) 7-dehydrocholesterol; (D ) 17-a-methyltestosterone; (E ) ergocalciferol; and (F ) norethynadrel. These are representativeof non-monotonic changes in absorbance vs. time.
1. H. H. Maurer, Therapeutic Drug Monitoring 24, 247 (2002).2. R. Andrew, Clin. Endocrin. Metab. 15, 1 (2001).3. D. Tsikas, J. Biochem. Biophys. Methods 49, 705 (2001).4. V. Pirkko, J. Chromatogr., A 935, 125 (2001).5. D. M. Chiong, E. Consuegra-Rodiguez, and J. R. Almirall, J. Fo-
rensic Sci. 37, 488 (1992).6. S. J. Gaskell, Steroids 55, 458 (1990).7. N. C. Liebermann, Ber. 18, 1803 (1885).8. H. Burchard, Chem. Zentralbl. 61, 25 (1890).9. C. Friedel and J. M. Crafts, Bull. Soc. Chim. Fr. 27, 482 (1877).
10. L. Chugaev and A. Gastev, Chem. Ber. 42, 4631 (1910).
11. R. H. Cox and E. Y. Spencer, Can. J. Chem. 29, 217 (1951).12. R. Corriu and G. Dabosi, Comput. Rend. Ser. C 262, 1088 (1966).13. J. K. Groves, Chem. Soc. Rev. 1, 73 (1972).14. N. Purdie, L. H. Murphy, and R. B. Purdie, Anal. Chem. 63, 2947
(1991).15. N. Purdie, J. Studer, and J. A. Krouse, Appl. Spectrosc. 57, 784
(2003).16. L. L. Abell, B. B. Levy, B. B. Brodie, and F. E. Kendall, J. Biol.
Chem. 195, 357 (1952).17. C. A. Allain, L. S. Poon, C. S. G. Chan, W. Richmond, and P. C.
Fu, Clin. Chem. 20, 470 (1974).18. P. A. Trinder, Ann. Clin. Biochem. 31, 38 (1971).