frida fyhr, Åsa nilsson, antonia nystrÖm sandman a … · f. , fyhr, Å. , nilsson , a. ,...
TRANSCRIPT
F., Fyhr, Å., Nilsson, A., Nyström Sandman A review of Ocean Zoning tools and Species distribution modelling methods for Marine Spatial Planning
1
FRIDA FYHR, ÅSA NILSSON, ANTONIA NYSTRÖM SANDMAN
A REVIEW OF OCEAN ZONING TOOLS AND SPECIES DISTRIBUTION MODELLING METHODS FOR MARINE SPATIAL PLANNING

F., Fyhr, Å., Nilsson, A., Nyström Sandman A review of Ocean Zoning tools and Species distribution modelling methods for Marine Spatial Planning
2
FRIDA FYHR (AQUABIOTA WATER RESEARCH), ÅSA NILSSON (AQUABIOTA WATER
RESEARCH), ANTONIA NYSTRÖM SANDMAN (AQUABIOTA WATER RESEARCH),
A review of Ocean Zoning tools and Species dis-
tribution modelling methods for Marine Spatial
Planning
Disclaimer
The analysis is produced in the frame of the LIFE+ Nature & Biodiversity pro-ject “Innovative approaches for marine biodiversity monitoring and assess-ment of conservation status of nature values in the Baltic Sea” (Project acro-nym -MARMONI). The content of this publication is the sole responsibility of the Baltic Environmental Forum and can in no way be taken to reflect the views of the European Union.
Prepared with a contribution from the LIFE financial instrument of the Europe-an Community, Latvian Environmental Protection Fund and Estonian Environ-mental Investment Centre.
May 2013

F., Fyhr, Å., Nilsson, A., Nyström Sandman A review of Ocean Zoning tools and Species distribution modelling methods for Marine Spatial Planning
3
Contents
1 Introduction ................................................................................................ 4
2 Species distribution modelling .................................................................... 6
2.1 Predicting species distribution .............................................................. 6
2.2 Methods for species distribution modelling ........................................... 7
2.2.1 GLM and GAM ................................................................................ 7
2.2.2 CART ............................................................................................. 8
2.2.3 Random forest ............................................................................... 8
2.2.4 MAXENT ........................................................................................ 8
2.2.5 Multivariate methods for community data .................................... 9
2.3 Model evaluation .................................................................................. 9
3 Ocean Zoning in Marine Spatial Planning .................................................. 10
3.1 Decision support tools ......................................................................... 10
3.1.1 Atlantis ......................................................................................... 11
3.1.2 Cumulative Impacts Assessment Tool .......................................... 13
3.1.3 Integrated Valuation of Ecosystem Services and Tradeoffs
(InVEST) ..................................................................................................... 14
3.1.4 Marine Protected Areas Decision Support Tool (MarineMap) ....... 15
3.1.5 Marxan & Marxan with Zones ....................................................... 16
3.1.6 NatureServe Vista ......................................................................... 17
3.1.7 Zonation ....................................................................................... 18
3.2 Discussion ............................................................................................ 19
3.3 Conclusions .......................................................................................... 21
4 Acknowledgements ................................................................................... 21
5 References ................................................................................................ 22

F., Fyhr, Å., Nilsson, A., Nyström Sandman A review of Ocean Zoning tools and Species distribution modelling methods for Marine Spatial Planning
4
1 Introduction The marine environment has since prehistoric times been used as a critical pro-
vider of food and resources and as a means of waste disposal (MEA 2005, Kidd
2011). With a growing global population, anticipating to peak around 9 billion
in 2050, humanity’s relationship and dependency of upon the sea and the wide
array of ecosystem services it provides are bound to increase in the future as
well as the footprint of human activities (MEA 2005, Kidd 2011). Consequently,
coastal and marine ecosystems suffer from pressures of increased use, climate
change, natural hazards and erosions (MEA 2005, EC 2012) and are in many
places subjected to more rapid change than ever in their history (MEA 2005).
Further, their possibility to cope with rapid change, i.e. their resilience, decreases
due to biodiversity loss (Worm et al. 2006). In order to secure sustainable
growth and preserve coastal and marine ecosystems for future generations an
integrated and coherent management is required (EC 2012, Day 2002). In the
Marine Strategy Framework Directive (MSFD) the European Commission (EC)
stress the importance of an ecosystem-based approach to the management of
human activities while enabling a sustainable use of marine goods and services
in order to achieve or maintain good environmental status (GES) of the marine
environment, as well as to continue its protection and preservation, and to pre-
vent subsequent deterioration (EC 2008). The ecosystem approach (EA) recog-
nizes the need to handle conservation and environmental issues from an inte-
grated perspective, for which closely combined interconnected economic and
social considerations are crucial (Kidd 2011). Further, ecosystem-based man-
agement implies that the needs of the ecosystem are prioritized; starting with a
view of the ecosystem requirements before addressing human needs (Kidd
2011). To further address the goals set by the MSFD, in 2012 the EC established
a proposal for a framework for the effective application of Marine Spatial Plan-
ning (MSP) and Coastal Management (CM), again highlighting an ecosystem-
based approach to marine and coastal management (EC 2012). The framework
states that all EU Member States will be required to develop and implement co-
herent processes to plan human uses of maritime space and to ensure sustaina-
ble management of coastal areas. Today, most management of ocean resources
for human activities is usually done on a sector-to-sector, case-by-case basis
(Fernandes et al. 2005; Halpern et al. 2008a, Ehler and Douvere 2009) without
much consideration of effects either on human activities or the marine environ-
ment (Ehler and Douvere 2009). Consequently, this has led to conflicts both
among different human uses as well as between human uses and the marine
environment (Ehler and Douvere 2009). Since all these sectors are interconnect-
ed they should also be managed together, i.e. as in ecosystem-based manage-
ment (EBM), to yield a sustainable result. The central part of EBM is to restore
and maintain the ecosystem services (Rosenberg & McLeod 2005; McLeod et al.
2005). For instance, terrestrial sources are responsible for almost 80 percent of
the pollutant load reaching the oceans (Agardy 2010), highlighting the im-
portance of integrating several sectors when managing ocean resources. Addi-
tionally, much of the fisheries management focuses on population metrics for
single species instead of considering the factors affecting the population size
(Halpern et al. 2008b). It is neither enough to consider single activities that af-
fects the environment since activities can interact and lead to more severe ef-
F., Fyhr, Å., Nilsson, A., Nyström Sandman A review of Ocean Zoning tools and Species distribution modelling methods for Marine Spatial Planning
5
fects. Halpern et al. (2008a) further explain different ways in which activities can
interact, and how this can be accounted for.
Protected areas (MPAs) are one of the most efficient ways to prevent biodiversi-
ty loss (Possingham et al. 2006), hence they are a keystone of most conservation
strategies (Soulé 1991). They range from “paper parks” (i.e. the conservation
laws that the environment conservation areas are bound to force are non-
existent), to multiple-use areas with varying degrees of protection, or no-take
areas (Hughes et al., 2003). The functions of MPAs for modern conservation are:
(i) conserving marine biodiversity; (ii) maintaining productivity; and (iii) contrib-
uting to social and economic wellbeing (McManus et al. 1998). To fulfil these
functions, the planning of MPAs needs to incorporate their location in relation
to biological and physical patterns, but also factors such as connectivity, size,
replication, alignment of boundaries to e.g. watersheds (Margules & Pressey
2000), disturbance and present use. Additionally, it must not be neglected that
protection of biodiversity whilst providing for reasonable use is required in or-
der to achieve effective management (Day 2002). MSP offers a way to address
conflicts and select appropriate management strategies to maintain and safe-
guard necessary ecosystem services (Ehler and Douvere 2009). Ocean zoning is
not synonymous with, but a central component of MSP (Agardy 2010). It is basi-
cally a spatial planning tool that acts similar to a town planning scheme (Day
2002) and is used to implement marine spatial plans by using a set of regulatory
measurements that specify allowable uses in all areas of target ecosystems
(Agardy 2010). Marine spatial planners can use ocean zoning to integrate man-
agement of different activities, which often improves management at ground
level (Agardy 2010). The integration of different activities can with advantage be
done by using a decision support tool.
Further, spatial predictions of species distribution are a significant part of con-
servation planning (Austin, 2002), as ecological modelling might be a tool to lo-
cate the overlap between the ecosystems that people want and the ecosystems
that can be obtained (Carpenter & Gunderson, 2001). The development of
models that makes it possible to use environmental factors to predict ecological
variables is a desirable goal, as it would increase our ability to manage resources
in a sustainable way (Ellis et al. 2006). The quantification of species–environment
relationships is the most important aspect of predictive geographical modelling
in ecology (Guisan and Zimmermann 2000). The models are generally based on
various hypotheses as to how environmental factors control the distribution of
species and communities (Guisan & Zimmermann, 2000). The goal of species
distribution models is to make detailed predictions by relating presence or
abundance of species to environmental predictors (Elith et al., 2006). The selec-
tion of predictors depends on the ecological and biophysical processes thought
to influence the distribution of the biota, as well as the purpose of the model
(Austin 2007). A greater understanding of life-history characteristics, density in-
formation and biotic interactions could potentially lead to the development of
more sensitive models of species distributions (Ellis et al. 2006). To use predic-
tions of species distributions as input for management decisions, we must
choose the environmental variables with great care.
Since there exist a vast number of technical possibilities for both species distri-
bution modelling (SDM) and decision support tools for ocean zoning, this re-
view seeks to provide its readers with an overview of some of them. We also
discuss the usefulness of different decision support tools for ocean zoning in

F., Fyhr, Å., Nilsson, A., Nyström Sandman A review of Ocean Zoning tools and Species distribution modelling methods for Marine Spatial Planning
6
the LIFE+ Nature & Biodiversity project “Innovative approaches for marine bio-
diversity monitoring and assessment of conservation status of nature values in
the Baltic Sea” (Project acronym -MARMONI).
2 Species distribution modelling
2.1 Predicting species distribution The purpose of species distribution modelling (SDM) is to statistically relate em-
pirical data on the spatial distribution of a species or habitat type (or any other
response variable) to one or more environmental variables, thereby providing a
basis for predictive mapping of species or biodiversity on a regional scale (Elith
et al. 2006; Ferrier and Guisan 2006). The response can be measured as e.g.
presence only (common in e.g. herbarium collections) presence/absence, per-
cent cover or biomass. If the response is based on community data, it could be
species composition or biodiversity indices. The statistical relationship can be
used to predict the cover or occurrence of the response variable at locations
where no measurements have been made. Spatial distribution models of species
usually focus on predictors available as maps or interpolated layers, as the spa-
tial distribution of the cover or probability of occurrence thus can be predicted
for a whole area. The resulting prediction can be used in GIS to estimate e.g. the
probability of presence, biomass or frequency of a species for each grid cell of
the input maps.
Lehmann, Overton, & Leathwick (2002) and Lehmann, Overton, & Austin (2002)
listed a number of criteria that methods used for making spatial predictions
should meet:
i. Meaningfulness: the model should be precise and ecologically sensible
ii. Generality: They should be able to deal with a wide variety of attributes
that need to be predicted.
iii. Objectivity: They should be data-defined and robust, in order to make
predictions in an objective manner.
iv. Standardisation: They need to produce uniform results that can be ex-
pressed in a spatial framework.
Both species and environmental data are usually sampled during a limited peri-
od of time and/or in limited spatial context (Guisan and Thuiller 2005). Ecologi-
cal organisation is however a result of the interaction of structures and process-
es that operate at different scales (Peterson 2000). For example, the general cir-
culation models used for climate prediction operate on a much larger spatial
and temporal scale than biotic interactions (Figure 1). To develop predictive
models that are useful for management, in that they allow us to respond to the
observed or predicted change, we must combine the different scales (Levin
1992).

F., Fyhr, Å., Nilsson, A., Nyström Sandman A review of Ocean Zoning tools and Species distribution modelling methods for Marine Spatial Planning
7
Micro Site Local Regional Country Continental Global
<10m 1-1000m
1-10km 10-200km 200-2000km 2000-10000km >10000km
Climate
Habitat
Biotic inter-actions
Figure 1. Processes that control species distribution on different scales. Inspired by
Pearson and Dawson (2003) and McGill (2010).
2.2 Methods for species distribution modelling Frequently used methods for the analysis of individual species include general-
ized linear models, GLM (McCullagh and Nelder 1989), generalized additive
models, GAM (Hastie & Tibshirani, 1986; 1990) and classification and regression
trees, CART (Breiman et al. 1984) and Random Forests (Breiman 2001). There are
also methods that use presence data only like the Maximum Entropy method,
Maxent (Phillips et al. 2004, 2006). Ordination methods are widely used for
community analysis (ter Braak and Prentice 1988; Kent and Coker 1992; Legen-
dre and Legendre 1998; Clarke and Warwick 2001).
2.2.1 GLM and GAM Generalized linear models (GLM) are a generalisation of least square regression
that do not force data into unnatural scales, and thereby allow for non-linearity
and non-constant variance structures in the data (Hastie & Tibshirani, 1990).
GLMs are based on a link function, which is an assumed relationship between
the mean of the response variable and the linear combination of the explanato-
ry variables, and data may be assumed to be from several families of probability
distributions. GAMs are non-parametric extensions of GLMs. While GLMs allow
the application of classical regression to extend into non-normal statistical dis-
tributions, the GAM analysis uses non-parametric, data-defined smoothers to fit
non-linear response curves. GAMs also use a link function, but in this case it de-
scribes the relationship between the mean of the response variable and a
smoothed function of the explanatory variables instead of a linear combination
(for review c.f. Guisan et al., 2002; A. Lehmann et al., 2002; Elith et al., 2006).
GAMs are sometimes referred to as data-driven rather than model-driven, be-
cause the data itself is used to determine the shape of the response curves, ra-
ther than assuming some form of parametric relationship. GAMs are able to
deal with non-linear relationships between the response and the explanatory
variables (Guisan et al., 2002) and allow a wider range of response curves to be
modelled than GLMs, which are not always flexible enough (Yee & Mitchell,
1991). GLMs generate a formula that can be used directly in GIS using map al-
gebra, whereas GAMs require more sophisticated methods such as lookup ta-
bles to translate the outcome into spatial predictions. One such method is
GRASP (generalized regression analysis and spatial prediction). It is a modelling
tool, that first model a species’ realised environmental niche based on the input
data, and then it predicts its spatial distribution into geographical space (Leh-
F., Fyhr, Å., Nilsson, A., Nyström Sandman A review of Ocean Zoning tools and Species distribution modelling methods for Marine Spatial Planning
8
mann et al. 2003). The response curve of species can only be properly deter-
mined if the sampled environmental gradient clearly exceeds the upper and
lower limits of the species occurrence (Austin 2007). As GLMs and GAMs model
the realised niche, i.e. where the species exists, rather than the possible distribu-
tion expressed by the fundamental niche (Austin 1985; Guisan et al. 2002), the
models can not easily be extrapolated outside the limits set by the environmen-
tal data that were used to build the model. Thus, using these models to predict
outside the environmental range found in the input data, in either space or
time, must be subject to great care (Lehmann et al. 2003; Elith et al. 2010)
While these techniques are not new, they have rarely been applied to marine
systems (Ellis et al. 2006). However, in very recent years, a number of marine
species distribution models have been published (e.g. Bekkby et al. 2008; Soldal
et al. 2009; Sundblad et al. 2009; Snickars et al. 2010) + Nyström Sandman et al
2012 indicating that these techniques now are becoming commonly used also
for marine applications.
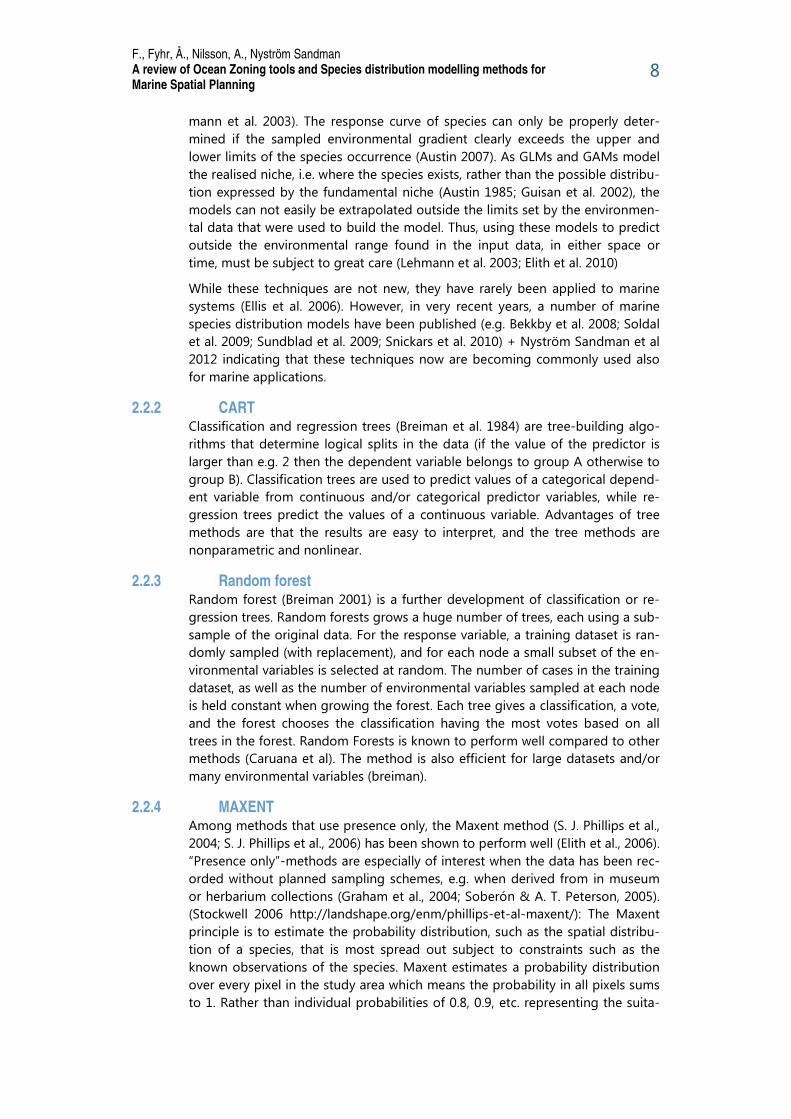
2.2.2 CART Classification and regression trees (Breiman et al. 1984) are tree-building algo-
rithms that determine logical splits in the data (if the value of the predictor is
larger than e.g. 2 then the dependent variable belongs to group A otherwise to
group B). Classification trees are used to predict values of a categorical depend-
ent variable from continuous and/or categorical predictor variables, while re-
gression trees predict the values of a continuous variable. Advantages of tree
methods are that the results are easy to interpret, and the tree methods are
nonparametric and nonlinear.
2.2.3 Random forest Random forest (Breiman 2001) is a further development of classification or re-
gression trees. Random forests grows a huge number of trees, each using a sub-
sample of the original data. For the response variable, a training dataset is ran-
domly sampled (with replacement), and for each node a small subset of the en-
vironmental variables is selected at random. The number of cases in the training
dataset, as well as the number of environmental variables sampled at each node
is held constant when growing the forest. Each tree gives a classification, a vote,
and the forest chooses the classification having the most votes based on all
trees in the forest. Random Forests is known to perform well compared to other
methods (Caruana et al). The method is also efficient for large datasets and/or
many environmental variables (breiman).
2.2.4 MAXENT Among methods that use presence only, the Maxent method (S. J. Phillips et al.,
2004; S. J. Phillips et al., 2006) has been shown to perform well (Elith et al., 2006).
“Presence only”-methods are especially of interest when the data has been rec-
orded without planned sampling schemes, e.g. when derived from in museum
or herbarium collections (Graham et al., 2004; Soberón & A. T. Peterson, 2005).
(Stockwell 2006 http://landshape.org/enm/phillips-et-al-maxent/): The Maxent
principle is to estimate the probability distribution, such as the spatial distribu-
tion of a species, that is most spread out subject to constraints such as the
known observations of the species. Maxent estimates a probability distribution
over every pixel in the study area which means the probability in all pixels sums
to 1. Rather than individual probabilities of 0.8, 0.9, etc. representing the suita-

F., Fyhr, Å., Nilsson, A., Nyström Sandman A review of Ocean Zoning tools and Species distribution modelling methods for Marine Spatial Planning
9
bility of each pixel for a species, the probabilities are each very small. To get
around this, Maxent assigns a “cumulative” probability to each pixel which is the
sum of the probabilities for all pixels with lesser probability.
2.2.5 Multivariate methods for community data Generally, the focus of predictive distribution modelling has been on individual
species, but the relationships between species and environment can also be
modelled using community data (De'ath 2002; Ferrier and Guisan 2006) (ter
Braak and Prentice 1988; Kent and Coker 1992; Legendre and Legendre 1998;
Clarke and Warwick 2001). Spatial modelling of biodiversity at the community
level may be a better choice when large numbers of species are of included. The
changes in the community composition or the species richness might reflect an-
thropogenic disturbances better than analysis using only a single species. The
community approach increases the possibility to detect environmental respons-
es of rare species (Ferrier and Guisan 2006). In order to predict multivariate re-
sponses several species predictions can be summed to obtain community com-
position or species richness (Lehmann, Overton, & Leathwick, 2002). Other
methods are multivariate regression trees, MRT (De'ath 2002), Multivariate
adaptive regression splines, MARS (Friedman 1991) and Boosted Regression
Trees, BRT (Leathwick et al., 2006c). Multivariate regression trees (MRT) is an ex-
tension of univariate regression trees, where the univariate response is replaced
by a multivariate response. MRT analyses community data, and makes no as-
sumptions about the form of relationships between species and their environ-
ment. (De'ath, 2002). Multivariate adaptive regression splines, MARS, fits a mod-
el describing relationships between multiple species and their environment. This
allows a model to be fitted that simultaneously relates variation in the occur-
rence of all species to the environmental predictors in one analysis. It is a tech-
nique in which non-linear responses between species and an environmental
predictor are described by linear segments. The slope of the segments and
breaks between them are defined by a model that initially over-fits the data, and
which is then simplified to identify terms to be retained in the final model
(Friedman, 1991; Leathwick et al., 2006a). In boosted regression trees (BRT), an iterative process progressively add trees, while re-weighting the data poorly
predicted by the previous tree. Simple trees, fitted in a forward, stagewise fash-
ion leads up to the final BRT model (Leathwick et al., 2006, Elith et al., 2008).
2.3 Model evaluation Validation of models can be internal or external. In internal validation, a sub-
sample of the data used in the analysis is then used to validate the model. Ex-
ternal validation is based on datasets not used in the modelling process. The
statistical relationship fitted in the model is used to predict the response in the
points of the external dataset, based on the information in the environmental
variables. The difference between the prediction and the actual data is then
evaluated. Uncertainty, expressed as e.g. confidence intervals or prediction error,
could be visualised as part of a suite of maps describing species distribution and
used to inform decision-makers about error (Elith et al. 2002).
The outcome of most presence/absence models is a probability of the species
to be present at a specific location. In a presence/absence model there are two
possible prediction errors: false positives, i.e. true absences that are classified as
presences (Type I error), and false negatives which are actual presences that are

F., Fyhr, Å., Nilsson, A., Nyström Sandman A review of Ocean Zoning tools and Species distribution modelling methods for Marine Spatial Planning
10
classified as absences (Type II error) (c.f. Fielding & Bell, 2002). AUC is an evalua-
tion method that gives the goodness-of-fit of the model regardless of threshold
for presence/absence, and the values can be interpreted as the probability that,
when a site where a species is present and a site where the species is absent are
drawn at random from the population, the presence site will have a higher pre-
dicted value than the absence site (Zweig & Campbell, 1993; Elith et al., 2006).
Statistical evaluation is of importance to find the best model, but the models
have to be ecologically reasonable. Thus, the shape of the response curves and
their interpretability, as well as the resulting spatial predictions, has to be con-
sidered as well (Maggini et al. 2006).
2.4 Discussion In a comprehensive comparison of methods by Elith et al. (2006) using presence
only data, MAXENT turned out to be among the top performing modelling ap-
proaches. Among the methods with univariate response using both presences
and absences, GAM, GLM and Random Forest have shown to perform well. For
comparisons see for example Elith et al. (2006) and Reiss et al. (2011). In Ran-
dom Forest it is also possible to use a response variable containing multiple
classes. GAM, MAXENT and Random Forest also have been successfully used in
assemble modelling (Bergström et al., 2013). For multivariate data, BRT (see Elith
et al., 2006) and MARS (see Reiss et al., 2011) both perform well. Depending on
the issue at hand, output from all these models could be used as an input for
ocean zoning tools.
3 Ocean Zoning in Marine Spatial Planning Ocean zoning should be based, not only on conservation targets but, on socio-
economic considerations (Teh & Teh 2011). This can be done by incorporating
human uses early in the progress, e.g. by optimization algorithms (Teh & Teh
2011). The decision support tool must be able to: (i) combine quantitative and
qualitative variables; (ii) handle estimates and uncertainties in human judge-
ment; and (iii) be easy to use and attractive for both stakeholders and managers
(Teh & Teh 2011). Teh & Teh (2011) argues that these criteria are not always
met in the decision support tools, since many of them use Boolean operators
which only deal with true and false scenarios. Nevertheless, the social and politi-
cal decisions of which areas to protect are complicated by the tradeoff between
the economic and the biodiversity value of certain areas. The tradeoff between
biodiversity gain and opportunity costs can be incorporated in the model or
managed with other software, e.g. Target (Margules & Pressey 2000; Faith &
Nicholls 1996). This tradeoff is an important step in the planning process in or-
der to make the result sustainable.
3.1 Decision support tools As mentioned above, systematic conservation planning is effective since it
reaches conservation goals by including limited resources (Margules & Pressey
2000). Additionally, it challenges land uses and allows for review and adaption
(Margules & Pressey 2000). The tools described below all aims to reduce con-
flicts between different activities and between the activities and the ecosystems

F., Fyhr, Å., Nilsson, A., Nyström Sandman A review of Ocean Zoning tools and Species distribution modelling methods for Marine Spatial Planning
11
and in that way make marine space and resources more efficiently used (Cole-
man et al. 2011). In order to achieve this, the tools must be able to:
i. incorporate data from ecological, economic and social systems;
ii. incorporate ecological data produced through species distribution
modelling
iii. incorporate ecological element’s sensitivity to activities;
iv. assess management alternatives and trade-offs in a transparent manner;
v. involve stakeholders; and
vi. assess development to management objectives
Seven tools that suit these criteria were found: Atlantis, Cumulative impacts as-
sessment tool, Integrated Valuation of Ecosystem Services and Tradeoffs (In-
VEST), Marine Protected Areas Decision Support Tool (MarineMap), Marxan &
Marxan with Zones, NatureServe Vista and Zonation. Below each tool is de-
scribed shortly (in alphabetical order), and thereafter compared more in detail in
the discussion.
3.1.1 Atlantis Atlantis was developed by the Commonwealth and Industrial Research Organi-
sation (CSIRO), Marine and Atmospheric research. It was made as an ecosystem
simulation model which considers the biophysical, economic and social parts of
the ecosystem (Link et al. 2010). It is based on the Management Strategy Eval-
uation (MSE) approach (Link et al. 2010), which aims to provide the decision
maker with information upon which the decision can be based and not a deci-
sion in itself (Smith 1994). Atlantis has a sub-model for each step in the man-
agement cycle; the marine environment, industrial activities, monitoring and as-
sessment processes of fishery, management actions and implementation, Figure
2 (http://www.csiro.au/science/ps3i4#a1 21/5-12). It includes dynamic, two-way
coupling of all these system components. The modelling framework includes
many alternative model formulations for each major process and model com-
ponent included. The formulation is application-specific decision made by the
user, who has the freedom to set complexity at any desired level (Fulton 2011).
It has mostly been applied in the temperate regions of the USA and Australia
(http://www.csiro.au/science/ps3i4#a1 21/5-12), and has mostly been used in
fisheries management, but can also handle questions related to marine biodi-
versity, habitat and nutrients (Coleman et al. 2011).

F., Fyhr, Å., Nilsson, A., Nyström Sandman A review of Ocean Zoning tools and Species distribution modelling methods for Marine Spatial Planning
12
Figure 2. Atlantis model structure - based on the management strategy evaluation cycle (http://atlantis.cmar.csiro.au/ 29/5-13).
Atlantis makes is possible to test depictions of complex ecosystems against
management policies and assessment methods. It incorporates ecological,
chemical, physical and fisheries dynamics. There are also sub-models that simu-
late marine ecosystem dynamics in terms of hydrographical processes such as
nutrient fluxes, biogeochemical factors, food web relationships, habitat interac-
tions and fishing fleet behaviour (Coleman et al. 2011). The ecological and fish-
ing fleet dynamics models are flexible in the sense that different functional rela-
tionships are available for selection (Coleman et al. 2011).
The main ecological processes modelled with Atlantis are production, consump-
tion, predation, migration, recruitment, mortality, habitat dependency and waste
production (atlantis.cmar.csiro.au 11/5-12). The food web relationships are in
general modelled at the functional group level, where invertebrates embody bi-
omass pools and vertebrates are represented by an explicit age-structured for-
mulation (Link et al. 2010). The physical environment is represented by a set of
linked polygons matched to the bioregional and geographical characters (Link
et al. 2010). The dynamics of fishing fleets are modelled with a detailed exploita-
tion sub-model which also treats impacts of pollution, coastal development and
environmental change (Link et al. 2010).
Atlantis is primarily supported by free support software, i.e. tools to make pa-
rameter files. But the developer can be requested for consultation and there is a
user manual under development (www.ebmtools.org, 11/5-12). The working as-
sumptions for Atlantis are not stated clearly and cannot be supplied by the user,
but the assumptions are expressed in the modelling equations or the software
code (Coleman et al. 2011). Atlantis was rated to be the best DST in the world by
FAO in year 2007 (http://www.csiro.au/science/ps3i4#a1 21/5-12), but the ob-

F., Fyhr, Å., Nilsson, A., Nyström Sandman A review of Ocean Zoning tools and Species distribution modelling methods for Marine Spatial Planning
13
jective of the analysis should always be kept in mind when choosing which tool
to use.
3.1.2 Cumulative Impacts Assessment Tool The Cumulative Impacts Assessment tool was developed by the National Center
for Ecological Analysis and Synthesis (NCEAS), University of California Santa
Barbara and Stanford University (Coleman et al. 2011). It was developed to sup-
port MSP and EBM by identifying vulnerable regions, main stressors to diminish
in certain areas, compatible and incompatible uses based on ecosystem vulner-
ability, map which areas are most and least protected within a region, and to as-
sess how the overall ecosystem condition is affected by the stressors (Coleman
et al. 2011). In summary, it evaluates and visualises the human impacts to ma-
rine ecosystems (Halpern et al. 2008a; Halpern et al. 2008b), Figure 3.
Figure 3. A Global map of cumulative human impacts across 20 ocean ecosystem types
(Halpern et al. 2008 a).
Cumulative Impacts predicts a cumulative impact score for each pixel by using
spatial data together with weighted expert opinions (Coleman et al. 2011;
Halpern et al. 2008 b). The impact score is based on the type of anthropogenic
drivers and their intensity, which type of ecosystems that are present, and the
weighted impact assigned for each anthropogenic driver on a certain ecosystem
(Coleman et al. 2011). The model assumes an additive accumulation of impacts
and that the presence of an anthropogenic driver has a negative impact (Cole-
man et al. 2011).
Human activities that directly or indirectly have impact on the ecological com-
munities in the ecosystems chosen can be mapped by Cumulative Impacts
(Halpern et al. 2008 b). This tool is supportive to the increasing application of
MPAs, ocean zoning and EBM to help to decrease human influence and biodi-
versity loss (http://ebmtoolsdatabase.org/tool/cumulative-impacts-assessment-
tool, 23/5-12).
The majority of the applications of the Cumulative impacts assessment tool have
been to set conservation and management priorities and to assess the most
vulnerable locations in a region (Coleman et al. 2011). It has also been used as a

F., Fyhr, Å., Nilsson, A., Nyström Sandman A review of Ocean Zoning tools and Species distribution modelling methods for Marine Spatial Planning
14
base for environmental impact assessments of state agencies (Coleman et al.
2011). The Cumulative Impacts assessment tool has mostly been used in tropical
environments (Halpern et al. 2008 b).
There is technical support available (Coleman et al. 2011), but it seems rather
limited. The working assumptions for Cumulative impacts are stated clearly but
cannot be supplied by the user and are not expressed in the modelling equa-
tions or the software code (Coleman et al. 2011).
3.1.3 Integrated Valuation of Ecosystem Services and Tradeoffs (InVEST) InVEST was developed by The Natural Capital Project which is driven by Stan-
ford University, World Wildlife Fund, the Nature Conservancy and the University
of Minnesota. The tool aims to estimate how the production and value of terres-
trial and marine ecosystem services are affected by human activities and climate
change (Nelson et al. 2009). It identifies where ecosystem services are provided
and where they are consumed (Coleman et al. 2011; Nelson et al. 2009). Further
it can reveal relationships and identify trade-offs among several ecosystem ser-
vices and biodiversity (Coleman et al. 2011, Link et al. 2010). It also identifies
how several aspects of the economy, human well-being and the environment
are affected by resource management decisions (Coleman et al. 2011). InVEST
includes models based on economic valuation methods and ecological produc-
tion functions, with biophysical and economic information about the ecosystem
services which is incorporated to conservation and natural resource manage-
ment (Tallis & Polasky 2009). The models not only accounts for service supply
(e.g. living habitats as buffers for storm waves), but also include the location and
activities of people who benefit from services (e.g. location of people and infra-
structure potentially affected by coastal storms)
(http://naturalcapitalproject.org/InVEST.html 28/5-13). Further there are models
for ecosystem services which include carbon storage, wave energy, recreation,
fishery production, erosion control, habitat quality, crop pollination and timber
production (Coleman et al. 2011). The user can define alternative scenarios
which are translated into changes in ecosystem services and values, provided by
the process models in InVEST’s ecological production function approach (Tallis
& Polasky 2009), Figure 4. Scenarios are critical inputs in all InVest models and
typically include maps of potential future land use or land cover and/or marine
habitats and ocean uses (http://naturalcapitalproject.org/InVEST.html 28/5-13).
InVEST has been used for MSP in Belize and Canada (Coleman et al. 2011).
Figure 4. A conceptual framework for how InVEST works,
http://www.naturalcapitalproject.org/InVEST.html.
F., Fyhr, Å., Nilsson, A., Nyström Sandman A review of Ocean Zoning tools and Species distribution modelling methods for Marine Spatial Planning
15
The models can be run independently
(http://naturalcapitalproject.org/InVEST.html 28/5-13), or as a toolbox in ArcGIS
(Coleman et al. 2011) designed to be flexible but still scientific (Tallis & Polasky
2009). The outputs can be both economic and biophysical (Tallis & Polasky
2009) and can be viewed using GIS-software such as QGIS or ArcGIS
(http://naturalcapitalproject.org/InVEST.html 28/5-13). Running InVEST effec-
tively does not require knowledge of Python programming
(http://naturalcapitalproject.org/InVEST.html 28/5-13). However, it requires a
quite deep GIS-knowledge and feedbacks between ecosystem services are lim-
ited (http://ebmtoolsdatabase.org/tool/invest-integrated-valuation-ecosystem-
services-and-trade-offs, 23/5-12).
There is a user manual for InVEST, an online forum, frequently asked questions
for problems in ArcGIS and trainings at set (or requested) times and locations
(www.ebmtools.org, 11/5-12). The working assumptions for InVEST are stated
clearly and can be supplied by the user, but the assumptions are not expressed
in the modelling equations or the software code (Coleman et al. 2011).
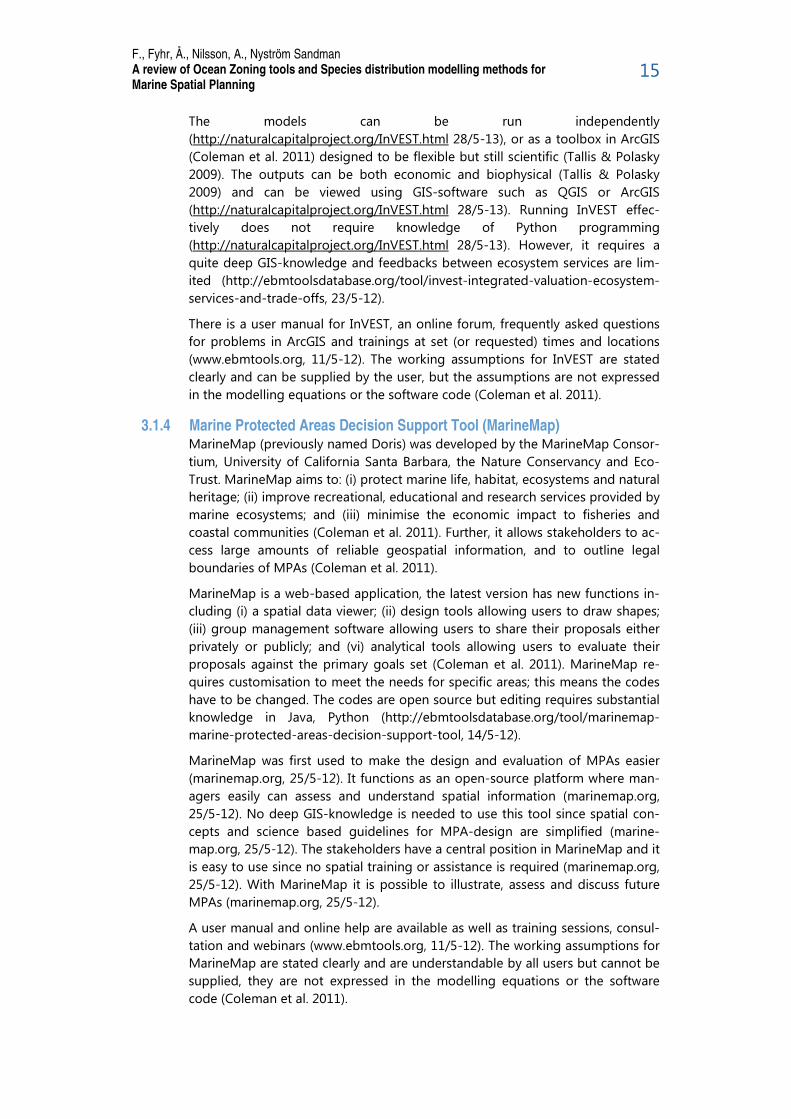
3.1.4 Marine Protected Areas Decision Support Tool (MarineMap) MarineMap (previously named Doris) was developed by the MarineMap Consor-
tium, University of California Santa Barbara, the Nature Conservancy and Eco-
Trust. MarineMap aims to: (i) protect marine life, habitat, ecosystems and natural
heritage; (ii) improve recreational, educational and research services provided by
marine ecosystems; and (iii) minimise the economic impact to fisheries and
coastal communities (Coleman et al. 2011). Further, it allows stakeholders to ac-
cess large amounts of reliable geospatial information, and to outline legal
boundaries of MPAs (Coleman et al. 2011).
MarineMap is a web-based application, the latest version has new functions in-
cluding (i) a spatial data viewer; (ii) design tools allowing users to draw shapes;
(iii) group management software allowing users to share their proposals either
privately or publicly; and (vi) analytical tools allowing users to evaluate their
proposals against the primary goals set (Coleman et al. 2011). MarineMap re-
quires customisation to meet the needs for specific areas; this means the codes
have to be changed. The codes are open source but editing requires substantial
knowledge in Java, Python (http://ebmtoolsdatabase.org/tool/marinemap-
marine-protected-areas-decision-support-tool, 14/5-12).
MarineMap was first used to make the design and evaluation of MPAs easier
(marinemap.org, 25/5-12). It functions as an open-source platform where man-
agers easily can assess and understand spatial information (marinemap.org,
25/5-12). No deep GIS-knowledge is needed to use this tool since spatial con-
cepts and science based guidelines for MPA-design are simplified (marine-
map.org, 25/5-12). The stakeholders have a central position in MarineMap and it
is easy to use since no spatial training or assistance is required (marinemap.org,
25/5-12). With MarineMap it is possible to illustrate, assess and discuss future
MPAs (marinemap.org, 25/5-12).
A user manual and online help are available as well as training sessions, consul-
tation and webinars (www.ebmtools.org, 11/5-12). The working assumptions for
MarineMap are stated clearly and are understandable by all users but cannot be
supplied, they are not expressed in the modelling equations or the software
code (Coleman et al. 2011).

F., Fyhr, Å., Nilsson, A., Nyström Sandman A review of Ocean Zoning tools and Species distribution modelling methods for Marine Spatial Planning
16
3.1.5 Marxan & Marxan with Zones
Marxan was developed by the University of Queensland's Ecology Centre, Spa-
tial Ecology Lab. It aims to find a network of areas that meet biodiversity targets
and are relatively socially and economically cost-effective for conservation man-
agement (Coleman et al. 2011). It delivers solutions that have achieved a mini-
mum set of biodiversity features to the lowest cost (Klein et al. 2009; Possing-
ham et al. 2006), Figure 5.
Figure 5. Result of the MARXAN marine assessment for the Greater Caribbean Basin. More
red areas have higher conservation priority based on e.g. human impacts, biodiversity con-
servation targets and conservation values (http://edcintl.cr.usgs.gov/ip/macga/tnc.php).
Marxan works by stepwise algorithm that identifies combinations of sites that
meet targets set for biodiversity or other features, while minimizing the sum of
costs for protecting each of those areas. Inputs needed for the calculations in-
clude user-supplied GIS layers of (1) socioeconomic values (e.g. human activities
that affect the object of protection and are affected by the resulting manage-
ment), (2) a weighting value for biodiversity features (e.g. species distribution
maps or biological value maps), and (3) a boundary length modifier value to ac-
count for the “clumpiness” of a reserve (Coleman et al. 2011). When penalties
are too high, the spatial solution changes by replacing “high-cost” solutions
with “lower-cost” solutions. Marxan was originally developed based on the prin-
ciple of complementarity, such that sites that are most similar to other sites in
their composition of features, such as species, are selected together (Coleman et
al. 2011).
In addition to Marxan, Marxan with Zones was developed to make it possible to
incorporate several types of zones allowing different activities, contributing to
different management targets, having different costs in different locations with
different biodiversity benefits (Coleman et al. 2011;
http://www.uq.edu.au/marxan/index.html?page=77640&p=1.1.2.1, 16/5-12).
Marxan with Zones can also incorporate interactions between different zones
(Coleman et al. 2011). It creates a zone scheme which allocates resources across
an array of several activities; at least two zones with different targets are identi-

F., Fyhr, Å., Nilsson, A., Nyström Sandman A review of Ocean Zoning tools and Species distribution modelling methods for Marine Spatial Planning
17
fied (http://www.uq.edu.au/marxan/index.html?page=77640&p=1.1.2.1, 16/5-
12).
Marxan with Zones is different from Marxan since it provides multiple zones in-
stead of being limited to including or excluding, but also since it can minimize
several types of zoning costs: reservation, management, opportunity costs and
other constraints (http://ebmtoolsdatabase.org/tool/marxan-zones, 16/5-12).
These properties make it possible to address a variety of questions associated
with spatial planning (http://ebmtoolsdatabase.org/tool/marxan-zones, 16/5-
12). Each zone can have certain actions, objectives and constraints tied to it
which might be biological, cultural, economic or social
(http://ebmtoolsdatabase.org/tool/marxan-zones, 16/5-12). Klein et al. (2009)
describe how Marxan with Zones was developed and assess the difference in
socio-economic advantages between Marxan and Marxan with Zones. Further,
Klein et al. (2009) investigate tradeoffs associated with the representation of bi-
odiversity features and impacting fisheries. According to Coleman et al. (2011),
Marxan with Zones essentially operates as a multi-layered version of Marxan.
In summary, this tool can be applied to biosphere reserves, multiple-use marine
parks and off-reserve marine planning
(http://www.uq.edu.au/marxan/index.html?page=77640&p=1.1.2.1, 16/5-12).
It is recommended to work with Marxan before learning to work with Marxan
with Zones (http://ebmtoolsdatabase.org/tool/marxan-zones, 16/5-12). There is
a user manual available as well as training courses and to a small extent also
consultants (www.ebmtools.org, 11/5-12). The working assumptions for Marxan
and Marxan with Zones are not stated clearly and cannot be supplied by the us-
er, neither are the assumptions expressed in the modelling equations or the
software code (Coleman et al. 2011). Recently, a marine version of the tool was
developed; Marine InVEST
(http://www.naturalcapitalproject.org/marine/MarineInVEST_Apr2010.pdf).
3.1.6 NatureServe Vista NatureServe Vista was developed by the non-profit conservation organisation
NatureServe, which aims to provide the scientific basics to achieve effective con-
servation. It is a conservation planning support tool, which runs on the ESRI
platform of products (ArcMap/ArcInfo) (CRWVPP 2008) and can be used for im-
pact assessments or conservation purposes
(http://ebmtoolsdatabase.org/tool/natureserve-vista, 1/5-12). The most well
adapted application is biodiversity conservation but other features can also be
included, such as historic or hazardous areas etc. as well as the balancing of
competing uses (www.ebmtools.org, 1/5-12). By working with other software
tools it considers economics, land use, ecological and geophysical modelling
(www.natureserve.org/prodServices/vista/overview.jsp, 11/5-12). NatureServe
Vista is compatible with Marxan (chapter 2.1.5) through a wizard that prepares
input for Marxan and, after running Marxan, imports the resulting scenarios
back into NatureServe Vista
(www.natureserve.org/prodServices/vista/overview.jsp, 11/5-12;
http://www.natureserve.org/prodServices/vista/kf_generate.jsp, 11/5-12). Na-
tureServe Vista includes element (species or community) location and runs anal-
yses utilizing information on the element’s sensitivity to different types of dis-
turbance and on each occurrence’s (individuals, populations) known or estimat-
ed condition. Further it handles assertions of confidence in the existence of each

F., Fyhr, Å., Nilsson, A., Nyström Sandman A review of Ocean Zoning tools and Species distribution modelling methods for Marine Spatial Planning
18
occurrence entered in the system. Background data (e.g. hydrology, land use,
zoning, political subdivisions and protected areas) is used by the application to
produce maps, frame the information and carry out some of the analyses
(CRWVPP 2008). Central functions are (i) the production of indices for the re-
gions’ conservation values which makes it possible to early identify areas im-
portant for conservation; (ii) the importation of land use scenarios which can be
evaluated against the conservation motives at hand; (iii) the interoperating with
other conservation optimization tools such as Marxan (www.ebmtools.org, 1/5-
12). Data inputs may be in both vector and raster format. The outputs are pre-
dominantly in raster (CRWVPP 2008). There is a user manual available
(www.ebmtools.org, 1/5-12), but according to the CRWVPP 2008, the Nature-
Serve Vista application is complex and beginning users will require technical
support. Such is provided via Internet or by phone by NatureServe a year after
product installation as well as through a knowledgebase page (http://support.
natureserve.org/vista/) and a listserv ([email protected]) that
provides a way to access topics recently discussed by other list members
(CRWVPP 2008).
3.1.7 Zonation Zonation was developed by the Metapopulation Research Group at the Univer-
sity of Helsinki (www.ebmtools.org, 1/5-12). It aims to achieve long-term persis-
tence of species by identifying areas important for retaining habitat quality and
connectivity for multiple species (www.ebmtools.org, 1/5-12). In contrast to
most other conservation planning methods, Zonation is based on the specifica-
tion of tool is intended for using species distribution predicted on large grids
and priorities and connectivity responses for biodiversity features (Moilanen
2007, Leathwick et al. 2008) rather than on setting conservation targets (Sarkar
et al. 2006, Leathwick et al. 2008). This produces a hierarchical prioritization of
the conservation value of a landscape. The Zonation algorithm works by remov-
ing cells one by one from the landscape, using minimization of marginal loss as
a criterion to decide which cell is removed next (Moilanen 2007), resulting in a
landscape zoning with the most important areas remaining last (Moilanen et al.
2005). By removing cells instead of adding them the tool enables analysis of
connectivity of species, habitats or ecosystems. The initial landscape includes all
clusters with maximal possible connectivity, and cell removal proceeds in a
manner that maintains maximal value and connectivity for remaining areas
(Moilanen 2007). The order in which cells are removed is recorded to allow iden-
tification of the landscape zoning (Moilanen et al. 2005). Consequently it is pos-
sible to identify multiple spatially distinct important regions at any given frac-
tion of cell removal (Moilanen 2007). The definition of marginal loss (the cell
removal rule) is crucial for the Zonation algorithm to work properly (Moilanen
2007). According to Moilanen (2007) it should be seen as a separate component
(and not be confounded with the Zonation meta-algorithm) with several alter-
natives that have different interpretations (Leathwick et al. 2008). Furthermore it
allows species weighting and species-specific connectivity considerations to be
applied (Leathwick et al. 2008). The Zonation tool can be used for the expansion
of existing reserve networks, to find optimal areas for new reserve networks, to
assess proposed reserve networks or as conservation decision support by priori-
ty ranking (www.ebmtools.org, 1/5-12). The output of Zonation can be imported
to GIS software in order to visualise or further analyse the results
(http://www.helsinki.fi/bioscience/consplan/software/Zonation/Introduction.htm

F., Fyhr, Å., Nilsson, A., Nyström Sandman A review of Ocean Zoning tools and Species distribution modelling methods for Marine Spatial Planning
19
l, 4/6-12). Zonation can also yield output in terms of diagrams showing the de-
crease of selected features, e.g. proportion of original species distribution, de-
pending on the area of conserved land included
(http://www.helsinki.fi/bioscience/consplan/software/Zonation/Introduction.htm
l, 4/6-12), Figure 6.
Figure 6. Zonation produces detailed information about the decrease in species distributions
(or other features) as landscape is lost,
http://www.helsinki.fi/bioscience/consplan/software/Zonation/Introduction.html.
Zonation has a direct workflow between GIS and statistical species distribution
modelling (SDM) and has the ability to work with large datasets
(www.ebmtools.org, 11/5-12). Zonation can also model species interactions and
do uncertainty analysis to find robust reserve solutions (www.ebmtools.org,
11/5-12). It cannot work with vector data and it only allows a limited set of in-
teractive planning analyses
(http://www.helsinki.fi/bioscience/consplan/software/Zonation/zv3_leaflet_1203
06.pdf, 15/5-12). Available support includes user manuals and tutorials
(http://www.helsinki.fi/bioscience/consplan/software/Zonation/References_new.
html, 14/5-13).
3.2 Discussion All the tools described above are based on the foundations of ecosystem based
management, i.e. considering the whole ecosystem; humans and the environ-
ment. Further, the use of an adaptive management approach, i.e. that manage-
ment can be adapted to changing circumstances, is essential for all these tools
(www.ebmtools.org, 11/5-12). Other aspects to consider before deciding which
tool to use is how steep learning curve the tools has, if support is available, how
up-to-date the tool is i.e. if it is frequently used and updated, if the assumptions
are transparent and how time consuming the analysis is. These aspects are diffi-
cult to assess without having tested the tools. Albeit, after reviewing the litera-
ture it can be concluded that these tools are specialised in different subjects,
e.g. the fishery industry (Atlantis), impacts assessment (the Cumulative Impacts
Assessment Tool) etc. The tools have common grounds, and to a certain extent

F., Fyhr, Å., Nilsson, A., Nyström Sandman A review of Ocean Zoning tools and Species distribution modelling methods for Marine Spatial Planning
20
also common input data, they are also more or less adaptable to better serve
local regulations, goals, limitations, species, habitats etc.
Compared to the other tools, MarineMap is different since it is more adapted
for stakeholders by being simplified, possibly too simplified for the purpose of
MARMONI. Even though adaptations are possible, MarineMap requires
knowledge about Python programming, which not always is at hand. Further, it
works as a web-based tool, not having the analysing advantages of GIS-
software. The tool Atlantis, on the other hand, is more advanced with a sub-
model for each step in the management cycle
(http://www.csiro.au/science/ps3i4#a1 21/5-12). It has a good reputation after
being elected to the best DST in the world by FAO in year 2007
(http://www.csiro.au/science/ps3i4#a1 21/5-12). It is applicable for biodiversity
conservation and ocean zoning but, after all, most well adapted to fisheries
management. Additionally, since it mostly has been applied in tropical environ-
ments its possibility to assess the Baltic Sea is unknown.
Another tool mostly applied in tropical environments is InVEST. This tool does
not assess fisheries management but ecosystem services, which could be set to
e.g. biodiversity to fulfil the goals of MARMONI. But the sensitivity for disturb-
ance, such as the building of wind power plants, could be more difficult to as-
sess with InVEST, although not impossible since ecosystem services should be a
function of e.g. the biodiversity after exposure to disturbance. However, the
analysis tends to get complicated; therefore the Zonation tool is ranked higher
for the purpose of MARMONI. The strengths of Zonation are its ability to work
with both GIS and statistical species distribution modelling, as well as connectiv-
ity responses for biodiversity features. The downside is its inability to work with
vector files, further; it is primarily developed to design marine reserves and not
combined planning of human activities and marine protection.
Left are three strong candidates, in alphabetic order; the Cumulative Impacts
Assessment Tool, Marxan, its sibling Marxan with Zones and NatureServe Vista.
The Cumulative Impacts Assessment Tool has a possibility to assess the impacts
of different activities to different ecosystems by identifying vulnerable regions
and important impact factors. Another important property is its ability to assess
compatible and incompatible uses based on vulnerability. Further, it supports
ecosystem based management. These are all features matching the MARMONI
objectives. The downside, however, is the fact that is has most been applied in
tropical environments and perhaps that it assumes all impacts to be negative
and additive accumulative. The most well-known and possibly therefore most
widely used Marxan with Zones on the contrary offers the possibility to set each
activity’s cost or contribution to different management targets, enabling consid-
eration not only to the cost of activities, but also to their possible biodiversity
benefits. This and its ability to incorporate several layers of ecological elements
(e.g. species, habitats, and/or biological values) and pressures makes it seem to
be the most suited tool for ecosystem based management and MARMONI pur-
poses. However, Marxan with Zones are somewhat limited in its possibilities to
incorporate interactions between areas that are spatially separated by each oth-
er (Leathwick et al., 2006b), therefore inhibiting consideration to corridors for
dispersal of species. This could perhaps, if technically possible, be addressed by
a combination of Marxan with Zones and Zonation, which is designed to con-
sider connectivity.

F., Fyhr, Å., Nilsson, A., Nyström Sandman A review of Ocean Zoning tools and Species distribution modelling methods for Marine Spatial Planning
21
Finally, NatureServe Vista is confirmed compatible with both ArcGIS and
Marxan, meaning it has the possibility to prepare input for Marxan and then
transport the results back into NatureServe Vista. This quality gives it the power-
fulness of Marxan and user-interativeness of NatureServe Vista. NatureServe
Vista also has the ability to evaluate land use scenarios against conservation,
which suits with the requirements for the tool to be used in MARMONI.
After all, the most well adapted tool for the objectives of MARMONI seems to
be Marxan with Zones, possibly in combination with NatureServe Vista or Zona-
tion followed by the Cumulative Impacts Assessment Tool.
3.3 Conclusions • The most well adapted tool for the objectives of MARMONI seems to
be Marxan with Zones due to its capability to incorporate several types
of zones allowing different activities, contributing to different man-
agement targets, having different costs or benefits in different loca-
tions with different biodiversity benefits.
• NatureServe Vista and Zonation does not independently fully meet the
objectives of MARMONI in regards to management of uses, but could
be useful in a combination with Marxan with Zones.
• Cumulative Impacts Assessment Tool is ranked as individually second
best suited for the objectives of MARMONI because of its ability to as-
sess the impacts of different activities to ecosystems and compatible
and incompatible uses based on vulnerability. However, the fact that it
assumes all impacts to be negative and additive accumulative makes it
seem less applicable then Marxan with Zones.
• MarineMap is targeted against viewing, changing and evaluation MPAs
and is probably either too simplified to fit the purposes of MARMONI
(if used in its original state) or to demanding in regards to require-
ments Python programming skills. Further, it works as a web-based
tool, not having the analysing advantages of GIS-software.
• Atlantis offer good possibilities to incorporate each step in the man-
agement cycle into the MSP and considers biophysical, economic and
social components of the ecosystem. However it’s heavy adaption to
fisheries management still push it below Marxan with Zones and Cu-
mulative Impacts Assessment tool in the prioritizing for the purposes of
MARMONI.
• InVEST assess the impacts on ecosystem services caused by different
scenarios which could be set to fulfil the goals of MARMONI, but tends
to be too complicated in regards to analysis of the sensitivity for dis-
turbance.
4 Acknowledgements We thank Martin Isaeus (AquaBiota Water Research) for valuable guidance and
inputs.

F., Fyhr, Å., Nilsson, A., Nyström Sandman A review of Ocean Zoning tools and Species distribution modelling methods for Marine Spatial Planning
22
5 References Agardy, T., Bridgewater, P., Crosby, M.P., Day, J., Dayton, P.K., Kenchington, R.,
Laffoley, D., McConney, P., Murray, P.A., Parks, J.E., Peau, L., 2003. Dangerous
targets? Unresolved issues and ideological clashes around marine protected ar-
eas. Aquatic Conservation: Marine and Freshwater Ecosystems 13, 353–367.
Agardy, T., 2010. Ocean Zoning: Making Marine Management More Effective,
Earthscan.
Austin, M.P., 1985. Continuum Concept, Ordination Methods, and Niche Theory.
Annual Review of Ecology and Systematics 16, 39–61.
Austin, M.P., 2002a. Case studies of the use of environmental gradients in vege-
tation and fauna modeling: theory and practice in Australia and New Zealand,
in: Scott, M., Heglund, P., Morrison, M., Haufler, J., Raphael, M., Wall, W., Sam-
son, F. (Eds.), Predicting Species Occurrences: Issues of Accuracy and Scale. Is-
land Press, Washington.
Austin, M.P., 2002b. Spatial prediction of species distribution: an interface be-
tween ecological theory and statistical modelling. Ecological Modelling 157,
101–118.
Austin, M.P., 2007. Species distribution models and ecological theory: A critical
assessment and some possible new approaches. Ecological Modelling 200, 1–19.
Bekkby, T., Rinde, E., Erikstad, L., Bakkestuen, V., Longva, O., Christensen, O.,
Isæus, M., Isachsen, P.E., 2008. Spatial probability modelling of eelgrass (Zostera
marina) distribution on the west coast of Norway. ICES Journal of Marine Sci-
ence: Journal du Conseil 65, 1093 –1101.
Bergström, U., Sundblad, G., Downie, A.-L., Snickars, M., Boström, C., Lindegarth,
M., 2013. Evaluating eutrophication management scenarios in the Baltic Sea us-
ing species distribution modelling. Journal of Applied Ecology 50, 680–690.
Braak, C.J.F. ter, Prentice, I.C., Begon, A.H.F.M., 1988. A Theory of Gradient Analy-
sis. Academic Press, pp. 271–317.
Breiman, L., 2001. Random forests. Machine learning 45, 5–32.
Breiman, L., Friedman, J.H., Olshen, R.A., Stone, C.J., 1984. Classification and Re-
gression Trees. Wadsworth, Belmont, CA.
Carpenter, S.R., Brock, W.A., 2006. Rising variance: a leading indicator of ecologi-
cal transition. Ecology Letters 9, 311–318.
Carpenter, S.R., Gunderson, L.H., 2001. Coping with Collapse: Ecological and So-
cial Dynamics in Ecosystem Management. BioScience 51, 451–457.
Clarke, K.A., Warwick, R.M., 2001. Change in marine communities: an approach
to statistical analysis and. Natural Environmental Research Council, Plymouth
Marine Laboratory, Plymouth.
Coleman, H., Foley, M., Prahler, E., Armsby, M. & Shillinger, G., 2011. Decision
Guide: Selecting Decision Support Tools for Marine Spatial Planning.
Cottingham, K.L., Carpenter, S.R., 1994. Predictive Indices of Ecosystem Resili-
ence in Models of North Temperate Lakes. Ecology 75, 2127–2138.

F., Fyhr, Å., Nilsson, A., Nyström Sandman A review of Ocean Zoning tools and Species distribution modelling methods for Marine Spatial Planning
23
CRWVPP (Chagrin River Watershed Vista Pilot Project), 2008. Report to LEAP
Planning Committee.
Day, J., 2002. Zoning—lessons from the Great Barrier Reef Marine Park. Ocean &
Coastal Management 45 (2002) 139–156.
De’ath, G., 2002. Multivariate Regression Trees: A New Technique for Modeling
Species-Environment Relationships. Ecology 83, 1105–1117.
EC (European Commission), 2008. Directive 2008/56/EC of the European Parlia-
ment and of the council of 17 June 2008 establishing a framework for communi-
ty action in the field of marine environmental policy (Marine Strategy Frame-
work Directive). Official Journal of the European Union.
EC (European Commission), 2012. Proposal for a directive of the European par-
liament and of the council establishing a framework for maritime spatial plan-
ning and integrated coastal management. 2013/0074 (COD).
Ehler, C., Douvere, F., 2009. Marine Spatial Planning. A step-by-step Approach
toward Ecosystem-based Management. Intergovernmental Oceanographic
Commission. Manual and Guides No.53, ICAM Dossier No.6.
Elith, J., Burgman, M.A., Regan, H.M., 2002. Mapping epistemic uncertainties and
vague concepts in predictions of species distribution. Ecological Modelling 157,
313–329.
Elith, J., Graham, C.H., Anderson, R.P., Dudik, M., Ferrier, S., Guisan, A., Hijmans,
R.J., Huettmann, F., Leathwick, J.R., Lehmann, A., Li, J., Lohmann, L.G., Loiselle,
B.A., Manion, G., Moritz, C., Nakamura, M., Nakazawa, Y., Overton, J.M., Peterson,
A.T., Phillips, S.J., Richardson, K., Scachetti-Pereira, R., Schapire, R.E., Soberon, J.,
Williams, S., Wisz, M.S., Zimmermann, N.E., 2006. Novel methods improve pre-
diction of species’ distributions from occurrence data. Ecography 29, 129–151.
Elith, J., Leathwick, J.R., Hastie, T., 2008. A working guide to boosted regression
trees. Journal of Animal Ecology 77, 802–813.
Ellis, J., Ysebaert, T., Hume, T., Norkko, A., Bult, T., Herman, P., Thrush, S.F., Old-
man, J., 2006. Predicting macrofaunal species distributions in estuarine gradients
using logistic regression and classification systems. Marine ecology Progress se-
ries 316, 69–83.
Faith, D.P. & Nicholls, A.O., 1996. BioRap Volume 3: Tools for Assessing Biodiver-
sity Priority Areas, Canberra: The Australian BioRap Consortium.
Fernandes, L., Day, J., Lewis, A., Slegers, S., Kerrigan, B., Breen, D., Cameron, D. F.,
Jago, B., Hall, J., Lowe, D., Innes, J., Tanzer, J., Chadwick, V., Thompson, L., Gor-
man, K., 2005. Establishing representative no-take areas in the Great Barrier
Reef: Large scale implementation of theory on marine protected areas. Conser-
vation Biology, 19 6: 1733-1744.
Ferrier, S., Guisan, A., 2006. Spatial modelling of biodiversity at the community
level. Journal of Applied Ecology 43, 393–404.
Fielding, A.H., Bell, J.F., 1997. A review of methods for the assessment of predic-
tion errors in conservation presence/absence models. Environmental Conserva-
tion 24, 38–49.
Friedman, J.H., 1991. Multivariate Adaptive Regression Splines. Ann. Statist 19,
123–141.
F., Fyhr, Å., Nilsson, A., Nyström Sandman A review of Ocean Zoning tools and Species distribution modelling methods for Marine Spatial Planning
24
Fulton E.A., Link J.S., Kaplan I.C., Savina-Rolland M., Johnson P., Ainsworth C.,
Horne P., Gorton R., Gamble R.J., Smith A.D.M. Smith D.C., 2011. Lessons in
modelling and management of marine ecosystems: the Atlantis experience. Fish
and Fisheries, 12: 171-188.
Graham, C.H., Ferrier, S., Huettman, F., Moritz, C., Peterson, A.T., 2004. New de-
velopments in museum-based informatics and applications in biodiversity anal-
ysis. Trends in Ecology & Evolution 19, 497–503.
Groffman, P.M., Baron, J.S., Blett, T., Gold, A.J., Goodman, I., Gunderson, L.H., Lev-
inson, B.M., Palmer, M.A., Paerl, H.W., Peterson, G.D., 2006. Ecological Thresh-
olds: The Key to Successful Environmental Management or an Important Con-
cept with No Practical Application? Ecosystems 9, 1–13.
Guisan, A., Edwards, T.C., Hastie, T.J., 2002. Generalized linear and generalized
additive models in studies of species distributions: setting the scene. Ecological
Modelling 157, 89–100.
Guisan, A., Thuiller, W., 2005. Predicting species distribution: offering more than
simple habitat models. Ecology Letters 8, 993–1009.
Guisan, A., Zimmermann, N.E., 2000. Predictive habitat distribution models in
ecology. Ecological Modelling 135, 147–186.
Halpern, B.S., Walbridge, S., Selkoe, K.A., Kappel, C.V., Micheli, F., D'Agrosa, C.,
Bruno, J.F., Casey, K.S., Ebert, C., Fox, H.E., Fujita, R., Heinemann, D., Lenihan, H.S.,
Madin, E.M., Perry, M.T., Selig, E.R., Spalding, M., Steneck, R. & Watson, R.,
2008a. A Global Map of Human Impact on Marine Ecosystems. Science,
319(5865), pp.948–952.
Halpern, B.S., McLeod, K.L., Rosenberg, A.A. & Crowder, L.B., 2008b. Managing
for cumulative impacts in ecosystem-based management through ocean zoning.
Ocean & Coastal Management, 51(3), pp.203–211.
Hastie, T.J., Tibshirani, R., 1986. Generalized Additive Models. Statistical Science
1, 297–310.
Hastie, T.J., Tibshirani, R., 1990a. Generalized Additive Models, Monographs on
Statistics and Applied Probability. Chapman & Hall/CRC, London.
Hastie, T.J., Tibshirani, R.J., 1990b. Generalized Additive Models, 1st ed. ed,
Monographs on statistics and applied probability. Chapman and Hall, London.
Hughes, T.P., Baird, A.H., Bellwood, D.R., Card, M., Connolly, S.R., Folke, C., Gros-
berg, R., Hoegh-Guldberg, O., Jackson, J.B.C., Kleypas, J., Lough, J.M., Marshall,
P., Nystrom, M., Palumbi, S.R., Pandolfi, J.M., Rosen, B., Roughgarden, J., 2003.
Climate Change, Human Impacts, and the Resilience of Coral Reefs. Science 301,
929–933.
Kent, M., Coker, P., 1992. Vegetation description and analysis: a practical ap-
proach. CRC Press, Boca Raton.
Kidd, S., Plater, A., and Frid, C. (eds). ed(s), 2011. The Ecosystem Approach to
Marine Planning and Management. Earthscan, London.
Klein, Carissa Joy, Steinback, Charles, Watts, Matthew, Scholz, Astrid J. and
Possingham, Hugh P., 2010. Spatial marine zoning for fisheries and conserva-
tion. Frontiers in Ecology and the Environment, 8 7: 349-353.

F., Fyhr, Å., Nilsson, A., Nyström Sandman A review of Ocean Zoning tools and Species distribution modelling methods for Marine Spatial Planning
25
Leathwick, J.R., Elith, J., Hastie, T.J., 2006a. Comparative performance of general-
ized additive models and multivariate adaptive regression splines for statistical
modelling of species distributions. Ecological Modelling 199, 188–196.
Leathwick, J., Julian, K. and Francis, M., 2006b. Exploration of the use of reserve
planning software to identify potential Marine Protected Areas in New Zealand’s
Exclusive Economic Zone. NIWA Client Report: HAM2006-064.
Leathwick, J.R., Elith, J., Francis, M.P., Hastie, T., Taylor, P., 2006c. Variation in de-
mersal fish species richness in the oceans surrounding New Zealand: an analysis
using boosted regression trees. Marine Ecology Progress Series 321, 267–281.
Leathwick, J., Moilanen, A., Francis, M., Elith, J., Taylor, P., Julian, K., Hastie, H. &
Duffy, C., 2008. Novel methods for the design and evaluation of marine protect-
ed areas in offshore waters. Conservation Letters 1, pp.91–102.
Legendre, P., Legendre, L., 1998. Numerical ecology. 2nd English edn., Develop-
ments in Environmental Modelling. Elsevier, Amsterdam.
Lehmann, A., Overton, J.M., Austin, M.P., 2002. Regression models for spatial
prediction: their role for biodiversity and conservation. Biodiversity and Conser-
vation 11, 2085–2092.
Lehmann, A., Overton, J.M., Leathwick, J.R., 2003. GRASP: generalized regression
analysis and spatial prediction. Ecological Modelling 160, 165–183.
Levin, S.A., 1992. The Problem of Pattern and Scale in Ecology: The Robert H.
MacArthur Award Lecture. Ecology 73, 1943–1967.
Link, J.S., Fulton, E.A. & Gamble, R.J., 2010. The northeast US application of
ATLANTIS: A full system model exploring marine ecosystem dynamics in a living
marine resource management context. Progress In Oceanography, 87(1-4),
pp.214–234.
Maggini, R., Lehmann, A., Zimmermann, N.E., Guisan, A., 2006. Improving gener-
alized regression analysis for the spatial prediction of forest communities. Jour-
nal of Biogeography 33, 1729–1749.
Margules, C.R. & Pressey, R.L., 2000. Systematic conservation planning. Nature,
405(6783), pp.243–253.
McCullagh, P., Nelder, J.A., 1989. Generalized Linear Models, Monographs on
Statistics and Applied Probability. Chapman & Hall/CRC.
McGill, B.J., 2010. Matters of Scale. Science 328, 575.
McLeod, K. L., Lubchenco, J., Palumbi, S. R., & Rosenberg, A. A.. 2005. Scientific
Consensus Statement on Marine Ecosystem-Based Management. Signed by 221
academic scientists and policy experts with relevant expertise and published by
the Communication Partnership for Science and the Sea.
McManus, J.W., van Zwol. C., Garces, L.R., Sadacharan, D. (eds.)., 1998. A Frame-
work for Future Training in Marine and Coastal Protected Area Management,
The WorldFish Center.
MEA (Millennium Ecosystem Assessment), 2005. Ecosystems and Human Well-
being: Synthesis. Island Press, Washington, DC

F., Fyhr, Å., Nilsson, A., Nyström Sandman A review of Ocean Zoning tools and Species distribution modelling methods for Marine Spatial Planning
26
Moilanen, A., Franco, A.M.A., Early, R.I., Fox, R., Wintle, B. & Thomas, C.D., 2005.
Prioritizing multiple-use landscapes for conservation: methods for large multi-
species planning problems. In Proc. R. Soc. B. pp. 1885–1891.
Moilanen, A. 2007. Landscape Zonation, benefit functions and target-based
planning: Unifying reserve selection strategies. Biological Conservation 134,
pp.571–579.
Nelson, E., Mendoza, G., Regetz, J., Polasky, S., Tallis, H., Cameron, D.R., Chan,
K.M.A., Daily, G.C., Goldstein, J., Kareiva, P.M., Lonsdorf, E., Naidoo, R., Ricketts,
T.H. & M Shaw, R., 2009. Modeling multiple ecosystem services, biodiversity
conservation, commodity production, and tradeoffs at landscape scales. Fron-
tiers in Ecology and the Environment, 7(1), pp.4–11.
Pearson, R.G., Dawson, T.P., 2003. Predicting the impacts of climate change on
the distribution of species: are bioclimate envelope models useful? Global Ecol-
ogy and Biogeography 12, 361–371.
Peterson, G.D., 2000. Political ecology and ecological resilience: An integration
of human and ecological dynamics. Ecological Economics 35, 323–336.
Phillips, S.J., Anderson, R.P., Schapire, R.E., 2006. Maximum entropy modeling of
species geographic distributions. Ecological Modelling 190, 231–259.
Phillips, S.J., Dudík, M., Schapire, R.E., 2004. A maximum entropy approach to
species distribution modeling. ACM International Conference Proceeding Series.
Possingham, H. 2005. Establishing Representative No Take Areas in the Great
Barrier Reef: Large Scale Implementation of Theory on Marine Protected Areas.
Conservation Biology, 19(6), pp.1733–1744.
Possingham, H., Wilson, K. A., Andelman, S. J. and Vynne, C. H. 2006. Protected
areas: Goals, limitations, and design. In Martha J. Groom, Gary K. Meffe and C.
Ronald Carroll (Ed.), Principles of Conservation Biology 3rd ed. ed. (pp. 507-549)
Sunderland, Massachusetts, U.S.: Sinauer Associates.
Reiss, H., Cunze, S., Knig, K., Neumann, H., Krncke, I., 2011. Species distribution
modelling of marine benthos: a North Sea case study. Mar Ecol Prog Ser 442,
71–86.
Roberts, C.M., Andelman, S., Branch, G., Bustamante, R.H., Castilla, J.C., Dugan, J.,
Halpern, B.S., Lafferty, K.D., Leslie, H., Lubchenco, J., 2003. Ecological criteria for
evaluating candidate sites for marine reserves. Ecological Applications 13, 199–
214.
Rosenberg, A. A. & McLeod, K. L., 2005. Implementing ecosystem-based ap-
proaches to management for the conservation of ecosystem services. Marine
Ecology Progress Series, 300(300), pp.270–274.
Sarkar, S., Pressey R.L., Faith D.P., Margules, C. R., Fuller, T., Stoms, D. M., Moffett,
A., Wilson, K. A., Williams, K., Williams, P. H. & Andelman, S., 2006. Biodiversity
conservation planning tools: present status and challenges for the future. Annu
Rev Environ Resour 31, 123.
Smith, A.D.M., 1994. Management strategy evaluation: the light on the hill. Po-
pulation dynamics for fisheries management, pp.249–253.
Snickars, M., Sundblad, G., Sandström, A., Ljunggren, L., Bergström, U., Johans-
son, G., Mattila, J., 2010. Habitat selectivity of substrate-spawning fish: modelling
F., Fyhr, Å., Nilsson, A., Nyström Sandman A review of Ocean Zoning tools and Species distribution modelling methods for Marine Spatial Planning
27
requirements for the Eurasian perch Perca fluviatilis. Marine Ecology Progress
Series 398, 235–243.
Soberón, J., Peterson, A.T., 2005. Interpretation of models of fundamental eco-
logical niches and species’ distributional areas. Biodiversity Informatics 2.
Soldal, E., Bekkby, T., Rinde, E., Bakkestuen, V., Erikstad, L., Longva, O., Isæus, M.,
2009. Predictive Probability Modelling of Marine Habitats–A Case Study from
the West Coast of Norway. Integrated Coastal Zone Management 57.
Soulé, M.E., 1991. Conservation: tactics for a constant crisis. Science (Washing-
ton), 253(5021), pp.744–744.
Sundblad, G., Härmä, M., Lappalainen, A., Urho, L., Bergström, U., 2009. Transfer-
ability of predictive fish distribution models in two coastal systems. Estuarine,
Coastal and Shelf Science 83, 90–96.
Tallis, H. & Polasky, S., 2009. Mapping and Valuing Ecosystem Services as an
Approach for Conservation and Natural-Resource Management. Annals of the
New York Academy of Sciences, 1162(1), pp.265–283.
Teh, L.C.L. & Teh, L.S.L., 2011. A Fuzzy Logic Approach to Marine Spatial Man-
agement. Environmental Management, 47(4), pp.536–545.
Villa, F., Tunesi, L. & Agardy, T., 2002. Zoning Marine Protected Areas through
Spatial Multiple-Criteria Analysis: the Case of the Asinara Island National Marine
Reserve of Italy. Conservation Biology, 16(2), pp.515–526.
Worm, B., Barbier, E. B., Beaumont, N., Duffy, J. E., Folke, C., Halpern, B. S., Jack-
son J. B. C., Lotze, H. K., Micheli, F., Palumbi, S. R., Sala, E., Selkoe, K. A., Stachow-
icz, J. J. & Watson, R., 2006. Impacts of Biodiversity Loss on Ocean Ecosystem
Services. Science, 314(5800), pp.787–790.
Zweig, M.H., Campbell, G., 1993. Receiver-operating characteristic (ROC) plots: a
fundamental evaluation tool in clinical medicine. Clinical Chemistry 39, 561–77.

F., Fyhr, Å., Nilsson, A., Nyström Sandman A review of Ocean Zoning tools and Species distribution modelling methods for Marine Spatial Planning
28
LIFE+ Nature & Biodiversity project “Innovative approaches for marine biodiver-
sity monitoring and assessment of conservation status of nature values in the
Baltic Sea” (Project acronym - MARMONI).
Please visit the project website: http://marmoni.balticseaportal.net/
Project coordinating beneficiary: Baltic Environmental Forum – Latvia
Antonijas street 3-8, Rīga, LV -1010, Latvia
www.bef.lv