freshmores on campus: how early college credit shapes the
TRANSCRIPT

First-Year Experience Conference February 19, 2012
Freshmores on Campus: How Early College Credit Shapes the
First-Year Experience
Jane Jacobson
Dayle Nickerson
Tom Polito
Karen Zunkel

First-Year Experience Conference February 19, 2012
Outline for Today’s Session
• Background and status of early credit at Iowa State University
• Success of students with early credit
• Institutional impacts of early credit
• Implications for the First-Year Experience

Background

First-Year Experience Conference February 19, 2012
Research Conducted at Iowa State University
Early Credit Task Force Dec. 2009 through Dec. 2011
Research components:
• Analysis of data (enrollment and student success)
• Survey and focus groups with students who entered with early college credit
• Interviews with faculty/staff
• Review of catalog

First-Year Experience Conference February 19, 2012
Analysis of student participation and student success
• Students entering Fall 2000 through Fall 2010
• Early Credit defined as AP, college credit (earned through community college or 4‐year school) and IB. (Did not include CLEP or other test outs)

First-Year Experience Conference February 19, 2012
Participation
2000 Entering
Class
2006 Entering
Class
2010 Entering
Class
Entering Class Size 4,260 3,982 4,552
Students with Credit 1,456 2,088 2,834
Total Credits 13,647 25,552 44,613
Mean Credits per Student 9.4 12.2 15.7
Median Credits per Student 6.0 10.0 13.0
% of Students with Credit 34% 52% 62%

First-Year Experience Conference February 19, 2012
Types of early credit – Iowa Residents
Note: 95% of transfer credit from community colleges

First-Year Experience Conference February 19, 2012
Demographics
• Gender: women take advantage of early credit at a higher rate – and the gap is growing (2 % gap in 2000, 5 % in 2010)
• Race/ethnicity: non-minority students take advantage of early credit at higher rate – and the gap is growing (4% gap in 2000, 15% in 2010)
• The profile of students taking the greatest amount of early credit (top quartile – 19 or more credits) is changing (reduction of ACT scores and high school ranks)

First-Year Experience Conference February 19, 2012
ACT Composite Scores of Students
20.0
21.0
22.0
23.0
24.0
25.0
26.0
27.0
28.0
29.0
19 or more
11 to 18
7 to 10
1 to 6
0

First-Year Experience Conference February 19, 2012
Top 5 Early Credits Courses
Course Title Number of Students
Percent of New
Students
Composition I 1,294 28%
Calculus I 848 19%
Composition II 716 16%
Intro to Psychology
667 15%
Public Speaking 460 10%
First-Year Experience Conference February 19, 2012
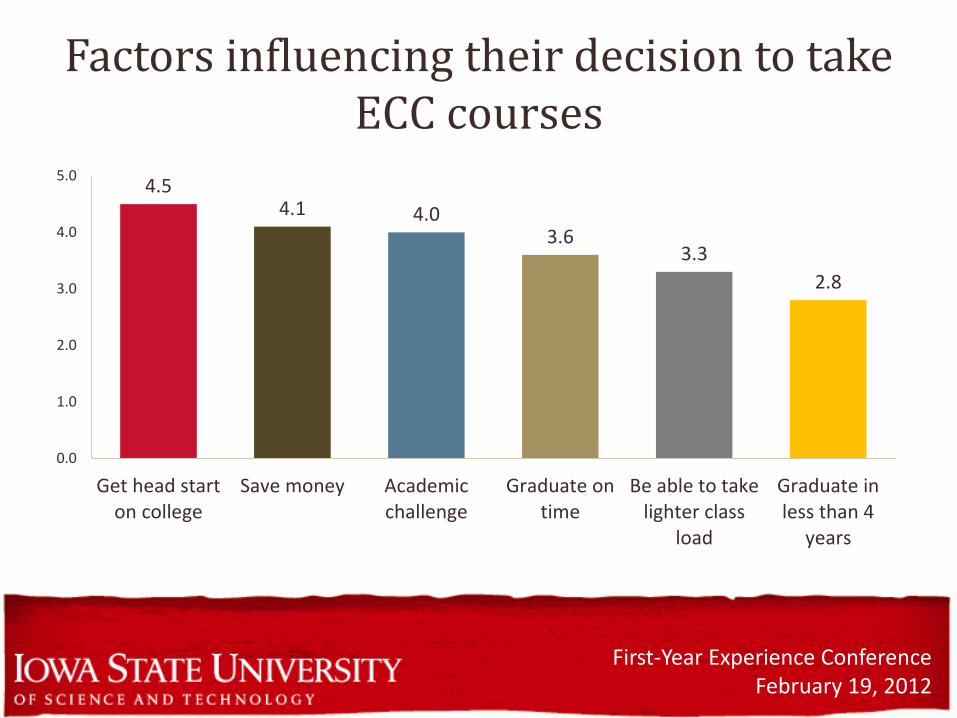
Factors influencing their decision to take ECC courses
4.5 4.1 4.0
3.6 3.3
2.8
0.0
1.0
2.0
3.0
4.0
5.0
Get head starton college
Save money Academicchallenge
Graduate ontime
Be able to takelighter class
load
Graduate inless than 4
years

Student Survey Question
If you had the opportunity to redo your high school career, would you earn ECC?
97% said “yes”
First-Year Experience Conference February 19, 2012
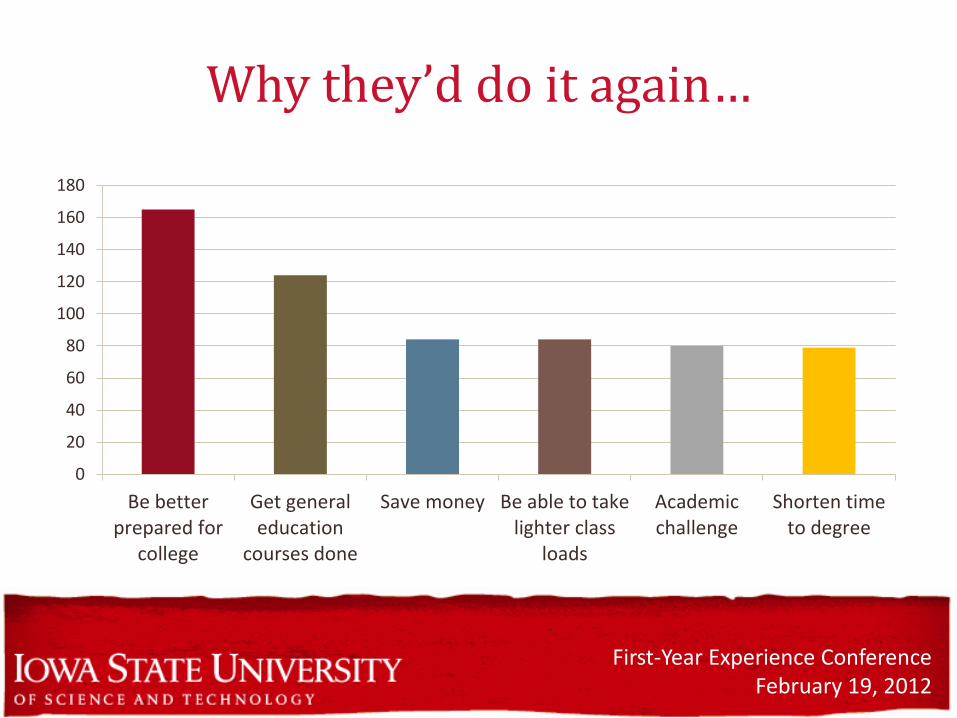
Why they’d do it again…
0
20
40
60
80
100
120
140
160
180
Be betterprepared for
college
Get generaleducation
courses done
Save money Be able to takelighter class
loads
Academicchallenge
Shorten timeto degree

Student Success

First-Year Experience Conference February 19, 2012
Methodologies
• Descriptive statistics
• Regressions – Controlling for variables such as ACT scores, high
school GPA, and high school rank
• Propensity score matching – Controlling for variables such as ACT scores, high
school GPA, high school rank, residency, first semester credit hours, and academic major

First-Year Experience Conference February 19, 2012
Results: Number of credits first term
• Very little difference between students with or without early credit or between students with different amounts of early credit
• The results were not what we initially expected.
First-Year Experience Conference February 19, 2012
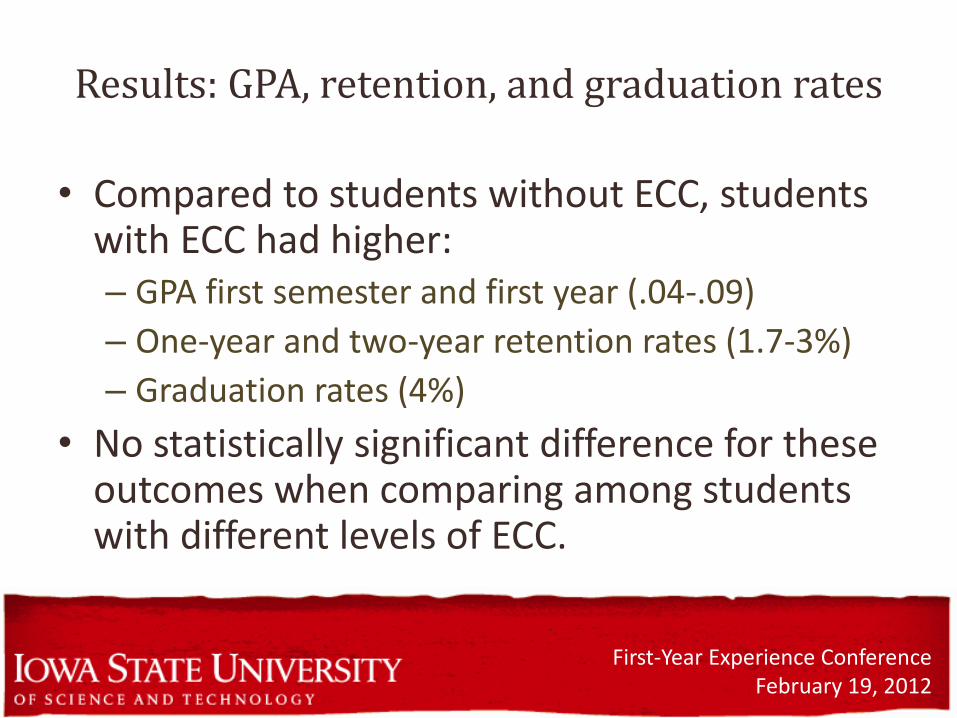
Results: GPA, retention, and graduation rates
• Compared to students without ECC, students with ECC had higher: – GPA first semester and first year (.04-.09)
– One-year and two-year retention rates (1.7-3%)
– Graduation rates (4%)
• No statistically significant difference for these outcomes when comparing among students with different levels of ECC.

First-Year Experience Conference February 19, 2012
Results: Impact on course sequences
• Students earning Calculus I credit through a community college while in HS earn significantly lower grades in Calculus II than students completing both at ISU
• Where students completed Comp I courses had no influence on subsequent grades in Comp II taken at ISU
• Identified potential issues for math (which may not be as critical for English courses): – Course alignment between institutions – Gap in time between first and second course – Difference in contact hours/teaching styles, grading
systems, etc.
First-Year Experience Conference February 19, 2012
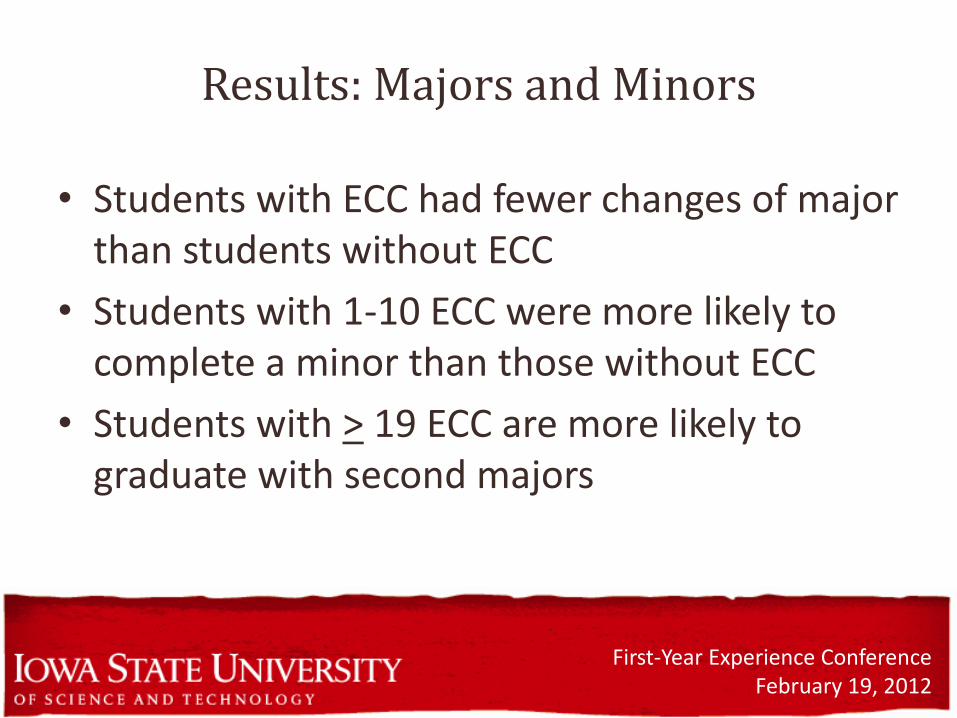
Results: Majors and Minors
• Students with ECC had fewer changes of major than students without ECC
• Students with 1-10 ECC were more likely to complete a minor than those without ECC
• Students with > 19 ECC are more likely to graduate with second majors
First-Year Experience Conference February 19, 2012
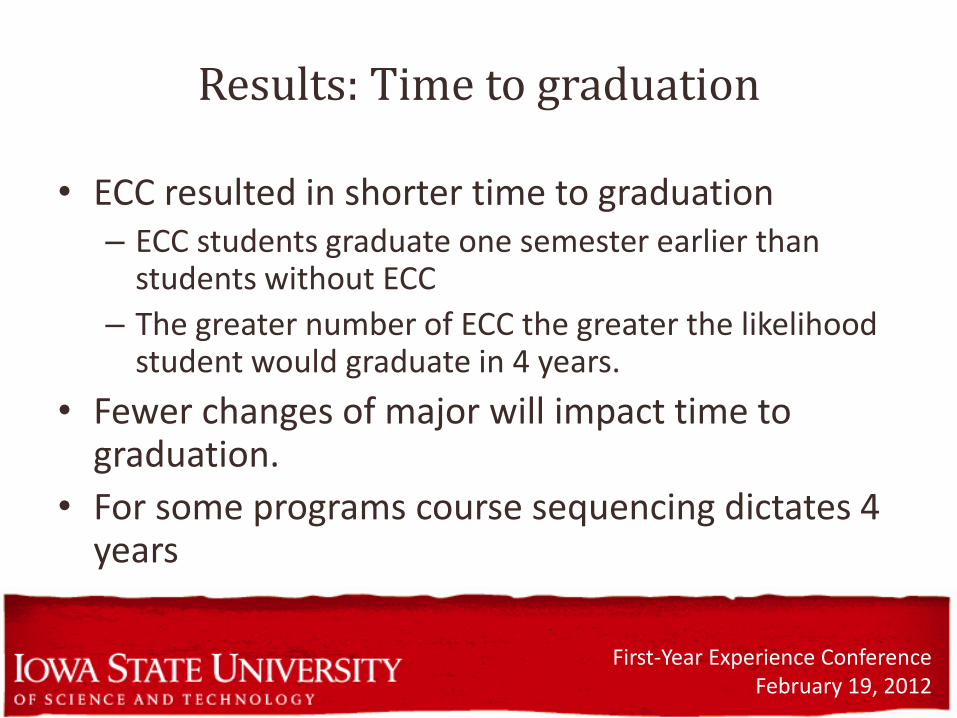
Results: Time to graduation
• ECC resulted in shorter time to graduation – ECC students graduate one semester earlier than
students without ECC
– The greater number of ECC the greater the likelihood student would graduate in 4 years.
• Fewer changes of major will impact time to graduation.
• For some programs course sequencing dictates 4 years

First-Year Experience Conference February 19, 2012
Years to Degree by College (Students entering 2002-2005)
College No ECC 1-6 credits 7-10 credits 11-18 credits 19+ credits
Ag & Life Sci. 4.1 4.0 4.0 3.8 3.6
Business 4.2 4.1 3.9 3.8 3.7
Design 4.4 4.2 4.3 4.3 4.2
Engineering 4.6 4.5 4.3 4.3 4.2
Human Sci. 4.1 3.9 3.9 3.8 3.7
Liberal Arts & Sci.
4.3 4.1 4.0 3.9 3.8

Institutional Impact Beyond Student Success

First-Year Experience Conference February 19, 2012
Student Survey Question:
What advice would you give to students earning college credit and planning to attend ISU?
74% say students in high school should know how ECC credits will apply to ISU

First-Year Experience Conference February 19, 2012
Types of courses students would recommend other students take as ECC
For challenge /Doesn’t matter
12%
Explore interests
16%
Gen Ed 32%
Degree-related 40%

First-Year Experience Conference February 19, 2012
What ISU students would caution future students with ECC to expect related to classes
at ISU May be in advanced courses
9%
Harder classes
16%
May want to repeat
22%
Work more 53%

First-Year Experience Conference February 19, 2012
Student Survey Question:
What advice would you give to Iowa State faculty, advisers and administrators regarding the transition for students with ECC?

First-Year Experience Conference February 19, 2012
Student Advice on ISU Policy & Practice
0
10
20
30
40
50
60
Better articulationand courseplacement
More informationto students
Acceptance ofcredits towards
degree
Transfer in GPAfor ECC courses
Increasedcommunicationwith counselors
Tuition policies

First-Year Experience Conference February 19, 2012
Faculty/Staff Perspective
Two Major Issues/Themes Emerged
• Lack of awareness/knowledge among K-12 students, families and counselors regarding the applicability of these credits.
• Concern for the student development and academic success of students with early credit

First-Year Experience Conference February 19, 2012
Additional Institutional Challenges
• Challenges building first semester class schedules for students: – All transcripts are not submitted before scheduling the
first term
– Needed courses are not ones we hold for orientation
– In high school students take what is available not necessarily what is needed
– To provide appropriate courses for first semester schedules while not overwhelming the student

First-Year Experience Conference February 19, 2012
Additional Institutional Challenges
• Course-based learning communities
• Continued use of the term “Freshmen” for courses, programs and scholarship eligibility.
• Increased workload for Admissions and Registrar’s Staff, and academic advisers.
• Admissions criteria
First-Year Experience Conference February 19, 2012
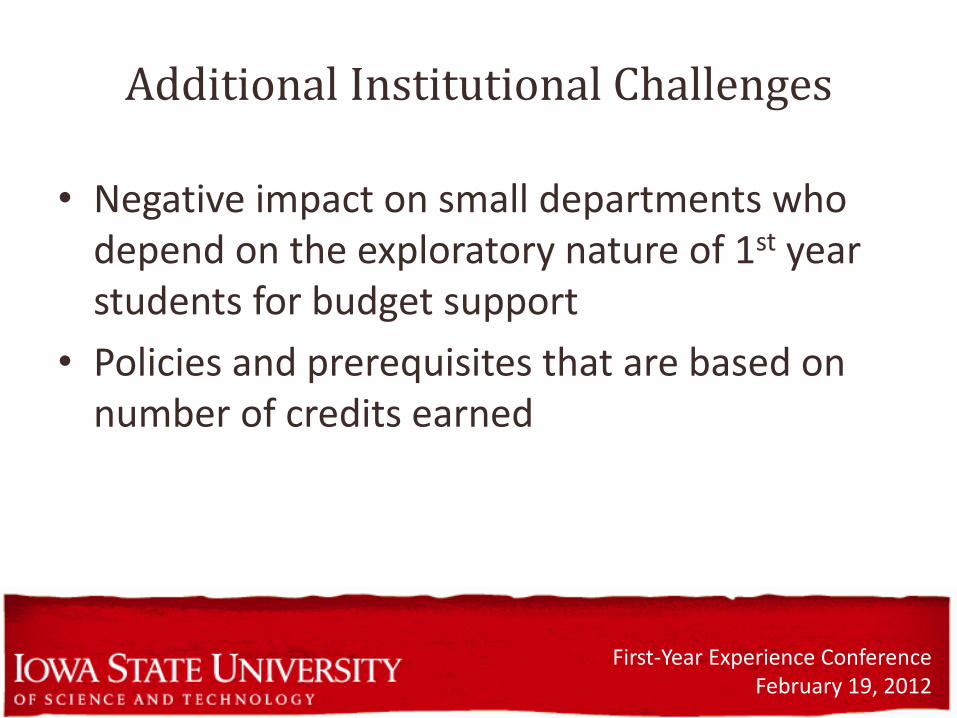
Additional Institutional Challenges
• Negative impact on small departments who depend on the exploratory nature of 1st year students for budget support
• Policies and prerequisites that are based on number of credits earned

First-Year Experience Conference February 19, 2012
Institutional Benefits
• Increased enrollment in second major areas, study abroad, internships, National Student Exchange Program, etc.
• Increase in 4-year graduation rates.
• Reducing time to graduation potentially reduces student debt

Implications for First-Year Experience
First-Year Experience Conference February 19, 2012
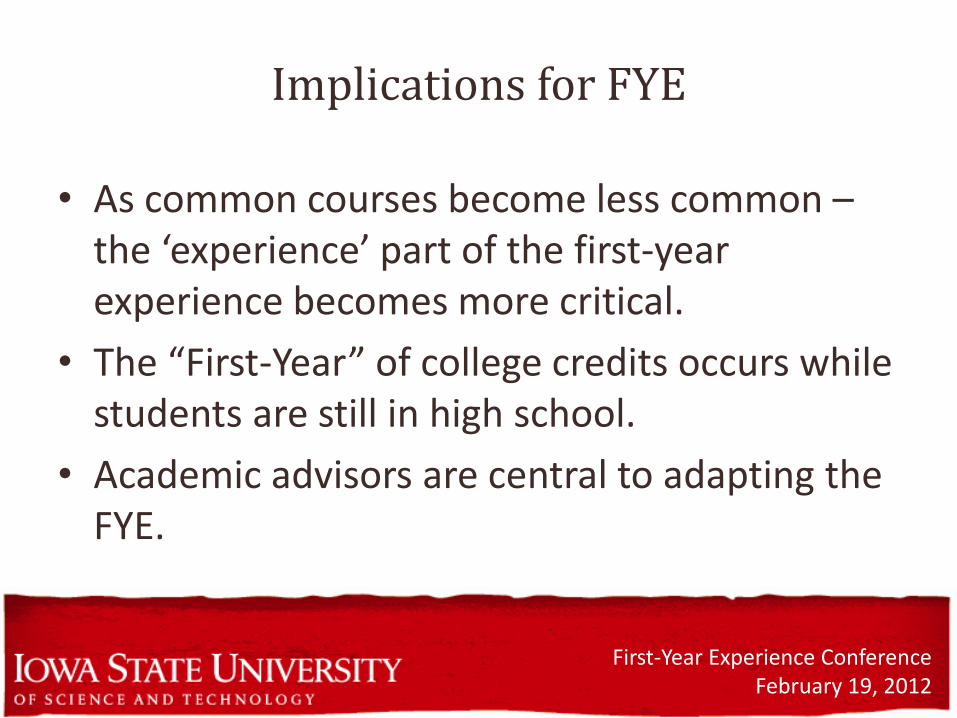
Implications for FYE
• As common courses become less common – the ‘experience’ part of the first-year experience becomes more critical.
• The “First-Year” of college credits occurs while students are still in high school.
• Academic advisors are central to adapting the FYE.

First-Year Experience Conference February 19, 2012
Implications for FYE
• Concerns about adding yet another level of risk to students already potentially ‘at risk’
• The norm/average student has changed
• Need to re-evaluate course-based Learning Communities that are often part of FYE programs
• First-year students in ‘second-year or higher’ courses

First-Year Experience Conference February 19, 2012
Discussion
Other ideas on implications for the First-Year Experience?

First-Year Experience Conference February 19, 2012
Acknowledgement of Task Force Members
• Paul Castleberry – College of Engineering • Jonathan Compton – Office of the Registrar • Maura Flaschner – Admissions • Jane Jacobson – College of Liberal Arts and Sciences • Dayle Nickerson – College of Human Sciences • Tom Polito – College of Ag & Life Sciences • Jason Pontius – Office of the Exec. VP and Provost • Dana Schumacher – University Honors Program • Karen Zunkel (Chair) – Office of the Exec. VP and Provost
Report information to be posted at: www.provost.iastate.edu/acadprog/report/