fresh and mechanical properties of self ... - duet.ac.bd
TRANSCRIPT
i
FRESH AND MECHANICAL PROPERTIES OF
SELF-COMPACTING CONCRETE USING BRICK AGGREGATE
MD. SUMAN MIA
DEPARTMENT OF CIVIL ENGINEERING
DHAKA UNIVERSITY OF ENGINEERING & TECHNOLOGY, GAZIPUR
August 2020

ii
FRESH AND MECHANICAL PROPERTIES OF
SELF-COMPACTING CONCRETE USING BRICK AGGREGATE
A Thesis
by
Md. Suman Mia
Submitted to the Department of Civil Engineering
Dhaka University of Engineering & Technology, Gazipur
In Partial Fulfillment of the Requirements for the Degree
of
MASTER OF SCIENCE IN CIVIL ENGINEERING (STRUCTURAL)
DEPARTMENT OF CIVIL ENGINEERING
DHAKA UNIVERSITY OF ENGINEERING & TECHNOLOGY, GAZIPUR
AUGUST, 2020
iii
APPROVAL
This is to certify that the thesis work submitted by Md. Suman Mia, Student Id.
16201039-P, titled “Fresh and Mechanical Properties of Self-Compacting Concrete
using Brick Aggregate” has been accepted as satisfactory by the Board of Examiners
in partial fulfillment of the requirements for the award of the degree of Master of
Science in Civil Engineering (Structural) on 31 August 2020.
BOARD OF EXAMINERS
----------------------------------------
Dr. Md. Nazrul Islam
Professor
Department of Civil Engineering
DUET, Gazipur, Bangladesh
Chairman
(Supervisor)
----------------------------------------
Dr. Mohammad Nazim Uddin
Professor and Head
Department of Civil Engineering
DUET, Gazipur, Bangladesh
Member
(Ex-Officio)
----------------------------------------
Dr. Md. Abdus Salam
Professor
Department of Civil Engineering
DUET, Gazipur, Bangladesh
Member
----------------------------------------
Dr. Md. Rezaul Karim
Professor
Department of Civil Engineering
DUET, Gazipur, Bangladesh
Member
----------------------------------------
Dr. Md. Tarek Uddin
Professor
Department of Civil & Environmental Engineering
Islamic University of Technology (IUT), Bangladesh
Member
(External)
iv
DECLARATION
This is to certify that the thesis work titled “Fresh and Mechanical Properties of
Self-Compacting Concrete using Brick Aggregate” has been carried out by me at the
Department of Civil Engineering, Dhaka University of Engineering & Technology,
Gazipur, Bangladesh. The above thesis work or any part of it has not been submitted
anywhere for any award of degree or diploma (except for publication).
Candidate’s Signature
…………………………………..
Md. Suman Mia
v
ACKNOWLEDGMENTS
All praises belong to Almighty Allah, the most merciful, the most beneficent and the
most kind for giving me the opportunity, courage and enough energy to carry out and
complete this research work.
I wish to express my sincere appreciation and gratitude to my supervisor Professor
Dr. Md. Nazrul Islam, Department of Civil Engineering, DUET, Gazipur, for his
guidance, support, valuable advice, encouragement, intellectual discussions, and
patience throughout this work. He has given me excellent guidance to select this
research topic and allowed me ample freedom in my research. It is truly an honor to me
for getting an opportunity to work under his supervision. His valuable advice highly
appreciated me to solve various critical issues including materials and laboratory-
related problems.
I would like to acknowledge Professor Dr. Md. Abdus Salam for his exemplary
guidance, monitoring, and constant encouragement during the laboratory works as well
as the preparation of this thesis. He also shared his valuable time, knowledge, and
experience with me to enhance the quality of my thesis.
I would like to thank Professor Dr. Md. Rezaul Karim for willingness to help along
with patience to pull me through this thesis. His countless proof readings, corrections
and support made this document possible, and will not be forgotten.
Particularly, I am extremely obliged for the financial support provided by the
Department of Civil Engineering, DUET, Gazipur, in performing this research work.
My present study would have never been completed without their financial support.
I would like to thank all officers and staff of the Civil Engineering Department for
finding unique ways to encourage me and assist me through the good as well as difficult
stages of this research work.
I would like to express my gratitude to some individuals who enabled me, gave me
enough strength and support in completing my Master’s study. Finally, I would like to
express my heartfelt gratitude to my parents and all of my family members and relatives
for praying for me in every step of life. Their love, dedication, and faith in me are the
constant sources of my strength.

vi
ABSTRACT
To avoid the complexities of vibration and consolidation, a special type of concrete
named self-compacting concrete (SCC) is used in the construction works. SCC can
spread into place due to its self-weight even in areas of congested reinforcement. In
view of the potential construction materials, SCC made with brick aggregate can be
used to meet the demand of structural facilities.
To investigate the fresh and mechanical properties of SCC, 12.5 mm and 19 mm
downgraded brick chips were used as coarse aggregate in combination with coarse sand
and Portland composite cement. Trial mixes of SCC were prepared with various
aggregate and cement contents with fixed water to binder ratios of 0.35 and 0.40 and
different dosages of superplasticizer. A total of twenty four successful SCC mixes were
selected in this study.
To investigate the filling ability, passing ability, and segregation resistance of the fresh
concrete, slump flow, T50 flow time, V-funnel flow, V-funnel flow at T5minutes, L-box
and J-ring tests were performed. Different correlations were developed among the fresh
properties of SCC with brick aggregate. The tests of mechanical properties were
conducted on hardened SCC at 28 days to determine the compressive strength, modulus
of elasticity and splitting tensile strength. This study also carried out to suggest the
relations among compressive strength, splitting tensile strength and modulus of
elasticity for SCC with brick aggregate.
Test results indicated that slump flow, J-ring flow and T50 flow time satisfied the
acceptance criteria for the selected of coarse aggregates. There was no visible blocking
and segregation in the L-box, V-funnel and J-ring tests. Thus, SCC with brick aggregate
can possess all the requirements of fresh properties. The compressive strength of
hardened SCC with brick aggregate ranged from 20.00 MPa to 29.00 MPa and the
splitting tensile strength was about one tenth of the compressive strength. The modulus
of elasticity for SCC with brick aggregate was found similar to normal brick aggregate
concrete and 23% lower than the normal concrete made with natural aggregates.
Therefore, SCC with brick aggregate may be an alternative source to the engineers for
concrete construction in Bangladesh.

vii
TABLE OF CONTENTS
Title Page No.
APPROVAL III
DECLARATION IV
ACKNOWLEDGMENTS V
ABSTRACT VI
TABLE OF CONTENTS VII
LIST OF TABLES XI
LIST OF FIGURES XII
NOTATIONS XIV
CHAPTER I INTRODUCTION 1
1.1 GENERAL 1
1.2 PROBLEM STATEMENT 2
1.3 OBJECTIVES OF THE RESEARCH 3
1.4 SCOPE OF THE RESEARCH 3
1.5 OUTLINE OF THE THESIS 4
CHAPTER II LITERATURE REVIEW 6
2.1 INTRODUCTION 6
2.2 DEFINITION OF SCC 6
2.3 ADVANTAGES OF SCC 6
2.4 DEVELOPMENT OF SCC 8
2.5 CLASSIFICATION OF SCC 11
2.6 INGREDIENTS OF SCC 13
2.6.1 Aggregates 14
2.6.2 Cement 19
2.6.3 Admixtures 20
2.7 MIX DESIGN 20
2.8 FRESH PROPERTIES 23
2.8.1 Filling Ability 24
2.8.2 Passing Ability 25
2.8.3 Segregation Resistance 25
2.8.4 Correlations between Fresh Properties of SCC 25
2.9 MECHANICAL PROPERTIES 27

viii
2.9.1 Compressive Strength 28
2.9.2 Splitting Tensile Strength 28
2.9.3 Modulus of Elasticity 29
2.10 SUMMARY 30
CHAPTER III MATERIALS AND METHODOLOGY 31
3.1 INTRODUCTION 31
3.2 MATERIALS 32
3.3 TESTING OF THE MATERIALS 32
3.3.1 Tests for Coarse Aggregate 32
3.3.2 Tests for Fine Aggregate 35
3.3.3 Test for Binding Materials 36
3.3.4 Water 37
3.3.5 Superplasticizer 37
3.4 MIX DESIGN OF SCC 38
3.4.1 Trial and Error Method of Mix Proportioning 39
3.4.2 Detailed on Mix Design 39
3.5 PREPARATION OF CONCRETE SPECIMEN 47
3.5.1 Batching of the Materials 47
3.5.2 Mixing of the Concrete 47
3.5.3 Testing of Fresh Properties of SCC 48
3.5.4 Placing of Fresh Concrete 48
3.5.5 Removal of Mold 48
3.5.6 Curing of Concrete 48
3.5.7 Testing of Hardened Concrete 49
3.6 FRESH PROPERTIES OF SCC MIXTURES 49
3.6.1 Slump-Flow and T50 Flow Test 49
3.6.2 J-Ring Test 50
3.6.3 V-funnel Flow and V-funnel Flow at T 5minutes Test 52
3.6.4 L-Box Test 53
3.7 MECHANICAL PROPERTIES OF SCC 55
3.7.1 Compressive Strength 56
3.7.2 Splitting Tensile Strength 56
3.7.3 Modulus of Elasticity of SCC 57
3.8 SUMMARY 58

ix
CHAPTER IV RESULTS AND DISCUSSION 59
4.1 GENERAL 59
4.2 PROPERTIES OF MATERIALS 59
4.2.1 Coarse Aggregate 59
4.2.2 Fine Aggregate 61
4.2.3 Cement 62
4.2.4 Superplasticizer 63
4.3 PHYSICAL OBSERVATION OF FRESH CONCRETE 63
4.4 FRESH PROPERTIES OF SCC WITH BRICK AGGREGATE 65
4.4.1 Filling Ability 66
4.4.1.3 V- Funnel Flow 71
4.4.2 Passing Ability 72
4.4.3 Segregation Resistance 76
4.5 CORRELATION BETWEEN FRESH PROPERTIES
OF SCC WITH BRICK AGGREGATE 77
4.5.1 Correlation between Slump Flow and J-ring Flow of SCC with
Brick Aggregate 77
4.5.2 Correlation between Slump Flow and T50 Flow Time of SCC 78
4.5.3 Correlation between J-ring Flow and T50 Flow Time of SCC 79
4.6 MECHANICAL PROPERTIES OF SCC WITH
BRICK AGGREGATE 80
4.6.1 Compressive Strength 81
4.6.2 Splitting Tensile Strength 86
4.6.3 Modulus of Elasticity 87
4.7 CORRELATION BETWEEN MECHANICAL PROPERTIES 87
4.7.1 Correlation between Compressive Strength and Splitting Tensile
Strength 88
4.7.2 Correlation between Compressive Strength and Modulus of
Elasticity 89
4.8 SUMMARY 91
CHAPTER V CONCLUSIONS AND RECOMMENDATIONS 92
5.1 INTRODUCTION 92
5.2 CONCLUSIONS 92
5.2.1 Fresh Properties of SCC with Brick Aggregate 92
5.2.2 Mechanical Properties of SCC with Brick Aggregate 93

x
5.3 CONTRIBUTION OF THE STUDY 94
5.4 RECOMMENDATIONS FOR FUTURE STUDY 94
REFERENCES 96
APPENDICES 104
APPENDIX-A PHOTOGRAPHS OF THE INGREDIENTS 104
APPENDIX-B ANALYSIS AND RESULTS OF THE PROPERTIES
OF THE AGGREGATES . 110
APPENDIX-C SUMMARY OF THE TEST RESULTS 118
APPENDIX-D STRESS-STRAIN GRAPHS OF CYLINDRICAL
SPECIMENS . 121
xi
LIST OF TABLES
Table No. Table Caption Page No.
Table 2.1 Typical range of SCC mix composition (EFNARC, 2005) 21
Table 2.2 SCC proportioning trial mixture parameters (ACI 237R-07, 2007) 23
Table 2.3 List of test methods for workability properties of SCC
(EFNARC, 2002) 23
Table 2.4 Acceptance criteria for self-compacting concrete
(EFNARC, 2002) 24
Table 2.5 Correlation between Fresh Properties of SCC
(Safiuddin et al., 2011a) 26
Table 2.6 Correlation between the fresh properties of SCC with palm
oil fuel ash (Safiuddin et al., 2011b) 27
Table 3.1 Ingredients of SCC with BA 32
Table 3.2 Proportion of the unsuccessful trial mixes 41
Table 3.3 Identification of specimens 43
Table 3.4 Proportion of the successful SCC mixes with BA 46
Table 3.5 Volumetric calculation of the ingredients of SCC with BA 46
Table 3.6 Cost of the materials for a cubic meter SCC mixes with BA 47
Table 4.1 Properties of coarse and fine aggregates 60
Table 4.2 Test Results of Cement 62
Table 4.3 Compound compositions of portland composite cement 63
Table 4.4 Technical data of superplasticizer 63
Table 4.5 Fresh properties of SCC with brick aggregate 65
Table 4.6 Mechanical properties of SCC with brick aggregate 80
Table 4.7 Correlation between compressive strength and splitting
tensile strength proposed by researchers 89
Table 4.8 Correlation between compressivestrength and modulus
of elasticity proposed by researchers 90

xii
LIST OF FIGURES
Figure No. Figure Caption Page No.
Fig. 2.1 Definition of self-compacting concrete (Ozawa et al., 1992) 7
Fig. 2.2 Advantages of SCC (Ozawa et al., 1992) 8
Fig. 2.3 Method of achieving self compactability (Okamura and Ouchi, 2003) 10
Fig. 2.4 Comparison of proportion of the materials for SCC and
Conventional concrete (Okamura and Ouchi, 2003) 13
Fig. 2.5 Variables involved in establishing the required fresh SCC
properties (ACI 237R-07, 2007) 22
Fig. 3.1 Crushed bricks as coarse aggregate 33
Fig. 3.2 Fine Aggregate (Coarse Sand) 36
Fig. 3.3 Method of deflocculation and water liberation with use
of Superplasticiser (Deeb and Karihaloo, 2013) 37
Fig. 3.4 Superplasticizer Con-Lub SP 38
Fig. 3.5 Some unsuccessful attempts of fresh SCC 42
Fig. 3.6 Standard mixing sequence (Lotfy, 2006) 48
Fig. 3.7 Slump Flow equipment 50
Fig. 3.8 Slump flow test of SCC with brick aggregate 50
Fig. 3.9 J-Ring test apparatus 51
Fig. 3.10 J-Ring test of SCC with brick aggregate 51
Fig. 3.11 V-funnel test apparatus 52
Fig. 3.12 V-funnel and V-funnel at T5 minutes test 53
Fig. 3.13 L-Box flow test apparatus (all units in mm) 54
Fig. 3.14 L-box filled with concrete 54
Fig. 3.15 Concrete passes through L-box 55
Fig. 3.16 Flow of concrete in L-box. 55
Fig. 3.17 Testing of splitting tensile strength 56
Fig. 3.18 Testing of modulus of elasticity 58
Fig. 4.1 Gradation curve of 12.5 mm downgraded coarse aggregate 60
Fig. 4.2 Gradation curve of 19 mm downgraded coarse aggregate 61
Fig. 4.3 Gradation curve of fine aggregate 62
Fig. 4.4 Surface of the fresh concrete with bubbles formation 64
Fig. 4.5 Surface of the fresh concrete without bubbles formation 64
Fig. 4.6 Variation of Slump Flow of SCC with Brick Aggregate 66
Fig. 4.7 Variation of slump flow of SCC (w/c = 0.35) 67
Fig. 4.8 Variation of slump flow of SCC (w/c = 0.40) 68
Fig. 4.9 T50 slump flow time of SCC using brick aggregate 69
xiii
Fig. 4.10 Variation of slump flow and T50 flow time of SCC 70
Fig. 4.11 Time needed for V-funnel flow 71
Fig. 4.12 Relation between slump flow and V-funnel flow time 72
Fig. 4.13 Variation of slump flow and J-ring flow of SCC with BA 73
Fig. 4.14 Blocking index of SCC mixes with BA 74
Fig. 4.15 Height difference in J-Ring Flow Test of SCC with BA 74
Fig. 4.16 Blocking ratio of SCC Mixes with BA 75
Fig. 4.17 Time needed for V-funnel flow at T5minutes 76
Fig. 4.18 Correlation between J-ring flow and slump flow of SCC 78
Fig. 4.19 Correlation between slump flow and T50 flow time of SCC 79
Fig. 4.20 Correlation between J-ring flow and T50 flow time of SCC 79
Fig. 4.21 Compressive Strength of SCC with Brick Aggregate 81
Fig. 4.22 Effect of aggregate size and cement contents on the
compressive strength of SCC at w/c of 0.35 82
Fig. 4.23 Effect of aggregate size and cement contents on the
compressive strength of SCC at w/c of 0.40 83
Fig. 4.24 Variation of 28 days compressive strength of SCC with 12.5 mm CA 84
Fig. 4.25 Variation of 28 days compressive strength of SCC with 19 mm CA 85
Fig. 4.26 Failure plane of concrete specimens 85
Fig. 4.27 Splitting tensile strength of SCC with brick aggregate. 86
Fig. 4.28 Relationship between compressive strength and
splitting tensile strength 87
Fig. 4.29 Correlation between compressive strength and splitting
tensile strength of SCC with brick aggregate 88
Fig. 4.30 Correlation between compressive strength and modulus
of elasticity of SCC with brick aggregate 90

xiv
NOTATIONS
ACI = American Concrete Institute
ASTM = American Society for Testing and Materials
BA = Brick Aggregate
BI = Blocking Index
BR = Blocking Ratio
Ec = Modulus of Elasticity of Concrete
EFNARC = European Federation of National Associations Representing for Concrete
fʹc = Compressive Strength of Concrete at 28 days
fr = Modulus of Rupture
fsp = Splitting Tensile Strength
HRWR = High Range Water Reducer
HWRA = High Water Reducing Admixture
kN = kilo Newton
mm = millimeter
MPa = Mega Pascal (N/mm2)
NC = Normal Concrete
NCA = Natural Coarse Aggregate
POFA = Palm Oil Fuel Ash
RCA = Recycled Coarse Aggregate
SCC = Self-Compacting Concrete
SCM = Supplementary Cementitious Materials
sec = Seconds
SP = Superplasticizer
SSD = Saturated Surface Dry
VMA = Viscosity Modifying Admixture
w/c = Water to Cement Ratio

1
CHAPTER 1 CHAPTER I …………………..
. INTRODUCTION
1.1 GENERAL
Self-compacting concrete (SCC) is a new technology in the concrete industry. It has
become popular because of the improvement of the quality of the concrete and the better
working environment. To enhance the expected strength and durability of concrete, it
is required to produce the less porosity, honeycomb and segregation free durable
concrete. Vibration and compaction are needed for proper placement of fresh concrete
to produce the quality concrete. Sometimes it is not possible to produce quality concrete
due to lack of skilled labor and huge energy consumption. It is also difficult to place
the concrete in the congested areas of reinforcement. To overcome these problem SCC
can be used to avoid the complexities of vibration, compaction and placement of
concrete. SCC is a highly flowable concrete. It can spread radially into the place due to
its self-weight only. It can be placed in the area of highly congested reinforcement. SCC
can be compacted and consolidated without vibration.
SCC is a complex system that is usually proportioned with one or more mineral
admixtures and chemical admixtures in addition to the constituent of normal concrete.
SCC typically includes the same materials as conventionally placed concrete; however,
a special high range water reducer (HRWR) and a viscosity modifying admixture
(VMA) may be used. Therefore, the differences between SCC and conventionally
placed concrete are related to workability and to the changes in materials and mixture
proportions required to achieve workability. The workability of SCC is defined in terms
of three properties: filling ability, passing ability, and segregation resistance which are
also known as the fresh properties of SCC. Filling ability describes the ability of
concrete to flow under its own mass and completely fill the formwork. Passing ability
describes the ability of concrete to flow through confined conditions, such as the narrow
openings between reinforcing bars. Although increasing the filling ability typically
increases passing ability, a high level of filling ability does not assure passing ability.
Segregation resistance describes the ability of concrete to remain uniform in
composition during placement. Segregation resistance includes both static and dynamic
stability. Static stability describes segregation resistance when concrete is at rest.
Dynamic stability describes segregation resistance when concrete is not at rest such as
during mixing and placing (Koehler and Fowler, 2007).
2
The idea of self-compacting was initially proposed by Professor Hajime Okamura in
Japan in 1986 at the University of Tokyo and the large Japanese contractors (Okamura
and Ozawa, 1995). SCC was first developed in Japan and an empirical method for mix
design of SCC was recommended by Okamura and Ozawa (1995). The mechanism for
achieving the self-compatibility of fresh concrete was introduced by Okamura and
Ouchi (2003).
SCC can be pumped from the underneath of a form or dropped from the most effectively
with a recommended maximum fall height of 6 feet (ACI 237R-07, 2007). When SCC
is used with the standard execution method, the construction period is unchanged and
the manpower requirement falls by about 10% (Kato et al., 1993).
To completely fill the formwork and equally distribute the fresh concrete in the
structure, consolidation is very important. Sometimes it is not possible to vibrate and
consolidate the fresh concrete due to poor workmanship and lack of equipment. Due to
having self-consolidating property SCC has overcome this problem (Safiuddin et al.,
2014).
1.2 PROBLEM STATEMENT
In Bangladesh, the growth of structural activities is increasing very rapidly. In that
case, the natural stone has a limited source and there is a crisis to meet the present
demands. Crushed bricks are widely used as an alternative source of natural stone
aggregate in this region. Brick aggregates are locally available, and cheaper than stone
aggregate. To enhance the expected mechanical properties, it is essential to confirm the
proper placement and compaction of concrete. In context of Bangladesh skilled labors
are not available and cost of the skilled labors are high. Sometimes it is not possible to
ensure the proper compaction and placement even in the presence of skilled laborers
and equipment. This problem can be minimized by using SCC. In view of the potential
construction materials, SCC with brick aggregate can be introduced to overcome these
problems and it is required to grab the benefit of new construction materials like SCC
with brick aggregate.
Researchers have investigated various properties of SCC with different types of
aggregates. Fresh and mechanical properties of SCC with natural aggregate was studied
by Mohamad et.al (2016). Fresh properties of SCC were investigated with crushed
granite stone incorporating palm oil fuel ash (POFA) Safiuddin et al. (2011a) and fresh
properties of SCC with recycled concrete aggregate were investigated by Safiuddin et
al. (2012a). Microstructure of high strength SCC with POFA was investigated by Salam

3
et al. (2013). Furnace slag, expanded clay and expanded shale were used as coarse
aggregate by Abdurrahman Lotfy (2006) to study the properties of SCC. Khaleel et al.
(2011) used crushed gravel, uncrushed gravel and crushed limestone to investigate the
effect of coarse aggregate on fresh and hardened properties of SCC. Five different types
coarse aggregate such as basalt, marble, dolomite, limestone and sand stone were used
to study the mechanical properties of SCC by Uysal (2012). An attempt were taken by
Roy et al. (2019) to make SCC with locally available brick aggregate incorporating
different w/c ratio. Dey et al. (2016) investigated the effect of recycled brick aggregate
replacement on the rheological and mechanical properties of self-compacting concrete.
However, most of the previous efforts and attempts in the field of SCC were concerned
with different types of coarse aggregates. A very few attempts were taken to study the
SCC using crushed brick as coarse aggregate. Development of SCC with BA is
expected to improve the homogeneity of the concrete, to eliminate the scarcity of skilled
labor and non-uniformity of concrete with the consumption of less energy. Therefore,
it is necessary to develop proper proportions and guidelines of SCC with BA.
To fill the formwork uniformly and to spread the fresh concrete in the structure without
compaction and vibration, SCC with BA is expected to play an important role in the
construction sectors. Therefore, research on SCC with brick aggregate will be very
interesting.
1.3 OBJECTIVES OF THE RESEARCH
The principal goal of this research was to investigate the properties of self-compacting
concrete made with crushed brick as coarse aggregate. The specific objectives of this
research were:
a. To investigate the fresh properties of self-compacting concrete with brick
aggregate;
b. To evaluate the effect of brick aggregate on the mechanical properties of self-
compacting concrete;
c. To suggest the potential use of brick aggregate for the production of self-
compacting concrete.
1.4 SCOPE OF THE RESEARCH
This research was associated with the investigation of the fresh and mechanical
properties of self-compacting concrete made with crushed brick as coarse aggregate.
To study the feasibility of SCC with brick aggregate, 19 mm downgraded and 12.5 mm

4
downgraded brick chips were used as coarse aggregate which was prepared by crushing
well burnt first class bricks. Locally available coarse sand as fine aggregate and
Portland Composite Cement (BS EN 197-1:2011/CEM II) as binding material were
used in the preparation of concrete. SCC mixes were fixed by various contents of coarse
aggregate (550 kg/m3, 560 kg/m3 570 kg/m3 and 580 kg/m3) and cement contents (450
kg/m3, 470 kg/m3, 500 kg/m3, 530 kg/m3, 550 kg/m3 and 580 kg/m3). These mixes were
prepared following the EFNARC (2002 and 2005) guidelines and laboratory trial to
satisfy the criteria of SCC. A total of twenty-four successful mixes were prepared with
water binder ratios of 0.35 and 0.40. To increase the workability with less water-cement
ratio, high range water reducer (HRWR) was used as superplasticizer (SP). The
gravimetric mixes were prepared using these materials to investigate the fresh and
mechanical properties. Concrete mixes were varied with the aggregate size, aggregate
volume, dosages of HRWR and water content. Several attempts were carried out to fix
the volume of paste and aggregate to justify the following properties of fresh concrete.
Slump flow
T50 slump flow time
V-funnel flow time
V-funnel flow at T5minutes
J-ring flow
J-ring blocking index
Height difference just inside and outside of the bar at J-Ring
L-box blocking ratio.
After confirming the successful trial mixes, mechanical properties of hardened concrete
were tested in the laboratory. To satisfy the structural requirements of SCC with brick
aggregate, the following mechanical properties have been investigated:
Compressive strength at 28 days (fʹc)
Splitting tensile Strength (fsp)
Modulus of elasticity (Ec).
1.5 OUTLINE OF THE THESIS
This thesis focused on the fresh and mechanical properties of SCC with brick aggregate.
It is organized into five chapters describing a summary of the content of each chapter.
In the first chapter, a brief introduction is given about SCC, research significance,
objectives, scope and outline of the thesis.
5
Chapter II describes the historical development of SCC from the very beginning with
the continuous improvement over ninety decades. Based on the review of literature it
includes various materials used in the production of SCC and historical background of
mix proportion. In addition, this chapter describes fresh as well as mechanical
properties of SCC with various aggregates that found from literatures.
The detailed research methodology including the collection and preparation technique
of the materials and testing method used in this research are included in Chapter III.
This chapter also explains a detailed research plan, mix proportions and different testing
procedures of the materials. In addition, this chapter describes the preparation, testing
of the fresh properties of SCC, curing and testing standards or procedure of hardened
concrete specimen that was used in this research.
Chapter IV presents and discusses the test results that were obtained from different
experiments. It also gives various fresh and mechanical properties of SCC specimens
made with brick chips. Correlation between fresh and mechanical properties are
illustrated here. After analyzing the test results, the feasibility to the potential use of
SCC with brick aggregate with different condition have been checked.
In the last chapter, the conclusions and recommendations on the fresh and mechanical
properties of SCC with brick aggregate concrete are reported.
6
CHAPTER 2 CHAPTER II
…………………. LITERATURE REVIEW
2.1 INTRODUCTION
In this chapter, the literature relevant to this research are reviewed. A significant amount
of research paper and articles were studied with respect to different aspects to Self-
Compacting Concrete (SCC) such as mixture proportion methods, fresh and mechanical
properties including the history of the development of SCC. The effects of the use of
different aggregates on the fresh and mechanical properties of SCC have been studied
in this chapter. The literature emphasizes that the use of brick aggregate plays an
important role as a potential material for the production of SCC. A short summary of
various papers and articles were studied and reported here.
2.2 DEFINITION OF SCC
Self-compacting concrete (SCC) is known as super workable concrete or self-
compactable concrete. It is a relatively new type of high performance concrete. This
concrete can be placed without vibration equally well even in the heavily reinforced
sections. It has excellent deformability and segregation resistance, which result in the
quality of the hardened concrete. SCC being independent of the workmanship during
placing. SCC can possess the excellent filling ability, passing ability and segregation
resistance which are known as fresh properties. According to the specification and
guideline of EFNARC (2002), a concrete mix can be classified as SCC if it possesses
the required filling ability, passing ability, and segregation resistance. Self-compacting
concrete (SCC) is defined as, a highly flowable concrete that does not segregate and
can spread into place, fills the formwork with heavily congested reinforcement, and
encapsulates the reinforcement without any mechanical vibration (ACI 237R-07,
2007). It is also known as self-consolidating concrete, self-leveling concrete, self-
placing concrete which all are subsets of SCC. The definition of SCC was included by
Ozawa (Ozawa et al., 1992) which is shown in Fig. 2.1
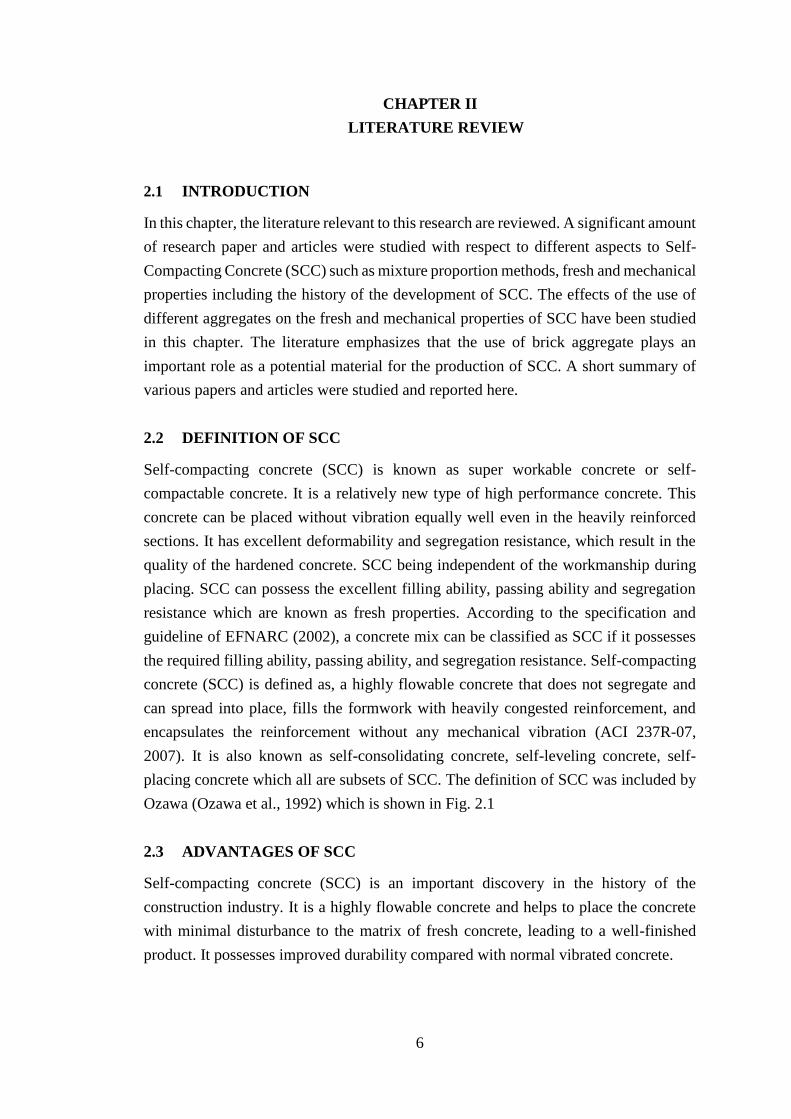
2.3 ADVANTAGES OF SCC
Self-compacting concrete (SCC) is an important discovery in the history of the
construction industry. It is a highly flowable concrete and helps to place the concrete
with minimal disturbance to the matrix of fresh concrete, leading to a well-finished
product. It possesses improved durability compared with normal vibrated concrete.

7
Fig. 2.1: Definition of self-compacting concrete (Ozawa et al., 1992)
Properly proportioned and placed SCC can result in both economic and technological
benefits for the end user. SCC can provide the following benefits:
Reduce labor, labor cost and equipment.
No need for vibration to ensure proper consolidation.
Ensure the flat surfaces of concrete (self-leveling characteristic).
Enable the casting of concrete that develops the desired mechanical properties.
Accelerate construction and shorter construction duration.
Facilitate the filling of concrete in highly reinforced sections and complex
formwork
Increase construction quality. This can ensure better productivity.
Reduce noise on the job site
Reduce the need of vibration for construction
Permit more flexibility for detailing reinforcing bars and avoid the need to
bundle reinforcement
Create smooth surfaces free of honeycombing and signs of bleeding and
discoloration.
However, the advantages of SCC were summarized by Ozawa et al. (1992) and shown
in Fig. 2.2.
8
Fig. 2.2: Advantages of SCC (Ozawa et al., 1992)
SCC often accompanied by some disadvantages. The main disadvantages of SCC are:
Higher material cost
Higher standard quality control is required for its production
Higher lateral pressure on the formwork
Higher pumping resistance.
However, these disadvantages can be reduced through proper management and
improved mix design.
2.4 DEVELOPMENT OF SCC
Nowadays SCC is a classy building material and a part of modern Civil Engineering
technology. Its use is increasing in the strategy of concrete placement on construction
sites. The number of structures that use this concrete is increasing year to year and
growing anticipation of its effectiveness. The affluent use of SCC requires a valuable
understanding of the behavior of this material, which is vastly divergent from traditional
concrete. For this motive, a lot of research has been conducted on this aspect all around
the world for the last 30 years intended for both practitioners and scientists. The

9
problem of the durability of concrete structures was a major topic of interest in Japan
beginning in 1983. This situation is seen as a major problem facing Japanese society.
The gradual reduction of the number of skilled workers in Japan's construction industry
has caused a similar reduction in the quality of construction work. Therefore, the
development of self-compacting concrete is necessary to guarantee durable concrete
structures in the future.
The idea of self-compacting was initially proposed by Professor Hajime Okamura in
Japan in 1986 (Okamura, 1986) at the University of Tokyo and the reputed Japanese
contractors (e.g. Kajima Co., Maeda Co., Taisei Group Co., etc.). The first prototype
was developed in August 1988 (Ozawa et al., 1992) with satisfactory performance in
hardening, shrinkage, heat of hydration and other properties. Within the last couple of
years, the entire world has increased usage of SCC for cast-in-place and particularly for
precast concrete construction. Many agencies worldwide demonstrate interest and are
working towards developing tests, specifications and finally adopting this kind of
concrete. A lot of initial work and investigation have already been done in Japan and
Europe and it is very important to develop the knowledge of understanding and the
usage of SCC in the Bangladesh for the adoption and enhancement of the concrete
products.
SCC was first introduced with the name Consolidation Free Concrete 1986 (Okamura,
1986). The authors also use the term ‘High-Flowability’ and ‘Superflowable’ but they
do not clearly indicate the consolidation property. Due to having the ability of filling
the corner of the formwork under its own weight, it refers to self-compacting
concrete (Ozawa et al., 1992).
Ozawa et al. (1989) have used high-performance concrete which exhibits excellent
performances in the fresh and hardened state. To avoid misleading, the same sense of
self-compacting concrete has been used in Europe and America, the authors use Self-
Compacting High-Performance Concrete to refer the concrete which advocates the
capabilities while fresh state (Okamura and Ozawa, 1994).
The SCCs were used under trade names, such as the NVC (Non-vibrated concrete) of
Kajima Co., SQC (Super quality concrete) of Maeda Co. or the Biocrete (Taisei Co.).
Simultaneously with the developments in the SCC area, research and development
continued in mix-design and placing of underwater concrete where new admixtures
were producing SCC mixes with performance matching that of the Japanese SCC
concrete (Ferraris, 1999).
10
The idea of SCC turned into a spread to the sector after the presentation on self-
consolidating concrete by Ozawa et al. (1992). In April 1997, the Japanese Society of
Civil Engineers (JSCE, 2007) formed a studies sub-committee for setting up hints for
the realistic application of SCC. This changed into finally published in English in
August 1999 (Uomoto, 1999). In August 1998, the first workshop on self-consolidating
concrete turned into held in Kochi, Japan which was an important event for the
development of SCC.
In the overdue nineties, interest and use of SCC unfold from Japan to other international
locations, which includes Europe. Sweden becomes the first in the Europe to start the
development of SCC, and in 1993 the CBI organized a seminar in Sweden for
contractors and manufacturers leading to a challenge aimed at reading SCC for housing
(Billberg, 1999). A specification has been produced in 2002 by EFNARC (EFNARC,
2002) aiming to offer a tenet for the design and use of SCC in Europe primarily based
on contemporary research findings. Most of the important European international
locations have advanced or present inside the system of developing tips or
specifications for the usage of SCC.
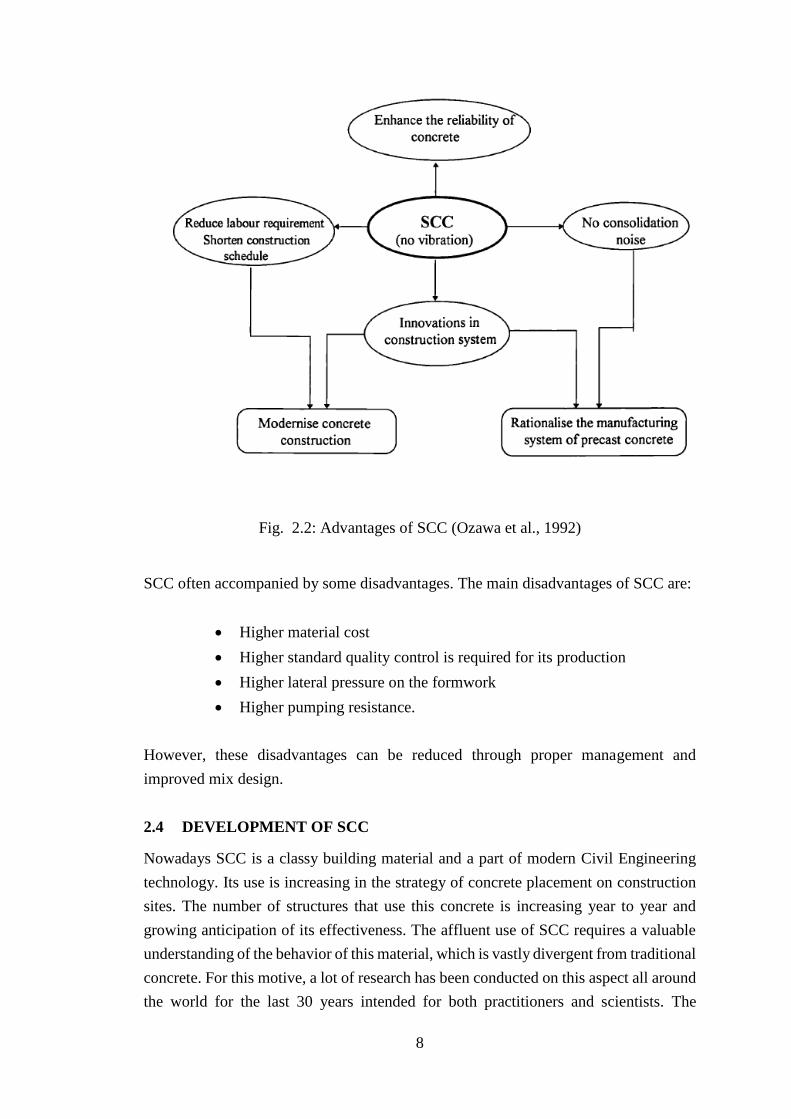
The mechanism of obtaining self-compatibility and the proportion of the materials for
SCC are found in literatures. Mechanism of achieving self-compactability, mix design
method and testing method were proposed by Okamura and Ouchi (2003). They have
employed the method to achieve the self compactability shown in Fig. 2.3.
Fig. 2.3: Method of achieving self compactability (Okamura and Ouchi, 2003)
11
Since the early development of SCC in Japan, this new class of high-performance
concrete has been employed in several countries in cast-in-place and precast
applications (Okamura and Ozawa, 1994; Ferraris, 1999; JSCE, 2007; Uomoto and
Ozawa, 1999). The following references provide various examples of the early use of
SCC in civil engineering applications (Okamura and Ouchi, 2003; Billberg, 1999;
RELIM, 2000; Skarendahl, 2013).
SCC has recently been used in concrete repair applications in Canada and Switzerland,
including the repair of bridge abutments and pier caps, tunnel sections, parking garages,
and retaining walls, where it ensured adequate filling of restricted areas and provided
high surface quality (Ouchi, 2001; Hayakawa et al. 1995).
However, the research on SCC spreads all over the world. Researchers have carried
out the studies on self-compacting concrete to improve the best quality concrete and
its application is systematically in progress.
2.5 CLASSIFICATION OF SCC
The requirements for SCC in the fresh state depend on the type of application, and
especially on confinement conditions, placing equipment, placing methods and
finishing methods. Based on the application and fresh state, SCC can be classified to
cover these requirements according to EFNARC (2005).
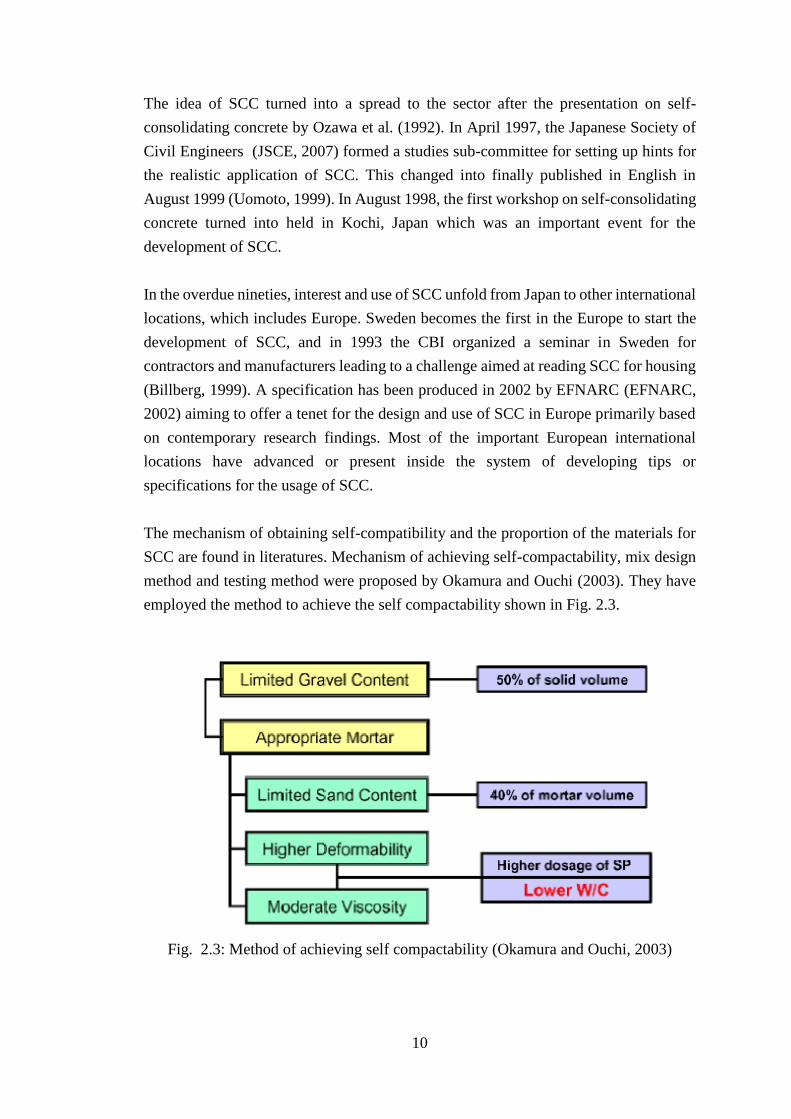
Based on slump flow:
Slump-Flow Class Slump-flow (mm)
SF1 550 to 650
SF2 660 to 750
SF3 760 to 850
The following are typical slump-flow classes for a range of applications:
SF1 (550-650 mm) is appropriate for unreinforced or slightly reinforced concrete
structures that are cast from the top with free displacement from the delivery point. SF2
(660-750 mm) is suitable for many normal applications e.g. walls, columns and SF3
(760-850 mm) is typically produced with a small maximum size of aggregates (less
than 16 mm) and is used for vertical applications in very congested structures.

12
Based on Viscosity:
Viscosity Class T500 (sec) V-funnel time (sec)
VS1/ VF1 ≤ 2 ≤ 8
VS2/ VF2 > 2 9 to 25
Based on passing ability (L-Box):
Passing ability Class Passing ability
PA1 ≥ 0.80 with 2 rebars
PA2 ≥ 0.80 with 3 rebars
Based on the visual stability properties of slump flow area of concretes, Kandemir et
al. (2010) classified self-compatibility as:
Self-compatibility Visual information notes
Proper SCC
No indication of segregation. Uniform aggregate distribution
throughout, coarse aggregate carried to the perimeter of the
slump flow. No indication of bleed water or mortar halo on the
surface or around the perimeter.
Acceptable SCC Little evidence of mortar halo and bleed water separation. Good
aggregate distribution, although a small ring of mortar is
present at the outer edges of the slump flow.
Marginal SCC Mix exhibits signs of instability and segregation. More
pronounced mortar halo or uneven distribution of aggregate is
expected.
Unacceptable SCC Mix exhibiting poor aggregate distribution, segregation and
excessive bleed water. Coagulation of the coarse aggregate
particles in the center of the slumping area. Separation of
mortar around the perimeter of the slump-flow area.

13
2.6 INGREDIENTS OF SCC
The basic ingredients of SCC are similar to those of normal concrete. Generally, the
aggregates occupy 55–60% of the SCC volume (Nischay et al., 2015) and play a
substantial role in determining the workability, strength, dimensional stability, and
durability of concrete. Sometimes chemical admixture like high range water reducer
(HRWR) and viscosity modifying admixture (VMA) may be used with the constituent
of normal concrete to produce SCC.
SCC design has little difference from conventional concrete. It may have more fine
contents to fill up existing pours in concrete. SCC mixtures typically designed to have
a higher paste volume, lesser coarse aggregate and higher sand to coarse aggregate ratio
compared to traditional concrete. Increased paste volume can be obtained by increasing
the fine contents. But a well-distributed aggregate grading can reduce fines materials
and dosage of admixture. For successful SCC design, the smaller aggregate is better.
Because it spread out easily by own weight and passing through congested
reinforcement. An ideal SCC should contain a well grade of aggregate size (20-25) mm
(Olafusi et al., 2015) and superplasticizers to achieve a target flowing ability passing
ability and segregation resistance.
Conventional concrete with stone chips has a high water-cement (w/c) ratio for proper
placement of fresh concrete into formwork with heavily congested reinforcement. A
higher w/c ratio for increasing the flowability of concrete may compromise the
durability of SCC. But the proper design of SCC with lower w/c ratio in addition with
HRWR and VMA can flow easily through the congested reinforcement and properly
fill the forms without reducing the strength. A comparison of proportioning of the
materials for SCC and conventional concrete is shown in Fig. 2.4 (Okamura and Ouchi,
2003).
Fig. 2.4: Comparison of proportion of the materials for SCC and conventional
concrete (Okamura and Ouchi, 2003)
14
2.6.1 Aggregates
SCC is a new category of high-performance concrete that exhibits low resistance to
flow to ensure high flowability, and a moderate viscosity to maintain a homogeneous
deformation through restricted sections. The common practice to obtain self-
consolidation behavior in SCC is the limitation of the coarse aggregate content,
reduction of the maximum size of aggregates, and the use of superplasticizer (Khayat,
2015). According to the guideline of EFNARC (2002) for SCC coarse aggregate
volume was kept a maximum 50 percent of total aggregate and aggregate size for SCC
is generally limited to 12-20 mm. The particle size distribution and the shape of coarse
aggregate directly influence the flow and passing ability of SCC and its paste demand.
The maximum aggregate size for SCC is generally limited to 16-20 mm (EFNARC,
2005). However aggregate size 40 mm or above used in SCC but consistency of grading
is of vital importance (EFNARC, 2005).
The improvement of the SCC were possessed with the investigation of various types of
coarse aggregate such as Basalt, marble, dolomite, lime stone and Sandstone (Uysal,
2012), Crushed Granite (McBridge, 2003), Furnace slag, expanded clay and expanded
shale (Abdurrahman Lotfy, 2006), Crush gravel, uncrushed gravel and crush limestone
(Khaleel et al., 2011), Light expand clay aggregate (Maghsoudi et al, 2011), Natural
crushed stone (Zhao et al., 2012), Electric Arc Furnace Slag (Santamaría et al., 2020),
(crushed brick (Roy et al., 2019). Recycled aggregate also were used as coarse
aggregate by Safiuddin et al. (2011), Dey et al. (2016), Panda and Bal, (2013), Ardalan
et al., (2020) for the preparation of SCC. Incorporation of supplementary cementitious
materials (SCMs) like fly ash (Sua-iam and Makul.,2015) metakaolin (Kannan and
Ganesan, 2014), silica fume, limestone filler (Pradhan and Panda, 2017), marble
powder(Uygunoğlu et al., 2014), slag (Sharma and Khan, 2017), and granite powder
(Sadek et al., 2016) are used to make SCC more homogeneous, viscous, and dense.
Uysal (2012) studied the effectiveness of various types of coarse aggregates on fresh
and hardened properties of self-compacting concrete (SCC). Five different coarse
aggregates such as basalt, marble, dolomite, limestone and sandstone were used to
produce SCC containing fly ash. Slump flow, T50 time and V-funnel tests were
conducted on fresh concrete and abrasion, compressive strength, static and dynamic
elastic moduli and ultrasonic pulse velocity tests were performed on hardened concrete.
The compressive strength values of the hardened SCC were noted at 28 days, 56 days
and 90 days. The best performance was measured in SCC mixture prepared with basalt
aggregate while the lowest was noted in SCC mixture prepared with limestone
aggregate.

15
Grdic et al. (2008) studied the properties of SCC with natural aggregates in addition of
various types of additives like fly ash, silica fume, hydraulic lime and a mixture of fly
ash and hydraulic lime. Test results show that the addition of fly ash to the mixture
containing hydraulic lime is quite beneficial, bringing a substantial improvement of the
behavior of concrete. The silica fume imparts in the SCC a similar behavior to the one
of normal concrete and increase of water/cement ratio for the same concrete
workability.
Nischay et al. (2015) studied the fresh and hardened properties of self-compacting
concrete using recycled aggregate. Fine and coarse aggregates used in this study, both
were collected from concrete waste. Concrete mix proportioned with 0%, 25%, 50%,
75% and 100% replacement of fine and coarse aggregates separately. It was observed
that 50% replacements in all batches of the concrete mix have exhibited satisfactory
flow and compressive strength values.
Jishou Yu et. al. (2015) researched the effect of elongated and flaky particles content
on the properties of concrete. A total of elongated and flaky particles 6.8%, 16% and
25.2% were incorporated in this study. The results revealed that workability,
compressive strength, drying shrinkage and impermeability were weakened with the
increasing of elongated and flaky particle content. The workability and maximum
packing density can be achieved when the content of elongated and flaky particles fewer
than 16%.
Mohamad et al. (2016) conducted research on SCC incorporating high volume fly ash
with natural aggregate to investigate the fresh and mechanical properties. In that study
cement was replaced by fly ash and slump flow, J-ring and V-Funnel test were
performed for fresh state and compressive strength and modulus of elasticity were
determined. Results revealed that up to 40% replacement of fly ash exhibits the
optimum result for the workability and mechanical properties test.
Limestone-based natural aggregate and metakaolin, silica fume, zeolite, and viscosity
modifying admixture were used by Mahoutian and Shekarchi (2015). Two different
types of fine aggregates were used to observe the effect of gradation of sand on the
properties of SCC. The results show that sand grading significantly affects the fresh
properties of SCC and limestone can be effectively used as filler in SCC in high volume
content.
Safiuddin et al. (2011a) suggested that recycled concrete aggregate (RCA) can be used
in SCC. In that study natural coarse aggregate (NCA) was replaced by recycled
16
concrete aggregate to study the properties of SCC. Test results have shown that up to
50% substitution of NCA can be used without affecting the key fresh properties of
concrete.
Crushed granite stone as coarse aggregate and Palm oil fuel ash (POFA) were used as
supplementary materials of cement by Safiuddin et al. (2012a). The study reveals that
the presence of POFA improved the stability of the concrete mixture and provides a
lower visual stability index. Also, the segregation index and segregation factor obtained
from sieve and column tests, respectively, decreased with greater POFA content. The
overall findings suggest that the filling ability and passing ability of SCC decreased
whereas its segregation resistance increased with higher POFA content. In another
study, Palm oil fuel ash was used as a partial replacement of normal Portland cement
with crushed granite stone to study the correlation between different high-strength self-
consolidating concrete (SCHSC) by Safiuddin et al. (2012b). The compressive, splitting
tensile and flexural strengths, modulus of elasticity, ultrasonic pulse velocity, and
porosity of various self-consolidating concrete mixes were investigated. The
experimental findings revealed that strong correlations exist between different
hardened properties of high-strength self-consolidating concrete.
Salam et al. (2013) investigated the microstructures of self-compacting high strength
concrete (SCHSC) with crushed granite stone as coarse aggregate. The main focus of
that study was the effect of palm oil fuel ash (POFA) on the microstructure of self-
consolidating high-strength concrete. The scanning electron micrographs (SEMs) of the
concretes revealed that POFA contributes to producing a denser microstructure, which
increases the compressive strength and reduces the permeable porosity of SCHSC.
A study was conducted on the fresh and mechanical properties of SCC with Waste of
Oil Palm Shell (OPS) as the replacement of natural coarse aggregate by Prayuda et al.
(2018). The results of this study indicate that replacement of aggregate using OPS meets
fresh properties criteria and although the compressive strength of OPS concrete mixture
is lower than normal SCC.
A review of the literature was studied by Shahrukh and Shashikant (2018) on the
aggregate flakiness on the compressive strength and workability of concrete. Study
reveals that flaky aggregates beyond certain limit decreases strength and workability.
Hence the strength of concrete greatly depends on internal structure and flakiness of
aggregates. The compressive strength of concrete decreases with increases in
percentage of flaky aggregates because of increases in voids.
17
Andrews (2009) used expanded clay and crushed limestone to investigated the effect of
lightweight aggregate on SCC. This study focuses on the flow rates of lightweight
aggregates and structural lightweight self-consolidating concrete. The flows of SCC
with all lightweight aggregates were found between 5.5 and 9 seconds. The
compressive strengths and weights of SCC and normal concrete are also compared
along with the flow rates. The author has shown that compressive strength of concrete
increase with increasing the unit weight.
Crushed Granite was used to study the effect of the content and gradation of coarse
aggregate on the passing ability of SCC by McBride (2003) The experiment was
conducted with varying aggregate content and gradation to perform passing ability test,
slump flow test, horizontal flow test and stereology test and to develop a relationship
between passing ability, aggregate size and aggregate free distance. The result shows
that passing ability is a linear function of the ratio of maximum aggregate size and
aggregate free distance and also aggregate random spacing.
Roy et al. (2019) have study the self-compacting concrete (SCC) made with locally
available materials. In their studied a fixed mixed proportion was incorporated with
various water cement ratios. Brick aggregate was used as coarse aggregate to prepare
the SCC mixes. The experimental studies were conducted on the fresh and mechanical
properties of SCC. The results revealed that both compressive and tensile strengths
increased with the reduction of w/c ratio and values of both fresh and mechanical
properties have satisfied the ACI specifications. Therefore, researchers suggested the
locally available materials could be used to develop.
Another research with recycled brick aggregate was carried by Dey et al. (2016). Effect
of recycled brick aggregate (RB) replacement on the rheological and mechanical
properties of self-compacting concrete (SCC) were studied by the researchers. In that
study the virgin brick aggregates were replaced at 0%, 25%, 50%, 75%, and 100% with
recycled brick aggregate. The results indicated that the fresh and mechanical properties
of recycled aggregates concrete is almost similar and it is feasible to produce SCC with
recycled coarse aggregate.
Lotfy (2006) have studied the effect of various lightweight aggregates namely, furnace
slag, expanded clay and expanded shale on the properties of lightweight self-
consolidating concrete to evaluate the fresh and hardened properties. Lightweight Self-
Consolidating Concrete mixture were prepared with water/binder ratio of 0.30 to 0.40,
high range water reducing agent (HRWRA) of 0.3 to 1.2% (by total content of binder)
and total binder content of 410 to 550 kg/m3. Slump flow diameter, V-funnel flow time,

18
J-ring flow diameter, J-ring height difference, L-box ratio, filling capacity, bleeding,
fresh air content, initial and final set times, sieve segregation, fresh weight, 28-days air
and 28 days oven dry unit weights and 7 and 28 days compressive strengths were
evaluated in this study. The mixtures were evaluated by conducting the compressive,
flexural, splitting tensile strength, bond strength, drying shrinkage, sorptivity,
absorption, porosity, rapid chloride-ion permeability, hardened air void (%), spacing
factor, corrosion resistance, resistance to elevated temperature, salt scaling, freeze-thaw
resistance and sulphuric acid resistance tests. It was possible to produce lightweight
self-consolidating concrete mixtures that satisfy the EFNARC criteria for self-
consolidating concrete.
Effect of the shape and size of coarse aggregate on the properties of self-compacting
concrete were investigated by Pandurangan et al. (2012). Authors indicates that the
coarse aggregate shape and size affects the concrete strength through a complex
relationship of aggregate-to- cement paste bonding properties. SCC mixes were
prepared with 60 % and 40% replacement of cement with fly ash and 10 mm, 16 mm
and 20 mm coarse aggregates. The results of this study indicates that the flowability
and strength of SCC mixes with 10 mm to 16 mm was better than SCC with 20 mm.
This study also shows that the shape of the aggregate has no influence on the flowability
of SCC mixes.
Zhao et al. (2012) assess the effect of coarse aggregate gradation on the properties of
SCC with natural crushed stone. Total four A/B (coarse aggregate size 5–10 mm coarse
aggregate weight to size 10–20 mm coarse aggregate weight) ratio of 4/6, 5/5, 6/4, 7/3
were used for the preparation of SCC and the fresh and mechanical properties, porosity
and durability properties of SCC was studied. The results show that aggregate with A/B
ratio for 6/4 has a maximum bulk density of aggregate. The change in A/B ratio from
4/6 to 7/3, the initial slump flow, blocking and segregation ratio are decreasing, while
the wet density of fresh SCC is increasing. SCC with A/B ratio for 6/4 had a maximum
mechanical property, least porosity, carbonation depth, chloride ion diffusion
coefficient.
In a study (Felekoglu et al., 2007), five mixtures with different water/cement ratio and
superplasticizer dosage were investigated. Slump flow, V-funnel, L-box were carried
out to determine optimum parameters for the self-compactibility of mixtures.
Compressive strength, modulus of elasticity and splitting tensile strength hardened
concrete were also studied. Results of this study shows that the optimum water/cement
ratio for SCC is in the range of 0.84–1.07 by volume. The ratios above and below this
range may cause blocking or segregation of the mixture. Also it was obtained that

19
higher splitting tensile strength and lower modulus of elasticities from SCC mixtures
when compared with normal vibrated concrete.
Electric Arc Furnace Slag (EAFS) was used by Santamaría et al., (2020) as coarse
aggregate in the production of high-volume batches of SCC. Mixtures containing EAFS
aggregate in proportions of nearly 50% by volume are prepared for use as pumpable
and self-compacting mixes with consistency classes of S4 and SF2, respectively. The
results yielded compressive strengths of approximately 60 MPa and elastic moduli of
38 GPa after one year.
All normal concreting sands are suitable for SCC. Both crushed or rounded grains of
sand can be used. Siliceous or calcareous sands can be used. The traditional fine
aggregates such as river or mining sand are also used in SCC. The amount of fines less
than 0.125 mm is to be considered as powder and is very important for the rheology of
the SCC (EFNARC, 2002).
2.6.2 Cement
All types of cement conforming are suitable. In the study of SCC made with locally
available materials by Roy et al. (2019) have used CEM-II/B-M type cements and
Kandemir and Türkel (2010) have used OPC (CEM-I) with mineral admixture for the
preparation of SCC with different aggregates. The selection of the type of cement will
depend on the overall requirements for the concrete (EFNARC, 2005) such as strength,
durability, etc.
C3A content higher than 10% may cause problems of poor workability
retention.
The typical content of cement is 350-450 kg/m3. More than 500 kg/m3
cement can be dangerous and increase the shrinkage. Less than 350 kg/m3
may only be suitable with the inclusion of other fine fillers, such as fly ash,
pozzolan, etc.
Total powder content 160 to 240 liters (400-600 kg) per cubic meter.
SCC generally requires a low water/binder (W/B) ratio (0.30–0.40), high cement
content, and low amount of coarse aggregate (Ozawa et al., 1989). Besides, SCC needs
several ingredients such as supplementary cementing material (SCM), filler materials
mineral filler, pigments, fly ash, silica fume, ground granulated blast furnace slag,
hydraulic lime etc. in addition to the basic constituents of ordinary concrete. SCC can
be prepared with different types additives: fly ash, silica fume, hydraulic lime and a
mixture of fly ash and hydraulic lime Grdic et al, (2008).
20
2.6.3 Admixtures
It must need HRWR to achieve the self-consolidation capacity of concrete (Okamura
and Ozawa, 1995). Two types of chemical admixture such as HWRA and VMA were
engaged by Roy et al. (2019) in their research. Researchers such as Uysal, (2012), Grdic
et al, (2008) have investigated the SCC with various types of HRWR, VMA for various
fresh and mechanical properties. SCC consists of supplementary cementitious
materials, mineral admixtures such as limestone powder, chemical admixtures such as
superplasticizer (SP) and viscosity modifying agents (VMA), and water.
2.7 MIX DESIGN
Mix design is an essential first step for both research programs and practical application
of concrete and such a step must start with the definitions of the applications of SCC.
To ensure a good balance between the fresh properties of SCC such as deformability
and segregation resistance, the proportion of the constituent materials must be carefully
designed. Properties of SCC like rheology, strength, shrinkage and durability are also
affected by the mix design method, the characteristics of raw materials, incorporation
of chemical and mineral admixtures, aggregate packing density, water to cement ratio
(W/C) (Esmaeilkhanian et al., 2014; Han et al., 2014; Siddique et al., 2012 and Wang
et al., 2014)
There are different mix proportioning methods used to develop SCC mixes, they do
share some similarities. In reviewing of the proposed mix design methods, it is difficult
to compare one method to another, because each method has been developed according
to its own particular conditions and environment, and has its own special features and
some inherent limitations. These methods can be categorized into different classes (Shi
et al., 2015) as empirical mix design method, compressive strength method, aggregate
packing method, a method based on the statistical factorial model, and rheology of paste
model.
There are many techniques available in the literature for proportioning Portland cement
concrete. ACI absolute volume method of mix proportioning (ACI Committee, 2002)
is one of the maximum used normal processes by the concrete industry. Due to the
special desires of SCC in its fresh state much challenge to the designer.
Indicative typical ranges of proportions and quantities in order to obtain self-
compatibility are given below (EFNARC, 2002). Further modifications will be
necessary to meet strength and other performance requirements.
21
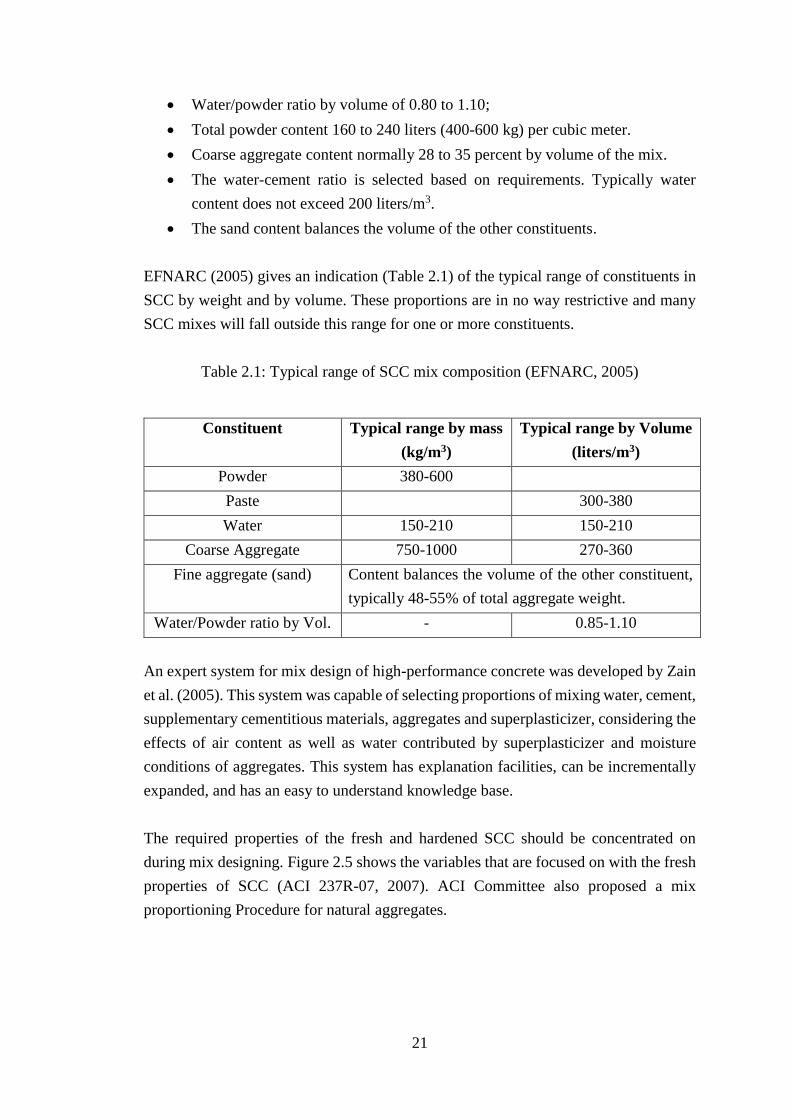
Water/powder ratio by volume of 0.80 to 1.10;
Total powder content 160 to 240 liters (400-600 kg) per cubic meter.
Coarse aggregate content normally 28 to 35 percent by volume of the mix.
The water-cement ratio is selected based on requirements. Typically water
content does not exceed 200 liters/m3.
The sand content balances the volume of the other constituents.
EFNARC (2005) gives an indication (Table 2.1) of the typical range of constituents in
SCC by weight and by volume. These proportions are in no way restrictive and many
SCC mixes will fall outside this range for one or more constituents.
Table 2.1: Typical range of SCC mix composition (EFNARC, 2005)
Constituent Typical range by mass
(kg/m3)
Typical range by Volume
(liters/m3)
Powder 380-600
Paste 300-380
Water 150-210 150-210
Coarse Aggregate 750-1000 270-360
Fine aggregate (sand) Content balances the volume of the other constituent,
typically 48-55% of total aggregate weight.
Water/Powder ratio by Vol. - 0.85-1.10
An expert system for mix design of high-performance concrete was developed by Zain
et al. (2005). This system was capable of selecting proportions of mixing water, cement,
supplementary cementitious materials, aggregates and superplasticizer, considering the
effects of air content as well as water contributed by superplasticizer and moisture
conditions of aggregates. This system has explanation facilities, can be incrementally
expanded, and has an easy to understand knowledge base.
The required properties of the fresh and hardened SCC should be concentrated on
during mix designing. Figure 2.5 shows the variables that are focused on with the fresh
properties of SCC (ACI 237R-07, 2007). ACI Committee also proposed a mix
proportioning Procedure for natural aggregates.

22
The following is a summary of steps for determining the performance requirements and
proportioning of SCC (EFNARC, 2005).
Step 1: Determine slump flow performance requirements
Step 2: Select coarse aggregate and proportion (ACI 211.1 and 301);
Step 3: Estimate the required cementitious content and water;
Step 4: Calculate paste and mortar volume;
Step 5: Select admixture;
Step 6: Batch trial mixture;
Step 7: Test. When assessing the workability attributes of SCC (stability, filling
ability, and passing ability), the slump flow test, as well as a test to evaluate
stability and passing ability (such as column segregation, J-ring, or L-box),
should be run; and
Step 8: Adjust mixture proportions based on the test results and then rebatch
with further testing until the required properties are achieved.
Fig. 2.5: Variables Involved in establishing the required fresh SCC properties (ACI
237R-07, 2007)

23
The proposed proportions for the ACI SCC mix design proportioning are presented in
Table 2.2.
Table 2.2: SCC proportioning trial mixture parameters (ACI 237R-07, 2007)
Absolute volume of coarse aggregate 28 to 32% (>12.5 mm nominal size)
50% (<12.5 mm nominal size)
Paste fraction (calculated on volume) 34 to 40% (Total mixture volume)
Mortar fraction (calculated on volume) 68-72% (Total mixture volume)
w/cm 0.32 to 0.45
Cement (powder content) 386 to 475 kg/m3
Many references provide various examples of the mix design and proportioning of mix
design of SCC (Li et al., 2012; Maghsoudi et al., 2011).
2.8 FRESH PROPERTIES
Fresh properties of SCC are described in terms of filling ability, passing ability and
segregation resistance, and is characterized by specific testing methods. SCC is highly
flowable, no segregating concrete that can spread into place, fill formwork, and
encapsulate reinforcement without any mechanical consolidation. There is no one test
that can measure all three characteristics at once. Many different test methods have
been developed in attempts to characterize the properties of SCC.
The test methods which characterizes all the relevant aspects of fresh properties
(EFNARC, 2002) are described in detail in Table 2.3.
Table 2.3: List of test methods for workability properties of SCC (EFNARC, 2002)
Sl. No. Test Method Property Measured value
1 Slump-flow by Abrams cone
Filling ability
Total spread
2 T50 cm slump flow Flow Time
3 V-funnel Flow Time
4 Orimet Flow Time
5 J-ring
Passing ability
Step height, Total flow
6 L-box Passing ratio
7 U-box Height difference
8 Fill-box Visual filling
9 V-funnel at T5minutes Segregation
resistance
Flow Time
10 GTM screen stability test Segregation ratio

24
Also Table 2.4. shows the typical acceptance criteria of self-compacting concrete for a
maximum aggregate size up to 20 mm. These requirements are to be fulfilled at the
time of placing (EFNARC, 2002).
Table 2.4: Acceptance criteria for self-compacting concrete (EFNARC, 2002)
Sl.
No.
Method Unit Typical rang of values
Minimum Maximum
1 Slump-flow by Abrams
cone
mm 550 850
2 T50 cm slump flow sec 2 5
3 J-ring mm 0 10
4 V-funnel sec 6 12
5 V-funnel at T5minutes sec 0 +3
6 L-box (h2/h1) 0.8 1.0
7 U-box (h2-h1)
mm
0 30
8 Fill-box % 90 100
9 GTM screen stability
test
% 0 15
10 Orimet sec 0 5
2.8.1 Filling Ability
The filling ability describes the ability of SCC to flow into and fill completely all spaces
within the formwork, under its own weight. The filling ability of SCC is measured with
slump flow, T50 flow time and V-funnel flow time.
Santamaría et al. (2020) reported the slump flow of SCC made with Electric Arc
Furnace Slag as coarse aggregate was 680 mm-700 mm. Roy et al. (2019) reported the
slump flow of SCC made with brick aggregate was 427 mm-712 mm, T50 flow time
was varied from 2 to 7 seconds and V-funnel flow was 4-15 sec. In another study, Dey
et al. (2016) shows the value of slump flow of SCC was 735 mm-755 mm, also found
the T50 flow time was 1-2.1sec and V-funnel flow time was 6-11.5 sec with replacement
of natural brick aggregate with recycled aggregate. Khayat (2015) reported that an SCC
with a slump flow of 650 mm for the 20 mm size natural CA with 555 kg/m3 of
cementitious materials can be more suitable for casting highly congested structures.
Nischay et al. (2015) also reported that when natural aggregate replaced by the recycled
aggregate, slump flows were 690 mm and 580 mm for 25% and 100% replacement
25
respectively. Safiuddin et al. (2014) revealed that the slump flow high strength SCC
made with crushed granite varied from 605 mm to 720 mm, T50 slump flow time varied
in the range of 2-4.8 sec and V-funnel ranges from 6-13.5 sec. To ensure adequate self-
consolidation capacity, a minimum slump flow of 600 mm is generally recommended
for SCC (Khayat, 2000). Madandoust and Mousavi (2012) measured the T50 flow times
for self-compacting concrete containing a maximum nominal size 12.5 mm limestone
gravel as coarse aggregate within the range of 1.3-7.97 sec. Mohamad et al. (2015)
reported the T50 flow time for SCC with natural aggregate in the range of 1-6 sec.
Safiuddin et al. (2011a) reported that the T50 slump flow time varied in the range of 2.6-
4.5 sec for SCC with recycled aggregate. Felekoglu et al. (2007) reported the slump
flow values with 690 mm and 695 mm but their behavior in fresh state was totally
different having V-funnel times of 3 and 46 sec, respectively with the 15 mm maximum
size coarse aggregate (crushed limestone).
2.8.2 Passing Ability
The passing ability refers to the ease with which concrete can pass among various
obstacles and narrow spacing in the formwork without blockage. J-ring, L-box and
U-box tests are used to measure the filling ability of fresh SCC. Felekoglu et al. (2007)
reported filling abilities with L-box ratio of 0.95 and 0.50. Safiuddin et al. (2011b)
reported the J-ring flow values were in the range of 590–700 mm and the differences
between slump flow and J-ring flow were below 50 mm. Dey et al. (2016) found the
L-box ratio was 0.9-1.00 with recycled brick aggregate. Roy et al. (2019) reported the
values of L-box ratio for SCC with brick aggregate was 0.67-0.98.
2.8.3 Segregation Resistance
Segregation resistance of concrete describes the ability of a material to maintain the
homogeneous distribution of its various constituents during its flow and setting.
V-funnel at T5minutes, GTM screen stability test and column segregation tests are
performed to justify the segregation resistance of SCC. Santamaría et al. (2020) use the
column segregation test to evaluate segregation in the self-compacting concrete
mixtures and satisfactory results. Also the researchers Roy et al. (2019), Dey et al.
(2016), Khayat (2015), Nischay et al. (2015) and Mohamad et al. (2015) reported that
no visible blocking or segregation in their study.
2.8.4 Correlations between Fresh Properties of SCC
The correlation between the fresh properties of SCC made with various materials were
studied by the researchers (Safiuddin et al. 2011b, Madandoust and Mousavi, 2012).
Recycled coarse aggregate (RCA) was used as partial and full replacements of natural

26
coarse aggregate (NCA) by Safiuddin et al. (2011a) to produce self-consolidating
concrete. SCC mixes were produced substituting 0%, 30%, 50%, 70%, and 100% NCA
with RCA by weigh. Authors have found a strong correlation between the fresh
properties. This study reveals that J-ring flow and slump flow of the SCC mixes are
strongly correlated with a linear relationship. T50 slump flow time and V- funnel flow
time varied with a similar way. Also the segregation index and slump flow of the SCC
mixes were strongly correlated with a linear relationship. The correlation between these
properties are presented in the Table 2.5.
Table 2.5: Correlation between Fresh Properties of SCC (Safiuddin et al., 2011a)
Property Equation and Correlation
J-ring flow (JF) and slump flow (SF) JF = 1.1307 (SF) – 120.26, r = 0.9909
T50 slump flow time (T50) and V- funnel
flow time (Tv)
Tv = 6.6729 (T50) – 12.021, r = 0.9765
Segregation index (SI) and slump flow
(SF)
SI = 0.0288 (SF) – 7.7376, r = 0.9682
Madandoust and Mousavi (2012) found a relationship between T50 and V-funnel time
in their study of fresh and mechanical properties of SCC with metakaolin. The result
of the correlation between V-funnel time (VF) and T50 time (T50)is shown in Equation
(2.1).
VF = 2.691×(T50)1.1575 (2.1)
R2 = 0.925
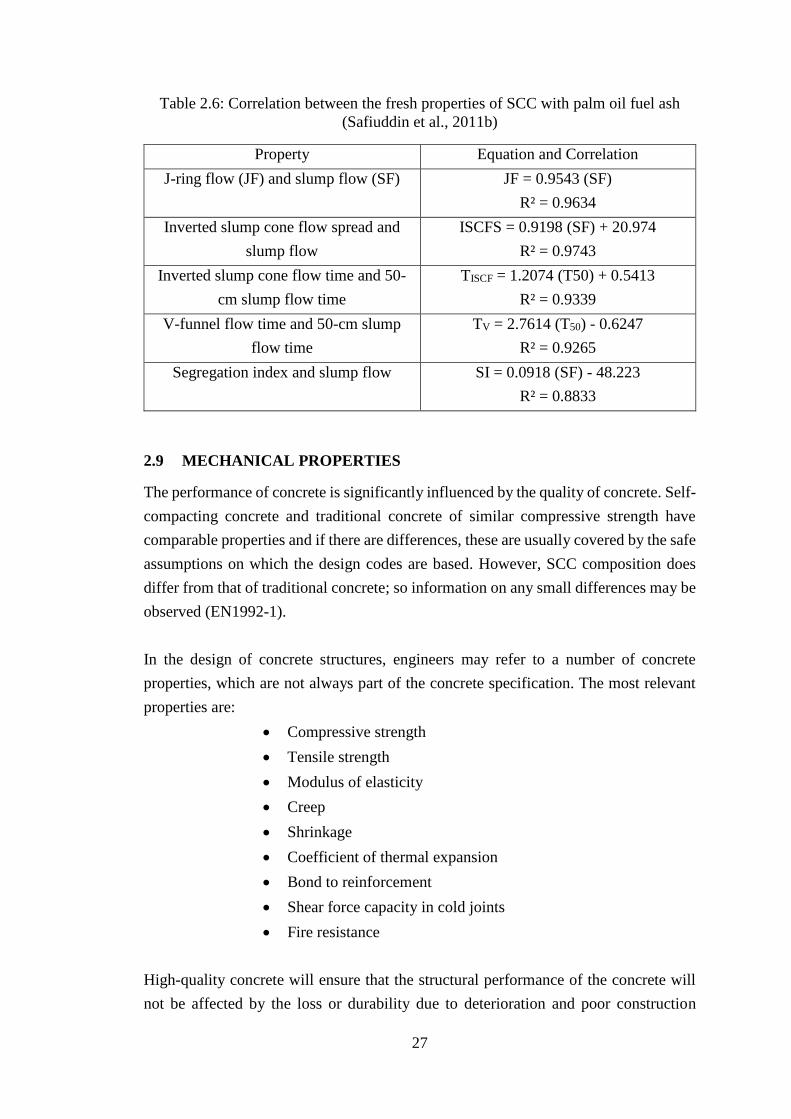
In another study, Safiuddin et al. (2011b) developed the correlation between the fresh
properties of SCC with Palm oil fuel ash. Correlation between J-ring flow and slump
flow, inverted slump cone flow spread and slump flow, inverted slump cone flow time
and 50-cm slump flow time, V-funnel flow time and 50-cm slump flow time,
segregation index and slump flow and segregation factor and segregation index were
described in their study. These correlations are listed in Table 2.6.
27
Table 2.6: Correlation between the fresh properties of SCC with palm oil fuel ash
(Safiuddin et al., 2011b)
Property Equation and Correlation
J-ring flow (JF) and slump flow (SF) JF = 0.9543 (SF)
R² = 0.9634
Inverted slump cone flow spread and
slump flow
ISCFS = 0.9198 (SF) + 20.974
R² = 0.9743
Inverted slump cone flow time and 50-
cm slump flow time
TISCF = 1.2074 (T50) + 0.5413
R² = 0.9339
V-funnel flow time and 50-cm slump
flow time
TV = 2.7614 (T50) - 0.6247
R² = 0.9265
Segregation index and slump flow SI = 0.0918 (SF) - 48.223
R² = 0.8833
2.9 MECHANICAL PROPERTIES
The performance of concrete is significantly influenced by the quality of concrete. Self-
compacting concrete and traditional concrete of similar compressive strength have
comparable properties and if there are differences, these are usually covered by the safe
assumptions on which the design codes are based. However, SCC composition does
differ from that of traditional concrete; so information on any small differences may be
observed (EN1992-1).
In the design of concrete structures, engineers may refer to a number of concrete
properties, which are not always part of the concrete specification. The most relevant
properties are:
Compressive strength
Tensile strength
Modulus of elasticity
Creep
Shrinkage
Coefficient of thermal expansion
Bond to reinforcement
Shear force capacity in cold joints
Fire resistance
High-quality concrete will ensure that the structural performance of the concrete will
not be affected by the loss or durability due to deterioration and poor construction
28
practices. SCC has an abundant resource for future research on durability and structural
performance. Hardened concrete properties of SCC may be engineered through the
mixture proportion to be similar to, or better than, those of a conventional concrete
mixture. For the same raw material sources and the same specified compressive
strength, the engineering properties of SCC should be similar to those of conventional
concrete. To verify this, the same test methods and procedures employed for
conventional concrete should be used for SCC.
2.9.1 Compressive Strength
Compressive strength is the most valuable property of concrete. Although in many
practical cases other characteristics, such as durability, impermeability and volume
stability, may in fact be more important (Neville, 1997). According to Uysal (2012),
the highest compressive strength values were measured in SCC mixture prepared with
the basalt aggregate while the lowest compressive strength values were noted in SCC
mixture prepared with limestone aggregate at 28 days. The lowest value of static elastic
modulus has been obtained for SCC mixture containing limestone aggregate.
In a study of the effect of recycled brick aggregate on self-compacting concrete (Dey
et al., 2016), authors shows the 28 days compressive strength, tensile strength, and
failure pattern of hardened concrete. The compressive strength of 35 MPa was obtained
when 75% of virgin brick aggregate was replaced by recycled brick aggregate. Tensile
strength and modulus of elasticity result indicated almost similar properties. The results
showed that it is feasible to produce SCC with recycled coarse aggregate.
Another study (Roy et al., 2019) observed that both compressive and tensile strengths
(28 days) increased with the decrease of w/c ratio, and the compressive strength was
about 20-40 MPa and was around ten times of the tensile strength. This study was
conducted with brick aggregate with a fixed mixed proportion varying the w/c ratios
only.
2.9.2 Splitting Tensile Strength
Splitting tensile strength (fsp) is generally expressed as a function of the square root of
compressive strength (fʹc) and it is greater than direct tensile strength and lower than
flexural Strength. Splitting tensile strength is used in the design of structural concrete
members to evaluate the shear resistance provided by concrete and to determine the
development length of reinforcement.
Roy et al. (2019) reported the compressive strength of SCC with brick aggregate around
ten times of the splitting tensile strength. The correlation between compressive strength
29
and splitting tensile strength of SCC made was illustrated by Madandoust and Mousavi
(2012). The authors established a strong correlation between these hardened properties.
That study represents that splitting tensile strength development followed the same
pattern as compressive strength in SCC. The correlation of these properties are shown
in Equation (2.2).
fsp = 1.7593×(fʹc/10)0.392 (2.2)
where, fsp = Splitting Tensile Strength
fʹc = Compressive Strength
2.9.3 Modulus of Elasticity
Generally, the modulus of elasticity is expressed as a function of the square root of
compressive strength. Modulus of elasticity of concrete is related to compressive
strength, aggregate type and content, and unit weight of the concrete. Some
observations have shown that for equal compressive strength, the elastic modulus of
SCC can be as much as 10 to 15% lower than that of conventional concrete of similar
compressive strength due to the required adjustments of mixture proportions to make
SCC (Bennenk, 2002). Other studies have shown the opposite that at an equal
compressive strength, the elastic modulus of SCC coincides well with that of
conventional concrete (Persson, 1999).
The compressive and flexural strengths and modulus of elasticity were measured by
Khaleel et al. (2011). The research reveals that a lower maximum size of coarse
aggregate leads to higher strengths compared to a higher maximum size of coarse
aggregate in SCC mixes. It was noticed that the compressive and flexural strength and
modulus of elasticity of the mixes made with the 10 mm maximum size of coarse
aggregate is higher than the values of the mixes made with the 20 mm maximum size
of coarse aggregate. This is due to the smaller maximum size of coarse aggregate that
has the larger surface area that results in a higher bonding strength in the transition zone
around aggregate particles when concrete is under loading.
Elastic modulus of common aggregate is greater than that of the absolute volume of the
paste of SCC is greater than that of ordinary concrete, one might expect that the elastic
modulus of SCC would be smaller than that of ordinary concrete with a comparable
compressive strength (Bonen and Shah, 2005).

30
2.10 SUMMARY
Definition of SCC, advantages and disadvantages of SCC, historical development of its
wide range application all over the world, classification based on requirements and
properties, mechanism of achieving self-compactibility, materials, mix proportion and
the attempts to improve the quality of SCC are illustrated in this chapter. In addition,
this chapter describes fresh as well as mechanical properties of SCC with various types
of aggregate from the literatures. Based on the discussion on the SCC from the
literature, it was found that SCC can be a best alternate to the engineers and construction
sectors in context of Bangladesh. It can be produce the SCC with lower labor cost and
without the necessities of skilled labors and equipment. To avoid the complexities of
vibration and placement of concrete in the congested areas of structures, SCC can be
used to produce quality concrete. In past, investigation of the SCC was conducted using
various types of CA but a very few attempts were taken to study the SCC using crushed
brick as coarse aggregate. In this study, brick aggregate was used as the substitute of
natural aggregate to introduce SCC with brick aggregate as a new construction material
and grab the benefit of this new building material. It is expected that, SCC with BA,
reduce non-uniformity of concrete and play an important role in the construction
sectors. That’s why this study intended to investigate the fresh and mechanical
properties of self-compacting concrete with brick aggregate.

31
CHAPTER 3 CHAPTER III …… …..
. MATERIALS AND METHODOLOGY
3.1 INTRODUCTION
This chapter includes different types of experimental data required to determine the
properties of the ingredients of concrete, processes of manufacturing of concrete and
tests to determine the properties of fresh and hardened properties of SCC with brick
aggregate. To launch this experimental work, concrete was prepared with locally
available 19 mm and 12.5 mm downgraded coarse aggregate made from locally
available crushed bricks, available coarse sand, Portland composite cement and high
range water reducer (HRWR). Under the experimental investigation, the physical
properties of materials were evaluated. This research program includes the following
methodology step by steps:
Selection and collection of the materials
Preparation of the materials
Testing the physical and chemical properties of materials
Mix design and proportioning the materials for trial mixes
Preparation of trial mixes
Testing the fresh properties of SCC
Slump flow
T50 slump flow time
V-funnel flow time
V-funnel flow at T5minutes
J-ring flow
J-ring blocking index
Height difference at J-Ring
L-box blocking ratio.
Preparation of the cylindrical specimen (Ø 100 mm × 200 mm)
Testing the mechanical properties of hardened SCC
Compressive Strength (fʹc)
Splitting Tensile Strength (fsp)
Modulus of Elasticity (Ec).
Analysis of test results and conclusion
In this research program all the testing methods were followed according to standard
specification and guidelines.

32
3.2 MATERIALS
In this research, locally available first class well burnt brick were used to prepare the
coarse aggregate. Locally available coarse sand as fine aggregate, Portland cement as
binding material, potable water and high range water reducer (HRWR) were used as
concrete making materials. All of these materials were collected from locally available
sources and their properties were investigated in the laboratory to set the parametric
criteria for SCC. The materials used in this study are listed in Table 3.1.
Table 3.1: Ingredients of SCC with BA
Coarse Aggregate 19 mm downgraded
12.5 mm downgraded
Fine Aggregate Locally available coarse sand (Sylhet sand)
Binder Portland Composite Cement
(BS EN 197-1:2011/CEM II/B-M)
Water Potable water
Admixture Superplasticizer (SP), ASTM C494 Type: F and G
3.3 TESTING OF THE MATERIALS
3.3.1 Tests for Coarse Aggregate
Although aggregates are most commonly known to be inert filler in concrete, the
different properties of aggregate have a large impact on the strength, durability,
workability, and economy of concrete. The aggregate most of which retains on the 4.75
mm sieve and contains only that much of fine material as is permitted by the
specifications are termed coarse aggregate (Gambhir, 2006). In general, the aggregates
having a size larger than 4.75 mm is coarse aggregate. The graded coarse aggregate is
described by its nominal maximum size or downgraded size, i,e., 37.5 mm, 25 mm, 19
mm and 12.5 mm. For example, nominal maximum size aggregate 12.5 mm means an
aggregate most of which passes through 12.5 mm sieve. In this study locally available
brick chips of sizes 19 mm and 12.5 mm downgraded have been used as coarse
aggregate. The coarse aggregates used in this study are prepared by crushing first
class burnt clay bricks. The photograph of the coarse aggregate (CA) is
illustrated in Fig. 3.1.

33
Fig. 3.1: Crushed bricks as coarse aggregate
Burnt clay bricks were collected from locally available sources and were crushed
manually and then sieved for grading. If all the particles of an aggregate are of uniform
size, the compacted mass will contain more voids, whereas an aggregate comprising
particles of various sizes will give a mass containing lesser voids. The particle size
distribution of a mass of aggregate should be such that the smaller particles fill the voids
between the larger particles. The proper grading of an aggregate produces dense
concrete. It is, therefore, essential that the coarse and fine aggregate be well-graded to
produce quality concrete. The sieve analysis is conducted to determine the particle size
distribution and fineness modulus of coarse aggregate called gradation. The fineness
modulus (FM) is a numerical index of fineness, giving some idea of the mean size of
the particle present in the entire body of the aggregate. The standard test method ASTM
C136 (2019) was followed for grading of coarse aggregate. The sieve analysis was
performed through standard sieve sizes of 37.5, 19.0, 9.5, 4.75, 2.36, 1.18, 0.60, 0.30,
and 0.15 mm by a mechanical sieve shaker for 15 minutes. The calculation related to
fineness modulus of fine aggregate has been included in the Appendix B and the value
of FM of coarse aggregate are listed in Table 4. 1 and the gradation curve of coarse
aggregates are shown in Fig. 4.1 of Chapter IV.
The absorption capacity of coarse aggregate was determined according to standard test
method ASTM C127 (2015). The value of the absorption capacity of the coarse
aggregates has been listed in the Table 4.1 in Chapter IV. The calculation related to this
test has been included in the Appendix. The calculation of absorption capacity is shown
in Equation (3.1).
12.5 mm downgraded CA 19 mm downgraded CA

34
Percentage of absorption = (B-A)/A*100 (3.1)
Where,
A = weight of oven-dry test sample in air
B = weight of saturated surface dry test sample in air
The unit weight of coarse aggregates is necessary to use for many methods of
selecting proportions for the concrete mixture. They may also be used for
determining the mass/volume relationship of aggregates. This test method
conforms to the standard specification of ASTM C 29 (2017). The unit weight
of various sizes of coarse aggregates has been given in the Table 4.1
in Chapter IV. The calculation has been given in the Appendix. The calculation of
unit weight shown in Equation (3.2).
M = (G-T)/V (3.2)
where
M = Dry rodded bulk density
T = Mass of the measure
G = Mass of the aggregate plus measure
V = Volume of the measure
Aggregates generally contain pores, both permeable and impermeable, for which
specific gravity has to be carefully defined. With this specific gravity of each
constituent known, its weight can be converted into solid volume and this is also
required in calculating the compacting factor in connection with the workability
measurements. This test method conforms to the standard specification of ASTM
C 127 (2015). The value of the specific gravity of the coarse aggregate has been
listed in the Table 4.1 in Chapter IV. The calculation related to this test has been
included in the Appendix. The calculation of the bulk specific gravity shown in
Equation (3.3).
Bulk specific gravity (SSD basis) = B/(B-C) (3.3)
Where,
B = weight of saturated surface dry test sample in air
C = weight of saturated test sample in water.
35
The flakiness index of an aggregate sample is found by separating the flaky
particles and expressing their mass as a percent of the mass of the sample. This
test is applicable to the materials passing a 63 mm sieve and retained on a 6.3
mm sieve. Aggregates are classified as flaky when they have a thickness of less
than 60% of their mean size.
Elongation index of an aggregate sample is found by separating the elongated
particles and expressing their mass as a percent of the mass of the sample. This
test is applicable to the materials passing a 50 mm sieve and retained on a 6.3
mm sieve. Aggregates are classified as elongated when they have a length
(greatest dimension) of more than 1.8 of their mean sieve size. These test
methods conformed to the standard (ASTM D 4791, 2010).
All the properties (FM, unit weight, specific gravity, water absorption,
elongation and flakiness index) of 19 mm and 12.5 mm downgraded coarse
aggregates used in the laboratory experiment are shown in Table 4.1 (Chapter
IV).
3.3.2 Tests for Fine Aggregate
Locally available fine aggregate (coarse sand) was used in this study. The photograph
of the fine aggregate is illustrated in Fig. 3.2. The standard test method ASTM C136
(2019) was followed for sieve analysis of fine aggregate. Standard sieve sizes of #4, #8,
#16, #30, #50, and #100 were used to analyze the fineness modulus (FM) of sand.
Absorption capacity and specific gravity of fine aggregate were determined according
to the standard test method as prescribed by ASTM C128 (2015). Unit weight values
of fine aggregates are necessary for selecting proportions for the concrete mixture. They
may also be used for determining the mass/ volume relationship of aggregate. This test
method conforms to the standard specification of ASTM C 29 (2017). The calculation
related to these properties (FM, unit weight, specific gravity and water absorption) has
been included in the Appendix.
All the properties (FM, unit weight, specific gravity and water absorption) of fine
aggregate used in the laboratory experiment are shown in Table 4.1 and the gradation
curve of fine aggregate is shown in Fig. 4.2 in Chapter IV.

36
Fig. 3.2: Fine aggregate (Coarse Sand)
3.3.3 Test for Binding Materials
In this study Portland Composite Cement (BS EN 197-1:2011/CEM II/B-M) was used
as binding materials. Usually, the grain size of the cement particles is within 7 ~ 200
μm (0.007 ~ 0.2 mm) (Building Materials in Civil Engineering, 2011). Cement paste to
a standard condition of wetness, called 'normal consistency' to regulates the water
content. The normal consistency of a cement paste is defined as that consistency which
will permit a Vicat's plunger having 10 mm diameter and 50 mm length to penetrate to
a depth of 10 mm from the top of the mold. Initial setting time is regarded as the time
elapsed between the moments that the water is added to the cement, to the time that the
paste starts losing its plasticity. The final setting time is the time elapsed between the
moment that the water is added to the cement and the time when the paste has
completely lost his plasticity and has attained sufficient firmness to resist certain
definite pressure. The setting time of cement indicates how long the cement will remain
workable when used in a concrete mix. Normal consistency and setting times were
determined by using the Vicat apparatus and test methods conform to the standard
requirements of ASTM specifications C187 (ASTM C187, 2016) and C191 (ASTM
C191, 2019) respectively. The strength of cement is usually determined from the test
on mortar made with cement. The compressive of the cement mortar was measured and
test methods conform to the ASTM standard requirements of specification C109
(ASTM C109, 2020). The properties of cement used for this experiment ensured
satisfactory properties according to ASTM C150 (2020) as a binding material for
concrete. The composition of cement and the test results of the cement used in this study
have been listed in the Table 4.2 and Table 4.3 of Chapter IV respectively.

37
3.3.4 Water
Water is an important ingredient of concrete as it actively participates in the chemical
reaction with cement. Since it helps to form the strength-giving cement gel (C-S-H),
the quantity and quality of water are required to be looked into very carefully. Water
used in mixing concrete shall be clean and free from injurious amounts of oils, alkalis,
salts, organic materials or other substances that may be deleterious to concrete. In this
study potable water from the tap was used in the mixture of concrete.
3.3.5 Superplasticizer
In SCC two types of chemical admixtures are used to increase the workability of fresh
concrete with lower water-cement ratio. These are known as superplasticisers or as high
range water-reducer (HRWR) and viscosity modifying agents (VMA) or as anti-
washout admixtures. Superplasticizer (SP) controls the flow properties of SCC, allows
the reduction of the water-cement ratio maintaining workability to reach the desired
strength and durability. SP enhances the flowability of SCC by its liquefying and
dispersing actions (Hu and Larrard, 1996; Yen et al., 1999). Superplasticiser
deflocculates the cement particles and frees the trapped water by its dispersing action
and hence enhances the flowability of SCC as illustrated in Fig. 3.3. However, a high
amount of SP could cause segregation and bleeding.
Fig. 3.3: Method of deflocculation and water liberation with use of Superplasticiser
(Deeb and Karihaloo, 2013)
In this research locally available superplasticizer Con-Lub SP was used in the
preparation of SCC with brick aggregate. It is a ready-to-use liquid superplasticizer that
extremely improves the high range water reducing performance and complies with the
requirements of the following standards: ASTM C 494 (2019), Type F & G. Con-Lub
SP Polycarboxylate Superplasticizer for high water reduction has been primarily
developed for applications in the ready-mixed and precast concrete industries where the

38
highest durability and performance are required. Technical Specification of this
superplasticizer has complied with the requirements of the following standards (ASTM
C494, 2019). Some technical information of Con-Lub SP is included in Table 4.4 of
Chapter IV. The physical appearance of Con-Lub SP is yellowish. The photograph of
SP used in this study is illustrated in Fig. 3.4.
The optimum dosages of Con-Lub SP to meet specific requirements should
always be determined by trials using the materials and conditions that will be
experienced in use.
Fig. 3.4: Superplasticizer Con-Lub SP
3.4 MIX DESIGN OF SCC
To ensure a good balance between the fresh properties of SCC such as deformability
and segregation resistance, the proportion of the constituent materials must be carefully
designed. Mix design is an essential first step for both research programs and the
practical application of concrete. There are different mix proportioning methods used
to develop SCC mixes. Each method has been developed according to its particular
conditions and environment and has its special features and some inherent limitations.
These methods can be categorized into different classes (Shi et al., 2015) such as the
empirical mix design method, compressive strength method, aggregate packing
method, the method based on the statistical factorial model, trial and error method and

39
rheology of paste model. In this study, the trial and error method of mix proportion was
adopted for proportioning SCC.
3.4.1 Trial and Error Method of Mix Proportioning
Based on the relationship between the w/c ratio and compressive strength, the design
of the mix can be made by selecting the water-cement ratio to suit the requirement of
workability, strength and durability. With this water-cement ratio, trial batches are
prepared with different aggregates and cement ratios. From this, it is possible to
determine the optimum proportion and amount of the aggregate that will produce a
workable mix with a minimum of the paste content for determining the fine aggregate.
With judgment and experience, one may arrive at the proportions of fine and coarse
aggregate.
Having a fixed water-cement ratio, aggregate cement ratio and the amount of fine
aggregate in the total aggregate content, the freshly mixed concrete needs to test the
fresh properties to satisfy the criteria of standard SCC mix. Then cylindrical specimens
of concrete can be prepared from each successful mix in the laboratory following the
standard procedure. After the required period of curing the specimens can be tested for
its compressive strength. The mix can be slightly adjusted, if necessary, by changing
the w/c ratio or the aggregate cement ratio to suit the actual requirement of the job. In
the trial and error method, due consideration has to be given for the moisture content
of the aggregates.
3.4.2 Detailed on Mix Design
In this research, concrete making materials were proportioned based on the trial mixes.
The component materials of SCC trial mixes were proportioned according to the
guideline of EFNARC (2002) with slight modification in the laboratory. Through the
laboratory trial and testing the fresh properties of SCC with brick aggregate, the content
of ingredients and dosages of SP were fixed. Some initiatives were failed due to
segregation of concrete, blockage and less passing and filling ability. The time of
mixing of the concrete in the mixer machine and the application of the SP dosages into
the fresh concrete has some influence on the properties of SCC. In some cases, the
physical appearance of the fresh concrete may predict the segregation free flowable
concrete. After applying the laboratory trial and based on the knowledge from literature,
mix proportion of SCC with brick aggregate were fixed for this research.

40
The initial guideline for the proportion of the ingredients according to EFNARC (2002)
are:
Coarse aggregate content (by volume of mix) = 28-35 %
Water powder ratio (by volume) = 0.8-1.1
Total powder content (kg/m3) = 400-600
Sand content (volume) > 40 % of the mortar
Sand < 50% of paste volume
Sand by weight of total aggregate > 50%
Free water (litter/m3) < 200
Paste (% of the volume of the mix) > 40
The following is a summary of steps for determining the performance requirements and
proportioning of SCC (EFNARC, 2005).
Step 1: Determine slump flow performance requirements
Step 2: Select coarse aggregate and proportion (ACI 211.1 and 301);
Step 3: Estimate the required cementitious content and water;
Step 4: Calculate paste and mortar volume;
Step 5: Select admixture;
Step 6: Batch trial mixture;
Step 7: Test. When assessing the workability attributes of SCC (stability, filling
ability, and passing ability), the slump flow test, as well as a test to evaluate
stability and passing ability (such as column segregation, J-ring, or L-box),
should be run; and
Step 8: Adjust mixture proportions based on the test results and then rebatch
with further testing until the required properties are achieved
In this study, materials were proportioned for trial mixes following the guideline of
EFNARC (2002, 2005). Initially the weight cement, water, coarse aggregate were
determined for the fresh concrete. Sand content was calculated considering the volume
of paste and mortar and weight of the fresh concrete about 2150 -2300 kg/m3 to prepare
trial mix for 1m3 fresh concrete.
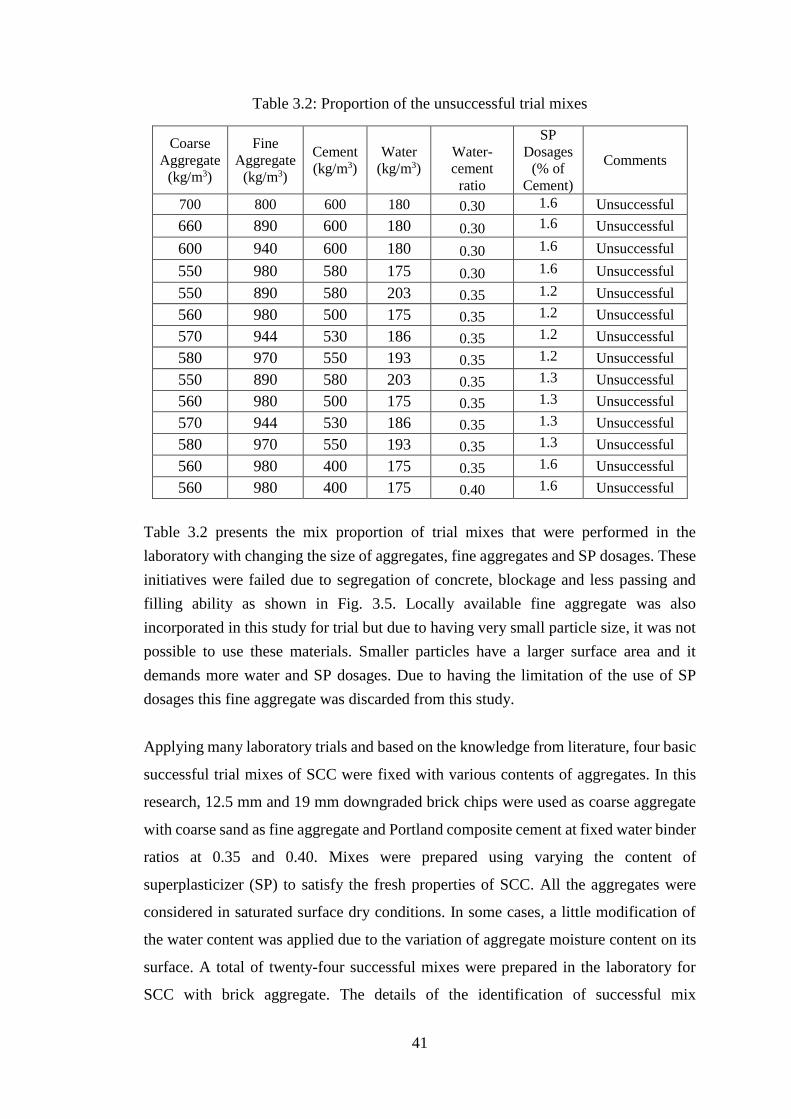
41
Table 3.2: Proportion of the unsuccessful trial mixes
Coarse
Aggregate
(kg/m3)
Fine
Aggregate
(kg/m3)
Cement
(kg/m3)
Water
(kg/m3)
Water-
cement
ratio
SP
Dosages
(% of
Cement)
Comments
700 800 600 180 0.30 1.6 Unsuccessful
660 890 600 180 0.30 1.6 Unsuccessful
600 940 600 180 0.30 1.6 Unsuccessful
550 980 580 175 0.30 1.6 Unsuccessful
550 890 580 203 0.35 1.2 Unsuccessful
560 980 500 175 0.35 1.2 Unsuccessful
570 944 530 186 0.35 1.2 Unsuccessful
580 970 550 193 0.35 1.2 Unsuccessful
550 890 580 203 0.35 1.3 Unsuccessful
560 980 500 175 0.35 1.3 Unsuccessful
570 944 530 186 0.35 1.3 Unsuccessful
580 970 550 193 0.35 1.3 Unsuccessful
560 980 400 175 0.35 1.6 Unsuccessful
560 980 400 175 0.40 1.6 Unsuccessful
Table 3.2 presents the mix proportion of trial mixes that were performed in the
laboratory with changing the size of aggregates, fine aggregates and SP dosages. These
initiatives were failed due to segregation of concrete, blockage and less passing and
filling ability as shown in Fig. 3.5. Locally available fine aggregate was also
incorporated in this study for trial but due to having very small particle size, it was not
possible to use these materials. Smaller particles have a larger surface area and it
demands more water and SP dosages. Due to having the limitation of the use of SP
dosages this fine aggregate was discarded from this study.
Applying many laboratory trials and based on the knowledge from literature, four basic
successful trial mixes of SCC were fixed with various contents of aggregates. In this
research, 12.5 mm and 19 mm downgraded brick chips were used as coarse aggregate
with coarse sand as fine aggregate and Portland composite cement at fixed water binder
ratios at 0.35 and 0.40. Mixes were prepared using varying the content of
superplasticizer (SP) to satisfy the fresh properties of SCC. All the aggregates were
considered in saturated surface dry conditions. In some cases, a little modification of
the water content was applied due to the variation of aggregate moisture content on its
surface. A total of twenty-four successful mixes were prepared in the laboratory for
SCC with brick aggregate. The details of the identification of successful mix

42
proportions for a cubic meter SCC with BA are listed in Table 3.3 and with the SP
dosages of successful trial mixes are listed in Table 3.4. Volumetric calculation of the
ingredients of SCC with BA are shown in Table 3.5
Fig. 3.5: Some unsuccessful attempts of fresh SCC
For easy identification of the cylindrical specimen of each trial mix, some identity mark
was provided for successful concrete mix at this stage and the details of specimens
identification are given in Table 3.3
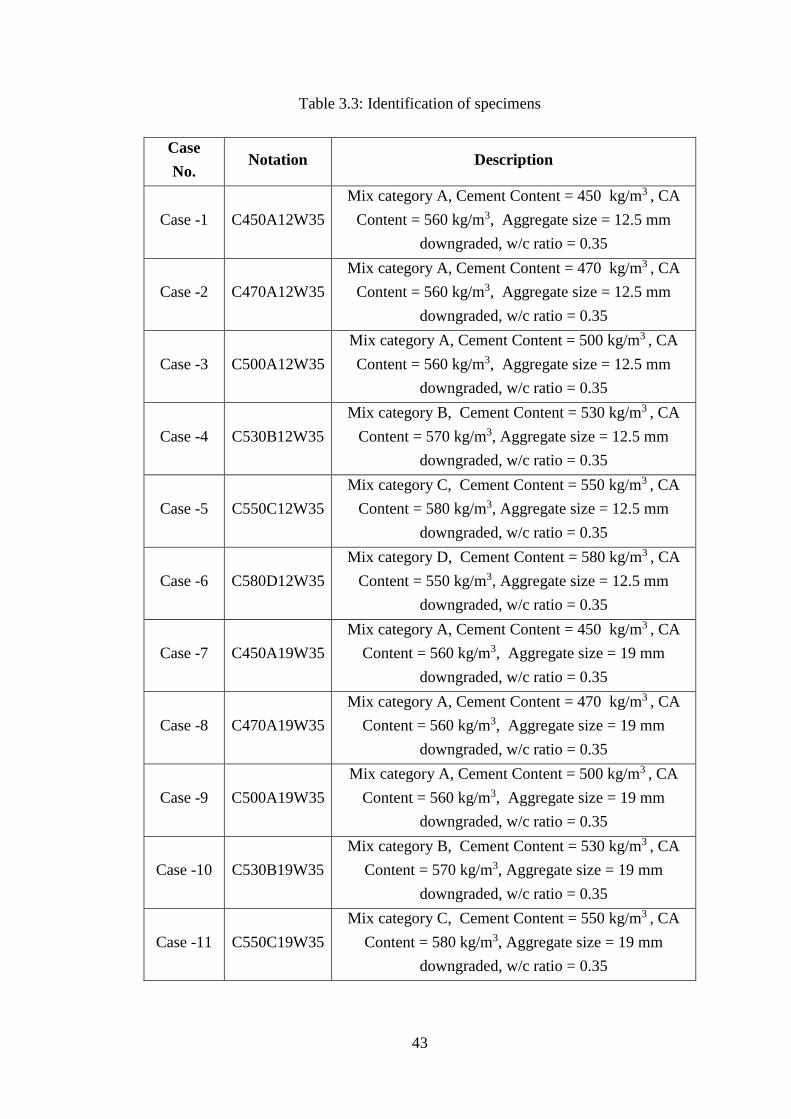
43
Table 3.3: Identification of specimens
Case
No. Notation Description
Case -1 C450A12W35
Mix category A, Cement Content = 450 kg/m3 , CA
Content = 560 kg/m3, Aggregate size = 12.5 mm
downgraded, w/c ratio = 0.35
Case -2 C470A12W35
Mix category A, Cement Content = 470 kg/m3 , CA
Content = 560 kg/m3, Aggregate size = 12.5 mm
downgraded, w/c ratio = 0.35
Case -3 C500A12W35
Mix category A, Cement Content = 500 kg/m3 , CA
Content = 560 kg/m3, Aggregate size = 12.5 mm
downgraded, w/c ratio = 0.35
Case -4 C530B12W35
Mix category B, Cement Content = 530 kg/m3 , CA
Content = 570 kg/m3, Aggregate size = 12.5 mm
downgraded, w/c ratio = 0.35
Case -5 C550C12W35
Mix category C, Cement Content = 550 kg/m3 , CA
Content = 580 kg/m3, Aggregate size = 12.5 mm
downgraded, w/c ratio = 0.35
Case -6 C580D12W35
Mix category D, Cement Content = 580 kg/m3 , CA
Content = 550 kg/m3, Aggregate size = 12.5 mm
downgraded, w/c ratio = 0.35
Case -7 C450A19W35
Mix category A, Cement Content = 450 kg/m3 , CA
Content = 560 kg/m3, Aggregate size = 19 mm
downgraded, w/c ratio = 0.35
Case -8 C470A19W35
Mix category A, Cement Content = 470 kg/m3 , CA
Content = 560 kg/m3, Aggregate size = 19 mm
downgraded, w/c ratio = 0.35
Case -9 C500A19W35
Mix category A, Cement Content = 500 kg/m3 , CA
Content = 560 kg/m3, Aggregate size = 19 mm
downgraded, w/c ratio = 0.35
Case -10 C530B19W35
Mix category B, Cement Content = 530 kg/m3 , CA
Content = 570 kg/m3, Aggregate size = 19 mm
downgraded, w/c ratio = 0.35
Case -11 C550C19W35
Mix category C, Cement Content = 550 kg/m3 , CA
Content = 580 kg/m3, Aggregate size = 19 mm
downgraded, w/c ratio = 0.35

44
Case -12 C580D19W35
Mix category D, Cement Content = 580 kg/m3 , CA
Content = 550 kg/m3, Aggregate size = 19 mm
downgraded, w/c ratio = 0.35
Case -13 C450A12W40
Mix category A, Cement Content = 450 kg/m3 , CA
Content = 560 kg/m3, Aggregate size = 12.5 mm
downgraded, w/c ratio = 0.40
Case -14 C470A12W40
Mix category A, Cement Content = 470 kg/m3 , CA
Content = 560 kg/m3, Aggregate size = 12.5 mm
downgraded, w/c ratio = 0.40
Case -15 C500A12W40
Mix category A, Cement Content = 500 kg/m3 , CA
Content = 560 kg/m3, Aggregate size = 12.5 mm
downgraded, w/c ratio = 0.40
Case -16 C530B12W40
Mix category B, Cement Content = 530 kg/m3 , CA
Content = 570 kg/m3, Aggregate size = 12.5 mm
downgraded, w/c ratio = 0.40
Case -17 C550C12W40
Mix category C, Cement Content = 550 kg/m3 , CA
Content = 580 kg/m3, Aggregate size = 12.5 mm
downgraded, w/c ratio = 0.40
Case -18 C580D12W40
Mix category D, Cement Content = 580 kg/m3 , CA
Content = 550 kg/m3, Aggregate size = 12.5 mm
downgraded, w/c ratio = 0.40
Case -19 C450A19W40
Mix category A, Cement Content = 450 kg/m3 , CA
Content = 560 kg/m3, Aggregate size = 19 mm
downgraded, w/c ratio = 0.40
Case -20 C470A19W40
Mix category A, Cement Content = 470 kg/m3 , CA
Content = 560 kg/m3, Aggregate size = 19 mm
downgraded, w/c ratio = 0.40
Case -21 C500A19W40
Mix category A, Cement Content = 500 kg/m3 , CA
Content = 560 kg/m3, Aggregate size = 19 mm
downgraded, w/c ratio = 0.40
Case -22 C530B19W40
Mix category B, Cement Content = 530 kg/m3 , CA
Content = 570 kg/m3, Aggregate size = 19 mm
downgraded, w/c ratio = 0.40
Case -23 C550C19W40
Mix category C, Cement Content = 550 kg/m3 , CA
Content = 580 kg/m3, Aggregate size = 19 mm
downgraded, w/c ratio = 0.40

45
A specimen with the abovementioned designation is identified as follows:
C450 A 12 W35
Case -24 C580D19W40
Mix category D, Cement Content = 580 kg/m3 , CA
Content = 550 kg/m3, Aggregate size = 19 mm
downgraded, w/c ratio = 0.40
A = Coarse aggregate content 560 kg/m3
B = Coarse aggregate content 570 kg/m3
C = Coarse aggregate content 580 kg/m3
D = Coarse aggregate content 550 kg/m3
W12 = 12.5 mm downgraded coarse aggregate
W19 = 19 mm downgraded coarse aggregate
35 = w/c ratio is 0.35
40 = w/c ratio is 0.40
C450 = Cement content 450 kg/m3
C470 = Cement content 470 kg/m3
C500 = Cement content 500 kg/m3
C530 = Cement content 530 kg/m3
C550 = Cement content 550 kg/m3
C580 = Cement content 580 kg/m3
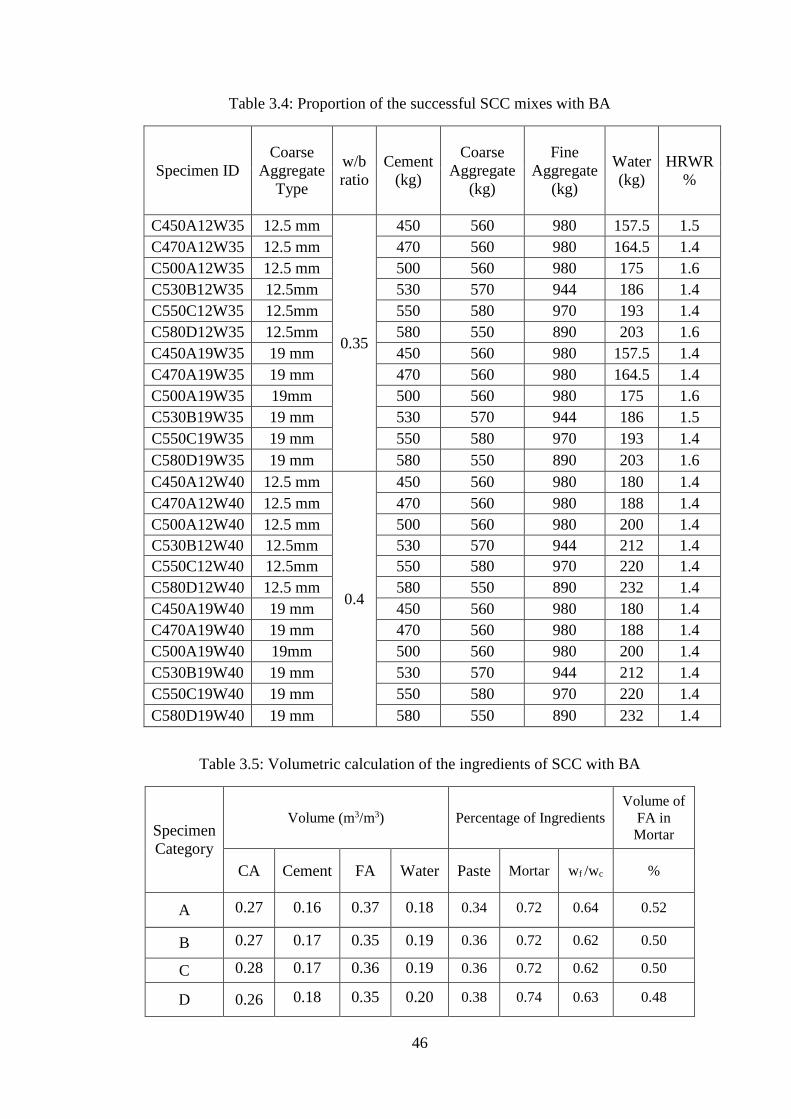
46
Table 3.4: Proportion of the successful SCC mixes with BA
Specimen ID
Coarse
Aggregate
Type
w/b
ratio
Cement
(kg)
Coarse
Aggregate
(kg)
Fine
Aggregate
(kg)
Water
(kg)
HRWR
%
C450A12W35 12.5 mm
0.35
450 560 980 157.5 1.5
C470A12W35 12.5 mm 470 560 980 164.5 1.4
C500A12W35 12.5 mm 500 560 980 175 1.6
C530B12W35 12.5mm 530 570 944 186 1.4
C550C12W35 12.5mm 550 580 970 193 1.4
C580D12W35 12.5mm 580 550 890 203 1.6
C450A19W35 19 mm 450 560 980 157.5 1.4
C470A19W35 19 mm 470 560 980 164.5 1.4
C500A19W35 19mm 500 560 980 175 1.6
C530B19W35 19 mm 530 570 944 186 1.5
C550C19W35 19 mm 550 580 970 193 1.4
C580D19W35 19 mm 580 550 890 203 1.6
C450A12W40 12.5 mm
0.4
450 560 980 180 1.4
C470A12W40 12.5 mm 470 560 980 188 1.4
C500A12W40 12.5 mm 500 560 980 200 1.4
C530B12W40 12.5mm 530 570 944 212 1.4
C550C12W40 12.5mm 550 580 970 220 1.4
C580D12W40 12.5 mm 580 550 890 232 1.4
C450A19W40 19 mm 450 560 980 180 1.4
C470A19W40 19 mm 470 560 980 188 1.4
C500A19W40 19mm 500 560 980 200 1.4
C530B19W40 19 mm 530 570 944 212 1.4
C550C19W40 19 mm 550 580 970 220 1.4
C580D19W40 19 mm 580 550 890 232 1.4
Table 3.5: Volumetric calculation of the ingredients of SCC with BA
Specimen
Category
Volume (m3/m3) Percentage of Ingredients
Volume of
FA in
Mortar
CA Cement FA Water Paste Mortar wf /wc %
A 0.27 0.16 0.37 0.18 0.34 0.72 0.64 0.52
B 0.27 0.17 0.35 0.19 0.36 0.72 0.62 0.50
C 0.28 0.17 0.36 0.19 0.36 0.72 0.62 0.50
D 0.26 0.18 0.35 0.20 0.38 0.74 0.63 0.48

47
Cost of the materials for concrete is also an important factor in the proportioning of
materials for concrete. Table 3.6 presents the cost of the materials for a cubic meter
SCC mixes with BA.
Table 3.6: Cost of the materials for a cubic meter SCC mixes with BA
Materials
Unit
Unit
price
Volume of the materials
for the mix category (m3)
Cost of the materials for a
cubic meter SCC mix (taka)
A B C D A B C D
BA m3 3200 0.27 0.27 0.28 0.26 864 864 896 832
Cement m3 12000 0.16 0.17 0.17 0.18 1920 2040 2040 2160
Sand m3 1600 0.37 0.35 0.36 0.35 592 560 576 560
SP litter 160 8 7.42 7.7 9.28 1280 1187 1232 1485
Total Cost: 4656 4651 4744 5037
3.5 PREPARATION OF CONCRETE SPECIMEN
To conduct a feasibility study of the production of SCC with brick aggregate, trial mixes
were used for casting concrete with crushed brick as coarse aggregate, fine aggregate,
cement, water and high range water reducer. All concrete mixtures were prepared
following various stages of the casting of the test specimens are explained in the
following sections.
3.5.1 Batching of the Materials
Proper and accurate measurement of all the materials were used in the production of
concrete. It is essential to ensure uniformity of proportions and aggregate grading in
successive batches. In this study, gravimetric batching was used for measuring the
materials.
3.5.2 Mixing of the Concrete
The objective of mixing is to coat the surface of all aggregate particles with cement
paste and to blend all the ingredients of the concrete into a uniform mass. In this study,
concrete mixing was done by tilting type mixer machine. The speed of the mixer
machine was about 15 to 20 revolutions per minute. Only the aggregates were mixed
for half minutes in the mixer machine. Then water was added and mixed for five
minutes with 75% of the mixing water, then cementitious materials were added and
mixed for an additional minute. Finally, the remaining water and HRWRA were added
to the mixture and mixed for another 15 minutes. When the HRWR was mixed with the

48
concrete, huge bubbles were formed to deflocculate the cement particle to impart the
fluidity of fresh concrete. Mixing was continued up to diminishing of the bubble from
the surface of the concrete. The total mixing time was about 22-25 minutes. The similar
mixing sequence was followed by Lotfy (2006) and is illustrated in Figure 3.6.
Fig. 3.6: Standard mixing sequence (Lotfy, 2006)
3.5.3 Testing of Fresh Properties of SCC
To ensure the fresh properties of SCC, the flowability, passing ability, filling ability
and segregation resistance of fresh concrete were confirmed just after mixing by slump
flow method, T50 time, V-funnel, V-funnel at T5 minutes, L-box and J-ring tests. Unit
weight tests of fresh concrete also were conducted in the laboratory.
3.5.4 Placing of Fresh Concrete
The methods used in placing concrete in its final position have an important effect on
its homogeneity, density and behavior in service. In this study, concrete was poured
into the cylindrical mold of size Ø100 mm × 200 mm to perform the mechanical
properties (compressive strength, tensile strength and modulus of elasticity) of
hardened concrete.
3.5.5 Removal of Mold
The hardened cylindrical concrete specimens were brought out removing the mold after
48 hours of their casting. Then leveling of the specimens on their surface by permanent
marker pen were done so that they can be separated without any confusion. Much care
was taken while removing the mold so that the specimens do not affect adversely.
3.5.6 Curing of Concrete
The physical properties of concrete depend largely on the extent of hydration of cement
and the resultant microstructure of the hydrated cement. Hydration of cement is
activated in the presence of water. For this reason, the curing of concrete is obviously
required. In this study, the submerged water curing method was used for the curing of

49
concrete. Test specimens were immersed under normal water in the curing tank for 28
days.
3.5.7 Testing of Hardened Concrete
The cylindrical concrete specimens were tested to calculate the compressive strength,
splitting tensile strength and modulus of elasticity. The interpretation of these test
results gives the output of this research.
3.6 FRESH PROPERTIES OF SCC MIXTURES
To satisfy the criteria of SCC, flowability, passing ability, filling ability and segregation
resistance of fresh concrete were confirmed by slump flow method, T50 time, V-funnel,
V-funnel at T5 minutes, L-box and J-ring tests conducted as per EFNARC Guideline
(EFNARC, 2005). The fresh unit weight was tested according to ASTM C 138 (2001)
.
3.6.1 Slump-Flow and T50 Flow Test
The slump flow is used to assess the horizontal free flow of SCC in the absence of
obstructions. This test is performed similarly to the conventional slump test using the
Guideline of EFNARC (2005). The mean spread of the resulting concrete patty is
measured horizontally instead of measuring the slumping distance vertically. Slump-
flow test is used to determine flow ability of self-compacting concrete. The equipment
consists of one slump cone and one flow table shown in Fig. 3.7. A concentric diameter
of 500 mm is marked on the table. The slump cone is filled with concrete while pressing
the slump cone to the table. Next, the slump cone is lifted vertically and measurement
was taken as the diameter of concrete. Simultaneously, stopwatch was started to record
the time taken for the concrete to reach the 500 mm spread circle. This is the T50 time
in sec. Also the final spread diameter of the concrete was measured in two perpendicular
directions. The average of the two measured diameters is known as slump flow in mm.
It was taken in concern that, there was no mortar or cement paste without coarse
aggregate at the edge of the pool of concrete. Fig. 3.8 shows the slump flow
measurement of this research.

50
Fig. 3.7: Slump Flow equipment
Figure 3.2: Slump Flow test apparatus
Fig. 3.8: Slump flow test of SCC with brick aggregate
3.6.2 J-Ring Test
The J-Ring test itself has been developed at the University of Paisley, Scotland. The
test is used to determine the passing ability of the concrete. The equipment consists of
an open steel ring, drilled vertically with holes to accept threaded sections of
reinforcement bar. These sections of bar can be of different diameters and spaced at
different intervals. The diameter of the ring of vertical bars is 12 in (300 mm), and the
height of 4 in (100 mm) shown in Fig. 3.9. The J-Ring can be used in conjunction with
the slump flow test. After the test, the difference in height between the concrete inside
and that just outside the J-Ring is measured. This is an indication of passing ability, or
the degree to which the passage of concrete through the bars is restricted. The J-Ring
is placed centrally on the base-plate with the slump-cone. The cone is filled without
tamping and lifted vertically to allow the concrete to flow out freely. The final diameter
of the concrete in two perpendicular directions is measured. The average of the two
measured diameters is known as J-Ring flow in mm. The difference in height between
the concrete just inside the bars and that just outside the bars is also measured. The
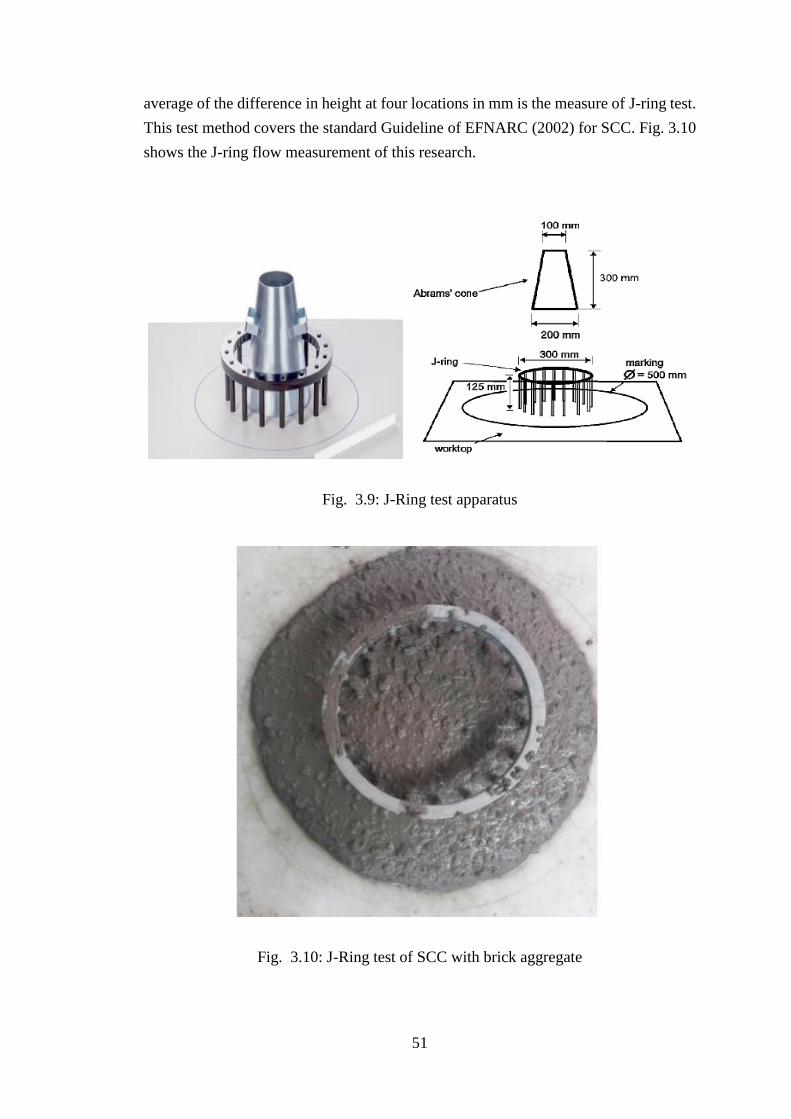
51
average of the difference in height at four locations in mm is the measure of J-ring test.
This test method covers the standard Guideline of EFNARC (2002) for SCC. Fig. 3.10
shows the J-ring flow measurement of this research.
Fig. 3.9: J-Ring test apparatus
Fig. 3.10: J-Ring test of SCC with brick aggregate

52
3.6.3 V-funnel Flow and V-funnel Flow at T 5minutes Test
V-funnel test is used to determine the flowability of SCC. The equipment consists of a
V-shaped funnel as shown in Fig. 3.11 and Fig. 3.12. The V-funnel is filled to its upper
level with concrete. Within 10 seconds after filling, the trap door allowed the concrete
to flow out under gravity. Time was measured with stopwatch when the trap door is
opened, and time recorded up to the discharge to complete. This time is taken to the
time when light is seen from above through the funnel. This is known as the V-funnel
flow time in sce. The whole test has to be performed within 5 minutes.
Without cleaning the surface of the funnel, apparatus was refilled with new concrete
and left for 5 minutes to settle and then allow the concrete to flow out under gravity.
Time was measured with stopwatch when the trap door is opened, and time recorded
up to the discharge to complete. This time is taken to the time when light is seen from
above through the funnel. This is known as the V-funnel at T5minutes flow time in sce. If
the concrete shows segregation, then the flow time will increase significantly. V-funnel
at T5minutes flow time gives the measurement of segregation resistance. This test method
covers the standard Guideline of EFNARC (2002) for SCC.
Fig. 3.11:V-funnel test apparatus
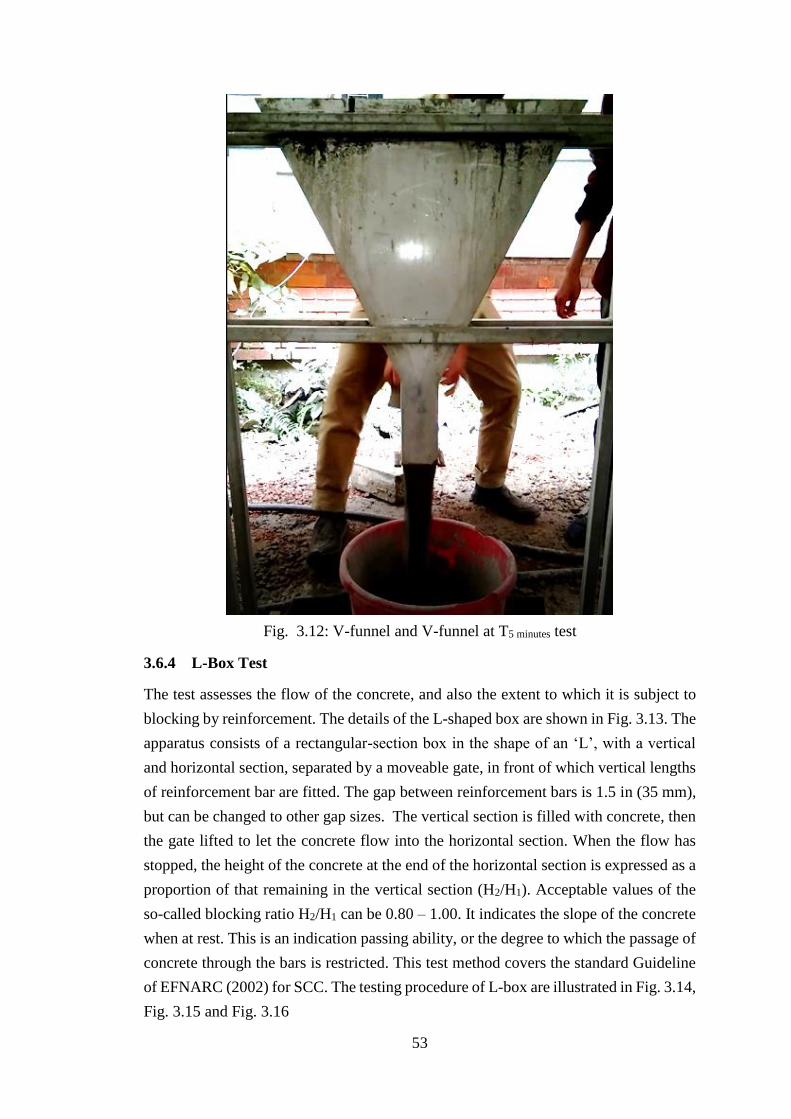
53
Fig. 3.12: V-funnel and V-funnel at T5 minutes test
3.6.4 L-Box Test
The test assesses the flow of the concrete, and also the extent to which it is subject to
blocking by reinforcement. The details of the L-shaped box are shown in Fig. 3.13. The
apparatus consists of a rectangular-section box in the shape of an ‘L’, with a vertical
and horizontal section, separated by a moveable gate, in front of which vertical lengths
of reinforcement bar are fitted. The gap between reinforcement bars is 1.5 in (35 mm),
but can be changed to other gap sizes. The vertical section is filled with concrete, then
the gate lifted to let the concrete flow into the horizontal section. When the flow has
stopped, the height of the concrete at the end of the horizontal section is expressed as a
proportion of that remaining in the vertical section (H2/H1). Acceptable values of the
so-called blocking ratio H2/H1 can be 0.80 – 1.00. It indicates the slope of the concrete
when at rest. This is an indication passing ability, or the degree to which the passage of
concrete through the bars is restricted. This test method covers the standard Guideline
of EFNARC (2002) for SCC. The testing procedure of L-box are illustrated in Fig. 3.14,
Fig. 3.15 and Fig. 3.16

54
Fig. 3.13: L-Box flow test apparatus (all units in mm)
Fig. 3.14: L-box filled with concrete

55
Fig. 3.15: Concrete passes through L-box
Fig. 3.16: Flow of concrete in L-box.
3.7 MECHANICAL PROPERTIES OF SCC
The cylindrical specimens of size Ø 100 mm × 200 mm were prepared from each
successful mix of SCC with brick aggregate to test the compressive strength, tensile
strength and modulus of elasticity of hardened concrete. After demolding, cylindrical
specimens were subjected to curing for 28 days. After the specified curing period was
over, the concrete cylinders were subjected to these tests according to standard
procedure.
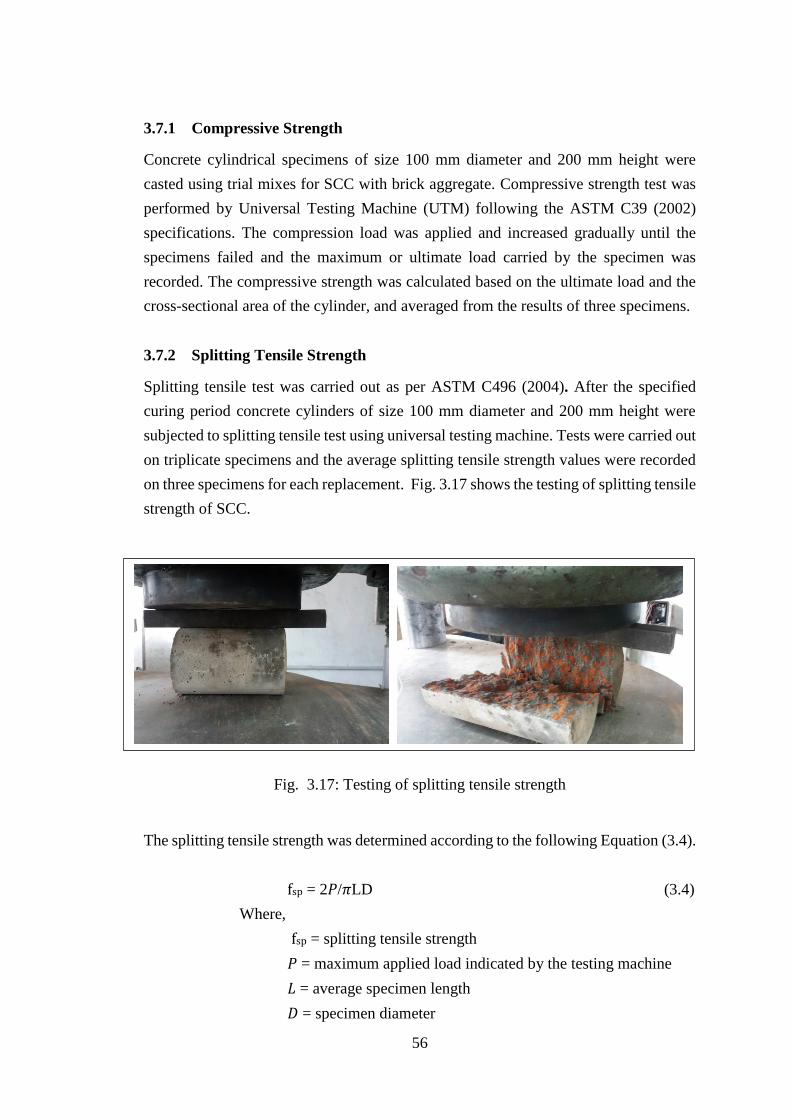
56
3.7.1 Compressive Strength
Concrete cylindrical specimens of size 100 mm diameter and 200 mm height were
casted using trial mixes for SCC with brick aggregate. Compressive strength test was
performed by Universal Testing Machine (UTM) following the ASTM C39 (2002)
specifications. The compression load was applied and increased gradually until the
specimens failed and the maximum or ultimate load carried by the specimen was
recorded. The compressive strength was calculated based on the ultimate load and the
cross-sectional area of the cylinder, and averaged from the results of three specimens.
3.7.2 Splitting Tensile Strength
Splitting tensile test was carried out as per ASTM C496 (2004). After the specified
curing period concrete cylinders of size 100 mm diameter and 200 mm height were
subjected to splitting tensile test using universal testing machine. Tests were carried out
on triplicate specimens and the average splitting tensile strength values were recorded
on three specimens for each replacement. Fig. 3.17 shows the testing of splitting tensile
strength of SCC.
Fig. 3.17: Testing of splitting tensile strength
The splitting tensile strength was determined according to the following Equation (3.4).
fsp = 2𝑃/𝜋LD (3.4)
Where,
fsp = splitting tensile strength
𝑃 = maximum applied load indicated by the testing machine
𝐿 = average specimen length
𝐷 = specimen diameter

57
3.7.3 Modulus of Elasticity of SCC
The stress-strain curve of concrete is nonlinear. Its modulus of elasticity is given by the
slope of the stress strain curve. The modulus of elasticity (Ec) increases with increase
of compressive strength of concrete. The modulus of elasticity (Ec) of concrete depends
on the following factors:
(a) Age of concrete
(b) Properties of aggregates and cement
(c) Rate of loading
(d) Type and size of specimen
According to ASTM C 469-02 (2002) Ec is computed on the basis of compressive
strength. This standard specification states that the modulus of elasticity is applicable
with the customary working stress range of 0 to 40% of the ultimate concrete strength.
Under this study, cylindrical specimens made with brick aggregate were tested for
modulus of elasticity at 28 days. The specimens were tested using a compressometer as
shown in Fig. 3.18. The specimens were tested to 40% of the ultimate concrete strength
and the modulus was calculated from the following Equation (3.5):
Ec =S2−𝑆1
ε2−0.000050 (3.5)
Where
Ec = Modulus of elasticity of concrete (psi)
S2 = Stress corresponding to 40% of the ultimate load of the
concrete (psi)
S1 = Stress corresponding to a longitudinal strain of ε1 at 50
millionths (psi)
ε2 = Longitudinal strain produced by S2

58
Fig. 3.18: Testing of modulus of elasticity
3.8 SUMMARY
This chapter has explained the preparation of materials and experimental procedures,
methodology and detailed experimental investigations that were used for this research.
The required materials used for preparation of SCC using brick aggregate have also
been mentioned. Besides this the methods, instruments and machine used for testing
the fresh and mechanical properties of concrete are given with some photographs. The
preparation and testing of SCC with BA are described with appropriate testing
standards. Relevant testing information are included in Appendix.

59
CHAPTER 4 CHAPTER IV
………… … RESULTS AND DISCUSSION
4.1 GENERAL
This chapter emphasizes the properties of self-compacting concrete made with brick
aggregate. To justify the workability of fresh SCC in terms of passing ability, filling
ability and segregation resistance properties, slump flow, T50 cm flow time, V-funnel
flow time, V-funnel flow at T5 minutes and L-box tests were conducted in this research.
Compressive strength, modulus of elasticity and splitting tensile strength test were
performed for hardened concrete. Test results are discussed separately in this chapter.
This chapter also describes the material properties and mixture proportions for the
ingredients of SCC.
4.2 PROPERTIES OF MATERIALS
In this study, 19 mm and 12.5 mm downgraded coarse aggregate made from locally
available crushed bricks were used with available coarse sand (Sylhet Sand), Portland
composite cement and Con-Lub SP as high range water reducer to produce mixes of
SCC. The physical and chemical properties of the materials are described in the
following sections.
4.2.1 Coarse Aggregate
Coarse aggregates were prepared by crushing the locally available first class clay bricks.
The physical properties of coarse aggregates were confirmed by standard test
specifications that have been elaborated in the previous chapter and properties observed
for these coarse aggregate are summarized in Table 4.1.
From Table 4.1, it is observed that fineness modulus, specific gravity (OD), water
absorption, unit weight, elongation and flakiness index of brick aggregate were 6.79,
1.73, 19.7%, 917 kg/m3, 10.9 and 12.06 respectively for 19 mm downgraded coarse
aggregate. Also the values of these properties for 12.5 mm downgraded were 6.56, 1.73,
19.8%, 923 kg/m3, 10.8 and 11.6 respectively.

60
Table 4.1: Properties of coarse and fine aggregates
Properties
Coarse Aggregate Fine
Aggregate
(Coarse
Sand) (19 mm
Downgrade)
(12.5 mm
Downgrade)
Fineness Modulus 6.79 6.56 2.81
Unit weight (OD) (kg/m3) 917 923 1512
Water absorption (%) 19.7 19.8 1.0
Field Moisture (%) 7.41 7.42 0.35
Specific Gravity (Oven dry) 1.73 1.73 2.61
(SSD) 2.07 2.07 2.63
Elongation Index 10.9 10.8 -
Flakiness Index 12.6 11.6 -
Rashid et al. (2012) found fineness modulus, specific gravity, water absorption and unit
weight of brick aggregate as 7.17, 2.03, 16.0% and 903 kg/m3 respectively and fineness
modulus, specific gravity, water absorption of fine aggregate as 1.62, 2.65 and 2.04%
respectively. The value of the properties of aggregates mentioned in the Table 4.1 are
very similar to these researchers.
Fig. 4.1: Gradation curve of 12.5 mm downgraded coarse aggregate
0
20
40
60
80
100
1 10 100
12.5 mm Downgraded CA ASTM Lower Limit ASTM Upper Limit
Sieve size (mm)
%
Fin
er
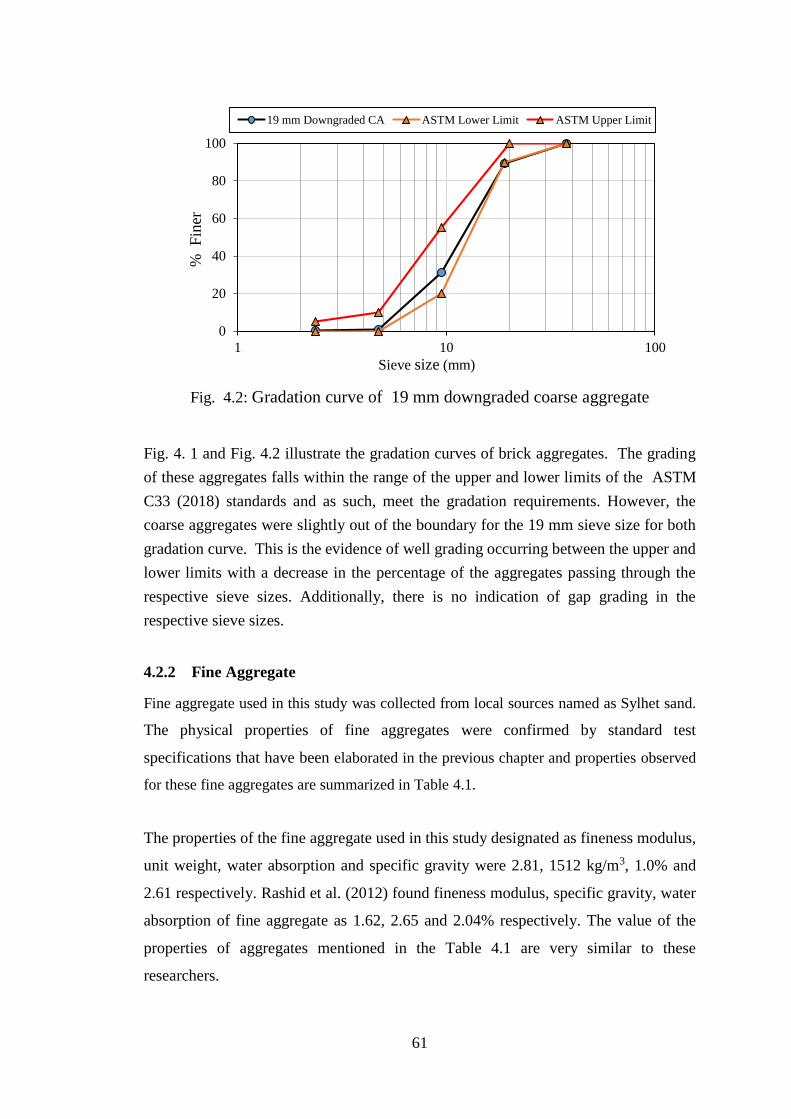
61
Fig. 4.2: Gradation curve of 19 mm downgraded coarse aggregate
Fig. 4. 1 and Fig. 4.2 illustrate the gradation curves of brick aggregates. The grading
of these aggregates falls within the range of the upper and lower limits of the ASTM
C33 (2018) standards and as such, meet the gradation requirements. However, the
coarse aggregates were slightly out of the boundary for the 19 mm sieve size for both
gradation curve. This is the evidence of well grading occurring between the upper and
lower limits with a decrease in the percentage of the aggregates passing through the
respective sieve sizes. Additionally, there is no indication of gap grading in the
respective sieve sizes.
4.2.2 Fine Aggregate
Fine aggregate used in this study was collected from local sources named as Sylhet sand.
The physical properties of fine aggregates were confirmed by standard test
specifications that have been elaborated in the previous chapter and properties observed
for these fine aggregates are summarized in Table 4.1.
The properties of the fine aggregate used in this study designated as fineness modulus,
unit weight, water absorption and specific gravity were 2.81, 1512 kg/m3, 1.0% and
2.61 respectively. Rashid et al. (2012) found fineness modulus, specific gravity, water
absorption of fine aggregate as 1.62, 2.65 and 2.04% respectively. The value of the
properties of aggregates mentioned in the Table 4.1 are very similar to these
researchers.
0
20
40
60
80
100
1 10 100
19 mm Downgraded CA ASTM Lower Limit ASTM Upper Limit
Sieve size (mm)
% F
iner
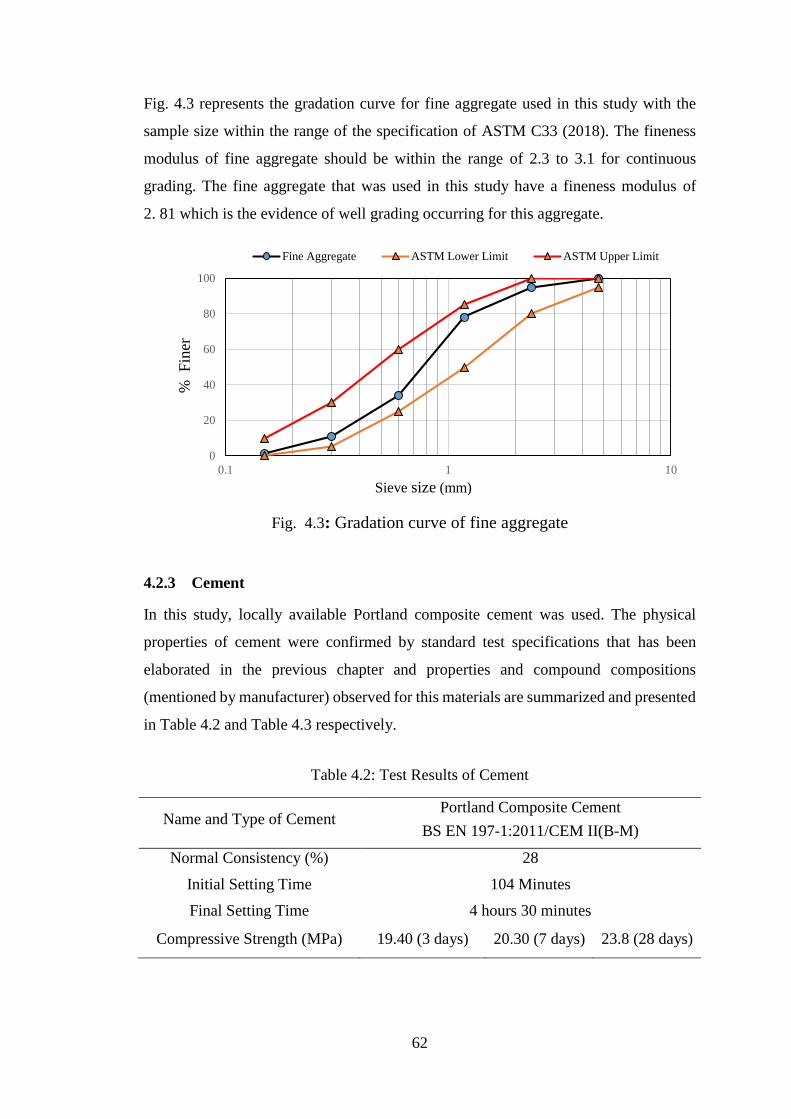
62
Fig. 4.3 represents the gradation curve for fine aggregate used in this study with the
sample size within the range of the specification of ASTM C33 (2018). The fineness
modulus of fine aggregate should be within the range of 2.3 to 3.1 for continuous
grading. The fine aggregate that was used in this study have a fineness modulus of
2. 81 which is the evidence of well grading occurring for this aggregate.
Fig. 4.3: Gradation curve of fine aggregate
4.2.3 Cement
In this study, locally available Portland composite cement was used. The physical
properties of cement were confirmed by standard test specifications that has been
elaborated in the previous chapter and properties and compound compositions
(mentioned by manufacturer) observed for this materials are summarized and presented
in Table 4.2 and Table 4.3 respectively.
Table 4.2: Test Results of Cement
Name and Type of Cement Portland Composite Cement
BS EN 197-1:2011/CEM II(B-M)
Normal Consistency (%) 28
Initial Setting Time 104 Minutes
Final Setting Time 4 hours 30 minutes
Compressive Strength (MPa) 19.40 (3 days) 20.30 (7 days) 23.8 (28 days)
0
20
40
60
80
100
0.1 1 10
Fine Aggregate ASTM Lower Limit ASTM Upper Limit
Sieve size (mm)
% F
iner
63
Table 4.3: Compound compositions of portland composite cement
Compounds Percentage by Mass CEM II (B-M) Standard
Clinker 70-79 65-79
Gypsum 0-5 0-5
Slag, Fly ash & Limestone 21-30 21-35
4.2.4 Superplasticizer
Con-Lub SP is a high range water reducer, accelerating super plasticizer and an
extremely powerful de-flocculating agent. This superplasticizer was used in the mixes
of SCC to achieve the fresh properties of SCC. Technical data provided by
manufacturer are listed in Table 4.4.
Table 4.4: Technical data of Superplasticizer
Type of superplasticizer ASTM C494; Type F and G
Appearance Light Yellow Liquid
Specific Gravity at 20° C 1.07±0.01
pH value 7±1
Alkali Content (%) No affecting Alkali
Chloride Content (%), expressed as a
percentage of mass of total admixture
zero
Dosages by weight of cement 0.6-1.6%
4.3 PHYSICAL OBSERVATION OF FRESH CONCRETE
At the time of mixing, the physical state of the fresh concrete was observed. It was
found that huge bubbles formed on the concrete at the time of mixing which is shown
in Fig. 4.5. It was also observed that fresh SCC with the bubbles on the surface
possesses segregation and bleeding in the concrete. With increasing the mixing time,
these bubbles got diminished gradually. As a results, there was no bleeding and
segregation in the fresh concrete as shown in Fig. 4.6. When water was added to the
ingredients of concrete, the cement particle entraps water with air. Due to the addition
of SP, it starts to deflocculate the cement particle and frees the water and air to impart
the fluidity of fresh concrete. When all the cement particles get deflocculated by the

64
dispersing action of SP and entrap water and air gets free, then the fresh concrete shows
the good quality of flowability and stability.
Fig. 4.4: Surface of the fresh concrete with bubbles formation
Fig. 4.5: Surface of the fresh concrete without bubbles formation

65
4.4 FRESH PROPERTIES OF SCC WITH BRICK AGGREGATE
To investigate the filling ability, passing ability, and segregation resistance of the fresh
concrete, slump flow, T50 flow time, V-funnel flow, V-funnel flow at T5 minutes,
L-box and J-ring tests were performed. These results are shown in Table 4.5 and
discussed below.
Table 4.5: Fresh properties of SCC with brick aggregate
Specimen ID
Filling ability Passing ability Segregation
Resistance
SF1
(mm)
T502
(s)
Tv3
(s)
JF4
(mm)
BI5
(mm)
JF6
(mm) BR7
Tv58
(s) +
C450A12W35 590 4.5 7.5 565 25 10 0.89 +2.9
C470A12W35 610 4.3 7 580 30 9 0.93 +2.3
C500A12W35 640 3.85 7.5 605 35 8 0.95 +2.5
C530B12W35 630 3.6 6.5 615 15 3 0.98 +2.7
C550C12W35 620 3.56 6.3 595 25 4 0.99 +2.5
C580D12W35 660 4 8.1 620 40 4.5 1.00 +3
C450A19W35 580 4.8 6.8 560 20 8 0.96 +2.9
C470A19W35 605 4.6 6.8 580 25 8 0.95 +3.2
C500A19W35 610 4.5 6.6 580 30 7 0.98 +3.5
C530B19W35 615 4.3 6.5 570 45 9 0.98 +3.5
C550C19W35 610 4 6.5 555 55 9 0.88 +3.5
C580D19W35 620 4.5 6.4 585 35 6 0.98 +2
C450A12W40 610 4 7 585 25 9 0.88 +3.9
C470A12W40 620 3.8 6.5 595 25 6 0.90 +3.6
C500A12W40 650 3.4 6 610 40 5 0.95 +2.4
C530B12W40 640 3.6 5.8 600 40 8 0.95 +2.3
C550C12W40 640 3.56 5.8 610 30 9 0.90 +2.5
C580D12W40 670 3 6.5 650 20 3 0.98 +2.5
C450A19W40 595 4.2 6.1 570 25 10 0.94 +2.3
C470A19W40 620 3.9 6.2 597 23 9 0.92 +2.8
C500A19W40 640 4.1 6.5 600 40 6 0.90 +3.0
C530B19W40 640 4.3 6.2 610 30 9 0.90 +3.0
C550C19W40 630 3.9 6 590 40 10 0.88 +3.1
C580D19W40 650 3.8 7.5 610 40 7 0.95 +2.5 1slump flow, 2T50 slump flow time, 3V-funnel flow time, 4 J-ring flow, 5 J-ring blocking
index, 6 Height difference just inside and outside of the bar, 7 L-box blocking ratio, 8V-
funnel at T5minutes
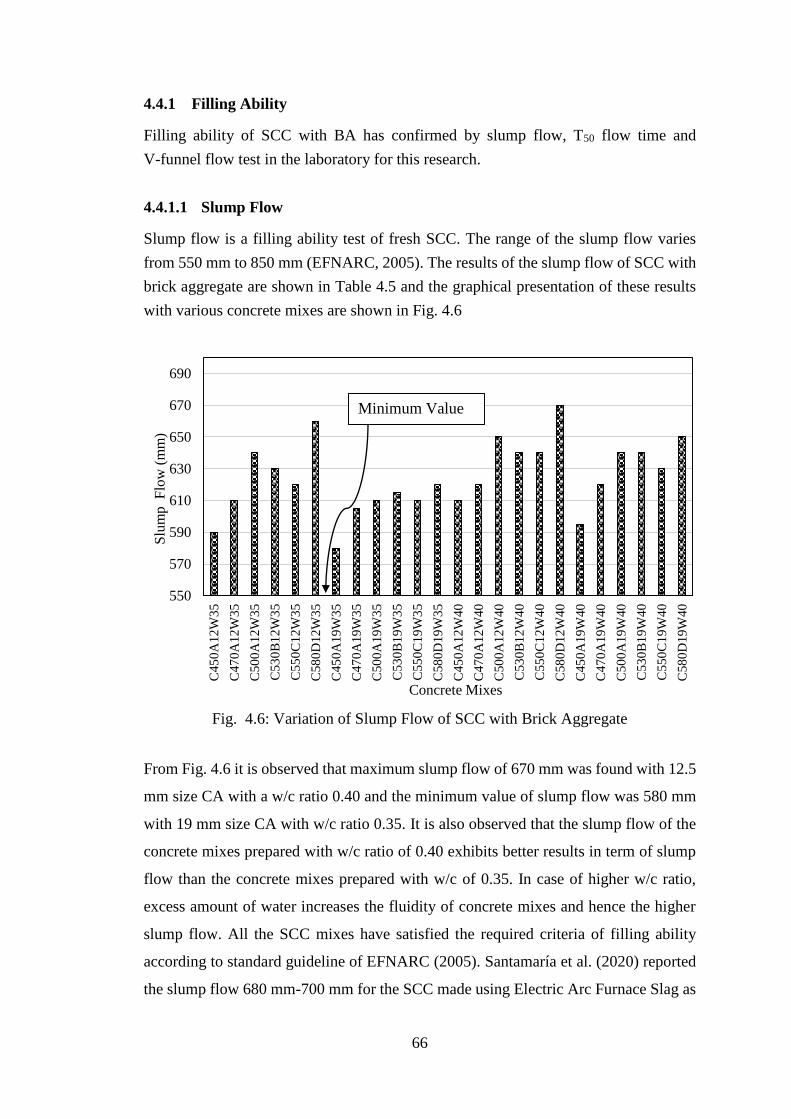
66
4.4.1 Filling Ability
Filling ability of SCC with BA has confirmed by slump flow, T50 flow time and
V-funnel flow test in the laboratory for this research.
4.4.1.1 Slump Flow
Slump flow is a filling ability test of fresh SCC. The range of the slump flow varies
from 550 mm to 850 mm (EFNARC, 2005). The results of the slump flow of SCC with
brick aggregate are shown in Table 4.5 and the graphical presentation of these results
with various concrete mixes are shown in Fig. 4.6
Fig. 4.6: Variation of Slump Flow of SCC with Brick Aggregate
From Fig. 4.6 it is observed that maximum slump flow of 670 mm was found with 12.5
mm size CA with a w/c ratio 0.40 and the minimum value of slump flow was 580 mm
with 19 mm size CA with w/c ratio 0.35. It is also observed that the slump flow of the
concrete mixes prepared with w/c ratio of 0.40 exhibits better results in term of slump
flow than the concrete mixes prepared with w/c of 0.35. In case of higher w/c ratio,
excess amount of water increases the fluidity of concrete mixes and hence the higher
slump flow. All the SCC mixes have satisfied the required criteria of filling ability
according to standard guideline of EFNARC (2005). Santamaría et al. (2020) reported
the slump flow 680 mm-700 mm for the SCC made using Electric Arc Furnace Slag as
550
570
590
610
630
650
670
690
C45
0A
12
W35
C47
0A
12
W35
C50
0A
12
W35
C53
0B
12
W3
5
C55
0C
12
W3
5
C58
0D
12
W35
C45
0A
19
W35
C47
0A
19
W35
C50
0A
19
W35
C53
0B
19
W3
5
C55
0C
19
W3
5
C58
0D
19
W35
C45
0A
12
W40
C47
0A
12
W40
C50
0A
12
W40
C53
0B
12
W4
0
C55
0C
12
W4
0
C58
0D
12
W40
C45
0A
19
W40
C47
0A
19
W40
C50
0A
19
W40
C53
0B
19
W4
0
C55
0C
19
W4
0
C58
0D
19
W40
Slu
mp
Flo
w (
mm
)
Concrete Mixes
Minimum Value

67
coarse aggregate. Roy et al. (2019) reported the slump flow of SCC made with brick
aggregate is 427 mm-712 mm. In another study of SCC with replacement of natural
brick aggregate with recycled one by Roy et al. (2016), the value of slump flows was
reported 735 mm-755 mm. Khayat (2015) reported that an SCC with a slump flow of
650 mm for the 20 mm size natural CA with 555 kg/m3 of cementitious materials can
be more suitable for casting highly congested structures. Nischay et al. (2015) also
reported that when natural aggregate replaced by the recycled aggregate, slump flows
were 690 mm and 580mm for 25% and 100% replacement respectively. Safiuddin et
al. (2014) revealed that the slump flow SCC made with crushed granite varied from
605 mm to 720 mm. To ensure adequate self-consolidation capacity, a minimum slump
flow of 600 mm is generally recommended for SCC (Khayat, 2000). Therefore, from
the above discussion it can be concluded that SCC mixes with brick aggregate shows
good passing ability. This extends the tendency of flowability revealed as a highly
flowable SCC.
Fig. 4.7 presents the variation of slump of SCC with 12.5 mm and 19 mm CA at w/c
ratio of 0.35. Slump flow series with 12.5 mm CA (660 mm, 640 mm, 630 mm and 620
mm) and 19 mm CA (620 mm, 610 mm, 615 mm and 610 mm) were found for the CA
contents of 550 kg/m3, 560 kg/m3, 570 kg/m3 and 580 kg/m3 respectively. It is found
that the higher slump flow value with 12.5 mm CA compared to 19 mm CA. Also the
slump flow value of SCC with BA decreases with increasing the CA content.
Fig. 4.7: Variation of slump flow of SCC (w/c = 0.35)
600
620
640
660
680
540 550 560 570 580 590
Slu
mp F
low
(m
m)
CA Content (kg/m3)
12.5 mm CA with w/c = 0.35
19 mm CA with w/c = 0.35

68
Fig. 4.8 presents the variation of slump of SCC with 12.5 mm and 19 mm CA at w/c
ratio of 0.40. Slump flow series with 12.5 mm CA (670 mm, 650 mm, 640 mm and 640
mm) and 19 mm CA (650 mm, 640 mm, 640 mm and 630 mm) were found for the CA
contents of 550 kg/m3, 560 kg/m3, 570 kg/m3 and 580 kg/m3 respectively. It is found
the similar result of SCC mixes with w/c of 0.35 that lower sizes CA possesses higher
slump flow value and it is decreases with increasing the CA content. A very good filling
ability was attained with 12.5 mm CA over the 19 mm size CA in all cases. Similar
results were reported by Olowofoyeku et al. (2019), Kasim et al. (2017) and
Pandurangan et al. 2012) that the lower size of coarse aggregate yielded better slump
flow properties than higher size of aggregates. This may be attributed that the particle
size distribution and the shape of coarse aggregate directly influence the flow and
passing ability of SCC and its paste demand. Smaller size aggregate cause less blocking
and the greater flow because of reduced internal friction.
Fig. 4.8: Variation of slump flow of SCC (w/c = 0.40)
In case of all concrete mixes, the slump flow decreased with the increase of CA content.
Lower content of CA possessed a very good slump flow. It may be attributed that with
increasing the CA content, amount of aggregate increased for the concrete mix and the
internal friction among the aggregate particles increased which results the blocking in
the concrete flow and lower the slump flow.
From the above discussion, it can be concluded that smaller size CA and lower content
of CA can hold a very good filling ability in terms of slump flow. All mixes have
620
640
660
680
540 550 560 570 580 590
Slu
mp F
low
(m
m)
CA Content (kg/m3)
12.5 mm CA with w/c = 0.40
19 mm CA with w/c = 0.40
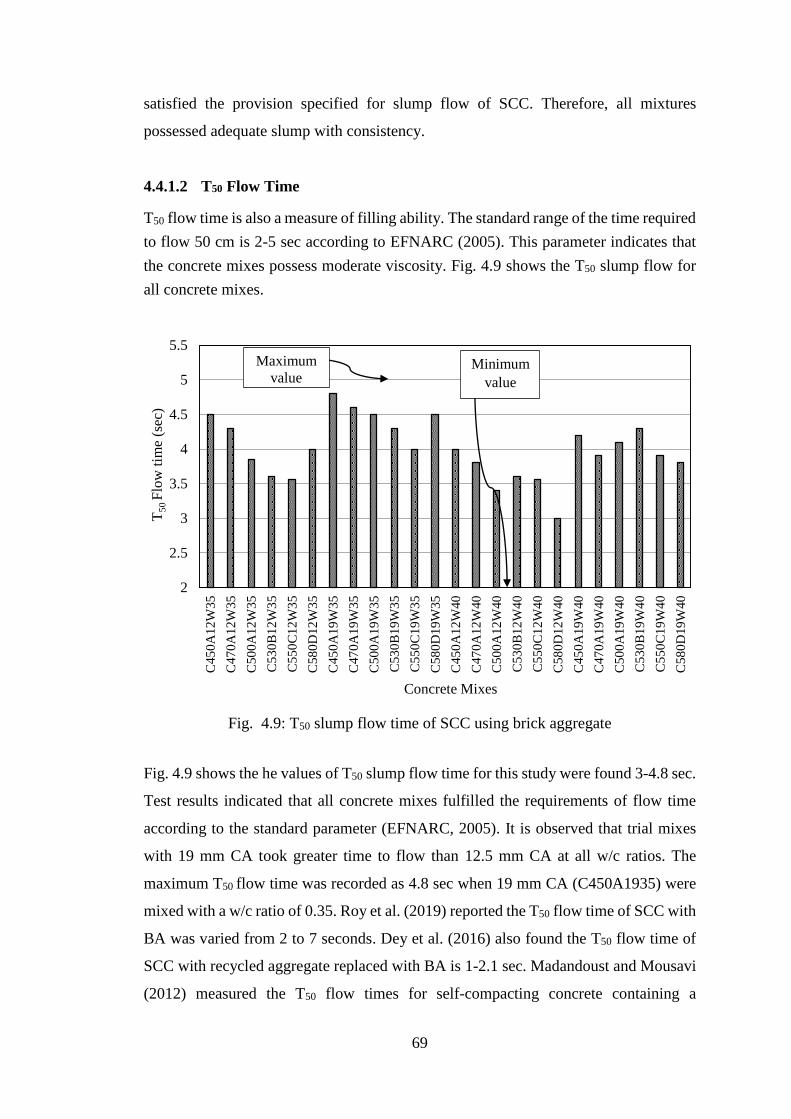
69
satisfied the provision specified for slump flow of SCC. Therefore, all mixtures
possessed adequate slump with consistency.
4.4.1.2 T50 Flow Time
T50 flow time is also a measure of filling ability. The standard range of the time required
to flow 50 cm is 2-5 sec according to EFNARC (2005). This parameter indicates that
the concrete mixes possess moderate viscosity. Fig. 4.9 shows the T50 slump flow for
all concrete mixes.
Fig. 4.9: T50 slump flow time of SCC using brick aggregate
Fig. 4.9 shows the he values of T50 slump flow time for this study were found 3-4.8 sec.
Test results indicated that all concrete mixes fulfilled the requirements of flow time
according to the standard parameter (EFNARC, 2005). It is observed that trial mixes
with 19 mm CA took greater time to flow than 12.5 mm CA at all w/c ratios. The
maximum T50 flow time was recorded as 4.8 sec when 19 mm CA (C450A1935) were
mixed with a w/c ratio of 0.35. Roy et al. (2019) reported the T50 flow time of SCC with
BA was varied from 2 to 7 seconds. Dey et al. (2016) also found the T50 flow time of
SCC with recycled aggregate replaced with BA is 1-2.1 sec. Madandoust and Mousavi
(2012) measured the T50 flow times for self-compacting concrete containing a
2
2.5
3
3.5
4
4.5
5
5.5
C45
0A
12
W35
C47
0A
12
W35
C50
0A
12
W35
C53
0B
12
W3
5
C55
0C
12
W3
5
C58
0D
12
W35
C45
0A
19
W35
C47
0A
19
W35
C50
0A
19
W35
C53
0B
19
W3
5
C55
0C
19
W3
5
C58
0D
19
W35
C45
0A
12
W40
C47
0A
12
W40
C50
0A
12
W40
C53
0B
12
W4
0
C55
0C
12
W4
0
C58
0D
12
W40
C45
0A
19
W40
C47
0A
19
W40
C50
0A
19
W40
C53
0B
19
W4
0
C55
0C
19
W4
0
C58
0D
19
W40
T5
0 F
low
tim
e (s
ec)
Concrete Mixes
Maximum
value Minimum
value

70
maximum nominal size 12.5 mm limestone gravel as coarse aggregate within the range
of 1.3-7.97 sec. Mohamad et al. (2015) reported the T50 flow time for SCC with natural
aggregate in the range of 1-6 sec. Safiuddin et al. (2011b) reported that the T50 slump
flow time varied in the range of 2.6-4.5 sec for SCC with recycled aggregate.
Fig. 4.10 presents the variation of slump flow and T50 flow time of the SCC mix made
with brick aggregate. It is observed that T50 time was maximum in the case of the SCC
having low slump flow value.
Fig. 4.10: Variation of slump flow and T50 flow time of SCC
From this research, minimum slump flow values were found with 19 mm size CA and
a w/c ratio of 0.35 and simultaneously the T50 flow time for this mix was maximum.
On the other hand, maximum slump flow values were found with 12.5 mm size CA and
a w/c ratio of 0.40, and simultaneously the T50 flow time for this mix was minimum.
This may be attribute that the larger size CA contains higher irregular shaped aggregates
and causes the resistance to flow of SCC mixes compared to smaller sizes CA. This
variation takes place due to the angularity and elongation of 19 mm CA over the
aggregate size of 12.5 mm. However, SCC with brick aggregate possesses a moderate
viscosity with respect to T50 flow time. However, it can be concluded that T50 flow time
is inversely proportional to slump flow value for any SCC mix.
2.5
3
3.5
4
4.5
5
550
600
650
700
C45
0A
12
W35
C47
0A
12
W35
C50
0A
12
W35
C53
0B
12
W3
5
C55
0C
12
W3
5
C58
0D
12
W35
C45
0A
19
W35
C47
0A
19
W35
C50
0A
19
W35
C53
0B
19
W3
5
C55
0C
19
W3
5
C58
0D
19
W35
C45
0A
12
W40
C47
0A
12
W40
C50
0A
12
W40
C53
0B
12
W4
0
C55
0C
12
W4
0
C58
0D
12
W40
C45
0A
19
W40
C47
0A
19
W40
C50
0A
19
W40
C53
0B
19
W4
0
C55
0C
19
W4
0
C58
0D
19
W40
T5
0F
low
Tim
e (s
ec)
Slu
mp f
low
(m
m)
Concrete Mixes
Slump Flow T50 Flow Time

71
4.4.1.3 V- Funnel Flow
Results of V-funnel flow tests of different concrete mixes are presented in Table 4.5.
V-funnel flow test is used to measure the filling ability of self-compacting concrete. In
this test, time is measured to pass the fresh concrete through the V-funnel. The standard
value of the time for V-funnel flow time is 6 to 12 sec according to EFNARC (2002).
Results obtained from these test exhibited the satisfactory parameter for these values.
Graphical presentation of the time needed for V-funnel flow tests are shown in Fig.
4.11.
Fig. 4.11: Time needed for V-funnel flow
Maximum and minimum value of V-funnel time were recorded as 8.1 sec and 5.8 sec
which represent good passing ability. From graph it is observed that there was no
specific condition to characterize the V-funnel time. Roy et al. (2019) reported the V-
funnel flow was 4-15 sec. In another study, Dey et al. (2016) shows the value of
V-funnel flow time was 6-11.5 sec with replacement of natural brick aggregate with
recycled aggregate.
0
1
2
3
4
5
6
7
8
9
C450A
12W
35
C4
70A
12
W3
5
C500A
12W
35
C530B
12W
35
C550C
12W
35
C5
80D
12
W3
5
C450A
19W
35
C470A
19W
35
C500A
19W
35
C5
30B
19W
35
C550C
19W
35
C580D
19W
35
C450A
12W
40
C4
70A
12
W4
0
C500A
12W
40
C530B
12W
40
C550C
12W
40
C5
80D
12
W4
0
C450A
19W
40
C470A
19W
40
C500A
19W
40
C5
30B
19W
40
C550C
19W
40
C580D
19W
40
Tim
e (s
ec)
Concrete Mixes
V-funnel Flow Time
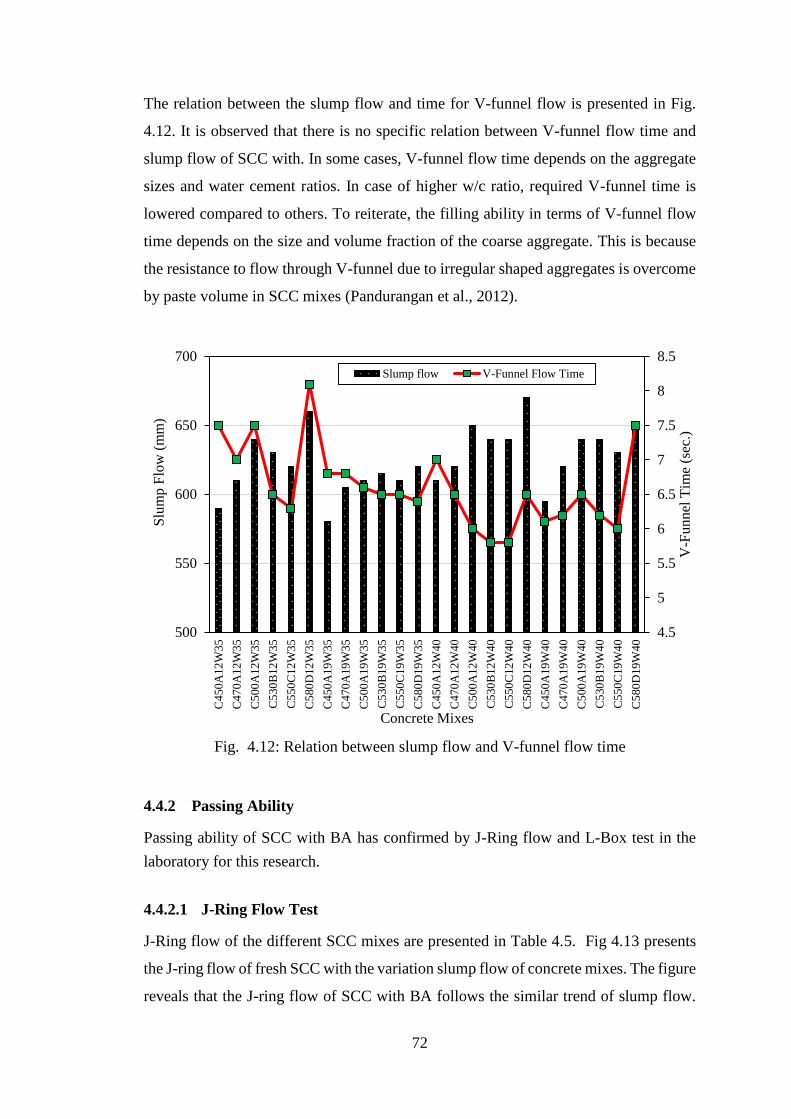
72
The relation between the slump flow and time for V-funnel flow is presented in Fig.
4.12. It is observed that there is no specific relation between V-funnel flow time and
slump flow of SCC with. In some cases, V-funnel flow time depends on the aggregate
sizes and water cement ratios. In case of higher w/c ratio, required V-funnel time is
lowered compared to others. To reiterate, the filling ability in terms of V-funnel flow
time depends on the size and volume fraction of the coarse aggregate. This is because
the resistance to flow through V-funnel due to irregular shaped aggregates is overcome
by paste volume in SCC mixes (Pandurangan et al., 2012).
Fig. 4.12: Relation between slump flow and V-funnel flow time
4.4.2 Passing Ability
Passing ability of SCC with BA has confirmed by J-Ring flow and L-Box test in the
laboratory for this research.
4.4.2.1 J-Ring Flow Test
J-Ring flow of the different SCC mixes are presented in Table 4.5. Fig 4.13 presents
the J-ring flow of fresh SCC with the variation slump flow of concrete mixes. The figure
reveals that the J-ring flow of SCC with BA follows the similar trend of slump flow.
4.5
5
5.5
6
6.5
7
7.5
8
8.5
500
550
600
650
700
C4
50
A12
W35
C4
70
A12
W35
C5
00
A12
W35
C5
30
B12
W3
5
C5
50
C12
W3
5
C5
80
D12
W35
C4
50
A19
W35
C4
70
A19
W35
C5
00
A19
W35
C5
30
B19
W3
5
C5
50
C19
W3
5
C5
80
D19
W35
C4
50
A12
W40
C4
70
A12
W40
C5
00
A12
W40
C5
30
B12
W4
0
C5
50
C12
W4
0
C5
80
D12
W40
C4
50
A19
W40
C4
70
A19
W40
C5
00
A19
W40
C5
30
B19
W4
0
C5
50
C19
W4
0
C5
80
D19
W40
V-F
unnel
Tim
e (s
ec.)
Slu
mp F
low
(m
m)
Concrete Mixes
Slump flow V-Funnel Flow Time
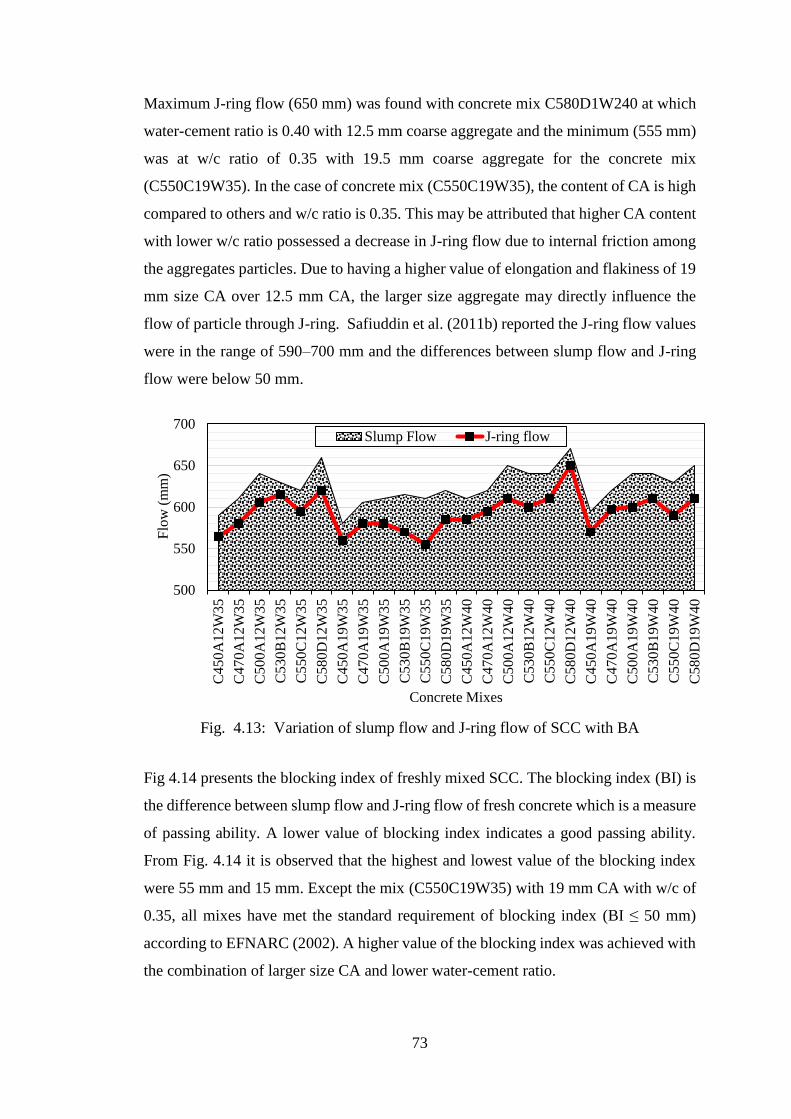
73
Maximum J-ring flow (650 mm) was found with concrete mix C580D1W240 at which
water-cement ratio is 0.40 with 12.5 mm coarse aggregate and the minimum (555 mm)
was at w/c ratio of 0.35 with 19.5 mm coarse aggregate for the concrete mix
(C550C19W35). In the case of concrete mix (C550C19W35), the content of CA is high
compared to others and w/c ratio is 0.35. This may be attributed that higher CA content
with lower w/c ratio possessed a decrease in J-ring flow due to internal friction among
the aggregates particles. Due to having a higher value of elongation and flakiness of 19
mm size CA over 12.5 mm CA, the larger size aggregate may directly influence the
flow of particle through J-ring. Safiuddin et al. (2011b) reported the J-ring flow values
were in the range of 590–700 mm and the differences between slump flow and J-ring
flow were below 50 mm.
Fig. 4.13: Variation of slump flow and J-ring flow of SCC with BA
Fig 4.14 presents the blocking index of freshly mixed SCC. The blocking index (BI) is
the difference between slump flow and J-ring flow of fresh concrete which is a measure
of passing ability. A lower value of blocking index indicates a good passing ability.
From Fig. 4.14 it is observed that the highest and lowest value of the blocking index
were 55 mm and 15 mm. Except the mix (C550C19W35) with 19 mm CA with w/c of
0.35, all mixes have met the standard requirement of blocking index (BI ≤ 50 mm)
according to EFNARC (2002). A higher value of the blocking index was achieved with
the combination of larger size CA and lower water-cement ratio.
500
550
600
650
700
C450A
12W
35
C4
70A
12
W3
5
C500A
12W
35
C530B
12W
35
C550C
12W
35
C5
80D
12
W3
5
C450A
19W
35
C470A
19W
35
C500A
19W
35
C530B
19W
35
C550C
19W
35
C580D
19W
35
C450A
12W
40
C470A
12W
40
C500A
12W
40
C530B
12W
40
C550C
12W
40
C580D
12W
40
C450A
19W
40
C470A
19W
40
C500A
19W
40
C530B
19W
40
C550C
19W
40
C580D
19W
40
Flo
w (
mm
)
Concrete Mixes
Slump Flow J-ring flow

74
Fig. 4.14: Blocking index of SCC mixes with BA
Fig 4.15 shows the height difference of concrete in J-ring. Records of the tests of this
study revealed that the maximum height difference of the concrete just inside and
outside the J-ring was maximum 10 mm.
Fig. 4.15: Height Difference in J-Ring Flow Test of SCC with BA
The value of this height difference fulfilled the requirements (Height difference ≤ 10
mm) of SCC specified by EFNARC (2002). It is also found that the height difference
0
10
20
30
40
50
60
C450A
12W
35
C4
70
A1
2W
35
C5
00
A1
2W
35
C5
30
B1
2W
35
C5
50
C1
2W
35
C5
80
D1
2W
35
C4
50
A1
9W
35
C4
70
A1
9W
35
C5
00
A1
9W
35
C5
30
B1
9W
35
C5
50
C1
9W
35
C5
80
D1
9W
35
C4
50
A1
2W
40
C4
70
A1
2W
40
C5
00
A1
2W
40
C5
30
B1
2W
40
C5
50
C1
2W
40
C5
80
D1
2W
40
C4
50
A1
9W
40
C4
70
A1
9W
40
C5
00
A1
9W
40
C530B
19W
40
C5
50
C1
9W
40
C5
80
D1
9W
40
Blo
ckin
g I
nd
ex (
mm
)
Concrete Mixes
Maximum Range
0
2
4
6
8
10
12
C45
0A
12
W35
C47
0A
12
W35
C50
0A
12
W35
C53
0B
12
W3
5
C55
0C
12
W3
5
C58
0D
12
W35
C45
0A
19
W35
C47
0A
19
W35
C50
0A
19
W35
C53
0B
19
W3
5
C55
0C
19
W3
5
C58
0D
19
W35
C45
0A
12
W40
C47
0A
12
W40
C50
0A
12
W40
C53
0B
12
W4
0
C55
0C
12
W4
0
C58
0D
12
W40
C45
0A
19
W40
C47
0A
19
W40
C50
0A
19
W40
C53
0B
19
W4
0
C55
0C
19
W4
0
C58
0D
19
W40
Hei
gh
t D
iffe
ren
ce in
J-r
ing (
mm
)
Concrete Mixes
Maximum value

75
in J-ring increases with the size of aggregate. Due to having lower elongation and
flakiness of smaller sizes aggregate, it shows good passing ability compared with larger
size aggregate.
4.4.2.2 L-Box Test
L-box test is a measure of filling ability of freshly mixed SCC. It is expressed in terms
of the value of H2/H1 known as Blocking Ratio (BR). Fig 4.16 represent the BR of
different concrete.
Fig. 4.16: Blocking ratio of SCC Mixes with BA
It is observed from Fig. 4.16 that the BR for all mixes of SCC with brick aggregate
have satisfied the required value. The value of the BR is limited to 0.80-1.0 according
to EFNARC (2002). The value of the BR of the concrete mixes had greater than 0.88
which indicates good passing ability of fresh concrete. Felekoglu et al. (2007) reported
filling abilities with L-box ratio of 0.95 and 0.50 with crushed lime stone. Dey et al.
(2016) found the L-box ratio was 0.9-1.00 with recycled brick aggregate. Roy et al.
(2019) reported the values of L-box ratio for SCC with brick aggregate was 0.67-0.98.
No segregation or blocking of aggregates was observed. All mixtures had excellent
passing ability with less tendency of segregation which indicates good flow ability of
SCC in the presence of congested reinforcement.
0.80
0.85
0.90
0.95
1.00
1.05
C450A
12W
35
C470A
12W
35
C500A
12W
35
C530B
12W
35
C550C
12W
35
C580D
12W
35
C450A
19W
35
C470A
19W
35
C500A
19W
35
C530B
19W
35
C550C
19W
35
C580D
19W
35
C450A
12W
40
C470A
12W
40
C500A
12W
40
C530B
12W
40
C550C
12W
40
C580D
12W
40
C450A
19W
40
C470A
19W
40
C500A
19W
40
C530B
19W
40
C550C
19W
40
C580D
19W
40
Blo
ckin
g R
atio
Concrete Mixes
Maximum Range Minimum Range
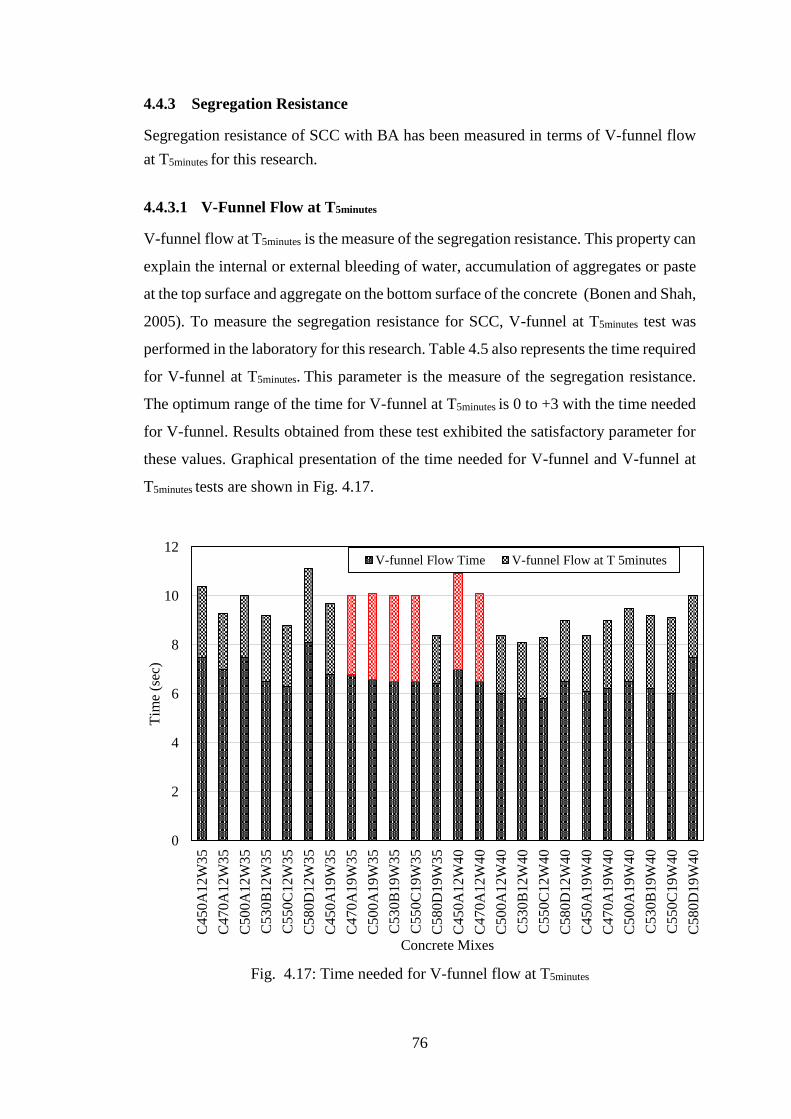
76
4.4.3 Segregation Resistance
Segregation resistance of SCC with BA has been measured in terms of V-funnel flow
at T5minutes for this research.
4.4.3.1 V-Funnel Flow at T5minutes
V-funnel flow at T5minutes is the measure of the segregation resistance. This property can
explain the internal or external bleeding of water, accumulation of aggregates or paste
at the top surface and aggregate on the bottom surface of the concrete (Bonen and Shah,
2005). To measure the segregation resistance for SCC, V-funnel at T5minutes test was
performed in the laboratory for this research. Table 4.5 also represents the time required
for V-funnel at T5minutes. This parameter is the measure of the segregation resistance.
The optimum range of the time for V-funnel at T5minutes is 0 to +3 with the time needed
for V-funnel. Results obtained from these test exhibited the satisfactory parameter for
these values. Graphical presentation of the time needed for V-funnel and V-funnel at
T5minutes tests are shown in Fig. 4.17.
Fig. 4.17: Time needed for V-funnel flow at T5minutes
0
2
4
6
8
10
12
C4
50
A1
2W
35
C470A
12W
35
C5
00
A1
2W
35
C5
30
B1
2W
35
C5
50
C1
2W
35
C580D
12W
35
C4
50
A1
9W
35
C4
70
A1
9W
35
C5
00
A1
9W
35
C530B
19W
35
C5
50
C1
9W
35
C5
80
D1
9W
35
C4
50
A1
2W
40
C470A
12W
40
C5
00
A1
2W
40
C5
30
B1
2W
40
C5
50
C1
2W
40
C580D
12W
40
C4
50
A1
9W
40
C4
70
A1
9W
40
C5
00
A1
9W
40
C530B
19W
40
C5
50
C1
9W
40
C5
80
D1
9W
40
Tim
e (s
ec)
Concrete Mixes
V-funnel Flow Time V-funnel Flow at T 5minutes

77
Fig. 4.17. shows the time needed for V-funnel flow at T5minutes test for SCC with BA. It
is observed that all the concrete mixes except C470A19W35, C500A19W35,
C530B19W35, C500C1935, C450A12W40 and C470A12W40 have satisfied the
criteria of segregation resistance It is one of the major attributes of SCC with BA. It
was observed that there was no blocking or segregation for any mixture and thus
exhibited excellent segregation resistance. Santamaría et al. (2020) use the column
segregation test to evaluate segregation in the self-compacting concrete mixtures and
satisfactory results. Also the researchers Roy et al. (2019), Dey et al. (2016), Khayat
(2015), Nischay et al. (2015), Mohamad et al. (2015) reported that no visible blocking
or segregation in their study.
4.5 CORRELATION BETWEEN FRESH PROPERTIES OF SCC WITH
BRICK AGGREGATE
The results of the fresh properties of SCC with brick aggregate for various mixes are
discussed in this chapter. All the SCC mixes possessed good fresh properties. The
detailed description of these test results have been present in the previous sections. This
section, mainly focuses the correlations between different fresh properties of SCC made
with brick aggregate.
4.5.1 Correlation between Slump Flow and J-ring Flow of SCC with Brick
Aggregate
The correlation between slump flow (SF) and the J-ring flow (JF) of fresh concrete
made with brick aggregate is shown in Fig. 4.18. It is observed that J-ring flow of SCC
with brick aggregate is linearly proportional to slump flow. The coefficient of
correlation between them is 0.8196 and the correlation exists between the slump flow
and the J-ring flow of fresh SCC is expressed as,
JF = 0.9494(SF), R² = 0.8196 (4.1)
Safiuddin et al. (2011b) correlated the slump flow and the J-ring flow of SCC with
POFA and have found a strong correlation between them and the relation is expressed
as,
JF = 0.9543 (SF), R² = 0.9634 (4.2)
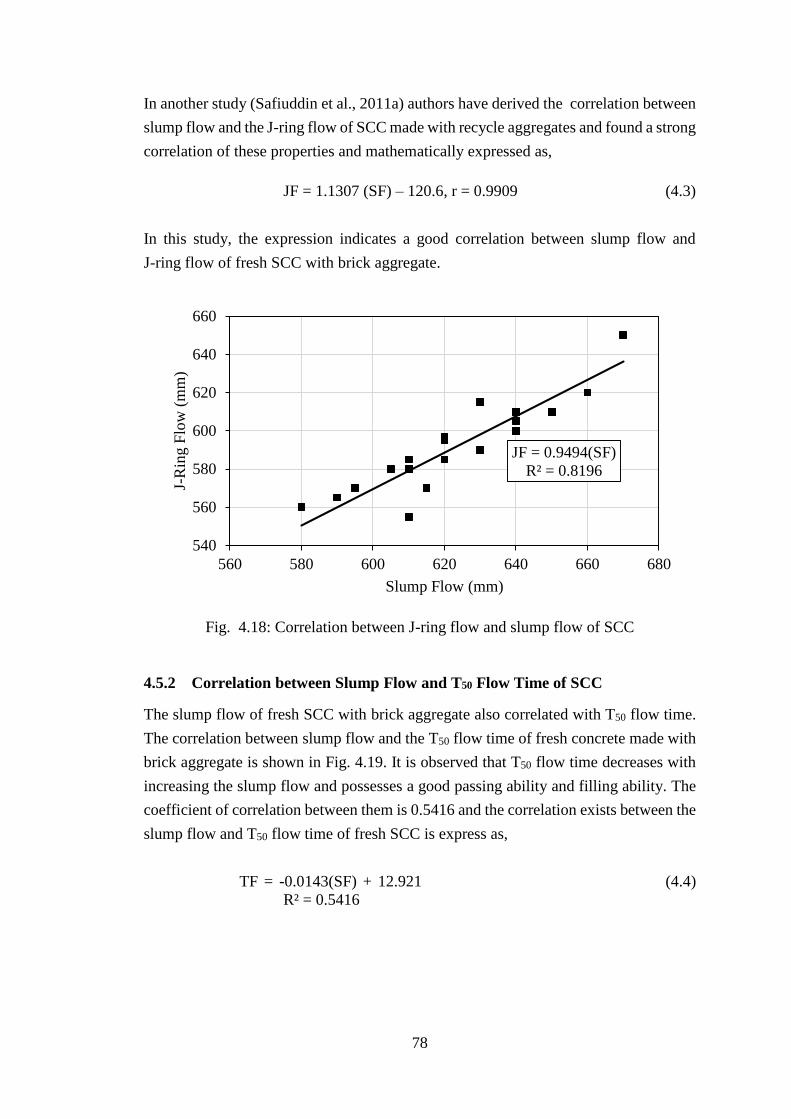
78
In another study (Safiuddin et al., 2011a) authors have derived the correlation between
slump flow and the J-ring flow of SCC made with recycle aggregates and found a strong
correlation of these properties and mathematically expressed as,
JF = 1.1307 (SF) – 120.6, r = 0.9909 (4.3)
In this study, the expression indicates a good correlation between slump flow and
J-ring flow of fresh SCC with brick aggregate.
Fig. 4.18: Correlation between J-ring flow and slump flow of SCC
4.5.2 Correlation between Slump Flow and T50 Flow Time of SCC
The slump flow of fresh SCC with brick aggregate also correlated with T50 flow time.
The correlation between slump flow and the T50 flow time of fresh concrete made with
brick aggregate is shown in Fig. 4.19. It is observed that T50 flow time decreases with
increasing the slump flow and possesses a good passing ability and filling ability. The
coefficient of correlation between them is 0.5416 and the correlation exists between the
slump flow and T50 flow time of fresh SCC is express as,
TF = -0.0143(SF) + 12.921 (4.4)
R² = 0.5416
JF = 0.9494(SF)
R² = 0.8196
540
560
580
600
620
640
660
560 580 600 620 640 660 680
J-R
ing F
low
(m
m)
Slump Flow (mm)

79
Fig. 4.19: Correlation between slump flow and T50 flow time of SCC
4.5.3 Correlation between J-ring Flow and T50 Flow Time of SCC
The J-ring flow of fresh SCC with brick aggregate is also correlated with T50 flow time.
The correlation between J-ring flow and the T50 flow time of fresh concrete made with
brick aggregate is shown in Fig. 4.20. It is observed that T50 flow time decreases with
increasing the J-ring flow and possesses a good passing ability and filling ability. The
coefficient of correlation between them is 0.5594 and the correlation exists between the
slump flow and T50 flow time of fresh SCC which is expressed as,
TF = -0.0148(JF) + 12.773 (4.5)
R² = 0.5594
Fig. 4.20: Correlation between J-ring flow and T50 flow time of SCC
TF = -0.0143(SF) + 12.921
R² = 0.5416
2.75
3.25
3.75
4.25
4.75
5.25
560 580 600 620 640 660 680
T5
0F
low
Tim
e (s
ec)
Slump Flow (mm)
TF = -0.0148(JF) + 12.773
R² = 0.5594
2.5
3
3.5
4
4.5
5
540 560 580 600 620 640 660
T5
0F
low
Tim
e (s
ec)
J-ring Flow (mm)

80
4.6 MECHANICAL PROPERTIES OF SCC WITH BRICK AGGREGATE
Mechanical properties are the most dominating factors and significant parameters for
SCC. These properties may be affected by many factors such as w/c ratios, aggregate
contents, shape and sizes of CA, properties of aggregates etc. In this study, mechanical
properties of SCC made with crushed brick as coarse aggregates were determined by
compressive strength, modulus of elasticity, and splitting tensile strength tests of
hardened concrete. The mechanical behavior of SCC with brick aggregate observed in
this study are presented in Table 4.8.
Table 4.6: Mechanical Properties of SCC with Brick Aggregate
Specimen ID
Compressive
Strength, f'c
(MPa)
Splitting
Tensile
Strength, fsp
(MPa)
Modulus of
Elasticity, Ec
(GPa)
C450A12W35 21.10 2.08 16.75
C470A12W35 24.41 2.48 18.02
C500A12W35 28.20 2.81 19.05
C530B12W35 27.81 2.73 23.91
C550C12W35 26.33 2.47 21.75
C580D12W35 29.81 2.89 16.94
C450A19W35 20.72 2.12 16.64
C470A19W35 22.67 2.29 17.33
C500A19W35 24.54 2.41 20.75
C530B19W35 23.08 2.21 15.09
C550C19W35 24.04 2.33 19.44
C580D19W35 25.65 2.59 19.76
C450A12W40 20.05 2.1 16.30
C470A12W40 21.94 2.23 17.11
C500A12W40 23.23 2.42 15.11
C530B12W40 24.07 2.45 16.72
C550C12W40 20.10 2.46 16.22
C580D12W40 24.06 2.46 18.33
C450A19W40 20.24 2.07 16.37
C470A19W40 21.13 2.11 16.75
C500A19W40 21.65 1.98 16.25
C530B19W40 22.55 2.25 15.92
C550C19W40 20.05 2.02 15.57
C580D19W40 23.67 2.64 15.38

81
4.6.1 Compressive Strength
Compressive strength is the key performance indicator for the structural use of concrete.
In this study compressive strength of hardened concrete was tested only for 28 days.
Compressive strength behavior of SCC with brick aggregate are presented in Table 4.6.
Fig. 4.21 shows the variation of compressive strength of SCC with brick aggregate. It
is found that the compressive strength of SCC ranges from 29.81 MPa to 20.05 MPa.
According to BNBC (1993), minimum strength of concrete required for earthquake
resistant structure is 20 MPa but it can be relaxed up to 17 MPa for using in a building
structure up to 4 story. In this research, SCC with brick aggregate have satisfied the
required strength along with the all fresh properties. Research on SCC with BA was
conducted by Roy et al. (2019). Authors reported the compressive strength of 20 MPa
to 40 MPa for the SCC with brick aggregate for the w/c ratios of 0.50 and 0.35
respectively. In an another study, Dey et al. (2016) reported the compressive strength
of 25 MPa to 35 MPa for a w/c ratio of 0.40 of the SCC mixes with virgin and recycled
brick aggregates.
Fig. 4.21: Compressive strength of SCC with brick aggregate
4.6.1.1 Effect of Aggregate Size and Cement Contents on Compressive Strength
of SCC
Fig. 4.22 presents the compressive strength of SCC with brick aggregates for the
concrete mixes prepared with 12.5 mm and 19 mm CA with w/c ratios of 0.35. In case
of 12.5 mm CA, compressive strengths were found 21.10 MPa, 24.41 MPa, 28.20 MPa,
0.00
10.00
20.00
30.00
40.00
12.5 mm CA with
w/c = 0.35
19 mm CA with
w/c = 0.35
12.5 mm CA with
w/c = 0.40
19 mm CA with
w/c = 0.40
Com
pre
ssiv
e S
tren
gth
(M
Pa)
Cement Content (kg/m3)
450 470 500 530 550 580

82
27.81 MPa, 26.33 MPa and 29.81 MPa with cement content 450 kg/m3, 470 kg/m3, 500
kg/m3, 530 kg/m3, 550 kg/m3 and 580 kg/m3 respectively. In case of 19 mm CA,
compressive strengths were found 20.72 MPa, 22.67 MPa, 24.54 MPa, 23.08 MPa,
24.04 MPa and 25.65 MPa with cement content 450 kg/m3, 470 kg/m3, 500 kg/m3, 530
kg/m3, 550 kg/m3 and 580 kg/m3 respectively. It is found that maximum compressive
strength was 29.81 MPa with 12.5 mm downgraded CA and minimum compressive
strength of 20.72 MPa with 19 mm downgraded CA. The results of this study show that
compressive strength of SCC with BA increase with the increment of cement content.
However, the compressive strength increases with decreasing the size of coarse
aggregate and increasing the cement contents. This is due to the higher cement content
with smaller size of coarse aggregate that has the larger surface area which results
higher bonding strength around the aggregate particles (Pandurangan et al., 2012;
Uddin et al., 2017).
Fig. 4.22: Effect of aggregate size and cement contents on the compressive strength
of SCC at w/c of 0.35
Fig. 4.22also presents the compressive strengths 21.10 MPa, 24.41 MPa and 28.20 MPa
were found with CA content 560 kg/m3 and 27.81 MPa, 26.33 MPa and 29.81 MPa
were found with CA content 570 kg/m3, 580 kg/m3 and 550 kg/m3 respectively for 12.5
mm CA. In case of 19 mm CA, compressive strengths were found 20.72 MPa, 22.67
MPa and 24.54 MPa with CA content 560 kg/m3 and 23.08 MPa, 24.04 MPa and 25.65
MPa were found with CA content 570 kg/m3, 580 kg/m3 and 550 kg/m3 respectively.
15.00
20.00
25.00
30.00
35.00
440 470 500 530 560 590
Com
pre
ssiv
e S
tren
gth
(M
Pa)
Cement Content (kg/m3)
12.5 mm CA 19 mm CA

83
It is also observed that the compressive strength of SCC with brick aggregate decreased
with higher CA content. It may be attributed that, homogeneity of concrete decreased
with increasing the aggregate content and possessed a lower compressive strength.
Fig. 4.23 indicates the variation of compressive strength of SCC with brick aggregate
at w/c ratio of 0.40. The compressive strengths were found 20.05 MPa, 21.94 MPa,
23.23 MPa, 24.07 MPa, 20.05 MPa and 23.67 MPa with cement content 450 kg/m3,
470 kg/m3, 500 kg/m3, 530 kg/m3, 550 kg/m3 and 580 kg/m3 respectively for 12.5 mm
CA. In case of 19 mm CA, compressive strengths were found 20.24 MPa, 21.13 MPa,
21.65 MPa, 22.55 MPa, 20.05 MPa and 23.65 MPa with cement content 450 kg/m3,
470 kg/m3, 500 kg/m3, 530 kg/m3, 550 kg/m3 and 580 kg/m3 respectively. The
characteristics of the strength were found similar to the strength with w/c ratio of 0.35.
However, it is also found that the compressive strength of SCC with brick aggregate
decreased with larger size coarse aggregate.
Fig. 4.23: Effect of aggregate size and cement contents on the compressive strength
of SCC at w/c of 0.40
15.00
20.00
25.00
30.00
440 470 500 530 560 590
Com
pre
ssiv
e S
tren
gth
(M
Pa)
Cement Content (kg/m3)
12.5 mm CA 19 mm CA
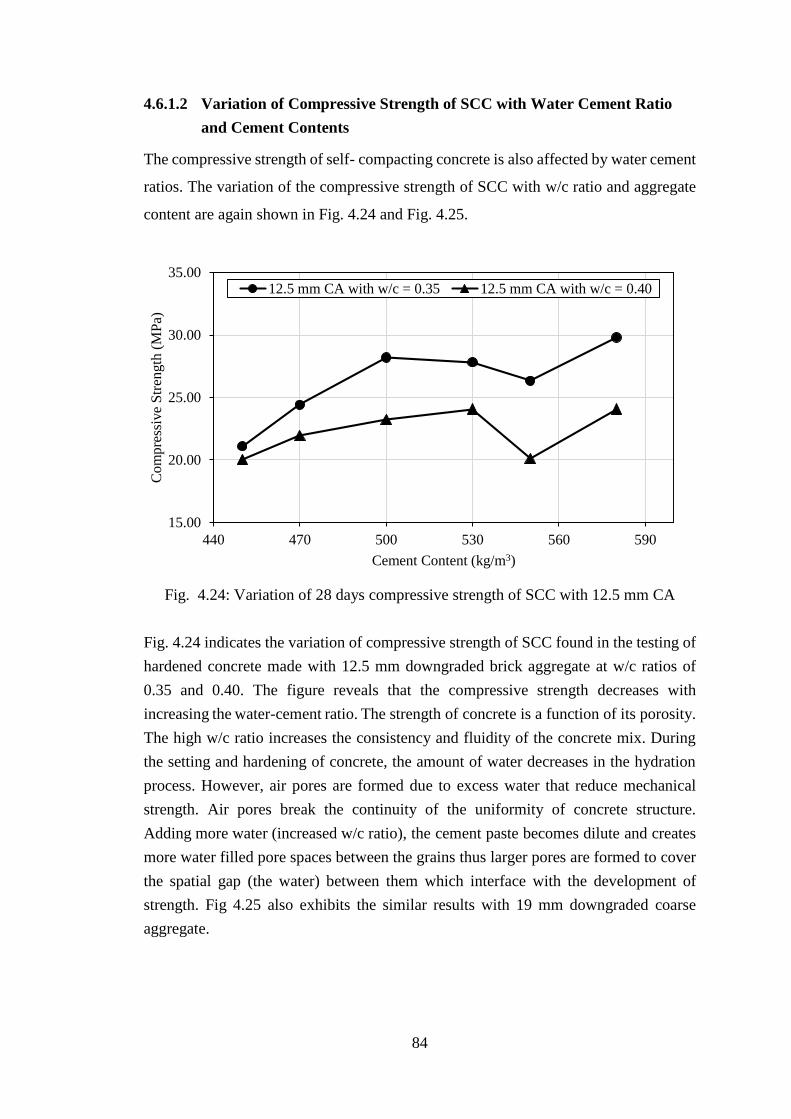
84
4.6.1.2 Variation of Compressive Strength of SCC with Water Cement Ratio
and Cement Contents
The compressive strength of self- compacting concrete is also affected by water cement
ratios. The variation of the compressive strength of SCC with w/c ratio and aggregate
content are again shown in Fig. 4.24 and Fig. 4.25.
Fig. 4.24: Variation of 28 days compressive strength of SCC with 12.5 mm CA
Fig. 4.24 indicates the variation of compressive strength of SCC found in the testing of
hardened concrete made with 12.5 mm downgraded brick aggregate at w/c ratios of
0.35 and 0.40. The figure reveals that the compressive strength decreases with
increasing the water-cement ratio. The strength of concrete is a function of its porosity.
The high w/c ratio increases the consistency and fluidity of the concrete mix. During
the setting and hardening of concrete, the amount of water decreases in the hydration
process. However, air pores are formed due to excess water that reduce mechanical
strength. Air pores break the continuity of the uniformity of concrete structure.
Adding more water (increased w/c ratio), the cement paste becomes dilute and creates
more water filled pore spaces between the grains thus larger pores are formed to cover
the spatial gap (the water) between them which interface with the development of
strength. Fig 4.25 also exhibits the similar results with 19 mm downgraded coarse
aggregate.
15.00
20.00
25.00
30.00
35.00
440 470 500 530 560 590
Com
pre
ssiv
e S
tren
gth
(M
Pa)
Cement Content (kg/m3)
12.5 mm CA with w/c = 0.35 12.5 mm CA with w/c = 0.40

85
Fig. 4.25: Variation of 28 days compressive strength of SCC with 19 mm CA
In addition, the failure plane of the cylindrical specimen was observed and shown in
Fig. 4.26. The failure plane exhibits the combined failure of concrete (internal mortar-
aggregate failure) which gives a confidence to use SCC with brick aggregate in the
concrete construction. Thus, all the mixtures had satisfactory compressive strength at
28 days.
Fig. 4.26: Failure plane of concrete specimens
15.00
20.00
25.00
30.00
440 470 500 530 560 590
Co
mp
ress
ive
Str
ength
(M
Pa)
Cement Content (kg/m3)
19 mm CA with w/c = 0.35 19 mm CA with w/c = 0.40

86
4.6.2 Splitting Tensile Strength
Splitting tensile strength (fsp) is generally expressed as a function of the square root of
compressive strength (fʹc) and it is greater than direct tensile strength and lower than
flexural Strength. Splitting tensile strength is used in the design of structural concrete
members to evaluate the shear resistance provided by concrete and to determine the
development length of reinforcement.
Fig. 4.27: Splitting tensile strength of SCC with brick aggregate
From the results of splitting tensile strength, the following are observed as shown in
Fig. 4.27. The maximum and minimum splitting tensile strength were 2.89 MPa and
1.98 MPa.
Fig. 4.28 shows the splitting tensile strength of SCC made with brick aggregate at 28
days as a function of compressive strength. It can be seen that the splitting tensile
strength of hardened SCC with brick aggregate is linearly proportional to the
compressive strength of concrete. Analysis of test results show that the compressive
strength and splitting tensile strength are related. An increase in one generally reflected
in an increase in the other and the compressive strength was around ten times of the
splitting tensile strength. A similar result of splitting tensile strength for SCC with brick
aggregate was also reported by Roy et al. (2019).
0.00
10.00
20.00
30.00
40.00
C450A
12W
35
C470A
12W
35
C500A
12W
35
C530B
12W
35
C550C
12W
35
C580D
12W
35
C450A
19W
35
C470A
19W
35
C500A
19W
35
C530B
19W
35
C550C
19W
35
C580D
19W
35
C450A
12W
40
C470A
12W
40
C500A
12W
40
C530B
12W
40
C550C
12W
40
C580D
12W
40
C450A
19W
40
C470A
19W
40
C500A
19W
40
C530B
19W
40
C550C
19W
40
C580D
19W
40
Co
mp
ress
ive
and
Sp
liti
ng T
ensi
le S
tren
gth
(M
Pa)
Concrete Mixes
Compressive Strength Splitting Tensile Strength

87
Fig. 4.28: Relationship between compressive strength and splitting tensile strength
4.6.3 Modulus of Elasticity
Generally, the modulus of elasticity is expressed as a function of the square root of
compressive strength. The values of elastic modulus results are included in Table 4.6
and the sample graphs of the stress strain diagram of hardened concrete are included in
Appendix D.
Different codes have prescribed some empirical relations to determine the modulus of
elasticity of concrete. These relationships are shown in Table 4.8. The modulus of
elasticity of normal concrete is between 18.25 to 22.76 GPa. From the Table 4.8, it is
observed that the maximum and minimum values of modulus of elasticity were 23.91
GPa and 15.09 GPa. Due to having the lower compressive capacity of brick aggregate
concrete, the value of modulus of elasticity of SCC with brick aggregate was slightly
lower than the normal concrete.
4.7 CORRELATION BETWEEN MECHANICAL PROPERTIES
The correlations are developed by the variation of compressive strength, which stands
for different mix proportion, aggregate size and water cement ratios with the splitting
tensile strength and modulus of elasticity. The results are presented in figures and
discussed categorically. The results include the correlation between compressive
strength with the splitting tensile strength and modulus of elasticity of SCC with brick
aggregate.
fsp = 0.10f'cR² = 0.7343
1.5
2
2.5
3
3.5
18.00 21.00 24.00 27.00 30.00
Sp
liti
ng
Ten
sile
Str
eng
th,
f sp
(MP
a)
Compressive Strength f'c (MPa)

88
4.7.1 Correlation between Compressive Strength and Splitting Tensile Strength
Experimental values of splitting tensile strength of SCC with brick aggregate are plotted
and shown in Fig. 4.29. The relation illustrates the splitting tensile strength
corresponding the square root of compressive strength for 28 days. From this figure it
is seen that, splitting tensile strength increases with the square root of compressive
strength. The analysis of the test values indicates the following relations [Eq. (4.7)]
with a determination coefficient of 0.65.
fsp = 0.50 √𝑓𝑐′ (4.7)
in which both units of fsp and fʹc are in MPa
Fig. 4.29: Correlation between compressive strength and splitting tensile strength of
SCC with brick aggregate
The expressions of the correlation suggested by many researchers for the prediction of
the splitting tensile strength of concrete are shown in Table 4.7. It can be found that the
results of the present study is similar to the SCC made with BA by Roy et al. (2019).
A study on the BA was conducted by Uddin et al. (2017) and suggested the relation
between compressive strength and splitting tensile strength. The authors find the
correlation coefficient between these are 0.72, 0.68, 0.75 and 0.53 with various sizes
CA. The equation proposed by this authors are presented in Table 4.7. The relation
suggested by JSCE (2002) indicates that the result of this study overestimate the
splitting tensile strength about 13 % compared to normal concrete. However, the
relation as suggested by this study represents 10.7% and 15.25% lower splitting tensile
strength compared to normal concrete according to ACI 318-11 (2011) and ACI 363R
fsp = 0.50√f'c
R² = 0.65
1.50
1.75
2.00
2.25
2.50
2.75
3.00
4.00 4.50 5.00 5.50 6.00
Spli
ting T
ensi
le S
tren
gth
, f s
p(M
Pa)
(√f'c ) MPa

89
( 1992); and 23% lower splitting tensile strength compared to Jaber et al.(2018) for
SCC with natural aggregate and 5.6% and 27.5 % lower compared with Uddin et al.,
(2017) and Mansur et al. (1999) for SCC with normal concrete with brick aggregate
respectively.
Table 4.7: Correlation between compressive strength and splitting tensile strength
proposed by researchers
Type of concrete Suggested
expressions
Units Reference
Normal Concrete fsp = 0.44√𝑓𝑐
′
fsp = 0.56√𝑓𝑐′
fsp = 0.59√𝑓𝑐′
MPa
MPa
MPa
JSCE (2002)
ACI 318-11 (2011)
ACI 363R ( 1992)
SCC with Natural
Aggregate fsp = 0.65√𝑓𝑐
′
MPa Jaber et al.(2018)
Normal Concrete
with BA fsp = 0.45 √𝑓𝑐
′
fsp = 0.53 √𝑓𝑐′
fsp = 0.69 √𝑓𝑐′
fsp = 5.7 √𝑓𝑐′
MPa
MPa
MPa
psi
Noaman et al. (2018)
Uddin et al. (2017)
Mansur et al. (1999)
Akhtaruzzaman and A.
Hasnat (1983)
SCC with BA fsp = 0.10 𝑓𝑐′
fsp = 0.50 √𝑓𝑐′
-
MPa
Roy et al. (2019)
Present Study
4.7.2 Correlation between Compressive Strength and Modulus of Elasticity
Experimental values of modulus of elasticity were plotted Fig. 4.30. The relation
between modulus of elasticity and the corresponding square root of compressive
strength for 28 days is shown in Equation (4.8). It is seen that the modulus of elasticity
increase with the increases of compressive strength as expected.
Es = 3640 √𝑓𝑐′ (4.8)
in where both Es and fʹc are in MPa
The expressions suggested by researchers for the prediction modulus of elasticity
concrete are shown in Table 4.8. The expression presented by this study indicates that
the modulus of elasticity of SCC with brick aggregate is 15.1%, 12.25% and 13.2%
higher than that of Noaman et al. (2018), Uddin et al. (2017) and Mia et al. (2015). On
the other hand, Mansur et. al. [1999] reported approximately 10% and BNBC (2006)
indicates 2.93 % lower the initial tangent modulus for SCC with normal brick aggregate
concrete. The modulus of elasticity of SCC with brick aggregate were found about 23%

90
lower than the natural aggregate concrete that predicted by following the specifications
of BNBC (2006), JSCE (2002) and ACI 318-11 (2011)
Fig. 4.30: Correlation between compressive strength and modulus of elasticity of
SCC with brick aggregate
Table 4.8: Correlation between compressive strength and modulus of elasticity
proposed by researchers
Type of
concrete
Suggested
expressions
Units Reference
Normal
Concrete
Ec = 4700√𝑓𝑐′
Ec = 4700√𝑓𝑐′
Ec = 4730√𝑓𝑐′
MPa
MPa
MPa
BNBC (2006)
JSCE (2002)
ACI 318-11 (2011)
Normal
Concrete
with BA
Ec =3087√𝑓𝑐′
Ec =3194√𝑓𝑐′
Ec =3750√𝑓𝑐′
Ec =3215√𝑓𝑐′
Ec = 4050 √𝑓𝑐′
Ec = 37500 √𝑓𝑐′
Ec = 40000 √𝑓𝑐′
MPa
MPa
MPa
MPa
MPa
psi
psi
Noaman et al. (2018)
Uddin et al. (2017)
BNBC (2006)
Mia et al. (2015)
Mansur et al. (1999)
Rashid et al. (2008)
Akhtaruzzaman and Hasnat(1983)
SCC
with BA
Ec = 3640 √𝑓𝑐′ MPa Present Study
EC = 3,640 √f'c
10,000
15,000
20,000
25,000
4.00 4.50 5.00 5.50 6.00
Mo
du
lus
of
Ela
stic
ity,
EC
(MP
a)
√f'c (MPa)

91
4.8 SUMMARY
This chapter summarized all the experimental test results including different physical
and chemical properties of materials. In addition to that, fresh properties of SCC mixes
with brick aggregate are described and the correlation between these properties have
been demonstrated. The mechanical properties (compressive strength, splitting tensile
strength and modulus of elasticity) and their correlations are described and compared
with the normal concrete made with brick aggregate. Comparative study with previous
research findings also has been carried out.
It is observed that the properties of SCC related to workability requirements for
successful placement of concrete exhibits excellent deformation ability and proper
stability to flow under its own weight without segregation and blockage. Also the
properties of the hardened concrete exhibit satisfactory performance in the laboratory
results. Therefore, SCC can be used as a new construction material with locally
available brick aggregate as coarse aggregate.

92
CHAPTER 5 CHAPTER V …...…
C CONCLUSIONS AND RECOMMENDATIONS
5.1 INTRODUCTION
This thesis work has examined the fresh and mechanical properties of self-compacting
concrete with crushed brick as coarse aggregate. The overall findings reveal that SCC
has met all the requirements as a new construction material in the laboratory with
locally available brick aggregate. The main factors controlling the fresh and mechanical
properties of SCC have been investigated. This chapter provides overall conclusions of
the research findings, contributions of the present study and proposes several
recommendations for future study.
5.2 CONCLUSIONS
The research work concentrated on fresh and mechanical properties of self-compacting
concrete with crushed brick as coarse aggregate. From the test results and analysis, the
following conclusions can be drawn.
5.2.1 Fresh Properties of SCC with Brick Aggregate
(i) The SCC mixes with brick aggregate were developed successfully based
on the trial mixes using different w/c ratios, aggregate contents, and
superplasticizer for both 12.5 mm and 19 mm downgraded brick
aggregates.
(ii) Slump flow and J-ring flow increased with increasing w/c ratio and
decreased with increasing aggregate content.
(iii) Slump flow, J-ring flow and T50 flow time indicated better results for
12.5 mm downgraded brick aggregate over 19 mm downgraded brick
aggregate in all cases.
(iv) Results of the Slump flow, T50 flow time and V-funnel flow time were
found to be satisfactory according to EFNARC and indicated good
filling ability of SCC with brick aggregate.
(v) J-ring flow and L-box test results indicates that SCC mixes with BA
possessed good passing ability. Thus, SCC with brick aggregate can be
used in the congested area of the reinforcement.
(vi) L-box test on the SCC mixtures with brick aggregate indicated that the
mixtures possessed good passing ability. The values of blocking ratio
for all mixes indicates very good passing ability. Thus SCC with brick

93
aggregate can be used where the flow of concrete needed through the
congested reinforcement.
(vii) There was no visible blocking and segregation in the L-box, J-ring and
V-funnel at T5 minutes tests.
(viii) There are good correlations observed between slump flow, J-ring flow
and T50 flow time.
(ix) All parameters of the fresh properties of SCC with brick aggregate
indicate very good passing ability and filling ability according to
standard guideline of EFNARC.
From above discussion it may be concluded that brick aggregate can be an alternate
source of coarse aggregate for the production of SCC to meet the present demand of
construction facilities.
5.2.2 Mechanical Properties of SCC with Brick Aggregate
(i) Compressive strength of SCC with brick aggregate increased with lower
sizes of coarse aggregate.
(ii) Higher water cement ratio possessed lower compressive strength of
hardened SCC.
(iii) Compressive strength of SCC with brick aggregate decreased with higher
aggregate content.
(iv) The maximum and minimum compressive strength of hardened SCC with
brick aggregate have satisfied the required strength according to BNBC
for earthquake resistant structure.
(v) Splitting tensile strength of hardened SCC with brick aggregate is directly
proportional to the compressive strength of hardened concrete.
(vi) Compressive strength and splitting tensile strength are related, and
compressive strength was about ten times of the splitting tensile strength
for SCC with brick aggregate. Eq. 4.7 can be used to determine the
splitting tensile strength of SCC with brick aggregate.
(vii) Modulus of elasticity for SCC with brick aggregate is proportional to the
compressive strength of hardened concrete.
(viii) It was found that the values of modulus of elasticity for SCC with brick
aggregate were about 2.93% lower than that of BNBC (2006) for normal
brick aggregate concrete and 23% lower than that of ACI Code (2011)
expression. Eq. 4.8 may be used to predict the modulus of elasticity of
SCC with brick aggregate.

94
Therefore, the properties of the hardened state of SCC with brick aggregate gives a
confidence to use SCC with brick aggregate in the concrete construction in Bangladesh.
5.3 CONTRIBUTION OF THE STUDY
The present study has contributed to the present state of knowledge of the fresh and
mechanical properties of SCC with brick aggregate. The main contributions of this
research are as follows:
(i) Demonstration of the successful production of SCC with brick
aggregate as a new construction material.
(ii) An approach for the proportioning of SCC mixes with brick aggregate
to find the necessary fresh properties.
(iii) Determination of mechanical properties of hardened SCC with brick
aggregate which will be helpful for the structural use of concrete.
(iv) Investigation and explanation of the fresh and mechanical properties
which can be used to predict the behavior of SCC with brick aggregate.
(v) Enhancement of new research area and idea about the properties of
SCC with brick aggregate.
5.4 RECOMMENDATIONS FOR FUTURE STUDY
From the results obtained and the knowledge gained about SCC with brick aggregate,
the following aspects that were not investigated in the present study can be
recommended for future works:
1) It would be recommended to have more trial mixes with water/powder
ratios in the range of 0.45 to 0.50, both for 12.5 mm and 19 mm
downgraded sizes of aggregate without a viscosity modifying agent.
2) There are needed more trial mixes with various coarse and fine
aggregates contents for a fixed cement content in case of water cement
ratios of 0.35, 0.40, 0.45 and 0.50 for both 12.5 mm and 19 mm
downgraded brick aggregates.
3) It would be interesting to use different superplasticizers with different
dosages.
4) Different additives can be used in the preparation of SCC with brick
aggregates to increase the paste volume in concrete.
5) Supplementary cementitious materials can be added as a partial
replacement of cement and the behavior of SCC can be observed.
6) Recycling brick aggregates can be used as partial replacement of virgin
brick aggregates in the preparation of SCC.
95
7) Microstructures of the SCC with brick aggregate can be analyzed based
on their scanning electron micrographs (SEMs).
8) High strength SCC with brick aggregate can be produced with changing
the proportion of the materials.
9) Flexural strength and Poisson’s ratio of SCC brick aggregate can be
determined for the hardened concrete.
10) It would be advisable to evaluate the durability properties (water
absorption, porosity, sulfate and chloride resistance) of SCC with brick
aggregates
11) It would be interesting to establish design charts of the mix design
method for proportioning SCC mixes with brick aggregate.
12) The role of composition parameters (coarse aggregate volume, paste to
solids and water to binder ratios of SCC mixes with different ratios of
fibers on the properties of SCC with brick aggregate can be studied.
13) The cement, fly ash, HRWR, and air entrainment could be changed in
different mixes to compare all of the results.

96
REFERENCES
ACI 237R-07 (2007). Self-Consolidating Concrete. American Concrete Institute,
Farmington Hills, Mich.
ACI Committee 211 (2002). Standard Practice for Selecting Proportions for Normal,
Heavyweight, and Mass Concrete, American Concrete Institute, Farmington Hills,
Mich.
ACI Committee 318 (2011). Building code requirements for structural concrete (ACI
318-11) and commentary, American Concrete Institute, Farmington Hills, Mich.
ACI Committee 363R (1992). State-of-the-Art Report on High-Strength Concrete (ACI
363R-92). American Concrete Institute, Farmington Hills, Mich.
Akhtaruzzaman, A.A., A. Hasnat (1983). Properties of Concrete Using Crushed Brick
as Aggregate. Concr. Int. 5, 58–63.
Andrews, C. (2009). Effects of lightweight aggregates in self-consolidating concrete,
MSc Engineering Thesis, The Department of Civil and Environmental
Engineering, The Universityof Alabama in Huntsville.
Ardalan, R.B., Emamzadeh, Z.N., Rasekh, H., Joshaghani, A., Samali, B. (2020).
Physical and mechanical properties of polymer modified self-compacting concrete
(SCC) using natural and recycled aggregates. J. Sustain. Cem. Mater. 9, 1–16.
ASTM C109 (2020). Standard Test Method for Compressive Strength of Hydraulic
Cement Mortars (Using 2-in. or 50-mm) Cube Specimens. ASTM International,
West Conshohocken, PA, USA.
ASTM C127 (2015). Standard Test Method for Density, Relative Density (Specific
Gravity), and Absorption of Coarse Aggregate. ASTM International, West
Conshohocken, PA, USA.
ASTM C128 (2015). Standard Test Method for Density, Relative Density (Specific
Gravity), and Absorption of Fine Aggregate. ASTM International, West
Conshohocken, PA, USA.
ASTM C136 (2019). Standard Test Method for Sieve Analysis of Fine and Coarse
Aggregates. ASTM International, West Conshohocken, PA, USA.
ASTM C138 (2001). Standard Test Method for Density (Unit Weight), Yield, and Air
Content (Gravimetric) of Concrete. ASTM International, West Conshohocken,
PA, USA.
ASTM C150 (2020). Standard Specification for Portland Cement. ASTM International,
West Conshohocken, PA, USA.
97
ASTM C187 (2016). Standard Test Method for Normal Consistency of Hydraulic
Cement. ASTM International, West Conshohocken, PA, USA.
ASTM C191 (2019). Standard Test Method for Time of Setting of Hydraulic Cement
by Vicat Needle. ASTM International, West Conshohocken, PA, USA.
ASTM C29 (2017). Standard Method of Test for Bulk Density (Unit Weight) and Voids
in Aggregate. ASTM International, West Conshohocken, PA, USA.
ASTM C33 (2018). Standard Specification for Concrete Aggregates. ASTM
International, West Conshohocken, PA, USA.
ASTM C39 (2002). Standard Test Method for Compressive Strength of Cylindrical
Concrete Specimens. ASTM International, West Conshohocken, PA, USA.
ASTM C469-02 (2002). Standard Test Method for Static Modulus of Elasticity and
Poisson’s Ratio of Concrete in Compression. ASTM International, West
Conshohocken, PA, USA.
ASTM C494 (2019). Standard Specification for Chemical Admixtures for Concrete.
ASTM International, West Conshohocken, PA, USA.
ASTM C496 (2004). Standard Test Method for Splitting Tensile Strength of Cylindrical
Concrete Specimens. ASTM International, West Conshohocken, PA, USA.
ASTM D4791 (2010). Standard Test Method for Flat Particles, Elongated Particles, or
Flat and Elongated Particles in Coarse Aggregate. ASTM International, West
Conshohocken, PA, USA.
Bennenk, W. (2002). SCC in the Daily Precast Concrete Practice. Betonw. Fert. 34.
Billberg, P. (1999). Self-Compacting Concrete for Civil Engineering Structures the
Swedish Experience.
BNBC (2006). Bangladesh National Building Code, Part - 06 (08). 1–27.
Bonen, D., Shah, S.P. (2005). Fresh and hardened properties of self-consolidating
concrete. Proc. Struct. Engng Mater. 7, 14–26.
Building Materials in Civil Engineering, (2011) . In: Cement. Elsevier BV, pp. 46–80.
Deeb, R. and Karihaloo, B.L. (2013). Mix proportioning of self-compacting normal and
high-strength concretes. Mag. Concr. Res. 65, 546–556.
Dey, S.K., Bayzid, I.K.M., Joy, S.I., Uddin, M.J., Hasnat, A. (2016). Effect of Recycled
Brick Aggregate on Self-Compacting Concrete: Rheological and mechanical
Properties. In: BUET-ANWAR ISPAT 1st Bangladesh Civil Engineering
SUMMIT 2016 BUET, Dhaka, Bangladesh. 1–7.

98
EFNARC (2002). Specification and Guidelines for Self-Compacting Concrete
February, 1–32.
EFNARC (2005). The European Guidelines for Self-Compacting Concrete
Specification, Production and Use, May, 1–63.
EN 197-1 (2011). General rules and rules for buildings, Part 1-2; General rules-
Structural file design. In: Eurocode 2:Design of Concrete Structures Part 1 –1.
Esmaeilkhanian, B., Khayat, K.H., Yahia, A., Feys, D. (2014). Effects of mix design
parameters and rheological properties on dynamic stability of self-consolidating
concrete. Cem. Concr. Compos. 54, 21–28.
Felekoglu, B., Turkel, S., Baradan, B. (2007). Effect of water / cement ratio on the fresh
and hardened properties of self-compacting concrete. Build. Environ. 42, 1795–
1802.
Ferraris, C.F. (1999). Measurement of the Rheological Properties of High Performance
Concrete: State of the Art Report. J. Res. Natl. Inst. Stand. Technol. 104, 461–467.
Gambhir, M.L. (2006). Concrete Technology, 3rd Editio. ed. Tata Mcgraw-Hill
Publishing, New Delhi.
Grdic, Z., Despotovic, I., Toplicic-Curcic, G. (2008). Properties of self-compacting
concrete with different types of additives. Facta Univ. - Ser. Archit. Civ. Eng. 6,
173–177.
Han, J., Fang, H. and Wang, K. (2014). Design and control shrinkage behavior of high-
strength self-consolidating concrete using shrinkage-reducing admixture and
superabsorbent polymer. J. Sustain. Cem. Mater. 3, 182–190.
Hayakawa, M., Matsuoka, Y., Shindoh, T. (1993). Development and Application of
Super Workable Concrete. In: Proceedings, RILEM International Workshop on
Special Concretes: Workability and Mixing. University of Paisley, 8.
Hayakawa, M., Matsuoka, Y., Yokota, K. (1995). Application of Superworkable
Concrete in the Construction of 70-Story Building in Japan. In: V. M. Malhotra,
E. (Ed.), Proceedings of the Second CANMET/ACI International Symposium, SP-
154. American Concrete Institute, Farmington Hills, Mich, 381–397.
Hu, C., de Larrard, F. (1996). The rheology of fresh high-performance concrete. Cem.
Concr. Res. 26, 283–294.
Jaber, A., Gorgis, I., Hassan, M. (2018). Relationship between splitting tensile and
compressive strengths for self-compacting concrete containing nano- and micro
silica. MATEC Web Conf. 162, 1–8.
99
Jacobs, F., and Hunkeler, F. (2001). SCC for the Rehabilitation of a Tunnel in
Zurich/Switzerland. In: And, K.O., M. Ouchi, E. (Eds.), Proceedings of the Second
International Symposium on SCC. Tokyo, Japan, 707–714.
Japan Society of Civil Engineers (JSCE) (2002). “Standard specifications for concrete
structures-2002. Materials and Construction.
Japan Society of Civil Engineers (JSCE) (2007). Standard Specification For Concrete
Structures - 2007. Materials and Construction.
Kandemir, A., Türkel, S. (2010). Fresh and Hardened Properties of SCC Made with
Different Aggregate and Mineral Admixtures. J. Mater. Civ. Eng. 22, 1025–1032.
Kannan, V., Ganesan, K. (2014). Chloride and chemical resistance of self compacting
concrete containing rice husk ash and metakaolin. Constr. Build. Mater. 51, 225–
234.
Kasim, M., Amir, A., Bharti, S. (2017). Effect of Size of Aggregate on Self Compacting
Concrete of M70 Grade. IOSR J. Mech. Civ. Eng. 14, 82–87.
Kato, k., Shin, H. Y., Kunishima, M. (1993). A comparative study on the
constructability of self-placable concrete. Concr. 2000, 881–890.
Khaleel, O.R., Al-Mishhadani, S.A., Razak, H.A. (2011). The Effect of Coarse
Aggregate on Fresh and Hardened Properties of Self-Compacting Concrete (SCC).
Procedia Eng. 14, 805–813.
Khan, S., Dhobale, S.B. (2018). Effect of Aggregate Flakiness on the Compressive
Strength and Workability of Concrete A REVIEW. Int. Res. J. Eng. Technol. 5,
2865–2867.
Khayat, K. H., Morin, R. (2002). Performance of Self- Consolidating Concrete Used to
Repair Parapet Wall in Montreal. In: ACBM (Ed.), Proceedings of the First North
American Conference on the Design and Use of SCC. Chicago, Ill., 12–13.
Khayat, K.H. (2000). Optimization and performance of air-entrained, self-
consolidating concrete. ACI Struct. J. 97, 526–535.
Khayat, K.H. (2015). Workability , Testing , and Performance of Self-Consolidating.
ACI Mater. J. 96.
Koehler, E.P., Fowler, D.W. (2007). Inspection manual for self cosolidating concrete
in precast members.
Li, F., Wei, J., Wang, J., Pei, X., Wang, G., Ma, L., Yu, Q. (2012). New method of mix
design for self-compacting concrete based on material characteristics. Procedia
Eng. 27, 214–222.
100
Lotfy, A. (2006). Lightweight Self-consolidating Concrete : Statistical Modelling ,
Mixture Design And Performance Evaluation. PhD Thesis, Department of Civil
Engineering, Ryerson University.
Madandoust, R., Mousavi, S.Y. (2012). Fresh and hardened properties of self-
compacting concrete containing metakaolin. Constr. Build. Mater. 35, 752–760.
Maghsoudi, A.A., Mohamadpour, S., Maghsoudi, M. (2011). Mix design and
mechanical properties of self compacting light weight concrete. Int. J. Civ. Eng.
9, 230–236.
Mahoutian, M., Shekarchi, M. (2015). Effect of Inert and Pozzolanic Materials on Flow
and Mechanical Properties of Self-Compacting Concrete. J. Mater. 2015, 1–11.
Mansur, M.A., Wee, T.H., L. S. Cheran (1999). Crushed Bricks as Coarse Aggregate
for Concrete. ACI Mater. J. 96, 478–484.
McBride, J.R. (2003). The Effect of Coarse Aggregate Content and Gradation on Self-
Consolidating Concrete and Passing Ability, MSc Engineering Thesis, The
Department of Civil and Architectural Engineering,The University of Wyoming.
Mia, M.S., Miah, M.K., Hasan, M. (2015). Relationship between Modulus of Elasticity
and Strength of Brick Aggregate Concrete. In: International Conference on Recent
Innovation in Civil Engineering for Sustainable Development (IICSD-2015),
Department of Civil Engineering DUET - Gazipur, Bangladesh. 151–156.
Mohamad, N., Aziz, A., Samad, A., Nadjua, A., Goh, W.I., Anas, A. (2015). Fresh State
and Mechanical Properties of Self Compacting Concrete Incorporating POFA. J.
Teknol. 72, 1–6.
Mohamad, N., Zulaika, M.S., Samad, A.A.A., Goh, W.I., Hadipramana, J., Wirdawati,
A. (2016). Fresh state and mechanical properties of self compacting concrete
incorporating high volume fly ash. MATEC Web Conf. 47, 1–7.
Neville, A.M. (1997). Properties of Concrete, 4th ed. ed. John Wiley and Sons Inc.,
New York.
Nischay T G, S Vijaya, B Shiva Kumaraswamy (2015). A Study on the Properties of
Self Compacting Concrete using Recycled Aggregate in Fresh and Hardened
State. Int. J. Eng. Res. V4, 822–826.
Noaman, M.A., Islam, M.N., Islam, M.R., Karim, M.R. (2018). Mechanical properties
of brick aggregate concrete containing rice husk ash as a partial replacement of
cement. J. Mater. Civ. Eng. 30, 1–10.
Okamura, H. (1986). Waiting for innovation in concrete materials, Cement and
Concrete. Cem. Concr. Japan. 475.

101
Okamura, H., Ouchi, M. (2003). Self-Compacting Concrete. J. Adv. Concr. Technol.
1, 5–15.
Okamura, H., Ozawa, K. (1994). Self - compactable concrete for bridge construction.
Int. Work. Civ. infrastructural Syst. Taipei 1994.
Okamura, H., Ozawa, K. (1995). Mix Design of Self-Compecting Concrete. Concr.
Libr. JSCE 25, 107–120.
Olafusi, O.S., Adewuyi, A.P., Otunla, A.I., Babalola, A.O. (2015). Evaluation of Fresh
and Hardened Properties of Self-Compacting Concrete. J. Civ. Eng. 1–7.
Olowofoyeku, A.M., Ofuyatan, O.M., Oluwafemi, J., David, O. (2019). Effect of
various types and sizes of aggregate on self-compacting concrete. In: IOP
Conference Series: Materials Science and Engineering.
Ouchi, M. (2001). Current Condition of Self-Compacting Concrete in Japan. In:
Proceedings of the Second International Symposium on SCC. Tokyo, japan, pp.
63–68.
Ozawa, K., Maekawa, K., Kunishima, M., Okamura, H. (1989). Development of high
performance concrete based on the durability design of concrete structures.
Proceeding Second East - Asia Pacific Conf. Struct. Eng. Constr. (EASEC - 2) 1,
445–450.
Ozawa, K., Maekawa, K., Okamura, H. (1992). Development of High Performance
Concrete. J. Fac. Eng. Univ. Tokyo Volume-XLI, 381–432.
Panda, K.C., Bal, P.K. (2013). Properties of self compacting concrete using recycled
coarse aggregate. Procedia Eng. 51, 159–164.
Pandurangan, K., Ramakrishna, G., Kothandaraman, S. (2012). Effect of Coarse
Aggregate Size And Shape on the Strength and Flow Characteristics of Self-
compacting Concrete. ICI J. 1–7.
Persson, B. (1999). Creep, Shrinkage and Elastic Modulus of Self-Compacting
Concrete. In: RILEM Proceedings.
Pradhan, S.S., Panda, K.C. (2017). Assessment of fresh and hardened properties of
concrete using supplementary cementitious materials. Mater. Today Proc. 4,
9837–9841.
Prayuda, H., Saleh, F., Maulana, T.I., Monika, F. (2018). Fresh and mechanical
properties of self-compacting concrete with coarse aggregate replacement using
Waste of Oil Palm Shell. IOP Conf. Ser. Mater. Sci. Eng. 352, 1–7.

102
Rashid, M.A., Hossain, T., M. A. Islam (2008). Higher Strength Concrete Using
Crushed Brick as Coarse Aggregate. indian Concr. J. 82, 18–23.
Rashid, M.A., Salam, M.A., Shill, S.K., Hasan, M.K.(2012). Effect of replacing natural
coarse aggregate by brick aggregate on the properties of concrete. DUET J. 1, 17–
22.
RILEM (2000). State-of-the-Art Report of RILEM Technical Committee 174-SCC,
Self-Compacting Concrete.
Roy, C., Mohammed, T.U., Hasan, R., Ullah, T. (2019). Experimental Analysis on Self-
Compacting Concrete (SCC) Made with Locally Available Materials
Incorporating Different w/c Ratio. In: Proceedings of International Conference on
Planning, Architecture and Civil Engineering, 07-09 February. Rajshahi
University of Engineering & Technology, Rajshahi, Bangladesh, 1–6.
Sadek, D.M., El-Attar, M.M., Ali, H.A. (2016). Reusing of marble and granite powders
in self-compacting concrete for sustainable development. J. Clean. Prod. 121, 19–
32.
Safiuddin, M., Salam, M.A., Jumaat, M.Z. (2011a). Effects of recycled concrete
aggregate on the fresh properties of self-consolidating concrete. MATEC Web
Conf. XI, 1023–1041.
Safiuddin, M., Salam, M.A., Jumaat, M.Z. (2011b). Correlations between fresh
properties of self-consolidating concrete including palm oil fuel ash. Adv. Mater.
Res. 250–253, 409–416.
Safiuddin, M., Salam, M.A., Jumaat, M.Z. (2012). Correlations between different
hardened properties of high-strength self-consolidating concrete including palm
oil fuel ash. Appl. Mech. Mater. 117–119, 1215–1222.
Safiuddin, M., Salam, M.A., Jumaat, M.Z. (2014). Key fresh properties of self-
consolidating high-strength POFA concrete. J. Mater. Civ. Eng. 26, 134–142.
Salam, M.A., Safiuddin, M., Jumaat, M.Z. (2013). Microstructure of self-consolidating
high strength concrete incorporating palm oil fuel Ash. Phys. Rev. Res. Int. 3,
674–687.
Santamaría, A., Ortega-López, V., Skaf, M., Chica, J.A., Manso, J.M. (2020). The study
of properties and behavior of self compacting concrete containing Electric Arc
Furnace Slag (EAFS) as aggregate. Ain Shams Eng. J. 11, 231–243.
Sharma, R., Khan, R.A. (2017). Durability assessment of self compacting concrete
incorporating copper slag as fine aggregates. Constr. Build. Mater. 155, 617–629.
103
Shi, C., Wu, Z., Lv, K. and Wu, L. (2015). A review on mixture design methods for
self-compacting concrete. Constr. Build. Mater. 84, 387–398.
Siddique, R., Aggarwal, P. and Aggarwal, Y. (2012). Mechanical and durability
properties of self- compacting concrete containing fly ash and bottom ash. Mater.
J. Sustain. Cem. 1, 67–82.
Skarendahl (2001). Market Acceptance of Self- Compacting Concrete, the Swedish
Experience. In: Proceedings of the Second International Symposium on SCC.
Tokyo, Japan, 1–12.
Sua-iam, G., Makul., N. (2015). Rheological and mechanical properties of cement-fly
ash self-consolidating concrete incorporating high volumes of alumina-based
material as fine aggregate. Constr. Build. Mater. 95.
Tanaka, K., Sato, K., Watanabe, S., Arima, I., Suenaga, K. (1993). Development and
Utilization of High Performance Concrete for the Construction of the Akashi
Kaikyo Bridge. Am. Concr. Inst. 25–51.
Uddin, M.T., Mahmood, A.H., Kamal, M.R.I., Yashin, S.M., Zihan, Z.U.A. (2017).
Effects of maximum size of brick aggregate on properties of concrete. Constr.
Build. Mater. 134, 713–726.
Uomoto, T., Ozawa, K. (1999). Recommendation for Self-Compacting Concrete. JSCE
1–19.
Uygunoğlu, T., Topçu, I.B., Çelik, A.G. (2014). Use of waste marble and recycled
aggregates in self-compacting concrete for environmental sustainability. J. Clean.
Prod. 84, 694–700.
Uysal, M. (2012). The influence of coarse aggregate type on mechanical properties of
fly ash additive self-compacting concrete. Constr. Build. Mater. 37, 533–540.
Wang, X., Wang, K., Taylor, P., Morcous, G. (2014). Assessing particle packing based
self-consolidating concrete mix design method. Constr. Build. Mater. 70, 439-452.
Yen, T., Tang, C., Chang, C., Chen, K. (1999). Flow behaviour of high strength high-
performance concrete. Cem. Concr. Compos. 21, 413–424.
Yu, J., Cai, X., Ge, Y., Yu, Y. (2015). Effect of Elongated and Flaky Particles Content
on the Durability of Concrete. J. ASCE 493–497.
Zain, F.M., Islam, M.N., Basri, I.H. (2005). An expert system for mix design of high
performance concrete. Adv. Eng. Softw. 36, 325–337.
Zhao, H., Sun, W., Wu, X., Gao, B. (2012). The effect of coarse aggregate gradation
on the properties of self-compacting concrete. J. Mater. Des. 40, 109–116.

104
APPENDICES
APPENDIX-A
PHOTOGRAPHS OF THE INGREDIENTS
Fig. A1: Coarse Aggregate
Fig. A2: Fine Aggregate and Admixture
Fig. A3: Mixing Machine
12.5 mm CA 19 mm CA

105
Fig. A4: Slump Flow
Fig. A4: J-ring Flow and V-funnel Flow

106
Fig. A5: L-box Test
Fig. A6: Hardened Concrete

107
Fig. A7: Surface of the Hardened Concrete
Fig. A8: Splitting Tensile Strength

108
Fig. A10: Failure Surface of the Hardened Concrete after Splitting Tensile Strength
Test

109
Fig. A11: Compressive Strength and modulus of Elasticity Test
Fig. A10: Failure Surface of the Hardened Concrete after Compressive Strength Test

110
APPENDIX-B
ANALYSIS AND RESULTS OF THE PROPERTIES OF THE AGGREGATES
Table B1: FM test of 12.5 mm Downgraded Coarse Aggregate
Sieve
Size
Weight
Retained
(gm)
Percent
Retained
Cumulative
Percent
Retained
% Finer FM
3" 0.00 0.00 0.00 100.00
6.56
1.5" 0.00 0.00 0.00 100.00
3/4" 218.00 4.36 4.36 95.64
3/8" 2370.00 47.40 51.76 48.24
#4 2386.00 47.72 99.48 0.52
#8 26.00 0.52 100.00 0.00
#16 0.00 0.00 100.00 0.00
#30 0.00 0.00 100.00 0.00
#50 0.00 0.00 100.00 0.00
#100 0.00 0.00 100.00 0.00
Pan 0.00 - - -
Sum 5000.00 - 655.60
-
Table B2: ASTM Limits for12.5 mm Downgraded Coarse Aggregate
Sieve Size
(mm)
Percent Finer
12.5 mm Downgraded
CA
ASTM Lower
Limit
ASTM Upper
Limit
76 100 100 100
37.5 100 100 100
20 96 100 100
9.5 48 40 70
4.75 1 0 15
2.36 0 0 5

111
Table B3: Water Absorption Test of Coarse Aggregate (12.5 mm downgrade)
Sample
Identification
Mark
Weight in Oven dry
Condition
Weight in SSD
condition
Water Absorption
Capacity
(gm) (gm) (%)
CA-12.5 4173 5000 19.8
Table B4: Field Moisture Test of Coarse Aggregate (12.5 mm downgrade)
Sample
Identification
Mark
Weight in Oven dry
Condition
Weight in Field
condition
Water Absorption
Capacity
(kg) (kg) (%)
CA-12.5 18.62 20.00 7.42
Table B5: Unit Weight Test of Coarse Aggregate (12.5 mm downgrade)
Sample
Identification
Mark
Weight of Mold +
Coarse aggregates
Weight of
Mold
Volume of
Mold
Unit weight
(kg/m3)
(kg) (kg) (m3) (%)
CA-12.5 8.27 6.75 0.001647 923
Table B6: Specific Gravity Test of Coarse Aggregate (12.5 mm downgrade)
Oven dry
weight
Saturated
surface dry
weight in air
Weight of
aggregate in
water
Bulk
specific
gravity
(Dry)
Bulk
specific
gravity
(SSD) (gm) (gm) (gm)
5000 5985 3096 1.73 2.07
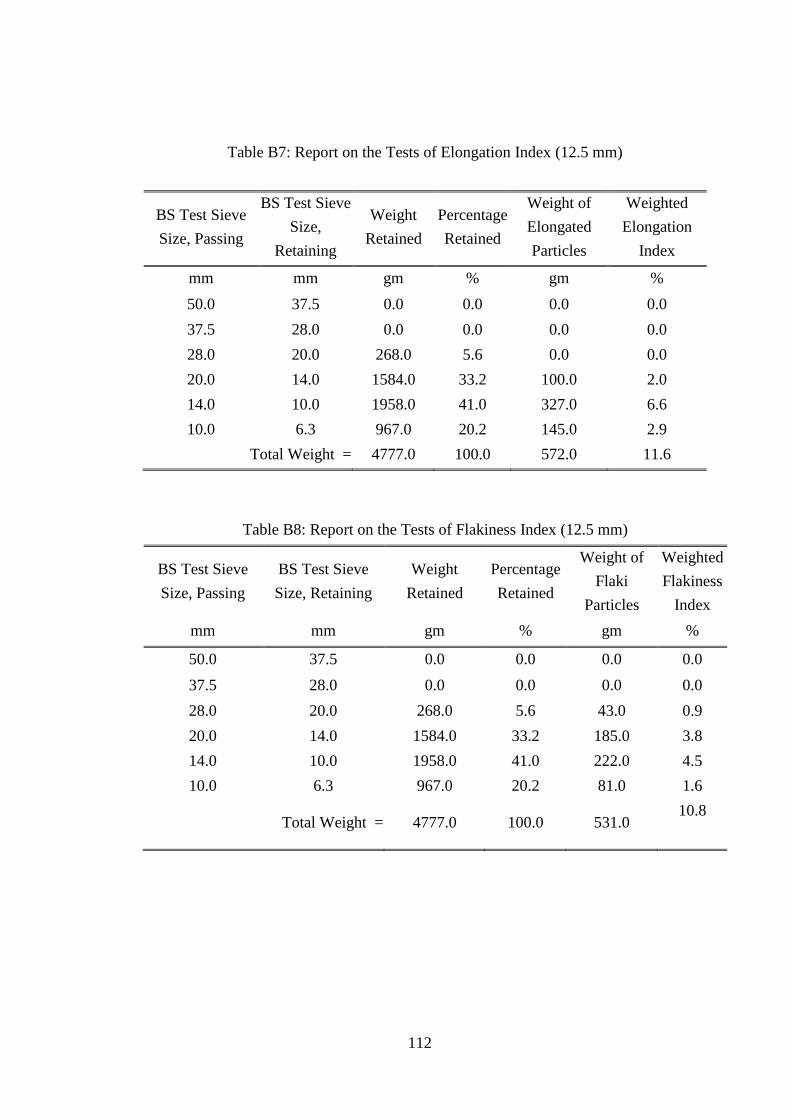
112
Table B7: Report on the Tests of Elongation Index (12.5 mm)
BS Test Sieve
Size, Passing
BS Test Sieve
Size,
Retaining
Weight
Retained
Percentage
Retained
Weight of
Elongated
Particles
Weighted
Elongation
Index
mm mm gm % gm %
50.0 37.5 0.0 0.0 0.0 0.0
37.5 28.0 0.0 0.0 0.0 0.0
28.0 20.0 268.0 5.6 0.0 0.0
20.0 14.0 1584.0 33.2 100.0 2.0
14.0 10.0 1958.0 41.0 327.0 6.6
10.0 6.3 967.0 20.2 145.0 2.9
Total Weight = 4777.0 100.0 572.0 11.6
Table B8: Report on the Tests of Flakiness Index (12.5 mm)
BS Test Sieve
Size, Passing
BS Test Sieve
Size, Retaining
Weight
Retained
Percentage
Retained
Weight of
Flaki
Particles
Weighted
Flakiness
Index
mm mm gm % gm %
50.0 37.5 0.0 0.0 0.0 0.0
37.5 28.0 0.0 0.0 0.0 0.0
28.0 20.0 268.0 5.6 43.0 0.9
20.0 14.0 1584.0 33.2 185.0 3.8
14.0 10.0 1958.0 41.0 222.0 4.5
10.0 6.3 967.0 20.2 81.0 1.6
Total Weight = 4777.0 100.0 531.0 10.8
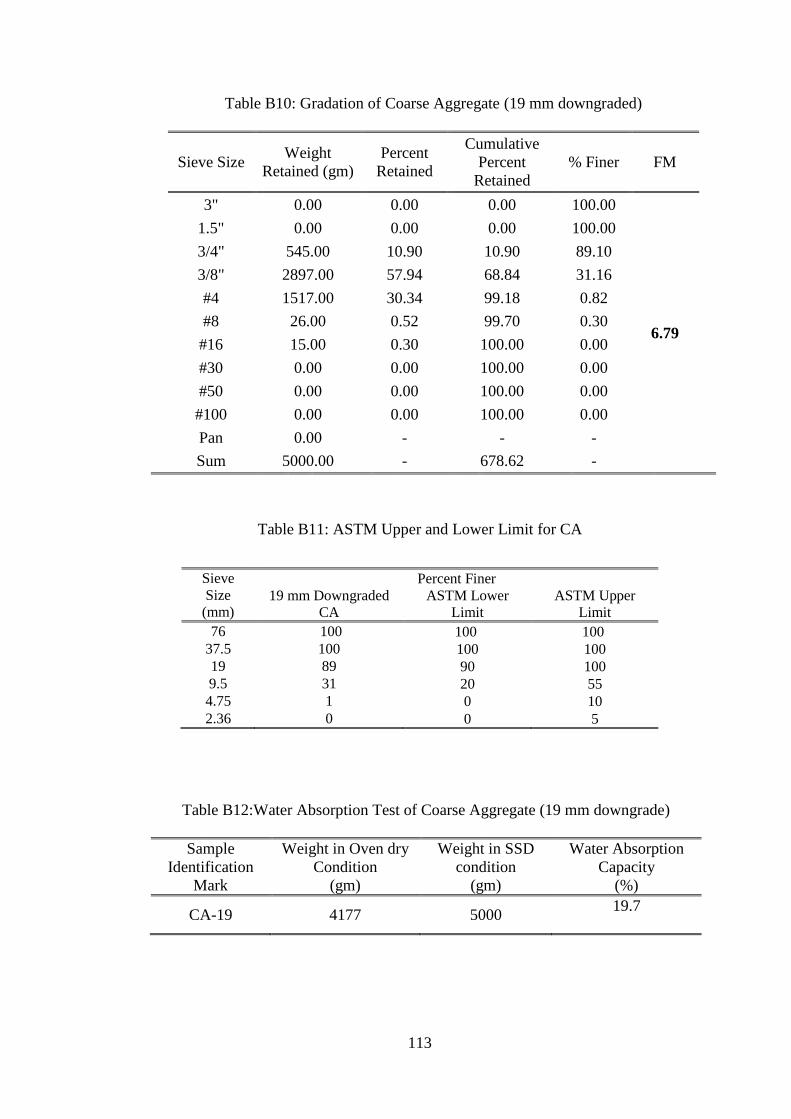
113
Table B10: Gradation of Coarse Aggregate (19 mm downgraded)
Sieve Size Weight
Retained (gm)
Percent
Retained
Cumulative
Percent
Retained
% Finer FM
3" 0.00 0.00 0.00 100.00
6.79
1.5" 0.00 0.00 0.00 100.00
3/4" 545.00 10.90 10.90 89.10
3/8" 2897.00 57.94 68.84 31.16
#4 1517.00 30.34 99.18 0.82
#8 26.00 0.52 99.70 0.30
#16 15.00 0.30 100.00 0.00
#30 0.00 0.00 100.00 0.00
#50 0.00 0.00 100.00 0.00
#100 0.00 0.00 100.00 0.00
Pan 0.00 - - -
Sum 5000.00 - 678.62 -
Table B11: ASTM Upper and Lower Limit for CA
Sieve
Size
(mm)
Percent Finer
19 mm Downgraded
CA
ASTM Lower
Limit
ASTM Upper
Limit
76 100 100 100
37.5 100 100 100
19 89 90 100
9.5 31 20 55
4.75 1 0 10
2.36 0 0 5
Table B12:Water Absorption Test of Coarse Aggregate (19 mm downgrade)
Sample
Identification
Mark
Weight in Oven dry
Condition
Weight in SSD
condition
Water Absorption
Capacity
(gm) (gm) (%)
CA-19 4177 5000 19.7
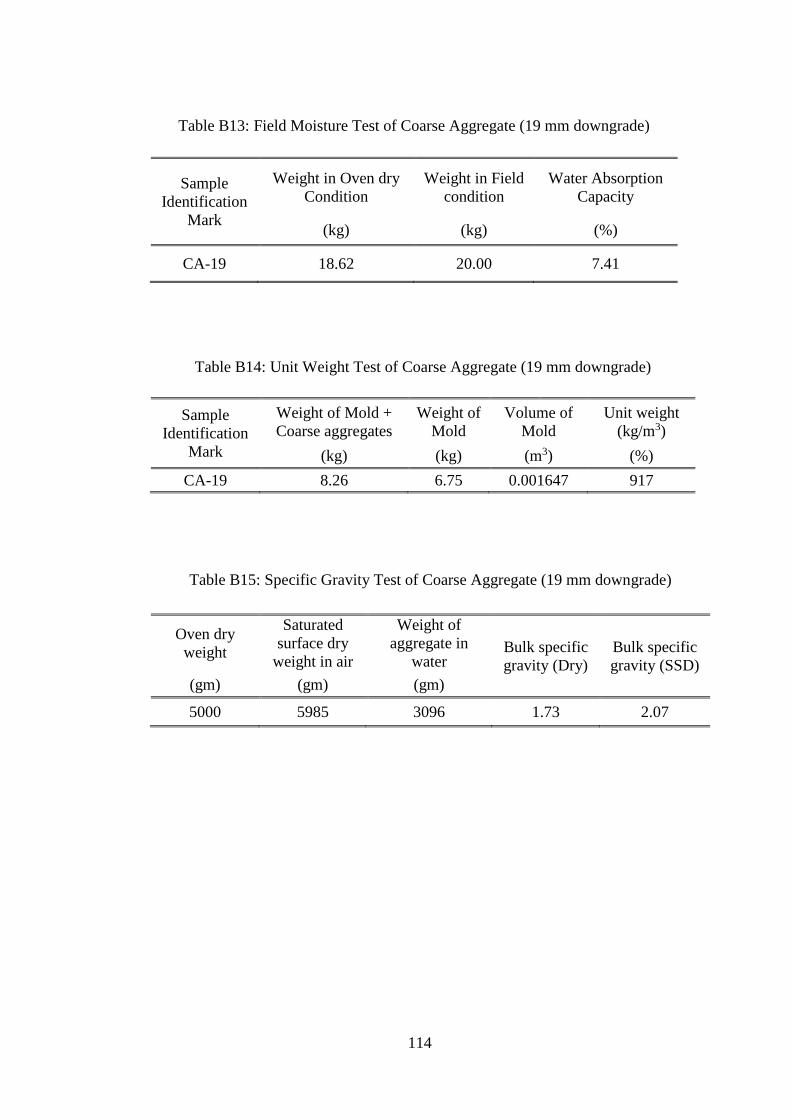
114
Table B13: Field Moisture Test of Coarse Aggregate (19 mm downgrade)
Sample
Identification
Mark
Weight in Oven dry
Condition
Weight in Field
condition
Water Absorption
Capacity
(kg) (kg) (%)
CA-19 18.62 20.00 7.41
Table B14: Unit Weight Test of Coarse Aggregate (19 mm downgrade)
Sample
Identification
Mark
Weight of Mold +
Coarse aggregates
Weight of
Mold
Volume of
Mold
Unit weight
(kg/m3)
(kg) (kg) (m3) (%)
CA-19 8.26 6.75 0.001647 917
Table B15: Specific Gravity Test of Coarse Aggregate (19 mm downgrade)
Oven dry
weight
Saturated
surface dry
weight in air
Weight of
aggregate in
water Bulk specific
gravity (Dry)
Bulk specific
gravity (SSD)
(gm) (gm) (gm)
5000 5985 3096 1.73 2.07

115
Table B16: Report on the Tests of Elongation Index (19 mm)
BS Test Sieve
Size, Passing
BS Test Sieve
Size,
Retaining
Weight
Retained
Percentage
Retained
Weight of
Elongated
Particles
Weighted
Elongation
Index
mm mm gm % gm %
50.0 37.5 0.0 0.0 0.0 0.0
37.5 28.0 0.0 0.0 0.0 0.0
28.0 20.0 1040.0 21.1 34.0 0.7
20.0 14.0 2465.0 50.0 298.0 6.0
14.0 10.0 1157.0 23.5 215.0 4.4
10.0 6.3 269.0 5.5 74.0 1.5
Total Weight = 4931.0 100.0 621.0 12.6
Table B17: Report on the Tests of Flakiness Index (19 mm)
BS Test Sieve
Size, Passing
BS Test Sieve
Size, Retaining
Weight
Retained
Percentage
Retained
Weight of
Flaky
Particles
Weighted
Flakiness
Index
mm mm gm % gm %
50.0 37.5 0.0 0.0 0.0 0.0
37.5 28.0 0.0 0.0 0.0 0.0
28.0 20.0 1040.0 21.1 158.0 3.2
20.0 14.0 2465.0 50.0 204.0 4.1
14.0 10.0 1157.0 23.5 149.0 3.0
10.0 6.3 269.0 5.5 28.0 0.6
Total Weight = 4931.0 100.0 539.0 10.9

116
Table B18: Sieve Analysis of Fine Aggregate
Sieve No. Weight
Retained (gm)
Percent
Retained
Cumulative
Percent
Retained
FM
4 0.0 0.00 0.00
2.81
8 25.0 5.00 5.00
16 84.0 16.80 21.80
30 220.0 44.00 65.80
50 116.0 23.20 89.00
100 50.0 10.00 99.00
Pan 5.0 - -
Total 500.0 - 280.60
Table B 19: ASTM upper and lower limit for FA
Sieve Size (mm) Percent Finer
Fine Aggregate ASTM Lower Limit ASTM Upper Limit
4.75 100 95 100
2.36 95.00 80 100
1.18 78.20 50 85
0.6 34.20 25 60
0.3 11.00 5 30
0.15 1.00 0 10
Table B20: Field Moisture Test of Coarse Sand
Sample
Identification
Mark
Weight in Oven dry
Condition
Weight in Field
condition
Water Absorption
Capacity
(kg) (kg) (%)
FA 19.93 20.00 0.35
Table B21: Water Absorption Test of Coarse Sand
Sample
Identification
Mark
Weight in Oven dry
Condition
Weight in SSD
condition
Water Absorption
Capacity
(gm) (gm) (%)
FA 495 500 1.0
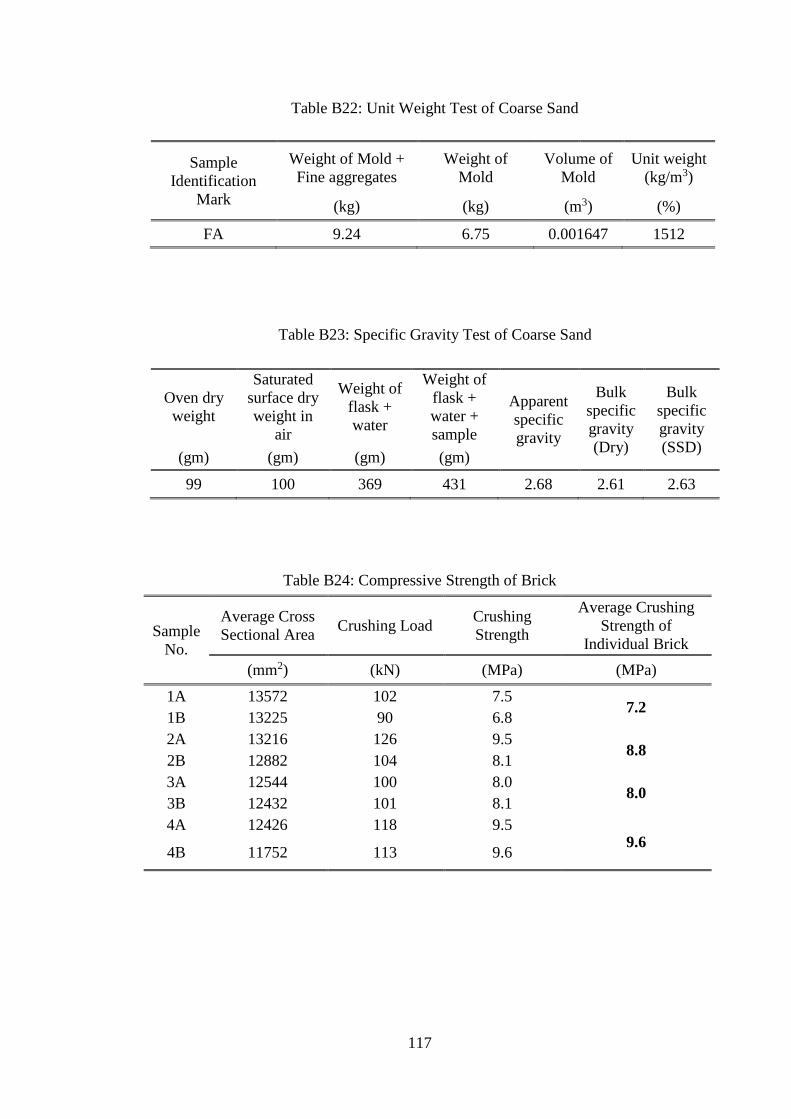
117
Table B22: Unit Weight Test of Coarse Sand
Sample
Identification
Mark
Weight of Mold +
Fine aggregates
Weight of
Mold
Volume of
Mold
Unit weight
(kg/m3)
(kg) (kg) (m3) (%)
FA 9.24 6.75 0.001647 1512
Table B23: Specific Gravity Test of Coarse Sand
Oven dry
weight
Saturated
surface dry
weight in
air
Weight of
flask +
water
Weight of
flask +
water +
sample
Apparent
specific
gravity
Bulk
specific
gravity
(Dry)
Bulk
specific
gravity
(SSD) (gm) (gm) (gm) (gm)
99 100 369 431 2.68 2.61 2.63
Table B24: Compressive Strength of Brick
Sample
No.
Average Cross
Sectional Area Crushing Load
Crushing
Strength
Average Crushing
Strength of
Individual Brick
(mm2) (kN) (MPa) (MPa)
1A 13572 102 7.5 7.2
1B 13225 90 6.8
2A 13216 126 9.5 8.8
2B 12882 104 8.1
3A 12544 100 8.0 8.0
3B 12432 101 8.1
4A 12426 118 9.5
9.6
4B 11752 113 9.6
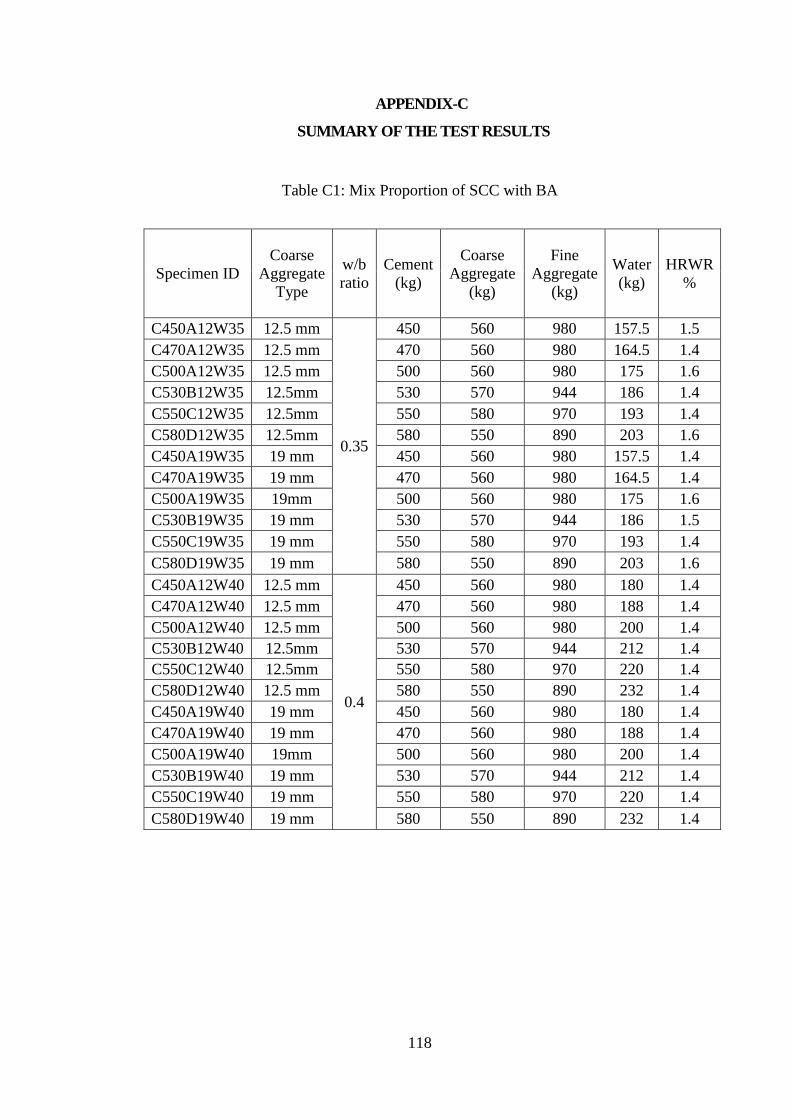
118
APPENDIX-C
SUMMARY OF THE TEST RESULTS
Table C1: Mix Proportion of SCC with BA
Specimen ID
Coarse
Aggregate
Type
w/b
ratio
Cement
(kg)
Coarse
Aggregate
(kg)
Fine
Aggregate
(kg)
Water
(kg)
HRWR
%
C450A12W35 12.5 mm
0.35
450 560 980 157.5 1.5
C470A12W35 12.5 mm 470 560 980 164.5 1.4
C500A12W35 12.5 mm 500 560 980 175 1.6
C530B12W35 12.5mm 530 570 944 186 1.4
C550C12W35 12.5mm 550 580 970 193 1.4
C580D12W35 12.5mm 580 550 890 203 1.6
C450A19W35 19 mm 450 560 980 157.5 1.4
C470A19W35 19 mm 470 560 980 164.5 1.4
C500A19W35 19mm 500 560 980 175 1.6
C530B19W35 19 mm 530 570 944 186 1.5
C550C19W35 19 mm 550 580 970 193 1.4
C580D19W35 19 mm 580 550 890 203 1.6
C450A12W40 12.5 mm
0.4
450 560 980 180 1.4
C470A12W40 12.5 mm 470 560 980 188 1.4
C500A12W40 12.5 mm 500 560 980 200 1.4
C530B12W40 12.5mm 530 570 944 212 1.4
C550C12W40 12.5mm 550 580 970 220 1.4
C580D12W40 12.5 mm 580 550 890 232 1.4
C450A19W40 19 mm 450 560 980 180 1.4
C470A19W40 19 mm 470 560 980 188 1.4
C500A19W40 19mm 500 560 980 200 1.4
C530B19W40 19 mm 530 570 944 212 1.4
C550C19W40 19 mm 550 580 970 220 1.4
C580D19W40 19 mm 580 550 890 232 1.4
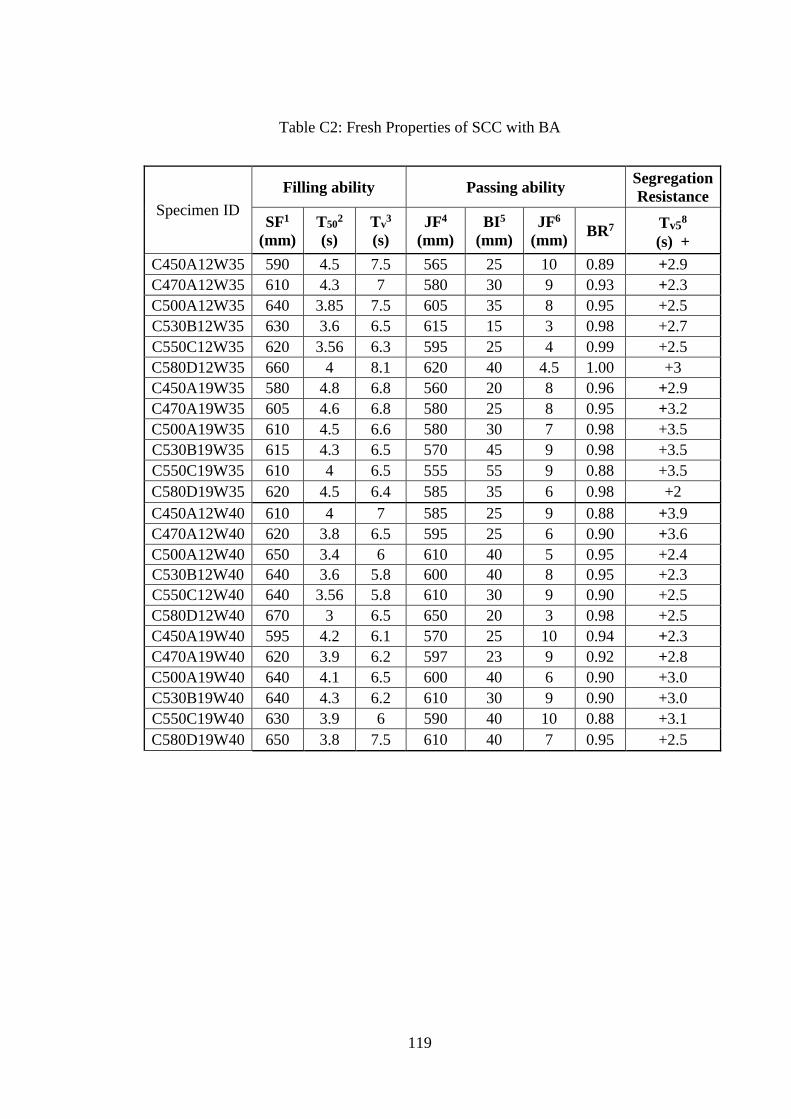
119
Table C2: Fresh Properties of SCC with BA
Specimen ID
Filling ability Passing ability Segregation
Resistance
SF1
(mm)
T502
(s)
Tv3
(s)
JF4
(mm)
BI5
(mm)
JF6
(mm) BR7
Tv58
(s) +
C450A12W35 590 4.5 7.5 565 25 10 0.89 +2.9
C470A12W35 610 4.3 7 580 30 9 0.93 +2.3
C500A12W35 640 3.85 7.5 605 35 8 0.95 +2.5
C530B12W35 630 3.6 6.5 615 15 3 0.98 +2.7
C550C12W35 620 3.56 6.3 595 25 4 0.99 +2.5
C580D12W35 660 4 8.1 620 40 4.5 1.00 +3
C450A19W35 580 4.8 6.8 560 20 8 0.96 +2.9
C470A19W35 605 4.6 6.8 580 25 8 0.95 +3.2
C500A19W35 610 4.5 6.6 580 30 7 0.98 +3.5
C530B19W35 615 4.3 6.5 570 45 9 0.98 +3.5
C550C19W35 610 4 6.5 555 55 9 0.88 +3.5
C580D19W35 620 4.5 6.4 585 35 6 0.98 +2
C450A12W40 610 4 7 585 25 9 0.88 +3.9
C470A12W40 620 3.8 6.5 595 25 6 0.90 +3.6
C500A12W40 650 3.4 6 610 40 5 0.95 +2.4
C530B12W40 640 3.6 5.8 600 40 8 0.95 +2.3
C550C12W40 640 3.56 5.8 610 30 9 0.90 +2.5
C580D12W40 670 3 6.5 650 20 3 0.98 +2.5
C450A19W40 595 4.2 6.1 570 25 10 0.94 +2.3
C470A19W40 620 3.9 6.2 597 23 9 0.92 +2.8
C500A19W40 640 4.1 6.5 600 40 6 0.90 +3.0
C530B19W40 640 4.3 6.2 610 30 9 0.90 +3.0
C550C19W40 630 3.9 6 590 40 10 0.88 +3.1
C580D19W40 650 3.8 7.5 610 40 7 0.95 +2.5
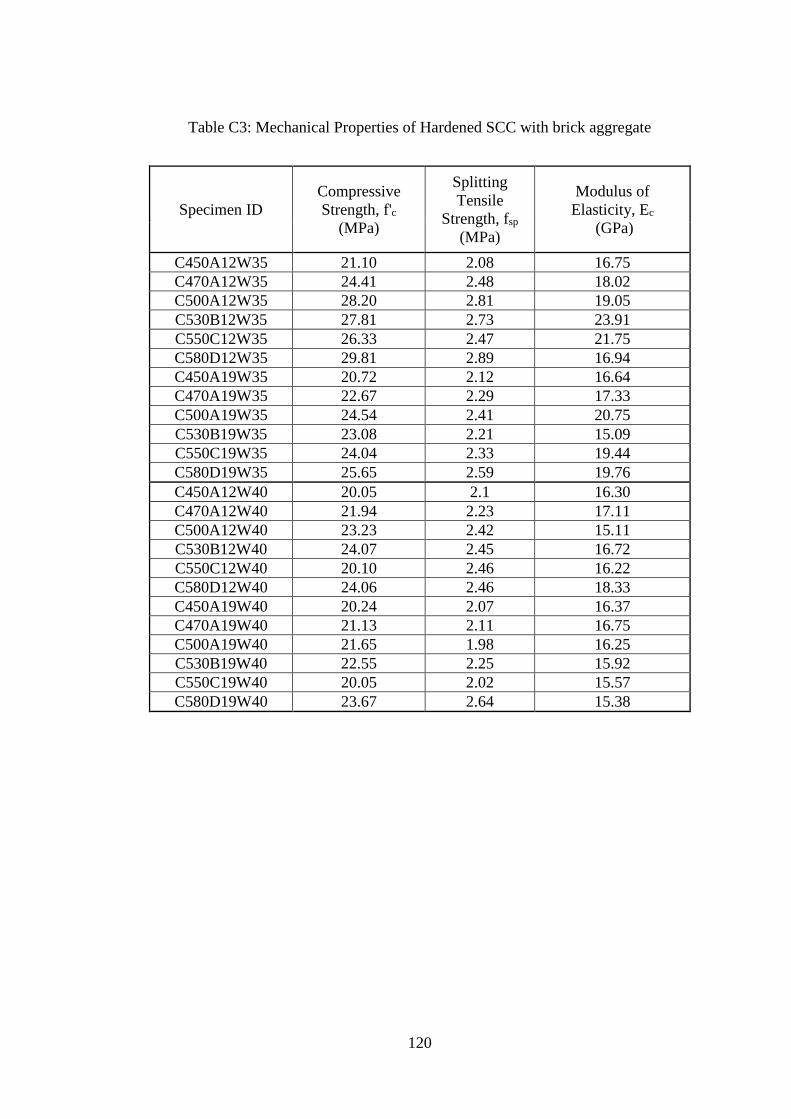
120
Table C3: Mechanical Properties of Hardened SCC with brick aggregate
Specimen ID
Compressive
Strength, f'c
(MPa)
Splitting
Tensile
Strength, fsp
(MPa)
Modulus of
Elasticity, Ec
(GPa)
C450A12W35 21.10 2.08 16.75
C470A12W35 24.41 2.48 18.02
C500A12W35 28.20 2.81 19.05
C530B12W35 27.81 2.73 23.91
C550C12W35 26.33 2.47 21.75
C580D12W35 29.81 2.89 16.94
C450A19W35 20.72 2.12 16.64
C470A19W35 22.67 2.29 17.33
C500A19W35 24.54 2.41 20.75
C530B19W35 23.08 2.21 15.09
C550C19W35 24.04 2.33 19.44
C580D19W35 25.65 2.59 19.76
C450A12W40 20.05 2.1 16.30
C470A12W40 21.94 2.23 17.11
C500A12W40 23.23 2.42 15.11
C530B12W40 24.07 2.45 16.72
C550C12W40 20.10 2.46 16.22
C580D12W40 24.06 2.46 18.33
C450A19W40 20.24 2.07 16.37
C470A19W40 21.13 2.11 16.75
C500A19W40 21.65 1.98 16.25
C530B19W40 22.55 2.25 15.92
C550C19W40 20.05 2.02 15.57
C580D19W40 23.67 2.64 15.38
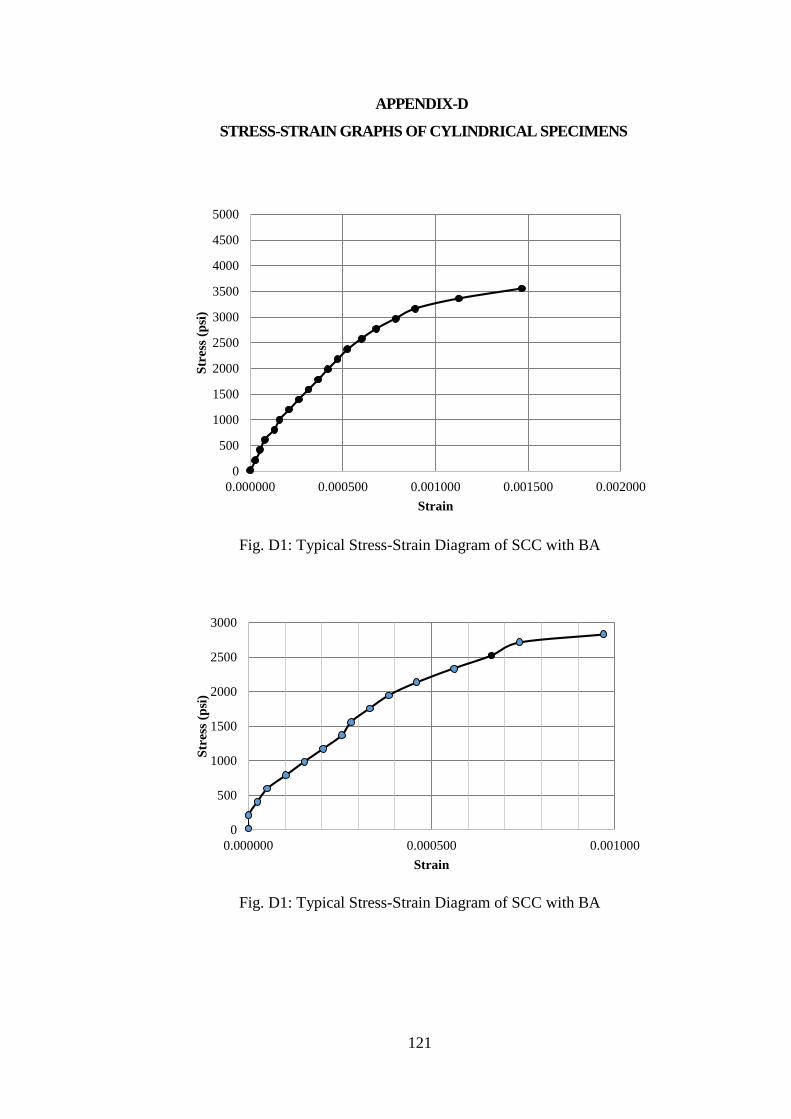
121
APPENDIX-D
STRESS-STRAIN GRAPHS OF CYLINDRICAL SPECIMENS
Fig. D1: Typical Stress-Strain Diagram of SCC with BA
Fig. D1: Typical Stress-Strain Diagram of SCC with BA
0
500
1000
1500
2000
2500
3000
3500
4000
4500
5000
0.000000 0.000500 0.001000 0.001500 0.002000
Str
ess
(psi
)
Strain
0
500
1000
1500
2000
2500
3000
0.000000 0.000500 0.001000
Str
ess
(psi
)
Strain
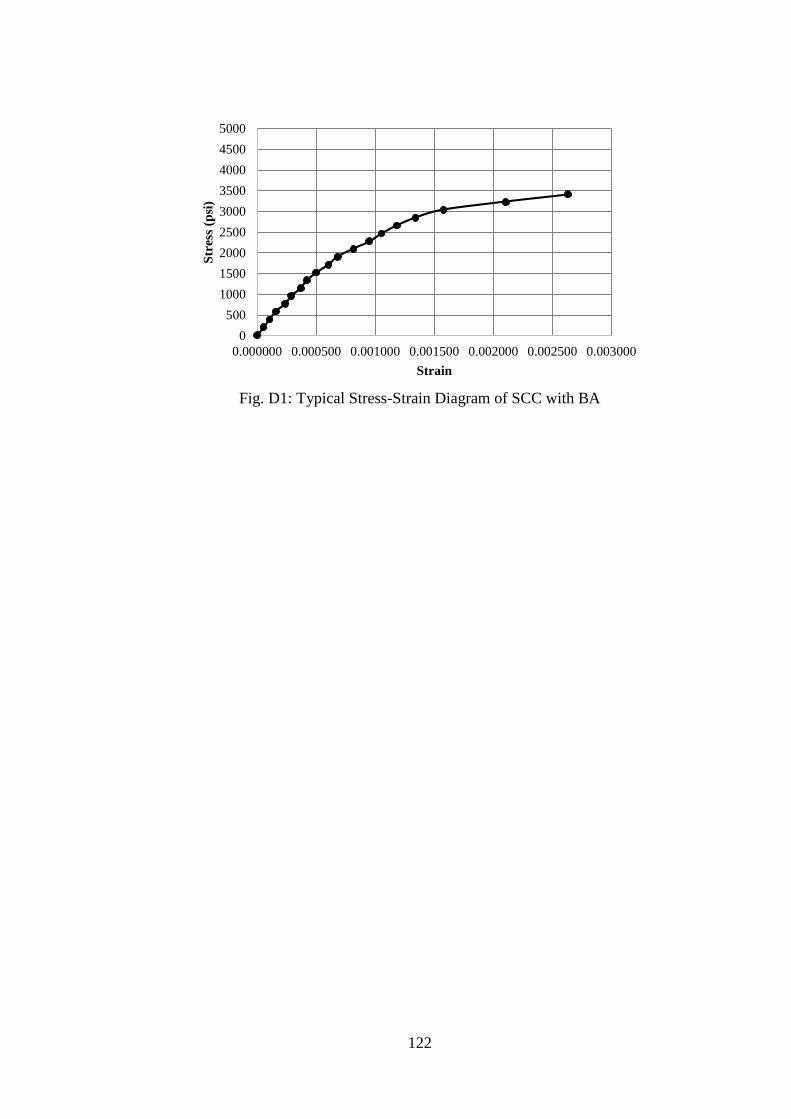
122
Fig. D1: Typical Stress-Strain Diagram of SCC with BA
0
500
1000
1500
2000
2500
3000
3500
4000
4500
5000
0.000000 0.000500 0.001000 0.001500 0.002000 0.002500 0.003000
Str
ess
(psi
)
Strain