frequency response analysis tool - certs · frequency response analysis tool pv etingov ... this...
TRANSCRIPT
PNNL-23954
Prepared for the U.S. Department of Energy under Contract DE-AC05-76RL01830
Frequency Response Analysis Tool PV Etingov D Kosterev T Dai December 2014


PNNL-23954
Frequency Response Analysis Tool
PV Etingov, Senior Research Engineer
D Kosterev, Principal Engineer (Bonneville Power Administration)
T Dai, Ph.D. Intern
December 2014
Prepared for
the U.S. Department of Energy
under Contract DE-AC05-76RL01830
Pacific Northwest National Laboratory
Richland, Washington 99352

iii
Abstract
Frequency response has received a lot of attention in recent years at the national level, which
culminated in the development and approval of North American Electricity Reliability Corporation
(NERC) BAL-003-1 Frequency Response and Frequency Bias Setting Reliability Standard.
This report is prepared to describe the details of the work conducted by Pacific Northwest National
Laboratory (PNNL) in collaboration with the Bonneville Power Administration and Western Electricity
Coordinating Council (WECC) Joint Synchronized Information Subcommittee (JSIS) to develop a
frequency response analysis tool (FRAT). The document provides the details on the methodology and
main features of the FRAT. The tool manages the database of under-frequency events and calculates the
frequency response baseline. Frequency response calculations are consistent with frequency response
measure (FRM) in NERC BAL-003-1 for an interconnection and balancing authority. The FRAT can use
both phasor measurement unit (PMU) data, where available, and supervisory control and data acquisition
(SCADA) data. The tool is also capable of automatically generating NERC Frequency Response Survey
(FRS) forms required by BAL-003-1 Standard.
The tool has been released under an open source license. The primary users of the FRAT are
balancing authorities and reliability coordinators. PNNL is continuously working on the FRAT
development and improvement. Based on the industry feedback, new functions can be added.


v
Summary
Electrical interconnection must be operated within a secure frequency range to maintain a continuous
balance between the system demand, interchange, and generation. Interconnection frequency deviation
could cause significant negative impacts on system reliability and control performance.
Federal Energy Regulatory Commission (FERC) states in [1]: “Frequency response (FR) is a measure
of an Interconnection’s ability to stabilize frequency immediately following the sudden loss of generation
or load, and is a critical component of the reliable operation of the power system, particularly during
disturbances and recoveries.” Frequency response has received much attention in recent years at the
national level, culminating in the development and approval of the North American Electricity Reliability
Corporation (NERC) BAL-003-1 Frequency Response and Frequency Bias Setting Reliability Standard
[2]. The Standard determines the amount of frequency response required in each interconnection and the
allocation of frequency response obligation among balancing authorities.
This report is prepared to describe the details of the work conducted by Pacific Northwest National
Laboratory (PNNL) in collaboration with Bonneville Power Administration and Western Electricity
Coordinating Council (WECC) Joint Synchronized Information Subcommittee (JSIS) to develop a
frequency response analysis tool (FRAT). The initial project was funded by the Office of Electricity
Delivery and Energy Reliability (OE) at the U.S. Department of Energy (DOE) under the American
Recovery and Reinvestment Act (ARRA) of 2009 and by the Bonneville Power Administration. The
ongoing project is funded by the DOE OE through the Consortium for Electric Reliability Technology
Solutions (CERTS) program.
The main goal of the tool is to automate the power system frequency response analysis process. The
FRAT performs the estimation of the frequency response characteristics based on the phasor
measurement unit (PMU) and supervisory control and data acquisition (SCADA) measurements, manages
the database of under-frequency events and calculates the frequency response baseline. Frequency
response calculations are consistent with frequency response measure (FRM) in NERC BAL-003-1 for an
interconnection and balancing authority. The FRAT can use both PMU data, where available, and
SCADA data. The tool is also capable to automatically generate NERC Frequency Response Survey FRS
forms required by BAL-003-1 Standard. The primary users of the FRAT are balancing authorities and
reliability coordinators.
The first version of the FRAT (version 1.0) was released under an open source license in 2013. PNNL
is continuously working on the FRAT development and improvement. Based on the feedback received
from the industry partners, the new fully redesigned version of the application (FRAT 2.0) has been
developed and released under an open source license in August 2014.
The FRAT is a standalone Windows application with a user friendly graphical user interface (GUI)
and advanced visualization (Figure 1). The FRAT has been developed using Microsoft Visual Studio
2012 and it is based on Windows Presentation Foundation (WPF) technology. The FRAT main features
include:
1) Calculating system mean frequency based on user specified PMU measurements.

vi
2) Performing initial estimation of the system FR parameters (initial frequency, minimum
frequency, settling point, etc.).
3) Visually inspect and adjust initial estimation of FR parameters.
4) Calculating FR performance characteristics according to NERC BAL-003-01 Standard (MW/0.1
Hz at point B), as well as additional performance metrics: FRM at minimum frequency (point C),
30 sec, 60 sec, 90 sec, etc.).
5) Archiving the historic events into an internal database and baselining the system performance.
6) Performing statistical analysis (linear regression, basic descriptive statistics)
7) Visualizing FR performance using different plots (depending on date, time, day of the week,
wind/solar generation penetration).
8) All graphs produced by the tool can be copied into clipboard or into file (.jpg or .emf formats).
9) Automatically generating reports (including FRS 1 form) in Word format.
Figure 1. FRAT (version 2.0) GUI.
The developed PNNL FRAT application has been used by interconnections and balancing authorities
(BAs) for a FR performance analysis and baselining. The FRAT application has been presented at
industrial events including:

vii
NERC Frequency Working Group
NERC Resources Subcommittee
Electricity Reliability Council of Texas (ERCOT) phasor measurement task force
WECC JSIS
WECC Modeling and Validation Work Group (MVWG)
Webinars for Independent System Operator (ISO) New England and ERCOT.
The FRAT received very positive feedback from the users. Multiple entities expressed their interest to
start testing and using the tool. The industrial users also provided valuable feedback for the continuing
research. Based on the industry feedback, the major improvement of the tool should be extending the tool
functionality to perform FR analysis for the individual generation units.
The FRAT future work will also involve the industry outreach including:
Working closely with NERC (primarily with NERC Resources Subcommittee and
Frequency Working Group) to promote nationwide dissemination of the tool among BAs
and other electrical utilities.
Working closely with NERC and the Consortium for Electric Reliability Technology
Solutions (CERTS) to establish continuing support and maintenance of the FRAT.
Working with BPA, ISO New England, ERCOT, WECC, and other BAs and utilities to
provide them FR tool support and also to receive their feedback.
Making presentations at North American Synchrophasor Initiative (NASPI), WECC
JSIS, WECC MVWG, Institute of Electrical and Electronics Engineers (IEEE) and other
industrial meetings and workshops.
The FRAT repository and online documentation can be found at: https://svn.pnl.gov/FRTool


ix
Acknowledgments
The initial project was funded by the Office of Electricity Delivery and Energy Reliability (OE),U.S.
Department of Energy (DOE) under the American Recovery and Reinvestment Act (ARRA) of 2009 and
by the Bonneville Power Administration. The ongoing project is funded by the DOE OE through the
Consortium for Electric Reliability Technology Solutions (CERTS) program.
The project team is thankful for the support and valuable discussions on frequency response
fundamentals to:
Phillip Overholt, DOE OE
Joe Eto, Lawrence Berkeley National Laboratory (LBNL), CERTS
Bob Cummings, NERC
Alison Silverstein, NASPI
John Undrill
Carlos Martinez, Advanced System Researchers (ASR)
Sydney Niemeyer, NRG Energy
The project team appreciates contributions and support of the following PNNL engineers and
managers:
Jeffery Dagle, Chief Engineer, Team Lead
David Chassin, Staff Scientist
Yu Zhang, Senior Research Engineer
Mark Morgan, Project Manager
Eric Andersen, Project Manager
Dale King, Product Line Manager
Carl Imhoff, Electric Infrastructure Market Sector Manager
Sue Arey, Project Specialist


xi
Acronyms and Abbreviations
BA Balancing authority
BPA Bonneville Power Administration
CERTS Consortium for Electric Reliability Technology Solutions
DOE Department of Energy
ERO Electric Reliability Organization
FERC Federal Energy Regulatory Commission
FR Frequency response
FRAT Frequency response analysis tool
FRM Frequency response measure
FRO Frequency response obligation
FRS Frequency Response Survey
FRSG Frequency Response Sharing Groups
IFRO Interconnection frequency response obligation
JSIS Joint Synchronized Information Subcommittee
JOU Jointly owned unit
MW Megawatt
NASPI North American Synchrophasor Initiative
NERC North American Electric Reliability Corporation
OE DOE Office of Electricity Delivery and Energy Reliability
PDF Probability density function
PNNL Pacific Northwest National Laboratory
PMU Phasor measurement unit
SCADA Supervisory control and data acquisition
UFLS Under-frequency load shedding
WECC Western Electricity Coordinating Council

xiii
Contents
Abstract ............................................................................................................................................. iii
Summary ............................................................................................................................................. v
Acknowledgments .............................................................................................................................. ix
Acronyms and Abbreviations ............................................................................................................ xi
1.0 Introduction ............................................................................................................................. 1.1
2.0 FR Methodology Background ................................................................................................. 2.1
2.1 Frequency Response ........................................................................................................ 2.1
2.2 Frequency Response Measure (FRM) ............................................................................. 2.2
2.3 Interconnection Frequency Response Obligation (IFRO) ............................................... 2.4
2.4 Balancing Authority Frequency Response Obligation (FRO)......................................... 2.4
2.5 Frequency Response Reporting ....................................................................................... 2.4
3.0 Frequency Response Analysis Tool Description ..................................................................... 3.1
3.1 Main Features of the FRAT ............................................................................................ 3.1
3.2 FRAT Graphical User Interface (GUI) ........................................................................... 3.2
3.3 FRAT settings ................................................................................................................. 3.3
3.4 Input File Requirements .................................................................................................. 3.5
3.5 Event Database Panel ...................................................................................................... 3.6
3.6 Event Characteristics Panel ............................................................................................. 3.7
3.6.1 Event Description Group ...................................................................................... 3.8
3.6.2 Load/Generation Group ........................................................................................ 3.9
3.6.3 Time/Frequency Group ........................................................................................ 3.9
3.6.4 NERC Performance Group ................................................................................... 3.9
3.6.5 Additional Performance Indexes Group ............................................................... 3.9
3.7 Event Plot Panel .............................................................................................................. 3.9
3.8 FRM Baseline and Statistical Analysis Screen ............................................................. 3.11
3.8.1 Baseline Plot ....................................................................................................... 3.11
3.8.2 FRM Statistical Analysis .................................................................................... 3.12
3.9 Editing Event Database ................................................................................................. 3.13
3.10 Adding New Event ........................................................................................................ 3.14
3.11 FRAT Report Generation .............................................................................................. 3.15
3.12 FRAT Requirement ....................................................................................................... 3.16
3.13 Program Repository....................................................................................................... 3.17
4.0 FR of the Western Interconnection .......................................................................................... 4.1
5.0 Conclusions ............................................................................................................................. 5.1
6.0 References ............................................................................................................................... 6.1
xiv
Figures
Figure 1-1. FRAT (version 1.0) GUI. .............................................................................................. 1.2
Figure 1-2. FRAT (version 2.0) GUI. .............................................................................................. 1.3
Figure 2-1. System frequency following resource loss. ................................................................... 2.2
Figure 2-2. An example of the frequency event: a) interconnection frequency based on PMU
measurements; b) actual net interchange based on SCADA measurements. ........................... 2.3
Figure 3-1. FRAT main GUI ........................................................................................................... 3.2
Figure 3-2. Float and hide function of the tool ................................................................................ 3.3
Figure 3-3. FRAT toolbar panel. ...................................................................................................... 3.3
Figure 3-4. FRAT settings window.................................................................................................. 3.4
Figure 3-5. FRAT configuration file ................................................................................................ 3.4
Figure 3-6. One row .csv file example: a) opened in text editor; b) opened in Excel. ..................... 3.5
Figure 3-7. Four rows .csv file example: a) opened in text editor; b) opened in Excel. .................. 3.6
Figure 3-8. Events database screen. ................................................................................................. 3.6
Figure 3-9. Event characteristics screen .......................................................................................... 3.8
Figure 3-10. Event plot screen. ...................................................................................................... 3.10
Figure 3-11. Baseline plot screen ................................................................................................... 3.11
Figure 3-12. Baseline plot range selector ....................................................................................... 3.12
Figure 3-13. Statistical analysis of the interconnection FRM ........................................................ 3.12
Figure 3-14. Event plot in “edit” mode. ......................................................................................... 3.14
Figure 3-15. Frequency response analysis report screen ............................................................... 3.16
Figure 3-16. FRS 1 form. ............................................................................................................... 3.16
Figure 3-17. FRAT repository (main Wiki page) .......................................................................... 3.17
Figure 3-18. FRAT documentation ................................................................................................ 3.18
Figure 4-1. Frequency response baseline for Western Interconnection. .......................................... 4.1
Figure 4-2. Relationship between event size and historic frequency response measure .................. 4.2
Figure 4-3. Ratio between frequency deviations at nadir (C) and settling (B) points ...................... 4.2

xv
Tables
Table 2-1. Interconnection Frequency Response Obligations ......................................................... 2.4
Table 2-2. NERC FRS Form 1 (main table) .................................................................................... 2.5
Table 2-3. NERC FRS form 1 (Summary table) .............................................................................. 2.6
Table 2-4. NERC FRS Form 2 structure .......................................................................................... 2.7
Table 3-1. One row header requirements ......................................................................................... 3.5
Table 3-2. Event characteristics columns definition ........................................................................ 3.7

1.1
1.0 Introduction
Electrical interconnection must be operated within a secure frequency range to maintain a continuous
balance between the system demand, interchange, and generation. Interconnection frequency deviation
could cause significant negative impacts on system reliability and control performance.
Federal Energy Regulatory Commission (FERC) states in [1]: “Frequency response is a measure
of an Interconnection’s ability to stabilize frequency immediately following the sudden loss of generation
or load, and is a critical component of the reliable operation of the power system, particularly during
disturbances and recoveries.” Frequency response has received much attention in recent years at the
national level, culminating in the development and approval of the North American Electric Reliability
Corporation (NERC) BAL-003-1 Frequency Response and Frequency Bias Setting Reliability Standard
[2]. The Standard determines the amount of frequency response required in each interconnection and the
allocation of frequency response obligation among balancing authorities. The Standard is largely based
on technical work done in the NERC Frequency Response Initiative [3] and Lawrence Berkeley National
Laboratory (LBNL)-led work on frequency response metrics [4].
The Western Electricity Coordinating Council (WECC) has a long history of frequency response
monitoring. WECC made several attempts to develop its own regional frequency responsive reserve
(FRR) Standard or criteria [5], well before the NERC Standard. WECC’s objectives were to: (a) ensure
that an adequate amount and quality of frequency responsive reserves are carried in the interconnection,
and (b) achieve even distribution of frequency response across the interconnection to mitigate the
frequency response impacts on transmission paths. WECC has used synchrophasor data to monitor
frequency response in the Western Interconnection.
Bonneville Power Administration (BPA) implemented the practice of using synchrophasor data
for governor response validation [6]. These efforts greatly improved the accuracy of frequency response
representation in power system studies, as evident from a number of system-wide validation studies.
PNNL in collaboration with BPA and Western Electricity Coordinating Council (WECC) Joint
Synchronized Information Subcommittee (JSIS) developed a tool to automate the analysis of
interconnections frequency response [7]. The tool can help to perform the estimation of the frequency
response characteristics based on the phasor measurement unit (PMU) and supervisory control and data
acquisition (SCADA) measurements, and collect and process statistical information on the frequency
response characteristics. The tool can also represent the information using advanced visualization
techniques.
The first version of the FRAT (Version 1.0) was released under open source license in 2013. A
screenshot of the FRAT 1.0 GUI is shown in Figure 1-1.
The FRAT 1.0 has the following main features:
Automation of frequency response analysis process;
Calculation of the interconnection frequency response measure (FRM) using PMU and
SCADA data;

1.2
Initial estimation of the FR parameters (initial frequency, minimum frequency, settling point,
etc.)
Visual inspection and manual adjustment of system parameters
Archiving the historic events and baselines the interconnection performance;
Automatically generating reports in MS Word format;
User friendly graphical user interface (GUI)
Figure 1-1. FRAT (version 1.0) GUI.
Based on the feedback received from the industry partners, the new version of the tool (FRAT 2.0)
has been developed and released under an open source license in August 2014. The tool GUI is shown in
Figure 1-2. The new version of the tool includes all features from the previous version as well as new
functionality requested by the users and improved GUI.
The new FRAT features include:
New analytical functions including:
− calculation of the interconnection and balancing authority frequency response
measure (FRM) according to the NERC BAL-003-01 Standard;
− statistical analysis;
New completely redesigned user interface;
New advanced visualization;
New reporting capabilities;
Support of different data sources.

1.3
The report presents details on the frequency response analysis, brief description of the NERC BAL-
003-01 Standard and description of the FRAT tool.
Figure 1-2. FRAT (version 2.0) GUI.
2.1
2.0 FR Methodology Background
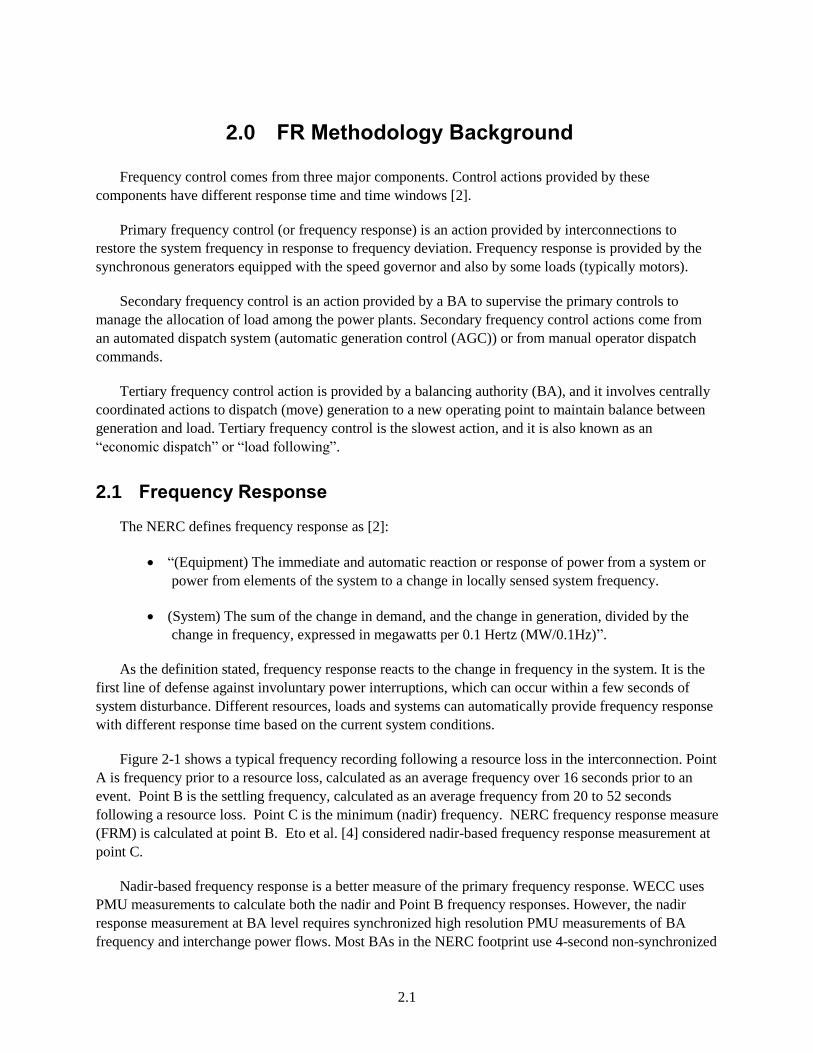
Frequency control comes from three major components. Control actions provided by these
components have different response time and time windows [2].
Primary frequency control (or frequency response) is an action provided by interconnections to
restore the system frequency in response to frequency deviation. Frequency response is provided by the
synchronous generators equipped with the speed governor and also by some loads (typically motors).
Secondary frequency control is an action provided by a BA to supervise the primary controls to
manage the allocation of load among the power plants. Secondary frequency control actions come from
an automated dispatch system (automatic generation control (AGC)) or from manual operator dispatch
commands.
Tertiary frequency control action is provided by a balancing authority (BA), and it involves centrally
coordinated actions to dispatch (move) generation to a new operating point to maintain balance between
generation and load. Tertiary frequency control is the slowest action, and it is also known as an
“economic dispatch” or “load following”.
2.1 Frequency Response
The NERC defines frequency response as [2]:
“(Equipment) The immediate and automatic reaction or response of power from a system or
power from elements of the system to a change in locally sensed system frequency.
(System) The sum of the change in demand, and the change in generation, divided by the
change in frequency, expressed in megawatts per 0.1 Hertz (MW/0.1Hz)”.
As the definition stated, frequency response reacts to the change in frequency in the system. It is the
first line of defense against involuntary power interruptions, which can occur within a few seconds of
system disturbance. Different resources, loads and systems can automatically provide frequency response
with different response time based on the current system conditions.
Figure 2-1 shows a typical frequency recording following a resource loss in the interconnection. Point
A is frequency prior to a resource loss, calculated as an average frequency over 16 seconds prior to an
event. Point B is the settling frequency, calculated as an average frequency from 20 to 52 seconds
following a resource loss. Point C is the minimum (nadir) frequency. NERC frequency response measure
(FRM) is calculated at point B. Eto et al. [4] considered nadir-based frequency response measurement at
point C.
Nadir-based frequency response is a better measure of the primary frequency response. WECC uses
PMU measurements to calculate both the nadir and Point B frequency responses. However, the nadir
response measurement at BA level requires synchronized high resolution PMU measurements of BA
frequency and interchange power flows. Most BAs in the NERC footprint use 4-second non-synchronized

2.2
data, making the nadir frequency response measurement unfeasible. Therefore, frequency response at
Point B is used as a practical alternative in NERC BAL-003-1 reliability Standard.
Figure 2-1. System frequency following resource loss.
2.2 Frequency Response Measure (FRM)
The FRM can be computed from the single event frequency response data (SEFRD), defined as “the
data from an individual event from a BA that is used to calculate its FR, expressed in MW/0.1Hz” [2].
The BA FRM for a single event can be calculated using the following formula:
FRMBA = ((PINT_B –AdjB)–(PINT_A–AdjA)) / 10( fB – fA) , (2.1)
where PINT_B is a value of interchange power flow at point B;
PINT_A is a value of interchange power flow at point A;
AdjB is a point B value adjustment;
AdjA is a point A value adjustment;
fA is a value of interconnection frequency at point A;
fB is a value of interconnection frequency at point B;
As seen from Equation (2.1), BA FRM calculation requires interchange measurements.
Unfortunately very few interchange points have PMUs, so the BA frequency response calculations use
SCADA data. SCADA measurements are not time-synchronized and the result of such skew is seen in
Figure 2-2. SCADA data also lags PMU measurements by several seconds. Thus, at present, those BAs
that are using SCADA data for frequency response monitoring are likely to be reporting response values
Point A: -16 to 0 Second Average
Point B: 20 to 52 Second Average
-20 -10 0 10 20 30 40 50 6059.86
59.88
59.9
59.92
59.94
59.96
59.98
60
60.02
A
B
C
Time (sec)
Fre
qu
en
cy (
Hz)

2.3
that are not precisely synchronized with interconnection-wide frequency response values measured using
PMUs. It will be highly desirable to have PMUs or relay-enabled PMUs at all tie-lines for measurement
synchronization, to obtain better quality frequency measurements.
a)
b)
Figure 2-2. An example of the frequency event: a) interconnection frequency based on PMU
measurements; b) actual net interchange based on SCADA measurements.
Adjustment of points A and B values according to BAL-003-01 Standard could include the following
components [2]:
Jointly owned units (JOU) dynamic schedule adjustment
Non-conforming load adjustment (load outside of normal load profile)
Pumped-hydro generation adjustment
Transferred frequency response
Contingent BA adjustment.
The interconnection FRM for a single event is calculated as following:
FRMInterconnection = (PGenLoss – PLoadLoss) / 10( fB – fA) , (2.2)
2.4
where PGenLoss is an interconnection generation loss;
PLoadLoss is an interconnection load loss.
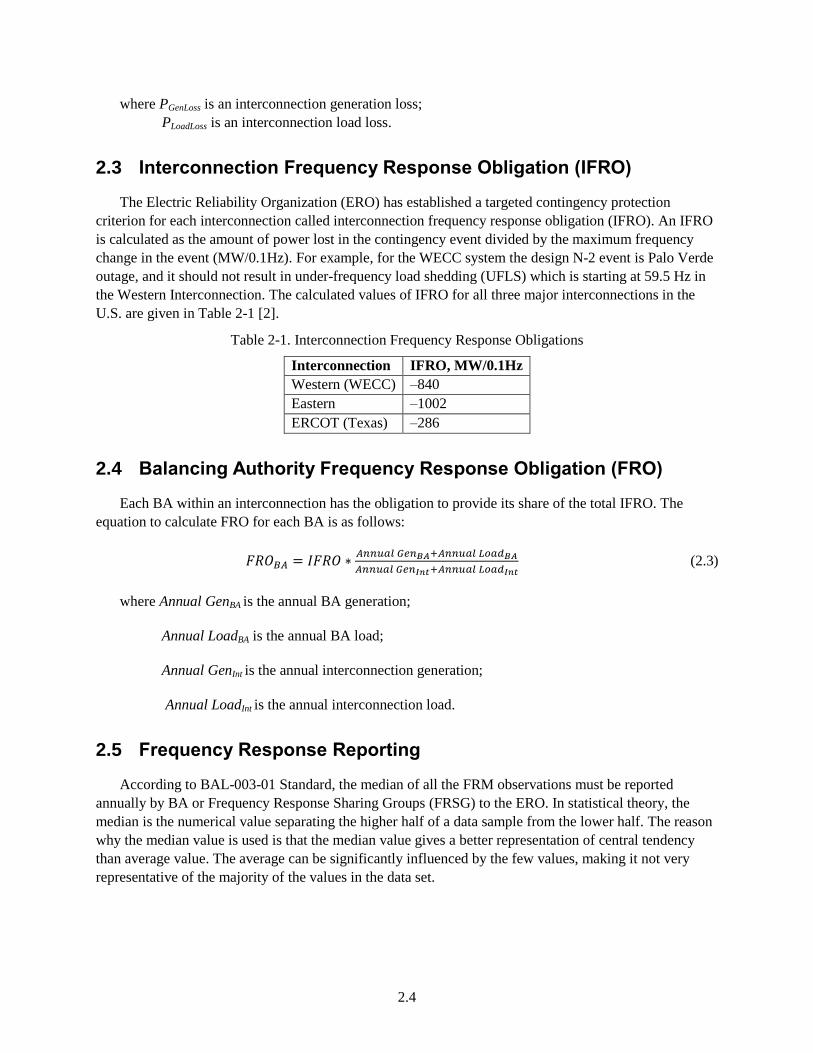
2.3 Interconnection Frequency Response Obligation (IFRO)
The Electric Reliability Organization (ERO) has established a targeted contingency protection
criterion for each interconnection called interconnection frequency response obligation (IFRO). An IFRO
is calculated as the amount of power lost in the contingency event divided by the maximum frequency
change in the event (MW/0.1Hz). For example, for the WECC system the design N-2 event is Palo Verde
outage, and it should not result in under-frequency load shedding (UFLS) which is starting at 59.5 Hz in
the Western Interconnection. The calculated values of IFRO for all three major interconnections in the
U.S. are given in Table 2-1 [2].
Table 2-1. Interconnection Frequency Response Obligations
Interconnection IFRO, MW/0.1Hz
Western (WECC) –840
Eastern –1002
ERCOT (Texas) –286
2.4 Balancing Authority Frequency Response Obligation (FRO)
Each BA within an interconnection has the obligation to provide its share of the total IFRO. The
equation to calculate FRO for each BA is as follows:
𝐹𝑅𝑂𝐵𝐴 = 𝐼𝐹𝑅𝑂 ∗𝐴𝑛𝑛𝑢𝑎𝑙 𝐺𝑒𝑛𝐵𝐴+𝐴𝑛𝑛𝑢𝑎𝑙 𝐿𝑜𝑎𝑑𝐵𝐴
𝐴𝑛𝑛𝑢𝑎𝑙 𝐺𝑒𝑛𝐼𝑛𝑡+𝐴𝑛𝑛𝑢𝑎𝑙 𝐿𝑜𝑎𝑑𝐼𝑛𝑡 (2.3)
where Annual GenBA is the annual BA generation;
Annual LoadBA is the annual BA load;
Annual GenInt is the annual interconnection generation;
Annual LoadInt is the annual interconnection load.
2.5 Frequency Response Reporting
According to BAL-003-01 Standard, the median of all the FRM observations must be reported
annually by BA or Frequency Response Sharing Groups (FRSG) to the ERO. In statistical theory, the
median is the numerical value separating the higher half of a data sample from the lower half. The reason
why the median value is used is that the median value gives a better representation of central tendency
than average value. The average can be significantly influenced by the few values, making it not very
representative of the majority of the values in the data set.

2.5
Each BA or FRSG should achieve an annual FRM equal to or less than its FRO to ensure that
sufficient frequency response is provided to maintain interconnection frequency response that should
equal to or less than the IFRO [2]1 .
Each BA or FRSG should submit the FRS forms 1 and 2 to the ERO. FRS form 1 contains
information on all frequency events. There is only one exception when an event can be excluded from the
annual FRS form 1 submission -- if the interchange or frequency data is corrupt or energy management
system (EMS) was unavailable. The FRS 1 main form structure is given in Table 2-3 and a summary table
is given in Table 2-3.
FRS form 2 is created for each frequency event separately. Information from the FRS 2 forms is used
as an input to create the FRS form 1. The FRS form 2 structure is given in Table 2-4.
Table 2-2. NERC FRS Form 1 (main table)
# Column Description
1 Event number
2 UTC date/time
3 Prevailing data/time Time used by interconnection
4 Interconnection time
zone
5 BA date/time
6 BA time zone
7 Delta frequency FB-FA
8 BA time Point A time
9 BA bias delta
frequency
FB-FA
10 Relay limit delta
frequency
Delta frequency in case of relay limit R1 violation
11 Value A NAI Net interchange value at point A = PINT_A
12 Value A adjustment Net interchange point A adjustment = AdjA
13 Value B NAI Net interchange value point B = PINT_B
14 Value B adjustment Net interchange point B adjustment = AdjB
15 FRM for bias FRM calculated according to (2.1)
16 FRM for R1 FRM in case of relay limit R1 violation
17 Exclude for data error yes/no
1 FRO and IFRO values are negative. Therefor FRM should be less or equal than FRO.

2.6
Table 2-3. NERC FRS form 1 (Summary table)
# Column Description
1 Date Event date
2 A value time Point A time
3 F point A, Hz Frequency at point A time
4 A value, Hz Point A frequency (average frequency at interval T0-16 sec…T0 sec)
5 t0 time Initial point time
6 C value, Hz Point C frequency (minimum frequency value at interval T0…T0+18 sec)
7 Frequency point A Point A frequency (average frequency at interval T0-16 sec…T0 sec)
8 Net interchange, point A Point A interchange (average interchange at interval T0-16 sec…T0 sec)
9 JOU dynamic schedule,
Point A
JOU adjustment at point A, Import(-)/Export(+)
10 Non-confirming load,
point A
Non-confirming load adjustment at point A, Load(-)
11 Pump hydro, point A Pump-hydro adjustment at point A, Load(-)/Gen(+)
12 Not used Future use
13 Transferred FR, point A Transferred FR adjustment at point A, Rec(-)/Del(+)
14 Generation loss, point A Contingent BA adjustment at point A, load loss(-)/generation loss(+)
15 BA frequency bias, point
A
BA frequency bias at point A
16 BA load, point A BA load at point A
17 BA EPFR bias settings,
point A
Expected primary frequency response at point A
18 Frequency point B Point B frequency (average frequency at interval Tt0+20 sec…Tt0+52 sec)
19 Net interchange, point B Point B interchange (average interchange at interval Tt0+20 sec…Tt0+20 sec)
20 JOU dynamic schedule,
point B
JOU adjustment at point B, import(-)/export(+)
21 Non-confirming load,
point B
Non-confirming load adjustment at point B, load(-)
22 Pump hydro, point B Pump-hydro adjustment at point B, load(-)/gen(+)
23 Not used Future use
24 Transferred FR, point B Transferred FR adjustment at point B, rec(-)/del(+)
25 Generation loss, point B Contingent BA adjustment at point B, load loss(-)/generation loss(+)
26 Initial performance,
adjusted
In per unit (p.u.)
27 Initial performance,
unadjusted
In p.u.
28 Sustained performance In p.u.
29 BA frequency bias, point
B
BA frequency Bias at point B
30 BA load, point B BA load at point B
31 BA EPFR bias settings,
Point B
Expected primary frequency response at point B

2.7
Table 2-4. NERC FRS Form 2 structure
# Column Description
1 Time Timestamp, in case of SCADA data usage, the 2 seconds resolution is
normally used.
2 Frequency Hz
3 Net actual
interchange
MW
4 JOU dynamic
schedule
Import(-)/export(+)
5 Non-conforming load Load(-)
6 Pumped hydro Load(-)/Gen(+)
7 Not used
8 Transferred FR Rec(-)/Del(+)
9 Contingent BA Load Loss(-)/Generation Loss(+)
10 BA bias MW/0.1Hz
11 BA load MW

3.1
3.0 Frequency Response Analysis Tool Description
PNNL worked with BPA and WECC JSIS to develop a frequency response analysis tool (FRAT) to
manage the database of under-frequency events and calculate the frequency response baseline. The
application can use both PMU data, where available, and SCADA data. Frequency response calculations
are consistent with frequency response measure (FRM) in NERC BAL-003-1 for an interconnection and
balancing authority. In addition to NERC FRM, the application calculates the nadir frequency response.
The frequency response metrics are saved in an extensive database. The primary users of the FRAT are
balancing authorities and reliability coordinators.
3.1 Main Features of the FRAT
The purpose of the developed software tool is to automate the BA and interconnection frequency
response analysis process. The tool performs the estimation of the frequency response characteristics
according to the NERC BAL-003-01 Standard using SCADA and PMU measurements. The FRAT also
can visualize FR information using different types of plots and perform statistical analysis. Reports (FRS
forms) can be also automatically generated.
The FRAT is a standalone Windows application. It has a user friendly interface. The FRAT has been
developed using Microsoft Visual Studio 2012. The FRAT features include:
Calculating system mean frequency based on user-specified PMU measurements.
Performing initial estimation of the system FR parameters (initial frequency, minimum
frequency, settling point, etc.).
Allow visual inspection and adjustment of initial estimation of FR parameters.
Calculation of FR performance characteristics according to NERC BAL-003-01 Standard
(MW/0.1 Hz at point B), as well as additional performance metrics: FRM at minimum
frequency (point C), 30 sec, 60 sec, 90 sec, etc.).
Archiving the historic events into internal database and baselining the system performance.
Performing statistical analysis (linear regression, basic descriptive statistics)
Visualizing FR performance using different plots (depending on date, time, day of the week,
wind/solar generation penetration).
Allow all graphs produced by the tool to be copied into clipboard or into file (.jpg or .emf
formats).
Automatically generating reports (including FRS 1 form) in Word format.

3.2
3.2 FRAT Graphical User Interface (GUI)
Figure 3-1 shows an interactive display of the frequency response analysis tool (Version 2.0). The
GUI consists from the toolbar and four major panels (screens):
1) Event database screen – to show the list of frequency events and basic information about these
events.
2) Event details and system performance screen – to show the event details (initial frequency,
settling frequency, minimum frequency, etc.), interconnection/BA information (generation, load,
generation by type of units, etc.), FR characteristics (BA FRM, interconnection FRM, etc.)
3) Event plot – to graphically display the event. This screen consists from three subplots for
frequency, active power and voltage.
4) FRM baseline and analysis screen – to show the FR performance baseline and statistical analysis
of the events.
Figure 3-1. FRAT main GUI
Database of historic events
Event details and system performance Frequency Response Measure Baseline
Event plot
Toolbar

3.3
All of these screens can float and be rearranged by the user. Also these screens can be hidden if not
needed. Figure 3-2 shows how to close or hide the panel.
Figure 3-2. Float and hide function of the tool
The FRAT toolbar consists from several buttons to add/edit/delete events, to specify the program
settings, and get the program help (Figure 3-3).
Figure 3-3. FRAT toolbar panel.
3.3 FRAT settings
The settings button is used to open the settings window (Figure 3-4). In the settings window, the
BA information (BA name, BA time zone and interconnection prevailing time zone) and input signals
name (columns header) for net interchange, total generation, wind generation, hydro generation and
thermal generation can be specified.
Float the screen Hide the screen
Add a new event Delete an existing event
Edit an existing event Show report screen Program Settings
screen
Show about window

3.4
Figure 3-4. FRAT settings window.
FRAT stores this information in the program configuration file (see Figure 3-5) named “presets.xml”
and can be found in “\DataBase” folder. The user can manually modify the configuration xml file to
change the main program setting as well as to define transmission interfaces and default measurements
that should be initially selected (displayed) for a new event.
Figure 3-5. FRAT configuration file

3.5
For example, to define a transmission interface called “XYZ”, which consists from three transmission
lines called “Line1”, “Line2”, “Line3”, the following xml element should be added to the configuration
file:
<Interface name="XYZ">
<Line>Line1</Line>
<Line>Line2</Line>
<Line>Line3</Line>
</Interface>
3.4 Input File Requirements
The tool uses PMU and SCADA measurements as an input. The input file must be a comma-
separated values (csv) format file. The FRAT can automatically recognize the type of measurement. to
recognize the type of measurement, the input file format should follow WECC Guideline for Data Format
Used in Engineering Analysis Applications [9]. The one row and four rows header .csv files are supported
by the FRAT. The first column of the .csv file should be the time stamp. The one row header
requirements are given in Table 3-1. One row header includes signal name and signal type separated by
the comma. An example of one row input file is shown in Figure 3-6.
Table 3-1. One row header requirements
# Signal Type Signal name
1 Frequency ***.F
2 Voltage ***.V or ***.VPM
3 Active power ***.P
4 Reactive Power ***.Q
5 Angle ***.A or ***.VPA
* where “***” should be replaced with a signal name
a)
b)
Figure 3-6. One row .csv file example: a) opened in text editor; b) opened in Excel.
The four rows header file according to the Western Electric Coordinating Council [9] should have the
following structure:
Line 1 – signal names
Line 2 – signal type
Line 3 – units
Line 4 – description.

3.6
An example of a four rows input file is shown in Figure 3-7.
a)
b)
Figure 3-7. Four rows .csv file example: a) opened in text editor; b) opened in Excel.
3.5 Event Database Panel
The events database screen is used to view the information about all frequency events available for
analysis (Figure 3-8). Non-qualifying events are highlighted using gray color and they are not used for
system baselining and statistical analysis. When a user selects any event from the list of event
characteristics panel, the event plot panel are updated automatically to display detailed information about
the selected event. The selected event is also highlighted at the baselining plot.
Figure 3-8. Events database screen.
The FRAT archives all information in the frequency events database. The .csv file is used to store
frequency events information. The structure of the database is given in Table 3-2.
Non
qualifying
event (gray)
Selected event
(blue)

3.7
Table 3-2. Event characteristics columns definition Column Name Definition
Event Description
Name Event name
Date Event date
Time Event time
Day Day of week
Qualifying event Qualifying event (Yes or No)
Load/
Generation
Generation loss Generation loss
Load loss time Load loss time
Load loss Load loss
Total generation Total generation
Thermal generation Thermal generation
Hydro generation Hydro generation
Wind generation Wind generation
BA generation loss BA generation loss
BA generation BA generation
BA thermal generation BA thermal generation
BA hydro generation BA hydro generation
BA wind generation BA wind generation
Time/
Frequency
Initial time Initial time
Minimum time Minimum time
Settling time Settling time
Initial frequency Initial frequency
Minimum frequency Minimum frequency
Settling frequency Settling frequency
Frequency 20 Frequency at 20 seconds
Frequency 30 Frequency at 30 seconds
Frequency 60 Frequency at 60 seconds
Frequency 90 Frequency at 90 seconds
NERC
Performance
FA NERC Frequency at point A
FB NERC Frequency at point B
FRM NERC Interconnection frequency response measure (MW/0.1Hz)
PA Interchange Interchange at point A
PB Interchange Interchange at point B
FRM BA Frequency response measure of the balancing authority (MW/0.1Hz)
PA Generation Generation power at point A
PB Generation Generation power at point B
FR Gen BA FRM calculated using balancing authority generation
Additional
Performance
Indexes
FRM Min Interconnection FRM at point C (minimum point)
FRM B Interconnection FRM at point B
FRM 20 Frequency response measurement at 20 seconds
FRM 30 Frequency response measurement at 30 seconds
FRM 60 Frequency response measurement at 60 seconds
FRM 90 Frequency response measurement at 90 seconds
3.6 Event Characteristics Panel
Event characteristics panel displays information about a frequency event (Figure 3-9). This
information is arranged in several groups. Each group can be collapsed or expanded to save the screen
space using expand/collapse button .

3.8
3.6.1 Event Description Group
The event description group includes information on event name, event date, and time. Day of the
week is identified automatically based on the date of event. The user also can add some comments to the
event. The event description also provides information on the status of the event (qualifying/non-
qualifying) using a check box.
Figure 3-9. Event characteristics screen

3.9
3.6.2 Load/Generation Group
Load/generation group includes information on interconnection and BA generation/load including:
Generation loss
Load loss size and time
Total generation
Thermal generation
Hydro generation
Wind generation.
3.6.3 Time/Frequency Group
Time/frequency group includes information on the interconnection frequency including:
Initial time and frequency
Minimum time and frequency
Settling time and frequency
Frequency at time t0+20, t0+30, t0+60, and t0+90.
3.6.4 NERC Performance Group
The NERC performance group includes information on interconnection frequency values, BA
interchange values, and interconnection/BA FRM indexes:
Point A frequency
Point B frequency
Point A interchange value
Point B interchange value
Interconnection FRM
BA FRM
Point A BA generation
Point B BA generation
BA FRM based on generation.
3.6.5 Additional Performance Indexes Group
Additional performance indexes group includes information on additional interconnection indexes
calculated by FRAT including:
FRM at minimum point
FRM at settling point
FRM at time t0+20, t0+30, t0+60, and t0+90.
3.7 Event Plot Panel
The event plot panel displays the event graph (Figure 3-10). It consists from several subplots to
display frequency, active power and voltage graphs. Additional panels with graph settings can be
These three parameters are not part of the
NERC BAL-003-01 Standard

3.10
collapsed or expanded on the left side of the screen using expand/collapse button . Graph settings
include a set of checkboxes to:
Turn on and off frequency, active power and voltage subplots
Turn on and off performance points
− NERC points A and B (red horizontal dashed lines)
− Initial point (F0)
− Minimum point (Fmin)
− Settling point (Fsettling)
− Frequency at time t0+20, t0+30, t0+60, and t0+90
Turn on and off the legend
To select PMU and SCADA measurements to be displayed
To turn on and off the mean frequency curve calculated based on the selected frequency
signals.
The user can pan and zoom the plot as well as copy it to clipboard. The plot can be controlled using
the following actions:
Mouse wheel – to zoom the plot
Mouse wheel over an axis - to zoom only selected axis
Hold left mouse button and move the mouse to pan the plot
Press “A” button to reset the plot to initial (auto) ranges
Press Ctrl+C to copy the plot to clipboard
Hold Ctrl + right mouse button – to select an area to display
Figure 3-10. Event plot screen.

3.11
3.8 FRM Baseline and Statistical Analysis Screen
The baselining panel displays the FRM baseline plot for interconnection and BA (Figure 3-11). The
screen consists from two tabs. The first tab is for interconnection analysis and the second tab is for BA
analysis. On the right side of the screen, it also includes the statistical analysis panel that can be collapsed
or expanded using expand/collapse button . The plot settings panel is located on the left side of the
screen and it can be also expanded.
Figure 3-11. Baseline plot screen
3.8.1 Baseline Plot
Based on the statistical information collected in the database, the FRAT is capable of generating
different type of plots illustrating system frequency response characteristics. The baselining plot shown in
Figure 3-11 illustrates changing of interconnection FRM (MW/0.1 Hz) from the selected time range. The
size of points in the baselining plot depends on the size of the disturbance. The different types of plot are
also available. For example, the FRAT can correlate FRM metrics with the size of event or with
generation mix (hydro, thermal, wind and solar generation).
The user can select any dots on the baseline plot to get information about this event. The information
and graphs at the event characteristics and event plot panels are updated automatically when a user clicks
on the event at the baseline plot.
Interconnection and
BA tabs Range selector Range presets
Baseline plot Statistics Plot parameters

3.12
At the bottom of the baseline plot there is a range selector to select the studied range (see Figure
3-12). There is also a drop-box list with range. For example, only the current year or 1 year window can
be selected.
Figure 3-12. Baseline plot range selector
Baseline plot settings panel includes the following elements:
Check boxes to select performance metrics to display (FRM at minimum point, FRM at point
B, FRM at settling point, FRM at time t0+20, etc.)
Plot X-axis type (date, time, disturbance size, generation mix, etc.)
Turn on/off linear regression curve.
3.8.2 FRM Statistical Analysis
The statistical analysis screen includes FRM probability density function (PDF) plot and information
of the FRM statistical parameters (mean value, median value and Standard deviation) for the selected
range (Figure 3-13).
Figure 3-13. Statistical analysis of the interconnection FRM
The FRAT also performs linear regression analysis to estimate the FRM time trend. A linear
regression equation is a statistical model to describe the relationship between time and FRM. The
equation can be expressed as follows:
𝐹𝑅𝑀 = 𝐴 ∗ 𝑇𝑖𝑚𝑒 + 𝐵 (3.1)
3.13
where FRM is the frequency response measurement value (MW/0.1Hz).
Time variable represents a time that could be years, months, days, hours, minutes and seconds. A is
the slope of the regression line and B is the intercept of the regression line.
To calculate parameter A and B, the error between the regression line and the real data should be
minimized.
min ∑ (𝑦𝑖 −𝑁𝑖=1 �̃�𝑖) (3.2)
where 𝑦𝑖 is the ith FRM data and �̃�𝑖 = 𝐴𝑥𝑖 + 𝐵, 𝑥𝑖 is the i
th time data and N is the total number of
data.
The linear regression problem is solved using a least squares method. Details on this method can be
found in NERC Frequency Response Initiative Report [3] and Weinstein[10].
3.9 Editing Event Database
To edit an event in the database, the user should select this event in the “events database” screen and
then click the “edit” button . After the FRAT switched to the “edit” mode, the background of the
frequency plot is changed to yellow color (Figure 3-14). In edit mode, the user can manually adjust the
values of the initial, minimum, and other points. To manually adjust the location (value) of the point,
select it using the mouse. Then, to move the selected point, press and hold the left mouse button. Drag the
point to a new location. When the initial point is adjusted, the values of t0+20, t0+30, t0+60, and t0+90
points are updated automatically. The FRAT also recalculates FRM values every time the FR
performance points are modified.

3.14
Figure 3-14. Event plot in “edit” mode.
In edit mode, the user also can change the values generation/load loss, generation production, and
other parameters at the event characteristics screen. The name of event can be also changed. To save the
modified information in the database, the “save” button should be pressed.
To delete an event, select this event and then click the “delete” button .
3.10 Adding New Event
To add a new event, click the “add event” button . The user will be asked to select the input file
with the SCADA and/or PMU information. Input file requirements are given in Section 3.4.
The FRAT provides the initial estimates of the following parameters:
1. Initial point: f0 – pre-fault frequency;
2. Point A frequency (average frequency at interval t0-16 to t0)
3. Minimum point: fmin – minimum frequency value (frequency nadir);
4. Settling point: fsettle – settling frequency value;
5. Point B frequency (average frequency at interval t0+20 to t0+52)
6. Frequency at time t0+20s: f20;
7. Frequency at time t0+30s:f30;
8. Frequency at time t0+60s:f60;
9. Frequency at time t0+90s:f60;
Select and move the point to a new location moving the mouse and holding the left mouse button

3.15
At the next step, the user can visually inspect the results of estimation and adjust estimated points if it
is necessary. The points’ adjustment procedure is similar to the editing process explained in the previous
section (Section 3.9).
The user also should provide the size of event (generation loss), specify the date and time of event,
and enter the name of event.
After the user confirms that parameters estimation is correct and enters the size of disturbance, the
tool calculates frequency response performance characteristics:
1) FRM at point B according to the NERC BAL-003-01 Standard
2) FRM at minimum point, MW/0.1 Hz
3) FRM at settling point, MW/0.1 Hz
4) FRM at time 20 sec, MW/0.1 Hz
5) FRM at time 30 sec, MW/0.1 Hz
6) FRM at time 60 sec, MW/0.1 Hz
7) FRM at time 90 sec, MW/0.1 Hz.
The FRM metrics are calculated for the interconnection and for the BA. To save the new event in the
database, the “save” button should be clicked. After the new event is entered to the database, the baseline
plot is updated automatically.
3.11 FRAT Report Generation
To open the report window, the “show report” button should be clicked. The report screen is
shown in Figure 3-15. To generate the report, the “FR report” button should be pressed. To include event
plots in the report, the “add event plot” checkbox can be selected. Figure 3-15 shows an example of the
report automatically generated be FRAT. The generated report can be copied to the clipboard or saved to
the file in MS Word format by pressing the button “save” button.
To generate FRS 1 form, the “NERC FRS1”button can be pressed. An example of FRS 1 form report
is given in Figure 3-16.

3.16
Figure 3-15. Frequency response analysis report screen
Figure 3-16. FRS 1 form.
3.12 FRAT Requirement
Operating system: Windows XP or higher.
Prerequisites: Microsoft .Net 4.0 Framework

3.17
Hardware requirements: should meet Microsoft .NET 4.0 system requirements
3.13 Program Repository
The FRAT repository is: https://svn.pnl.gov/FRTool
The repository is based on Trac technology. Trac is a web-based software project management and
bug/issue tracking system. It also provides an integrated Wiki, an interface to version control systems
(Figure 3-17).
Registered users can get access to the latest version of the tool, contribute to the program source code,
manuals (using integrated Wiki) as well as create new tickets (in case of bugs/issues detected). Program
documentation is also available (Figure 3-18); it is automatically generated using a Doxygen document
generator1.
Figure 3-17. FRAT repository (main Wiki page)
1 http://www.stack.nl/~dimitri/doxygen/index.html

3.18
Figure 3-18. FRAT documentation
4.1
4.0 FR of the Western Interconnection
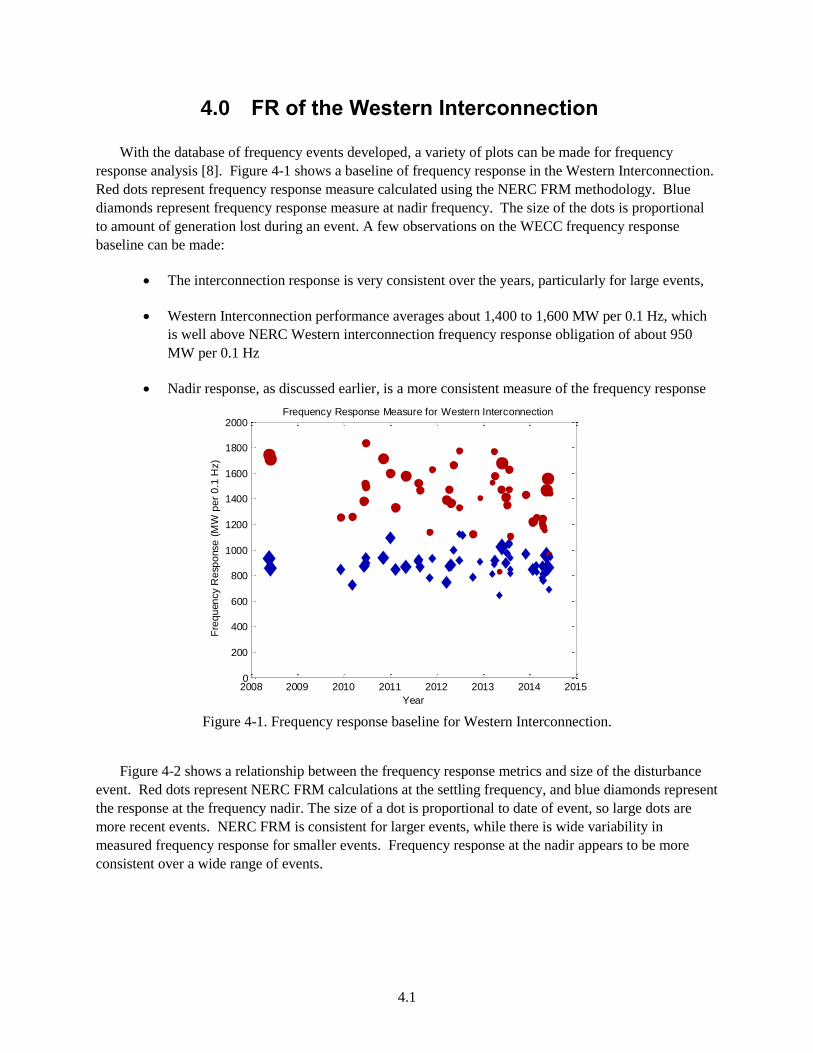
With the database of frequency events developed, a variety of plots can be made for frequency
response analysis [8]. Figure 4-1 shows a baseline of frequency response in the Western Interconnection.
Red dots represent frequency response measure calculated using the NERC FRM methodology. Blue
diamonds represent frequency response measure at nadir frequency. The size of the dots is proportional
to amount of generation lost during an event. A few observations on the WECC frequency response
baseline can be made:
The interconnection response is very consistent over the years, particularly for large events,
Western Interconnection performance averages about 1,400 to 1,600 MW per 0.1 Hz, which
is well above NERC Western interconnection frequency response obligation of about 950
MW per 0.1 Hz
Nadir response, as discussed earlier, is a more consistent measure of the frequency response
Figure 4-1. Frequency response baseline for Western Interconnection.
Figure 4-2 shows a relationship between the frequency response metrics and size of the disturbance
event. Red dots represent NERC FRM calculations at the settling frequency, and blue diamonds represent
the response at the frequency nadir. The size of a dot is proportional to date of event, so large dots are
more recent events. NERC FRM is consistent for larger events, while there is wide variability in
measured frequency response for smaller events. Frequency response at the nadir appears to be more
consistent over a wide range of events.
2008 2009 2010 2011 2012 2013 2014 20150
200
400
600
800
1000
1200
1400
1600
1800
2000
Year
Fre
qu
en
cy
Re
spo
nse
(M
W p
er
0.1
Hz)
Frequency Response Measure for Western Interconnection

4.2
Figure 4-2. Relationship between event size and historic frequency response measure
Figure 4-3 shows a relationship between frequency deviations at nadir (C) and settling (B) points. The
ratio appears to increase with larger events, as expected from the system physics.
Figure 4-3. Ratio between frequency deviations at nadir (C) and settling (B) points
500 1000 1500 2000 2500 30000
200
400
600
800
1000
1200
1400
1600
1800
2000
Event Size (MW)
Fre
qu
en
cy
Re
spo
nse
(M
W p
er
0.1
Hz)
Frequency Response Measure for Western Interconnection
500 1000 1500 2000 2500 30000
0.5
1
1.5
2
2.5
Event Size (MW)
Fre
qu
en
cy
Na
dir
to S
ett
le R
ati
o
Frequency Nadir to Settle Ratio for Western Interconnection
5.1
5.0 Conclusions
Frequency response is a measure of an interconnection’s ability to stabilize frequency
immediately following the sudden loss of generation or load. Recently, NERC developed the
Frequency Response BAL-003-1 Standard. The Standard was approved by FERC with an
effective date April 1, 2015.
PNNL, in cooperation with BPA and WECC JSIS, developed a tool to automate the analysis of
interconnection/balancing authority frequency response. The PNNL FRAT 2.0 application was
released under an open source license in August 2014. The FRAT is a standalone Windows
application developed in VB.NET using Microsoft Visual Studio 2012. The tool is based on the
WPF technology and has advanced visualization capabilities and a user friendly GUI.
The FR analysis tool calculates NERC frequency response measure (FRM) using PMU and/or
SCADA measurements according to BAL-003-01 Standard. The tool also archives the historic
events, baselines the system performance and automatically generates reports.
The developed PNNL FRAT application has been used by interconnections and balancing
authorities for a FR performance analysis and baselining.
The FRAT application was presented at industrial events including:
− NERC Frequency Working Group
− NERC Resources Subcommittee
− ERCOT Phasor Measurement Task Force
− WECC JSIS
− WECC Modeling and Validation Work Group (MVWG)
− Webinars for ISO New England and ERCOT.
The tool received very positive feedback from the industry. Multiple entities expressed their
interest to start testing and using the tool (including ISO New England, ERCOT, and NERC
Frequency Working Group). The industrial users also provided valuable feedback for the
continuing research. Based on the industry feedback, the major improvement of the tool should be
extending the tool functionality to perform FR analysis of the individual generation units.
The FRAT industry outreach will include:
− Working closely with NERC (primarily with NERC Resources Subcommittee and
Frequency Working Group) to promote nationwide dissemination of the tool among BAs
and other electrical utilities.
− Working closely with NERC and CERTS to establish continuing support and
maintenance of the FRAT.
− Working with BPA, ISO New England, ERCOT, WECC, and other BAs and utilities to
provide them FR tool support and also to receive their feedback.
− Making presentations at NASPI, WECC JSIS, WECC MVWG, IEEE and other industrial
meetings and workshops.
The FRAT repository and online documentation can be found at: https://svn.pnl.gov/FRTool

6.1
6.0 References
[1] Federal Energy Regulatory Commission, Docket RM13-11, Frequency Response and Frequency
Bias Setting Reliability Standard, 144 FERC ¶ 61,057 (July 18, 2013) (NOPR).
[2] North American Electric Reliability Corporation. 2014. “NERC BAL-003-1 Frequency Response
and Frequency Bias Setting Reliability Standard”, Atlanta, GA.
[3] North American Electric Reliability Corporation, “NERC Frequency Response Initiative Report”
(2012), Atlanta, GA. October 2012, Available:
http://www.nerc.com/docs/pc/FRI%20Report%209-16-12%20Draft.pdf.
[4] Eto J. et al. 2010. “Use of Frequency Response Metrics to Assess the Planning and Operating
Requirements for Reliable Integration of Variable Renewable Generation.” LBNL-4142E,
Lawrence Berkeley National Laboratory, Berkeley, CA. Available:
http://www.ferc.gov/industries/electric/indus-act/reliability/frequencyresponsemetrics-report.pdf.
[5] Western Electricity Coordinating Council. 2004. “WECC White Paper on Frequency Response
Standard”, Salt Lake City, UT. Available:
http://www.wecc.biz/Standards/Development/wecc0044/Shared%20Documents/Posted%20for%2
0OC%20Approval/FRR%20White%20Paper%20v12_Tables_8-9.doc).
[6] Federal Energy Regulatory Commission, Docket AD13-8. 2013. “Market Implications of
Frequency Response and Frequency Bias Setting Requirements” (144 FERC ¶ 61,058, July 18,
2013).
[7] Kosterev D. 2004. “Hydro-Turbine Model Validation in Pacific Northwest.” IEEE Transactions
on Power Systems, vol.19, no. 2, May 2004, pages 1144–1149.
[8] Kosterev D., D. Davies, P. Etingov, A. Silverstein, and J. Eto. 2014. ”Using Synchrophasors for
Frequency Response Analysis in Western Interconnection.” CIGRE Grid of the Future
Symposium, Houston, TX, USA, October 19 - 21, 2014.
[9] Western Electricity Coordinating Council. 2013. “WECC Guideline for Data Format Used in
Engineering Analysis Applications of Disturbance and Simulated Data.”, Salt Lake City UT,
August 2013. Available: https://www.naspi.org/File.aspx?fileID=1210
[10] Weinstein E.W., "Least Squares Fitting.", MathWorld - A Wolfram Web Resource. Available:
http://mathworld.wolfram.com/LeastSquaresFitting.html

