frequency distributions of escherichia coli subtypes in
TRANSCRIPT

University of South FloridaScholar Commons
Graduate Theses and Dissertations Graduate School
11-21-2003
Frequency Distributions of Escherichia coli Subtypesin Various Fecal Sources Over Time andGeographical Space: Application to BacterialSource Tracking MethodsMatthew A. AndersonUniversity of South Florida
Follow this and additional works at: https://scholarcommons.usf.edu/etdPart of the American Studies Commons
This Thesis is brought to you for free and open access by the Graduate School at Scholar Commons. It has been accepted for inclusion in GraduateTheses and Dissertations by an authorized administrator of Scholar Commons. For more information, please contact [email protected].
Scholar Commons CitationAnderson, Matthew A., "Frequency Distributions of Escherichia coli Subtypes in Various Fecal Sources Over Time and GeographicalSpace: Application to Bacterial Source Tracking Methods" (2003). Graduate Theses and Dissertations.https://scholarcommons.usf.edu/etd/1324

Frequency Distributions of Escherichia coli Subtypes in Various Fecal Sources Over
Time and Geographical Space: Application to Bacterial Source Tracking Methods
by
Matthew A. Anderson
A thesis submitted in partial fulfillment of the requirements for the degree of
Masters of Science Department of Biology
College of Arts and Sciences University of South Florida
Major Professor: Valerie J. Harwood, Ph.D. Earl McCoy, Ph.D. John Lisle, Ph.D.
Date of Approval: November 21, 2003
Keywords: Fecal coliforms, Indicator Organisms, Ribotyping, Antibiotic Resistance Analysis, Population Biology
© Copyright 2003, Matthew Anderson

Table of Contents List of Tables iii List of Figures iv Abstract vi Chapter 1. Introduction and Objectives 1 E. coli as an Indicator Organism 1 Bacterial Source Tracking 3 Non Library-Based BST Methods 4 Library-Based BST Methods 6 Methods for Defining the Population Structure of E. coli in the Feces of
Animals 10 Population Structure of E. coli 14 Variability in Pathogenic E. coli Strains 14 Variability of E. coli Within Host Species 15 Population Structure of E. coli Within Individual Hosts 16 Using Diversity Indices to Measure Variability in E. coli Populations 18 Applying Knowledge of the Population Genetics of E. coli to BST 19 Host Specificity 20 Temporal Stability 21 Primary versus Secondary Habitats 22 Geographic Variability in E. coli Populations 23 Objectives 24 Chapter 2. One-Time Intensive Sampling of Feces from Cattle, Horses and Humans 26 Materials and Methods 26 Sample Collection 26 Ribotyping 27 Antibiotic Resistance Analysis (ARA) 29 Statistical Analysis 31 Results 34 Population Distribution of E. coli Subtypes within Source
Categories 34 Pattern Sharing within and Between Source Categories 43
Discussion 48
i

Chapter 3. Sampling of Individual Host Animals From Three Source Categories Over Time 52 Materials and Methods 52 Sample Collection and Processing 52 Results 54 Population Structure of E. coli within Individuals Over Time 54 Pattern Overlap Between Individuals within a Source Category
Over Time 67 Ribotyping 67 Antibiotic Resistance Analysis 69
Discussion 72 Chapter 4. Intensive Sampling of E. coli from One Human for One Month 76 Materials and Methods 76 Sample Collection and Processing 76 Results 77
Distribution of Ribotypes and Antibiotic Resistance Profiles Found in Human X Over Time 77
Discussion 84 Chapter 5. Sampling of Cattle Herds From Four Geographic Regions 87 Materials and Methods 87 Sample Collection and Processing 87 Results 88 Population Structure of E. coli in Various Herds of Beef Cattle 88 Discussion 95 Chapter 6. Discussion-Applications for Bacterial Source Tracking 98 References 104
ii

List of Tables
Table 1 PCR program used for the synthesis of the 16S rDNA probe. 29 Table 2 Antibiotics and their concentrations used for antibiotic resistance
analysis of E. coli isolates. 30 Table 3 Diversity measurements of the population structure of E. coli within
individuals from different source categories using ribotyping. 35
Table 4 Significance values determined by comparing the means of all diversity measurements obtained from each source category. 36
Table 5 Diversity measurements of the population structure of E. coli within
individuals from different source categories using antibiotic resistance analysis. 38
Table 6 Significance values determined by comparing the means of all Diversity measurements obtained from each source category. 39
Table 7 The proportion of E. coli subtypes shared between multiple source
categories. 47 Table 8 Ribotype sharing between individuals within the same source
category over time. 68
Table 9 Antibiotic resistance pattern sharing between individuals over time for humans (A), cattle (B) and horses (C). 71
Table 10 Antibiotic resistance patterns (ARPs) of E. coli sampled from
human X. 80 Table 11 Diversity measurements of E. coli populations within beef cattle
individuals from different herds. 89 Table 12 Percentage E. coli ribotypes shared between each of the herds. 92 Table 13 Chi-square values for comparison of the frequency of ribotype
sharing between herds. 93
iii

List of Figures
Figure 1 Example of a similarity dendrogram of ribotypes created using
the Dice coefficient.. 33 Figure 2 Equations for the parameters used to define E. coli population
structure. 33 Figure 3 Accumulation curves representing the number of unique patterns
versus sampling effort for horses, humans, and cattle. 42 Figure 4 Proportion of E. coli isolates that demonstrate pattern sharing
between different individuals from the same source category. 44 Figure 5 The E. coli population structure over time within Human A. 56 Figure 6 The E. coli population structure over time within Human B. 57 Figure 7 The E. coli population structure over time within Human C 58 Figure 8 The E. coli population structure over time within Cow A. 61 Figure 9 The E. coli population structure over time within Cow B. 62 Figure 10 The E. coli population structure over time within Cow C. 63 Figure 11 The E. coli population structure over time within Horse A. 64 Figure 12 The E. coli population structure over time within Horse. 65 Figure 13 The E. coli population structure over time within Horse C. 66 Figure 14 A ribotype gel using Hind III representing isolates from the first
two days of sampling from human X. 77 Figure 15 A ribotype gel using Pvu II representing isolates from the first two
days of sampling from human X. 77
iv

Figure 16 Distribution of ARPs of E. coli isolates sampled from human X. 78 Figure 17 Similarity dendrogram for antibiotic resistance patterns of E. coli
isolated from human X. 81 Figure 18 Distribution of antibiotic resistance patterns over time for E. coli
isolated from human X. 82 Figure 19 Distribution of ribotypes over time for E. coli isolated from
human X. 82 Figure 20 Frequency of observations of E. coli ribotype/ARP combinations
in human X. 83 Figure 21 Sharing of E. coli ribotypes within and between herds, expressed as
percentages of total E. coli isolates isolated from a given herd. 91 Figure 22 A similarity dendrogram of ribotypes generated from a subset of
E. coli isolated from four cattle herds. 94
v

Frequency Distributions of Escherichia coli Subtypes in Various Fecal Sources Observed Over Time and Geographical Space: Application to Bacterial Source Tracking Methods
Matthew A. Anderson
ABSTRACT
Bacterial source tracking (BST) methods often involve the use of phenotypic or
genotypic fingerprinting techniques to compare indicator bacteria such as Escherichia
coli isolated from unknown sources against a library of fingerprints from indicator
bacteria found in the feces of various known source animals. The predictive capability of
a library is based in part on how well the library isolates reflect the true population
diversity of indicator bacteria that can potentially impact a water body. The purpose of
this study was to compare the behavior of E. coli population structures in the feces of
humans, beef cattle and horses across different parameters. Ribotyping and antibiotic
resistance analysis were used to “fingerprint”, or subtype E. coli isolates. Significantly
greater diversity was observed in the E. coli population of horses compared to the human
or beef cattle sampled. Subtype sharing between individuals from all host categories was
infrequent, therefore the majority of E. coli subtypes were sampled from a single
individual. The dominant E. coli populations of nine individuals (three per host source
category) were monitored over time, which demonstrated that E. coli subtypes within a
host individual vary on a monthly time frame, and an increase in the frequency of
subtype sharing was noted between individuals within the same source group over time.
vi
The E. coli population of a single human that had just finished antibiotic treatment was
studied on a daily basis for one month. The loss of an E. coli subtype with high antibiotic
resistance was observed over time, however there was a single dominant E. coli subtype
that was present at every sampling event during the entire month. Geographic
distinctiveness of E. coli populations was investigated by sampling four herds located in
different geographical regions. We observed that E. coli populations are not
geographically distinct, but are somewhat individual-specific, as most E. coli isolates had
a subtype that was found in a single individual. This study defines factors that should be
considered when constructing a successful BST library, and suggests that E. coli may not
be the appropriate indicator organism for BST.
vii

Chapter 1. Introduction and Objectives
E. coli as an Indicator Organism
When water has been polluted by fecal material it may pose a health risk to
humans who become exposed to this water either through drinking or recreational use (i.e
swimming). Waters contaminated by fecal material can also present a threat to the food
industry, particularly in the case of shellfish. Fecal material, particularly that of human
origin, may contain pathogenic bacteria, such as Salmonella spp, and Shigella spp, and
pathogenic viruses, such as enteroviruses and rotaviruses, which cause human disease (6).
Because of this danger, methods have been established to monitor the sanitary conditions
of water by measuring the levels of indicator microorganisms in water samples (1).
Water samples cannot feasibly be tested for every enteric pathogen that could be
present because: 1) standardized laboratory tests are not available for many pathogens,
and 2) previously undiscovered pathogens may be present that cannot be detected by any
currently devised test (60). The indicator microorganism represents a relatively rapid,
simple way to test water for the possibility of fecal pollution; however, not every
organism that could be found in feces can act as a successful indicator microorganism.
An effective indicator microorganism must have several qualities (44): 1) the organism
should be non-pathogenic, 2) the organism should correlate well with the presence of
enteric pathogens, 3) the organism needs to survive as long, if not longer, then the
1

hardiest waterborne pathogen, 4) the organism should survive but not be able to
reproduce in natural waters, and finally, 5) the organism should be easy to test for and the
method for detection should be rapid.
Early in the 20th century it was suggested that members of the coliform group
(total coliforms) be used as bacterial indicators for fecal pollution in waters (2). The
coliform group is characterized as facultatively anaerobic, nonspore forming, gram
negative rods that are found in the intestines of warm-blooded animals. Coliforms
produce gas from the fermentation of lactose at 37°C within 48 h. Members of this group
include species of the genera Klebsiella, Citrobacter, Enterobacter, and Escherichia (6).
A subgroup of the total coliforms is the fecal coliform group. Fecal coliforms
differ from the total coliform group by their ability to grow at 44.5° C and includes the
genus Escherichia and some members genus Klebsiella (6). The fecal coliform group,
most notably Escherichia coli, is one of the primary indicator organisms used when
monitoring for fecal pollution in fresh and potable waters (18). E. coli has many
characteristics of a good indicator. It is generally non-pathogenic, there are standard
methods of enumeration which are simple and rapid (18-24 hours), and it is found in
large numbers in the feces of all warm blooded animals and some cold blooded animals
(32).
Fecal coliforms have been used as a standard of monitoring waters for fecal
pollution; however recent studies have shown that fecal coliforms may have certain
attributes that make them less than ideal indicators. Some studies have shown that fecal
coliforms may be able to persist and even multiply in tropical and subtropical waters and
sediment (9, 74) while other studies have demonstrated that fecal coliforms do not
2

correlate well with the survival of pathogenic viruses (21, 45, 87) These results have led
scientists to investigate the potential of other organisms as indicators of fecal pollution in
waters.
Bacterial Source Tracking
The ability to identify the presence of fecal pollution in waters is only the first
step in water quality assessment and control. One problem with using indicator
microorganisms to detect fecal pollution is that generally, as in the case of E. coli, the
organism is found in the feces of many different animals. More information about the
source of the fecal pollution is needed to make reliable inferences about the probability of
the presence of human pathogens. There are many benefits to knowing the source of
fecal pollution. When assessing microbial risk, it is important to know if the fecal
pollution is of human origin because human feces generally contains more pathogenic
organisms than animal feces (41). Locating the source of fecal pollution can also assist in
cleaning up and possibly preventing any further contamination of the impacted water
body (28).
Recent studies have attempted to develop a method capable of tracing indicator
microorganisms found in polluted waters back to their source (i.e. animal species or point
source). These methods are known as bacterial source tracking (BST) or microbial
source tracking (MST) (72). To date, no standard or universally accepted BST method
has been developed. The existing methods can be divided into two broad categories;
library-based techniques and non library-based techniques.
3
Non Library-Based BST Methods
Non library-based BST methods are predicated on the hypothesis that the chosen
indicator microorganism demonstrates some degree of host specificity. One of the first
BST methods to be developed compared the concentration of fecal coliforms found in a
water sample to the concentration of fecal streptococci present (20). The technique,
known as the fecal coliform to fecal streptococci ratio (FC/FS), was used to determine
animal vs. human origin of fecal pollution. The authors hypothesized that humans tend to
have much larger concentrations of fecal coliforms than fecal streptococci in their feces,
and that the ratio is reversed in all other animals. The authors proposed that a FC/FS
ratio < 0.7 indicated pollution from a non-human host, and ratios ≥ 4 indicated human
origin. The advantage to this technique is the simplicity and speed with which it is
conducted, as results are obtained in 24-48 hrs. A problem with this technique is that
studies have demonstrated fecal coliforms and fecal streptococci do not have equal
survival rates in marine waters (30, 47). Meaning that the resulting ratio would not be
applicable unless the waters were sampled at the moment of pollution. Furthermore, it
has been observed (17, 73) that the proposed FC/FS ratios do not hold true for all animal
species and that different individuals of the same species can have very different FC/FS
ratios. Some humans have with large amounts of fecal streptococci in their feces, while
animals have been observed with very high levels of fecal coliforms. For these reasons,
the FC/FS ratio is not used today.
It has been argued that the survival rate of current indicator bacteria does not
correlate well with the survival of viruses in water (21, 45, 87). It is therefore important
to develop BST methods using organisms that have similar, if not greater survival rates
4

than pathogenic viruses in aquatic environments. One such BST method uses male
specific (F+) RNA coliphages as the indicator organism of fecal pollution. F+ coliphages
are viruses specific to coliforms and attach to the sex pili of these bacteria (77). The F+
RNA coliphages can be divided into four major groups (I, II, III, IV) by serotyping (58).
Testing fecal samples from many different animals, including humans, established a link
between the source of the coliphage and its serotype. Human feces tend to be populated
with coliphages of serotypes II or III. Animal feces are usually dominated by coliphages
of serotype I and sometimes IV. An exception is pig feces, which also contain serotype II
coliphages. Using this information it may be possible to identify the source of fecal
pollution by serotyping the F+ RNA coliphage found in polluted waters (58). A study by
Hsu et al. attempted to improve upon this technique by using oligonucleotide probes to
identify these four groups rather than serotyping (37). The study found that genotypic
probing was as accurate as serotyping, however genotypic probing was more rapid and,
more importantly, less expensive than serotyping. An advantage to using this method is
that the process only involves one major step (serotyping or probing) in order to
determine the source of pollution. The disadvantage to using this method is that
discrimination can only be achieved on the human vs. nonhuman level; currently,
identification of a specific animal source is not possible. Another disadvantage to this
method is that studies have shown that not all individuals harbor F+ RNA coliphage in
their feces (34). Meaning that although fecal pollution may be identified using standard
fecal coliform counts, if there are no coliphage present, the source cannot be determined.
5

Library-Based BST Methods
Library-based methods work by subtyping (“fingerprinting”) the test organism,
and creating a known source library of these fingerprints which acts as a predictive tool
to determine the source of fecal pollution. The first step in making the known source
library is to collect fecal samples from a host species, then isolate bacteria from a number
of different individuals within the specific host species. These isolates are then subtyped
with the chosen technique, and their patterns are entered in the library. The library
should consist of isolates collected from source animals that could potentially pollute the
watershed being studied. Enough isolates should be collected from each source category
in order to adequately represent the dominant fingerprints in the indicator organism
population.
Once the library is complete it acts as a predictive tool to determine the origin of
fecal pollution found in the watershed. To accomplish this task, environmental isolates
are collected from the polluted waters and typed using the chosen technique. These
patterns are compared to those in the library and the most probable source of the isolate is
determined. Although the basic process is similar in all library based methods, many
different subtyping techniques have been developed. These techniques can be separated
into two types: phenotypic techniques and genotypic techniques.
One of the most frequently utilized phenotypic BST techniques is known as
antibiotic resistance analysis (ARA) (84). ARA exposes each isolate to a number of
different antibiotics at varying concentrations. By scoring growth on the various
antibiotic concentrations, a fingerprint for each isolate is created. The theory behind
ARA is that different host sources are exposed to different types of antibiotics over time,
6

therefore the E. coli population within these hosts should display a level of host
specificity based on their susceptibility to antibiotics. There have been a number of
studies using ARA that have successfully discriminated between different host sources
(28, 33, 80, 86). These studies show that ARA is highly successful at distinguishing
human vs. nonhuman fecal pollution, and can distinguish between specific animal
sources at a rate that is significantly higher than random (80).
Another phenotypic BST technique is carbon utilization profiles (CUP). This
technique, which has been accomplished using the Biolog system in the U.S. (7) and the
PhenePlate system in Europe (78), assesses growth on a number of different carbon
sources (as many as 96). Hagedorn et al (27) conducted a study using CUPs to
determine sources of fecal pollution. The results of this study were very similar to those
found for ARA, i.e. the technique was successful at classifying human vs. nonhuman
pollution (~88%) but this classification rate dropped when trying to distinguish between
specific source animals. Phenotypic BST techniques have the advantage of being
relatively inexpensive and rapid compared to genotypic techniques (80), which allows the
development of a large, representative, library in a relatively short period of time.
Genotypic typing techniques make direct use of an organism’s genetic material
(i.e. DNA) in order to generate subtypes. One such method is known as ribotyping (59).
Ribotyping is a molecular method that targets the ribosomal RNA genes, i.e. the 16S
rRNA gene, in order to find genetic variation within the gene and in surrounding DNA.
The 16S rRNA gene is so highly conserved, that organisms from a single species have
nearly identical 16S rRNA genes and the genetic variation within a species is located in
the surrounding DNA due to mutations, duplications, deletions, or horizontal genetic
7

transfer between organisms. Ribotyping relies on the genetic variation in these regions to
discriminate between members of the indicator organism population. Restriction
enzymes digest genomic DNA, resulting in many different sized DNA fragments, which
are separated by electrophoresis and blotted onto a membrane. The membrane is probed
using labeled 16S rDNA probes. Any fragment containing a portion of the 16S rRNA
gene will hybridize with the probe and be detected. The result is a banding pattern
determined by the genetic structure of the test organism.
Studies have been done using ribotyping as a method of discriminating between
indicator organisms from different sources (4, 10, 59). These studies have shown that
ribotyping can potentially be useful for BST. Carson et al. (10) used a library of 287
isolates from human and various animal sources to determine the capability of their
library to discriminate between sources. Their study found that greater than 90% of the
isolates were correctly classified into the proper source categories, however, the library
used in this study was very small (287 isolates). It has been suggested that small libraries
do not adequately represent the true diversity of the indicator organism population,
resulting in misleadingly high correct classification rates for the libraries (80). One major
advantage to using ribotyping is its ability to be automated (8), which is faster, up to five
times as fast, and more reproducible due reduced variability between gels caused by
human error. However, with automation comes an increase in cost and the inability to
adjust the method at the different steps in the process.
Other genetic typing techniques have also been applied to BST. Two of these
methods are repetitive extragenic palindromic PCR (REP-PCR) (11, 16) and amplified
fragment length polymorphism (AFLP) (25, 29). Like ribotyping, these techniques
8

utilize organism’s DNA to create a fingerprint. REP-PCR primers target the short
repetitive sequences found in the genome of the organism. The multiple amplicons
generated are separated by electrophoresis, forming a pattern comprised of 20-30 bands
in E. coli (11).
Two restriction enzymes are used in AFLP to digest genomic DNA. The digested
DNA is then ligated to adaptors specific for the restriction enzymes. The different sized
fragments of ligated DNA are amplified by two rounds of PCR. The first round of PCR
uses primers specific for the adaptor regions. The second round of PCR is performed
with fluorescently labeled primers, which allow visualization of the banding pattern.
Amplicons are separated by gel electrophoresis, creating a banding pattern representative
of the genetic variability of an organism (25, 29).
All of the library-based methods discussed thus far have demonstrated some
ability to distinguish between bacteria isolated from different fecal sources, however
many of the studies that tested the effectiveness of these methods were flawed. A shared
problem in many of these studies is the size of the library constructed. Generally, a large
library (1000’s of isolates) is needed in order to adequately represent the diversity of
subtypes that could be in the test organism (80). Phenotypic methods have the advantage
of being able to produce these large libraries at a fraction of the cost necessary for
genotypic methods. Because of this difference, BST studies that use phenotypic typing
often have libraries with thousands of isolates (33, 80, 86), while studies using genotypic
typing usually have libraries of only a few hundred isolates (4, 10, 16, 59), and these
isolates are often unevenly distributed between sources.
9
Another criticism of many BST studies is the manner in which the library’s
efficacy as an effective predictive tool is tested. Most studies have utilized a self-cross of
the library, in which library isolates are the test data set and the calibration data set, to
assess the accuracy of the library (10, 11, 27, 33, 84). It has been argued that this is not
an effective test of the library’s ability to identify the source of an environmental isolate
because this method assumes that the library is an accurate representation of the total
diversity found in the test organism populaiton, which generally is not true (80).
Whitlock et al. suggested that isolates from a known source that are not present in the
library should be used as test organisms to determine the accuracy of a BST library (80).
The final flaw common to most BST methods is the lack of studies that provide
information on the population structure of the test organism within different host species.
Such information will be useful for improving current BST methods.
Methods for Defining the Population Structure of E. coli in the Feces of Animals
Many of the library-based BST methods use E. coli as the test organism to create
a library of fingerprints from known sources (10, 16, 33, 80). The choice of E. coli is
prompted in part by the fact that it is one of the standard indicator organisms used to
detect fecal pollution in recreational and drinking waters in the United States and other
countries (1) and by the fact that E. coli is found in the feces of all warm blooded
animals. It is important to observe the population structure of E. coli within hosts and to
investigate the behavior of E. coli populations across different variables (i.e. between
host sharing, temporal stability, and geographic variability) in order to maximize the
success rate of BST methods.
10

Many studies have investigated the population genetics of E. coli (14, 22, 26, 48, 57,
69, 81). One of the first methods used to broadly define the population structure of E.
coli was serotyping, which assesses differences in specific surface antigens of the cell. In
the case of E. coli the standard antigens used are the lipopolysaccharide (O), the capsular
(K) and the flagellar (H) antigen (40). In a series of studies Orskov et al. (53) and
Orskov and Orskov (54-56) found as many as 170 different O antigens, 71 different K
antigens, and 56 different H antigens, along with many combinations of the three. This
was the first data to demonstrate the extreme antigenic variability demonstrated by
members of this species. Because of this large diversity in antigen combinations,
serotypes became one of the first operational taxonomic units (OTU) to be used when
studying E. coli population structure (65).
As more studies were conducted it was found that unique serotypes do not
represent genetically distinct E. coli. This was discovered through a technique known as
multilocus enzyme electrophoresis (MLEE). MLEE was first used to study population
genetics of eukaryotic organisms (31, 42). In this process a fingerprint is developed by
measuring the electrophoretic mobility of 12-20 cellular enzymes (66). The mobility of
the enzymes through the gel is influenced by differences in their molecular weights.
These different allelic variants, known as electromorphs, of the same enzyme will
demonstrate electrophoretic bands at different positions on a gel. The presence or
absence, as well as the allelic variation, of the enzymes being used for the study will
create a unique fingerprint for the test organism known as its elecrophoretic type (ET).
Based on the MLEE results, calculations can be made to determine the genetic distance
between different ETs, which helps to establish the genetic lineage of the test organism.
11
In 1973 Milkman first used MLEE to demonstrate genetic variation in E. coli (48). The
study utilized five different enzymes and found that MLEE could be used as a method to
show variability within E. coli.
Subsequent studies compared the discriminatory capability of MLEE and
serotyping. Ochman and Selander (52) used MLEE of 12 enzymes on 142 E. coli isolates
characterized as having the K1 serotype. These isolates were obtained from human hosts
located in both Europe and the United States. Their results revealed that fourteen distinct
electrophoretic types were found within the K1 serotype. A similar study was done by
Caugant et al. (13) that directly compared serotyping and MLEE using 261 E. coli
isolates of various known serotypes. The results of this study demonstrated that the
amount of genetic diversity found within a single antigen serotype using MLEE
approaches the amount of diversity one would find if they randomly chose strains,
demonstrating that serotyping lacks significant discrimination. In one particular O
serotype (O8), six different electrophoretic types were identified out of six isolates. Not
all serotypes presented this extreme variability, but all single antigen serotypes had at
least two different electrophoretic types. Another important conclusion of this study was
that isolates were not serotyped could be typed by MLEE. Other studies were conducted
which confirmed these results, and established MLEE as the better tool for distinguishing
genetic variability in E. coli (46, 50, 62, 67).
Multilocus enzyme electrophoresis remains today a useful method for assessing
variability in E. coli. Recently, additional genetic typing methods, such as ribotyping and
restriction fragment length polymorphism (RFLP) of specific genes, have been applied to
studies of the population structure of E. coli. In 1990 Arthur et al. (3) compared the
12
ability of RFLP and MLEE to distinguish genetic variants of E. coli. RFLP analysis of
the rrn (rRNA) operons and MLEE of thirteen enzymes were conducted on E. coli
isolated from 20 patients with urinary or biliary tract infections. RFLPs of the rrn operon
correlated very well with the electrophoretic types of MLEE; isolates with identical
RFLPs had identical or closely related electrophoretic types. The methods were judged
equally discriminatory.
In 1995, Maslow et al. (46) performed a similar study using 187 E. coli isolates
from the bloodstream of human patients to compare serotyping, MLEE, and restriction-
fragment length polymorphism (RFLP) of the ribosomal RNA operon. MLEE provided
the most discrimination of all three techniques, followed by RFLP and then serotyping;
however, all identical RFLP patterns were shared by closely related electrophoretic types,
leading to the conclusion that RFLP of the ribosomal RNA genes is just as effective as
MLEE at discriminating between closely related variants of E. coli.
These data were confirmed in a study by Silveira et al. using E. coli isolated from
diseased birds. The study analyzed 69 E. coli isolates by MLEE (five enzymes) and
RFLP of the ribosomal RNA operon. MLEE distinguished 33 different electrophoretic
types, while twenty-four different RFLP patterns were observed. Although MLEE was
more discriminatory than RFLP, all RFLP patterns were shared by closely related
electrophoretic types (70). These studies indicate that subtyping E. coli populations by
typing techniques such as MLEE and RFLP, provides a more accurate representation of
the variability in E. coli populations than serotyping.
13
Population Structure of E. coli
Once it was determined that there were methods to effectively discriminate
between genetically distinct E. coli subtypes, many studies were performed to determine
the variability of E. coli in the feces of animals. These studies fall under three categories:
1.) investigations of the genetic variability in pathogenic E. coli, 2.) investigations of the
genetic variability found in the natural E. coli populations of different host species, and
3.) studies that take a closer look at the population structure of E. coli found in the feces
of individual hosts and the interactions of these E. coli populations between different
hosts. In the third category, population structure is defined as the number of different
subtypes, as well as their distributions, in the E. coli population of single individuals.
Variability in Pathogenic E. coli Strains
E. coli is a member of the natural intestinal flora of all healthy warm blooded
animals. However, some E. coli strains have the potential to cause disease in and death
of their hosts. Selander et al. (67) typed 63 E. coli isolates from infants with neonatal
septicemia or meningitis by MLEE (21 enzymes). They found 39 unique electrophoretic
types, demonstrating high genetic diversity. Isolates causing the same disease tended to
be closely related. Other studies were conducted on different human pathogenic strains
of E. coli that confirmed these results (50, 62). Not all studies have been limited to
human pathogenic E. coli. Silveira et al. (70) studied the genetic diversity found in avian
pathogenic E. coli strains by MLEE (five enzymes) and RFLP and demonstrated similar
relationships between disease symptoms and genetic subtypes. All of these studies
14
demonstrated that subtype diversity in pathogenic E. coli is high, and that strains of E.
coli causing the same disease cluster when measured using genetic distance, suggesting
that they share a lineage.
Variablity of E. coli Within Host Species
Pathogenic E. coli strains represent a small fraction of the total E. coli species.
Study of the diversity and distribution of commensal E. coli strains provides insight into
the evolution of different genetic lineages, how their distribution changes over
geographic distance, and will help refine methods of water quality assessment like
bacterial source tracking. Studies of the variability in natural E. coli populations usually
fall within two categories: 1) studies that measure variation within a species and 2)
studies that measure variation within individual hosts.
Studies that investigate the population structure of E. coli present a broad
perspective of the genetic variability that can be found within different hosts. Whittam et
al. (83) performed a study using MLEE (12 enzymes) to assess the genetic variability
found in 1,705 E. coli isolates of human origin. These isolates were collected from the
feces or urine of multiple human hosts from different regions of North America and
pooled together for analysis. Of the 302 different electrophoretic types identified, three
major groups were found using principal components analysis. Because the isolates from
individual hosts were pooled, within-individual variability could not be determined. It is
therefore, not clear whether the observed variability in E. coli was widely distributed
among individuals, or was associated with a small subset of the hosts.
15

Similar results were obtained by Gordon in his study of the E. coli population of
feral mice in two regions of Australia (22). This is a notable study because it dealt with
the E. coli of a host species other than human. One isolate was obtained from the small
intestine of each mouse. Over a period of seven months, 447 E. coli isolates were typed
by MLEE (13 enzymes) and randomly amplified polymorphic DNA (RAPD) analysis.
Fifty different RAPD genotypes and 60 unique ETs were observed, demonstrating a level
of variability similar to that found for human E. coli populations in other studies (15, 83).
It is important to note that the data in these previous studies represent an overview of the
E. coli variability in a host species without looking specifically at how this variability is
distributed among individual hosts.
Population Structure of E. coli Within Individual Hosts
Many studies of the population genetics of E. coli pool isolates collected from
individuals in order to observe the genetic variability of the E. coli populations from
within the entire host species (12, 22, 39, 68, 83). Far fewer studies have investigated
the structure of the E. coli population found in individual animals and how these
populations interact with other individuals of the same host species. Little is known
about the short-term (i.e. month-to-month) stability of E. coli populations in individual
hosts. Understanding the population structure of E. coli at the individual host level can
lead to better models of the evolutionary genetics of natural E. coli populations.
One of the first studies to investigate the population genetics of E. coli from an
individual host was performed by Caugant et al. in 1981 (15), in which a single human
was sampled over an 11-month period. Escherichia coli was isolated from fecal swabs at
16
varying intervals and was typed by MLEE (15 enzymes). This study demonstrated a high
level of subtype variability in the E. coli population of this single human through time.
The E. coli population turned over every two to four weeks, and new ETs were observed
at each sampling session. A total of 550 isolates was collected during the study, and 53
different ETs were observed. Two ETs persisted over a number of sampling dates, and
these were designated “resident strains”. The authors hypothesized that “non-resident” E.
coli types must be immigrants that are entering the population through food or
contamination and named these “transients” (14).
One disadvantage to the Caugant et al. study is that only one human was sampled.
A follow up study (14) assessed the E. coli population variability of individual members
of five different families, in two different states (New York and Massachusetts), by
subtyping E. coli isolated from the feces by MLEE (15 enzymes). Members of one
family in New York were sampled twice at an interval of three months, and all other
families were sampled once. The E. coli population of one of the human individuals
from New York demonstrated a very high level of genetic diversity in their E. coli
population. The remaining family members demonstrated very low genetic diversity in
their E. coli populations and many of these remaining members demonstrated only one
ET making up their entire E. coli population. These results demonstrated that humans
generally have an E. coli population of low genetic diversity, however a small proportion
of human individuals harbor highly variable E. coli populations (13).
Whittam performed a study of the E. coli populations found in avian hosts (81).
Escherichia coli isolates (n = 280) from five different domestic birds collected at two
sampling events per bird were typed by MLEE (13 enzymes). On average, birds
17

harbored diverse E. coli populations comprised of 4-5 ETs per individual out of twenty-
five isolates. This study is one of the few to investigate the variability of E. coli
population within individuals from a host species other than human.
Using Diversity Indices to Measure Variability in E. coli Populations
Various techniques have been discussed that subtype E. coli isolates in order to
determine the structure of E. coli populations. This type of information can be analyzed
by diversity indices, which are based on formulas that take into account both the number
of different subtypes found within a population as well as the relative abundance of these
subtypes. No one diversity index is universally accepted; however, Hill’s diversity
numbers are a well known, and well studied, family of diversity indices (35).
Three different indices that are a part of Hill’s diversity measurements are the
richness estimator (S), the Shannon index (H’), and the Simpson index (λ). The richness
estimator represents the all subtypes within a population, including the rarest subtypes
but does not take into account the abundance of these subtypes. Shannon's index is a
measure of the difficulty in predicting the identity of subsequent subtypes. In general
terms, Shannon’s index can be used as a rough measure of the abundant subtypes in a
population. This diversity measurement takes into account both the total number of
subtypes and their frequency within the population, and is one of the most widely used
diversity indices. Simpson’s index is a measure of the most abundant subtypes in a
population. It represents the probability that two subtypes chosen at random will be the
same. Because it is a probability estimate, the Simpson’s value is always between one
and zero. Often, the reciprocal of the Simpson value (1/λ) is presented to give a better
18
idea of the change in the diversity within a population. When using the reciprocal,
increasing values signify increasing diversity within the population (43).
Diversity indices have been used as tools in ecological studies to measure the
diversity of animal species within a given area. More recently, microbiological studies
have used these indices to measure the diversity of bacterial populations (4, 36, 71). A
study performed by Avery et al. (4), used Simpson’s index to measure the diversity of E.
coli O157 subtypes determined by pulsed field gel electrophoresis (PFGE) and
ribotyping. The diversity measurement was used to compare the two methods and
determine which method had a greater discriminatory ability.
Applying Knowledge of the Population Genetics of E. coli to BST
The typing techniques outlined above were originally applied to E. coli as an
attempt to understand variability in the population dynamics of this organism, generally
in large groups of animals. This information should also be useful in refining the use of
E. coli as an indicator organism for fecal pollution, and to improve the predictive
capabilities of BST methods.
Although there are many different BST methods, most of them are based on the
same assumptions. These assumptions are especially true for library-based methods.
Gordon lists four assumptions that must be met for a successful library-based BST
method regardless of the indicator organism being used for construction of the library
(23): 1) the population structure of the organism must show some degree of host
specificity, 2) the population structure of the organism should be stable through time, 3)
the genetic composition of the population should be the same in both the fecal
19
environment and the external environment (i.e. soil, water), 4) the indicator organism
population should demonstrate some geographic distinctiveness, with populations being
distinct to specific regions.
Using the information that has been gathered by previous studies on the genetic
structure of E. coli populations as a base, several studies have been performed to
determine the validity of these assumptions for E. coli.
Host Specificity
In order for BST to be effective, the microorganism being tested must show some
host specificity, ideally demonstrating some overlap between individuals from the same
source category. In a previously mentioned study, the E. coli population of feral mice
was subtyped by MLEE (12 enzymes) and 60 ETs were observed out of 447 E. coli
isolates (22). Although a large number of subtypes were observed, 48% of all E. coli
isolates shared only three ETs. Another study (19) demonstrated the sharing of E. coli
subtypes within host species using the restriction enzyme Xba I to generate restriction
endonuclease digestion profiles (REDP) of the genomic DNA of E. coli O157:H7, which
were isolated from 29 cattle located on different farms in Wisconsin. They found 20
different REDPs among the E. coli O157:H7 isolates, and observed that some REDPs
were shared between multiple cows on the same farm. Collectively, these studies suggest
that there is some degree of subtype sharing between individuals from a single host
species.
Few studies have rigorously investigated the extent to which E. coli subtypes are
shared between host species. If E. coli subtypes were shared equally among many
20
different species, BST methods would not be useful for detecting the source of fecal
contamination in water. One study demonstrated overlap of E. coli subtypes between
families and their pets (14). The E. coli isolates of five human families and their pets,
were typed by MLEE (15 enzymes). E. coli subtypes were more frequently shared within
families (including pets) than between families small percentage of the shared isolates
within families were found in both human members and their pets. Specifically one ET
was shared between humans and their dog, one ET was shared between humans and their
cat, and three ETs were shared between cats and dogs.
Temporal Stability
Gordon (23) states that for an organism to be used successfully in a BST method
the microorganism’s population structure must remain stable through time. It has been
demonstrated in a number of studies that E. coli populations from a host species do not
remain stable over time (15, 19, 22, 39). One study investigated the E. coli population
within a human host by MLEE (13 enzymes) for a period of eleven months and found
that complete turnover of the subtypes within the E. coli population occurred every two
to four weeks (15).
Studies have also noted a lack of temporal stability in hosts other than human,
including yearling steers (39). Two yearling steer herds (n = 6 per herd) were sampled
over a period of nine months, and 451 E. coli isolates were ribotyped using two
restriction enzymes (EcoRI and PvuII. The two herds were located on the same study site
(Goergia). This study demonstrated high genetic diversity in the E. coli populations of
steers over time, as 240 ribotypes were identified and only twenty of these appeared in
21

more than one sampling session. This study did not follow specific individual steers over
time, therefore variability on the individual host level could not be determined. The
important conclusion from this study was that within geographically distinct host groups
there is a high diversity in E. coli isolates collected over extended sampling periods.
All of these studies demonstrate temporal instability in E. coli populations in
various hosts, which may compromise the usefulness of E. coli for BST methods.
However, if there is a large frequency of subtype sharing within a host species, then
temporal instability of the E. coli population within an individual host may not be
detrimental to the success of BST methods. For example, if a host loses a particular
genotype at one time, that genotype may be picked up and shared by another individual
of the same host group. The genotype will continue to be specific for that host group and
hopefully will continue to discriminate source.
Primary versus Secondary Habitats
If an organism is to be used successfully in BST it must be present in the fecal
material of the host one wishes to trace. Another assumption that must be met for BST,
which is often overlooked, is that the dominant subtypes of the E. coli population found
in the feces of a given host should be the same as the dominant subtypes found in the
environmental waters and soil impacted by that host. Savageau (63) first stated the
“demand theory” that identified two separate habitats for E. coli. According to this
theory, the intestinal tract of an animal is the primary habitat of E. coli and the outside
environment (i.e. water and sediments) is the secondary habitat. Because these two
habitats represent such different conditions based on, for example temperature, nutrient
22

availability, and water availability, it is possible that certain E. coli subtypes would be
better adapted to survive in each habitat. Dominant subtypes from feces may not
represent the dominant subtypes that would survive in the external environment and
subsequently be sampled in the water.
The demand theory has been tested in several studies. MLEE was used to
compare the subtypes of the E. coli population isolated from the primary (gastrointestinal
tract feces) and the secondary habitats (litter, water) of birds (81). Escherichia coli
isolates from the two separate habitats represented genetically distinct subpopulations,
supporting the demand theory. A similar study compared E. coli populations in human
fecal samples and septic tanks of households by MLEE (thirteen enzymes) (24). In one
household there was a large difference between the E. coli populations subtypes found in
the feces versus what was found in the septic tank, while in a second household there was
no significant difference between the E. coli populations.
Geographic Variability in E. coli Populations
Whittam et al. (82) assessed the genetic variation of E. coli populations found in
humans from the countries of Sweden, Tonga, and the United States using MLEE (twelve
enzymes) and found no distinction between regions. The amount of genetic variability
sampled within a single region was just as great as the amount of variation observed
between regions. However, it is important to note that the sample size for this study was
very small, as only 178 E. coli isolates were collected from humans in three different
countries. Such under-sampling may prevent geographic variability from being observed.
The previously cited feral mouse study (22) reported analogous results. Variability in the
23
E. coli population was assigned to within-region variability rather than between-region
variability, implying that the amount of variability found within a single location is so
great that it does not allow differentiation of E. coli populations based on geography.
These studies suggest that E. coli populations are not geographically distinct.
However, it is important to understand the limitations of these studies. As mentioned
earlier, the total E. coli populations were probably under-sampled, and as more E. coli
isolates are collected from these different regions, a larger degree of geographic
separation may become evident. Another difficulty with studying geographic variation is
determining how large or how small a region needs to be in order observe distinct
populations. In all of the previous studies, the different sampling regions were vast
distances apart. While this would seem to promote greater geographic variation, it may
be possible that E. coli populations are, in fact, geographically distinct but on a much
smaller scale. Beyond this scale, the large genetic variability inherent in the species will
mask any differentiation present. Also, a lack of geographic differentiation may be
beneficial to BST methods as it allows single libraries to be used for many watersheds.
Objectives
The current study is an investigation of the population genetics of E. coli in three
types of hosts: humans, beef cattle, and horses. Two bacterial source tracking (BST)
methods, ribotyping and antibiotic resistance analysis, were used to investigate the
structure of E. coli populations within and between the three host populations (cattle,
horses and humans). This study was conducted in four phases, and the results are
discussed with respect to their application to BST.
24

1) The first phase focused on intensive sampling of beef cattle, horse, and human
individuals in order to characterize and compare the E. coli population structures
in their feces. The population structure was defined as the specific subtypes
observed, the number of different subtypes and their relative abundance in the E.
coli populations. The overarching hypothesis was that the E. coli population
structure would differ based on source.
2) In the second phase, individuals from three types of host were sampled over time
in order to determine and compare the temporal stability of the E. coli populations
within the feces individuals. The hypothesis was that members of the E. coli
populations within individuals would not be stable over time, and that new E. coli
types would be observed at each sampling event; however, the diversity of the E.
coli populations within an individual would remain stable over time.
3) The third phase of the study investigated the E. coli population of a single human
for one month that had just finished antibiotic treatment with
Trimethoprim/Sulfamethaxazole. The hypothesis was that an outside influence
such as antibiotic treatment would influence the diversity of the E. coli population
within this individual.
4) The fourth phase of the study assessed the geographic distinctiveness of E. coli
populations within individuals from four beef cattle herds located in different
geographic regions. The hypothesis was that E. coli populations would be
geographically distinct on the herd level, with a greater frequency of subtype
sharing occurring between individuals from a single herd than between
individuals from different herds.
25
Chapter 2. One-Time Intensive Sampling of Feces from Beef Cattle, Horses and
Humans
Materials and Methods
Sample Collection
Feces from three different host source categories (humans, horses and beef cattle)
were analyzed. Fecal samples were collected from five individuals per source category.
All cattle were from the same herd, all horses were stabled at the same farm, and all
humans worked in the same laboratory. All individuals remained healthy over the course
of the study, and none received antibiotics. Fecal samples were collected from cattle and
horse feces by stabbing one sterile swab multiple times into a fresh fecal mass, while
humans were sampled via a direct anal swab. A total of three swab samples per
individual was collected in a single day at approximately 3 h intervals. The swabs were
then streaked onto mFC agar plates (100mm diameter), which were incubated overnight
in a water bath at 44.5°C (1). Twenty-five blue colonies per swab (75 colonies per
individual) were transferred with sterile toothpicks into the wells of microtitre plates that
contained EC broth amended with 4-methylumbelliferyl-β-D-glucuronide (MUG)
(50µg/ml). β−glucuronidase activity, which is characteristic of E. coli, was assessed by
MUG cleavage, which was determined by fluorescence upon excitation with ultraviolet
light (5). Only MUG-positive colonies were further analyzed. Each MUG-positive
26

isolate was characterized by a unique code based on how many isolates had been
collected, the source of the isolate and the location of the isolate on its specific microtitre
plate. As an extra verification step, ten percent of the MUG-positive fecal coliform
isolates were confirmed as E. coli by an oxidase test and API 20E biochemical test strips
(Biomerieux, France), following the manufacturer’s instructions. Based on these tests
98% of the MUG-positive isolates were confirmed as E. coli. All E. coli isolates were
stored at -80°C for further analysis.
Ribotyping
Fifteen E. coli isolates per individual animal (five isolates per swab) were
subtyped by ribotyping. Based on preliminary data (data not shown), and the cost of
ribotyping, it was decided that fifteen isolates should provide an adequate representation
of the E. coli population within individuals based on financial constraints. E.coli isolates
were ribotyped by modifying a previously published protocol (59).
Isolates were grown in 2ml of brain heart infusion (BHI) broth (Becton
Dickinson, Sparks, MD) overnight at 37°C while shaking for aeration. Genomic DNA
was purified using the DNeasy tissue kit (Qiagen, Valencia, CA) following the
manufacturer’s instructions. DNA concentrations were determined
spectrophotometrically by UV absorbance in a Beckman spectrophotometer (Beckman
Coulter, Fullerton, CA) after diluting each sample (20 µL of purified DNA into 50 µL of
10mM Tris-HCL). Purified DNA (1.5 µg mL-1) was digested using 3 µl buffer E
(Promega, Madison, WI) and 0.7 µl of Hind III (10U µL-1) (Promega, Madison, WI) in a
27

1.5ml centrifuge tube, for a final volume of 30 µl. The mixture was incubated at 37°C for
2.5 hrs.
After digestion with Hind III, DNA fragments were separated on a 1% agarose
gel (15 cm × 15 cm) for 17 hrs at 30 V. An E. coli positive control (ATCC 9637) was
run on every gel, and two digoxigenin (DIG)-labeled DNA molecular weight marker’s
(Hind III digested) with a size range of 831 bp – 21,226 bp (Roche, Indianapolis, IN)
were always run on the first and last lane of each gel. The gels were blotted onto
positively charged nylon membranes (Roche Diagnostics, Indianapolis, IN) for 2 hrs
using a vacuum blotter. DNA was cross-linked to the membrane using a UV crosslinker
(Spectrolinker XL-1000, Spectronics Corp, Westbury NY) and the membrane was
hybridized with a hybridization buffer (blocking solution, 10% N-lauroylsarcosine, 10%
SDS, sodium citrate, and NaCl) amended with probe overnight at 68°C. An appropriate
volume of probe was added to the hybridization buffer to create a 15% DIG-labeled 16S
rDNA probe solution.
The DIG-labeled probe was created using a PCR probe synthesis kit (Roche
Diagnostics, Indianapolis, IN) in a thermocycler (Tpersonal, Whatman Biometra,
Gottingen, Germany,) (Table 1). DNA isolated from E. coli ATCC 9637 with the
DNeasy tissue kit (Quiagen, Valencia, CA) was used as the template for each reaction.
The primers used were previously published universal primers targeting the 16S rRNA
gene: Eco8F (5’-AGAGTTTGATCTGGCTCAG-3’) and Eco1492RC
(5’-GGTTACCTTGTTACGACTT-3’) (76). Each reaction followed the PCR program
shown in Table 1. The resulting amplicon is 1484 base pairs in length.
28

The DNA fragments that hybridized with the probe were immunologically
detected using the protocol described in the DIG nucleic acid detection kit (Roche
Diagnostics, Indianapolis, IN). The developed membranes were scanned as a “.tif” file
into a computer and imported to the BioNumerics program (Applied Maths, Belgium) for
analysis. The membrane was dried and laminated for storage.
Antibiotic Resistance Analysis (ARA)
All of the MUG-positive E. coli isolates (~70 per individual) were analyzed using
antibiotic resistance analysis. Antibiotic plates were prepared prior to analysis using 150
mm diameter petri plates with Mueller Hinton agar (Difco, Becton Dickinson, Sparks
MD) amended with antibiotics (Table 2).
Escherichia coli isolates were grown in 96-well microtitre plates filled with 180
µL/well of EC broth and were incubated overnight at 37°C. These cultures were diluted
by pipeting 20 µL of inoculum from each well into separate microdilution tubes filled
Initial Denaturation Amplification Final Extension
35 cycles:
94°C for 2 minutes 94°C for 1 min 72°C for 7 minutes
50°C for 1 min
72°C for 2 min
Table 1. PCR program used for the synthesis of the 16S rDNA probe
29

with 580 µL of sterile nanopure water. This dilution method was based on the NCCLS
method, which uses sterile nanopure water as the diluent when determining the minimum
inhibitory concentration of an anti-microbial agent (51). The diluted culture (100µl) was
pipeted into a separate well in a new microtitre plate. Up to 96 E. coli isolates were
prepared as inoculum cultures for each microtitre plate.
The diluted E. coli inoculum was stamped onto each of the antibioic plates listed
in Table 2 with a sterile, 96-prong replicator. The plates were incubated overnight at
37°C. Growth on the antibiotic plates was scored and recorded. Any discernible growth
determined visually at each position was considered a positive score.
Antibiotic Concentrations (µg ml-1) Amoxicillin (AMX) 4.0 128.0 Cephalothin Sodium Salt (CEP) 8.0 32.0 Chloramphhenicol (CLP) 4.0 NAa
Chlortetracycline Hydrochloride (CHT) 20.0 80.0 Doxycycline Hydrochloride (DOX) 4.0 NA Gentamycin Sulfate (GEN) 1.0 NA Kanamycin Monosulfate (KAN) 3.0 NA Nalidixic Acid Sodium Salt (NA) 3.0 NA Neomycin (NEO) 3.0 NA Norfloxin (NOR) 0.1 NA Oxytetracycline Hydrochloride (OXY) 20.0 NA Penicillin G Potassium (PEN) 20.0 200.0 Rifampicin (RIF) 2.0 16.0 Streptomycin Sulfate (STR) 20.0 80.0 Tetracycline Hydrochloride (TET) 4.0 64.0 Trimethoprim (TRI) 0.25 1.0 Trimethoprim/Sulfamethoxazole (TS) 5.0 NA
Table 2. Antibiotics and their concentrations used for antibiotic resistance analysis of E. coli isolates
a - NA (not applicable) signifies that only a single concentration was used for that particular antibiotic
30
Statistical Analysis Banding patterns created by ribotyping (ribotypes) were analyzed using
BioNumerics software (Applied Maths, Belgium). Ribotypes were compared by
constructing a similarity dendrogram using the Dice coefficient algorithim with
maximum similarity. Dice coefficient was chosen because the algorithm relies on the
presence and absence of bands when determining similarity. The software optimization
setting was 0.2 and the position tolerance setting was 0.7. It was observed that repeated
runs (n = 38) of the control strain were 90% similar (data not shown), therefore patterns
showing at least 90% similarity with the Dice coefficient were considered identical. The
accuracy of this similarity value was confirmed by eye. An example of a similarity
dendrogram is presented in Figure 1.
Character patterns representing antibiotic resistance profiles (ARPs) created by
ARA were also analyzed using BioNumerics software (Applied Maths, Belgium). ARPs
were compared by constructing a similarity dendrogram using the binary coefficient
known as simple matching (>50% mean). Simple matching was chosen because it is bias
towards ARPs that demonstrate high levels of resistance and preliminary studies have
shown that there is greater variability in ARPs of high resistance than ARPs of lower
resistance. Repeated runs (n = 40) of the control were 94% similar, therefore ARPs were
considered the same if they were at least 94% similar.
Diversity indices were used to assess the structure of E. coli populations. The
observed frequency and distribution of E. coli subtypes, determined by ribotype or ARP,
were compared within and between three host categories. Three different diversity
31

indices and one eveness index from the Hill’s family of indices were used: 1.) Richness
estimator (S), 2.) Shannon’s index (H’), 3.) Simpson’s index (λ), and 4.) Pielou’s eveness
(J’) (Figure 2) (43). These measurements do not demonstrate the total diversity of the E.
coli population in any given individual because the number of E. coli isolates analyzed
was only a very small proportion of the total number of E. coli isolates present in a fecal
sample. However, the sample size utilized in this study was as large as was practical.
Furthermore, because the sample sizes were similar per individual, the diversity
measurements can be used to present a comparison between source categories.
One-way ANOVA with Dunnett's post test was performed using GraphPad InStat
version 3.00 (GraphPad Software, San Diego California) on all diversity measurements to
compare E. coli population structure within the different source categories.
Accumulation curves were used to compare E. coli populations in different source
categories by estimating the number of new patterns observed in a given individual as a
function of sampling effort for each different source. Accumulation curves can be used
to obtain an estimate of the sampling effort needed in order to most accurately represent a
population (38). Chi-square analysis was performed (GraphPad Software, San Diego
California) to compare the amount of subtype sharing between source categories
observed with ribotyping and antibiotic resistance analysis results. For all statistical tests,
significance was determined at P < 0.05.
32

Figure 1. Example of a similarity dendrogram of ribotypes created using the Dice coefficient. The vertical line represents a 91% similarity cutoff, which was used as the criterion for calling ribotypes identical.
10
0
9590858075706560
C o w 1 0C o w 1 1
H o rs e 4 5H o rs e 4 6
H o rs e 4 4H o rs e 4 7
C o w 6C o w 7
C o w 5H o rs e 1 4 4H o rs e 1 4 6
H u m 1 9 0H u m 1 9 1
H u m 1 9 2
H u m 1 9 3H u m 1 9 4
H u m 2 0 5H u m 2 0 6H u m 5H u m 6
C o w 4 9
H o rs e 1 4 3C o w 1 1 1
C o w 1 1 2C o w 1 1 0
H o rs e 1 4 5
Figure 2. Equations for the parameters used to define E. coli population structure.
- Pattern Richness (S) = # of patterns
- Shannon index (H’) = −Σpiln(pi) pi = # isolates with pattern (i) / total isolates - Pielou’s eveness index (J’) = H’/ln S - Simpson index (λ) = Σ (ni(ni-1))/(n(n-1))
ni = # isolates with pattern i n = total # of isolates
33

Results
Population Distribution of E. coli Subtypes Within Source Categories
Population structure is defined as the number of different subtypes and their
relative abundance in a given population sample. The population structure of E. coli, as
determined by ribotyping and ARA, was compared both within individuals from the same
source categories and between individuals from different source categories (humans,
horses and beef cattle). The hypothesis was that the E. coli population structure would
differ based on source, i.e. humans, horses, or cattle.
Ribotyping results suggest that the population structure of E. coli, as determined
by the diversity indices, differs depending upon host source (Table 3). One-time samples
of the feces of individual horses (n = 5) contained a significantly more diverse E. coli
population than either cow or human individuals based on all diversity measurements,
although eveness was not significantly different among different hosts (Table 4). The E.
coli populations of individual horses demonstrated a richness of S = 9.2, had a mean
Shannon value of H’=2.0 and a mean Simpson value of 1/λ =21.1. There was no
significant difference in any diversity measurements of the E. coli populations of beef
cattle and humans (Table 4). The E. coli populations of individual humans had a mean
richness of S =2.2, had a mean Shannon value of H’=0.43, and a mean Simpson value of
1/λ =2.1. While the E. coli populations of individual cows had a mean richness S =3.4,
had a mean Shannon value of H’=0.67 and a mean Simpson value of 1/λ =2.2.
34

Source Richness
Estimator (S)Shannon Index
(H') Pielou’s
Eveness (J’) Simpson
Index (1/λ)
Cow A (n = 15) 6 1.52 0.85 4.4 Cow B (n = 15) 3 0.88 0.80 2.4 Cow C (n = 15) 5 0.70 0.43 1.9 Cow D (n = 15) 1 0 1.00 1.0 Cow E (n = 15) 2 0.25 0.36 1.1
Mean 3.4a 0.67a 0.69a 2.2ab
Human A (n = 14) 6 1.59 0.89 5.8 Human B (n = 15) 1 0 1.00 1.0 Human C (n = 15) 2 0.58 0.84 1.7 Human D (n = 15) 1 0 1.00 1.0 Human E (n = 15) 1 0 1.00 1.0
Mean 2.2a 0.43a 0.95a 2.1a
Horse A (n = 14) 9 2.01 0.91 10.2 Horse B (n = 14) 11 2.26 0.94 30.4 Horse C (n = 15) 9 1.95 0.78 8.1 Horse D (n = 15) 13 2.52 0.98 52.6 Horse E (n = 15) 4 1.27 0.79 4.0
Mean 9.2b 2.0b 0.90a 21.1b
Table 3. Diversity measurements of the population structure of E. coli within individuals from different source categories using ribotyping. Values that share the same letter within columns are not significantly different.
35
Table 4. Significance values determined by comparing the means of all diversity measurements obtained from each source category. Means were compared using ANOVA. If significantly different, subsequent pairwise comparisons were performed for each source category to determine the difference. If the ANOVA was not significant, no additional tests were performed. Significant values are highlighted. Ribotyping Results ANOVA for Richness P = 0.0039 ANOVA for Simpson index P = 0.0153
Horse Cow Human Horse Cow Human Horse 0.005<P<0.01 Horse P >0.05 Cow Cow
Human 0.001<P<0.01 P >0.05 Human0.01<P<0.0
5 P >0.05 ANOVA for Shannon index P = 0.0011 ANOVA for eveness index P = 0.189
Horse Cow Human Horse Cow Human Horse 0.01<P<0.05 Horse Cow Cow
Human P<0.001 P >0.05 Human
36
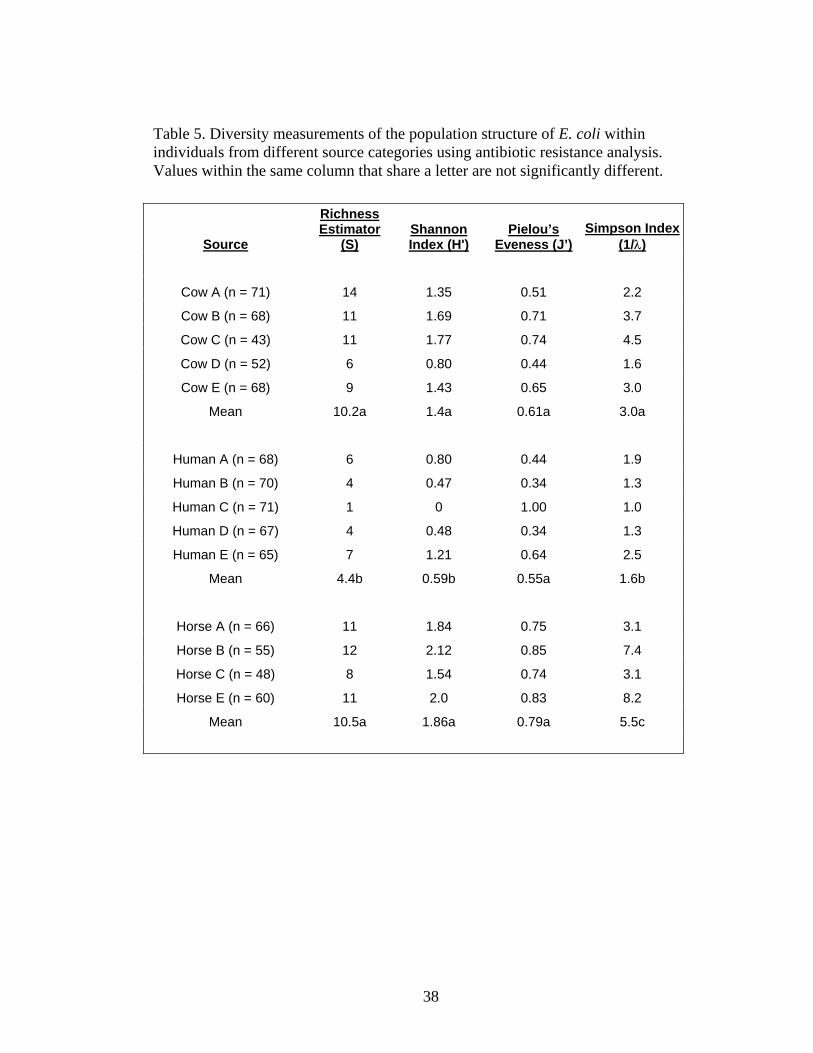
Diversity measurements obtained when antibiotic resistance analysis (ARA) was
used to subtype E. coli isolates also suggested that the population structure of E. coli
found in the feces differs depending on host source (Table 5). The E. coli populations of
human individuals were significantly less diverse than the E. coli populations of both
cattle and horse individuals based on all diversity measurements. There was no
significant difference noted between the eveness values (J’) of any source category.
There was no significant difference in the diversity measurement obtained for the E. coli
populations of either cattle individuals or horse individuals according to the richness
estimator and the Shannon index. However, the E. coli populations of horse individuals
demonstrated a significantly higher Simpson value (1/λ=5.5) than the E. coli populations
of cattle (1/λ=3.0) (Table 6). Similar trends were observed when ribotyping or antibiotic
resistance analysis was used to subtype E. coli isolates.
In general, the E. coli populations of horses appear to be the most diverse,
followed by the E. coli populations of cattle and finally the E. coli populations of humans
being the least diverse. For all source categories the diversity measurements were higher
using antibiotic resistance analysis than was observed with ribotyping. One reason may
be because four times the number of isolates was processed by ARA compared to
ribotyping. This difference was due to the ease of processing ARA isolates as well as the
relative cost difference of processing ARA isolates compared to ribotyping isolates.
37
Source
Richness Estimator
(S) Shannon Index (H')
Pielou’s Eveness (J’)
Simpson Index (1/λ)
Cow A (n = 71) 14 1.35 0.51 2.2
Cow B (n = 68) 11 1.69 0.71 3.7
Cow C (n = 43) 11 1.77 0.74 4.5
Cow D (n = 52) 6 0.80 0.44 1.6
Cow E (n = 68) 9 1.43 0.65 3.0
Mean 10.2a 1.4a 0.61a 3.0a
Human A (n = 68) 6 0.80 0.44 1.9
Human B (n = 70) 4 0.47 0.34 1.3
Human C (n = 71) 1 0 1.00 1.0
Human D (n = 67) 4 0.48 0.34 1.3
Human E (n = 65) 7 1.21 0.64 2.5
Mean 4.4b 0.59b 0.55a 1.6b
Horse A (n = 66) 11 1.84 0.75 3.1
Horse B (n = 55) 12 2.12 0.85 7.4
Horse C (n = 48) 8 1.54 0.74 3.1
Horse E (n = 60) 11 2.0 0.83 8.2
Mean 10.5a 1.86a 0.79a 5.5c
Table 5. Diversity measurements of the population structure of E. coli within individuals from different source categories using antibiotic resistance analysis. Values within the same column that share a letter are not significantly different.
38

Table 6. Significance values determined by comparing the means of all diversity measurements obtained from each source category. Means were compared using ANOVA. If significantly different, subsequent pairwise comparisons were performed for each source category to determine the difference. If the ANOVA was not significant, no additional tests were performed. Significant values are highlighted. Antibiotic Resistance Analysis Results
ANOVA for Richness P = 0.0024 ANOVA for Simpson index P = 0.0317 Horse Cow Human Horse Cow Human
Horse P >0.05 0.001<P<0.01 Horse 0.01<P<0.05 0.01<P<0.05Cow 0.01<P<0.05 Cow 0.01<P<0.05
Human Human ANOVA for Shannon index P = 0.0025 ANOVA for eveness P = 0.091
Horse Cow Human Horse Cow Human Horse P >0.05 P <0.001 Horse Cow 0.01<P<0.05 Cow
Human Human
39

Accumulation curves demonstrate the number of new subtypes that are observed
within an individual as E. coli isolates are collected. Ribotype accumulation curves
demonstrated that, on average, the dominant E. coli populations in humans were made up
of the fewest number of ribotyptes and apparently required the fewest number of isolates
in order to represent the dominant ribotypes present in the E. coli population (Figure 3A).
Both human and cattle accumulation curves demonstrated that collecting ten to twelve
isolates was enough to adequately represent the diversity within the dominant E. coli
populations of these two source categories using the ribotyping technique. The E. coli
populations of horses were the most diverse and were represented by the greatest number
of different ribotypes. Because the slope of the accumulation curve for E. coli ribotypes
from horse feces did not approach 0 in this graph, the number of isolates needed to
adequately represent the dominant E. coli population is unknown, and more than 15
isolates should have been analyzed (Figure 3A).
ARA results also demonstrated that humans had the least diverse E. coli
population, requiring the fewest isolates of the three source categories to represent the
dominant ARPs in their E. coli population (Figure 3B). A much greater difference
between E. coli populations of human and cattle were observed in the accumulation
curves based on ARA compared to those based on ribotyping. Using ARA, the cattle
accumulation curve is more similar to the horse accumulation curve, with both curves
demonstrating a diverse E. coli population with many different ARPs observed. The
accumulation curves for horses and cattle, based on ARA, demonstrated that collecting
over fifty isolates for an individual adequately represents the dominant ARPs in their E.
coli population. Around twenty-five isolates are required to adequately represent the
40
dominant ARPs in the E. coli populations of humans. For all source categories, the slope
of the ARP accumulation curves was steeper then the slope of the ribotype accumulation
curves. These graphs demonstrate that the rate of accumulation of new subtypes is
different based on both the source of the E. coli population (i.e. cattle, humans or horses)
and the typing technique used. Therefore, different sampling strategies must be used,
depending on the individual being sampled and the typing technique being used, in order
to obtain an accurate representation of their dominant E. coli populations.
41

Figure 3. Accumulation curves representing the number of unique patterns versus sampling effort for horses, humans, and cattle.
42
ARP Accumulation
0
2
4
6
8
10
12
1 6 11 16 21 26 31 36 41 46 51
Number of isolates
Num
ber o
f new
AR
Ps
Mean HorseMean CattleMean Human
Ribotype Accumulation
0123456789
10
1 2 3 4 5 6 7 8 9 10 11 12 13 14 15Number of isolates
Num
ber o
f new
ribo
type
s
Mean HorseMean HumanMean Cattle
A B

Pattern Sharing Within and Between Source Categories The number of sampled E. coli isolates that share a specific ribotype or antibiotic
resistance pattern (ARP) was observed during a one time sampling event in order to
observe pattern sharing between individuals within the same source category (Figure 4).
The hypothesis was that there would be greater pattern sharing between E. coli isolates
from individuals within a source category than between individuals from different source
categories. E. coli isolated from different human individuals did not share any ribotypes
(Figure 4A), although ribotype sharing by E. coli within individuals was very high (Table
3). For example, all E. coli isolates from human B shared the same ribotype, but, this
ribotype was not shared by any other human individuals. Three percent of horse E. coli
isolates shared a ribotype that was found in two different horse individuals, while the
remaining ninety seven percent of E. coli isolates had a ribotype observed in a single
horse individual. No horse E. coli isolates had a ribotype found in three or more horse
individuals (Figure 4C). The E. coli populations of cattle demonstrated the most ribotype
sharing of the three source categories (Figure 4B). Forty three percent of cattle E. coli
isolates shared a ribotype found in two different cattle individuals; however, there were
no specific ribotypes shared between more than two cattle individuals. Overall, for all
three source categories, humans, horses and cattle, greater ribotype sharing was observed
between E. coli isolates within single individuals than between E. coli isolates from
different individuals of the same source category (Chi-sqare test, P <0.001 for all
sources).
43
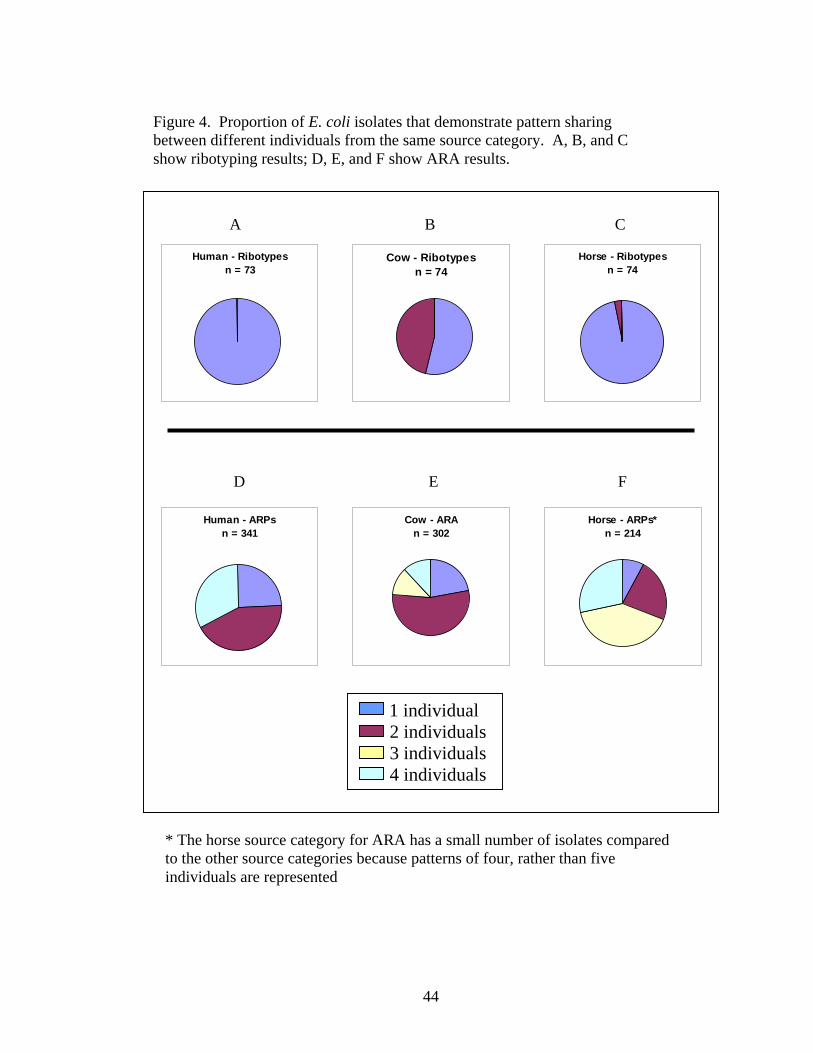
A B C D E F
Cow - Ribotypesn = 74
Horse - Ribotypesn = 74
Human - Ribotypesn = 73
Figure 4. Proportion of E. coli isolates that demonstrate pattern sharing between different individuals from the same source category. A, B, and C show ribotyping results; D, E, and F show ARA results.
Human - ARPs
n = 341Cow - ARA
n = 302Horse - ARPs*
n = 214
1 individual 2 individuals 3 individuals 4 individuals
* The horse source category for ARA has a small number of isolates compared
to the other source categories because patterns of four, rather than five individuals are represented
44
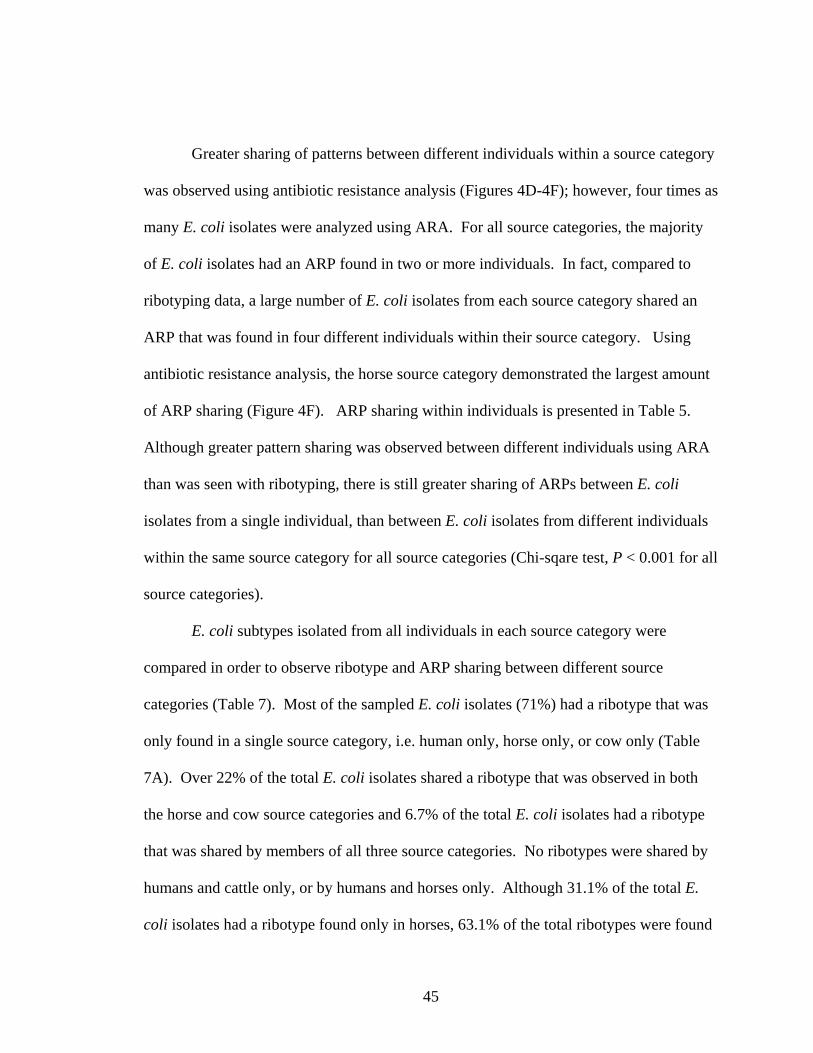
Greater sharing of patterns between different individuals within a source category
was observed using antibiotic resistance analysis (Figures 4D-4F); however, four times as
many E. coli isolates were analyzed using ARA. For all source categories, the majority
of E. coli isolates had an ARP found in two or more individuals. In fact, compared to
ribotyping data, a large number of E. coli isolates from each source category shared an
ARP that was found in four different individuals within their source category. Using
antibiotic resistance analysis, the horse source category demonstrated the largest amount
of ARP sharing (Figure 4F). ARP sharing within individuals is presented in Table 5.
Although greater pattern sharing was observed between different individuals using ARA
than was seen with ribotyping, there is still greater sharing of ARPs between E. coli
isolates from a single individual, than between E. coli isolates from different individuals
within the same source category for all source categories (Chi-sqare test, P < 0.001 for all
source categories).
E. coli subtypes isolated from all individuals in each source category were
compared in order to observe ribotype and ARP sharing between different source
categories (Table 7). Most of the sampled E. coli isolates (71%) had a ribotype that was
only found in a single source category, i.e. human only, horse only, or cow only (Table
7A). Over 22% of the total E. coli isolates shared a ribotype that was observed in both
the horse and cow source categories and 6.7% of the total E. coli isolates had a ribotype
that was shared by members of all three source categories. No ribotypes were shared by
humans and cattle only, or by humans and horses only. Although 31.1% of the total E.
coli isolates had a ribotype found only in horses, 63.1% of the total ribotypes were found
45

in horses only. This difference is because the horse source category has a diverse E. coli
population with many ribotypes being represented by single isolates. In contrast, only
18.5% of the total ribotypes are found in humans only, however 28.5% of the total E. coli
isolates have a ribotype found only in humans. The diversity of the E. coli populations of
humans are low, therefore many isolates share a single ribotype.
Comparitively greater sharing of antibiotic resistance patterns (ARPs) between
source categories was observed (Table 6B). The majority of E. coli isolates (77%) had an
antibiotic resistance pattern that was observed in two or more source categories. In fact
59% of the E. coli isolates analyzed by ARA had an antibiotic resistance pattern that was
found in all three source categories. However, only 14.3% of the total number of ARPs
were shared between three source categories. These data suggest that a small number of
dominant ARPs are shared between source categories and are represented by a large
number of E. coli isolates. There is a single ARP that is represented by almost 400 E.
coli isolates and is shared by individuals from all three source categories (data not
shown). A very small proportion of E. coli isolates had an antibiotic resistance profile
found in either horses and humans only (three percent), or cattle and humans only (less
than one percent), a trend shared with ribotyping. Also, as seen with ribotyping, horses
have the largest number of ribotypes (44.8%) but these ribotypes are represented by a
small number of E. coli isolates (11.6%).
46
Source
Distribution of all ribotypes in source
categories (n = 222)
Distribution of unique ribotypes (n = 65)
Human only 28.8% 18.5% Cow only 10.9% 12.3%
Horse only 31.1% 63.1% Human/Horse 0% 0%
Human/Cow 0% 0%
Horse/Cow 22.5% 4.6%
Human/Horse/Cow 6.7% 1.5%
A. Ribotyping
Table 7. The proportion of E. coli subtypes shared between multiple source categories
B. Antibiotic Resistance Analysis
Source
Distribution of all ribotypes in source
categories (n = 857)
Distribution of unique ARPs
(n = 56)
Human only 2.4% 5.3%
Cow only 9.0% 16.1%
Horse only 11.6% 44.8%
Human/Horse 3.4% 1.7%
Human/Cow 0.6% 1.7%
Horse/Cow 14.8% 16.1%
Human/Horse/Cow 58.2% 14.3%
47
Discussion
The current study systematically compared the E. coli populations of individuals
from different animal sources using two subtyping methods and demonstrated two major
findings: 1) the frequency of subytpe sharing between individuals is determined by which
subtyping technique is being used. Ribotypes were often limited to single individuals
with very little ribotype sharing between individuals, while antibiotic resistance patterns
were frequently shared between individuals both within and between source categories.
And 2) the diversity of an E. coli population within an individual is determined by source
and the subtyping technique utilized.
Very few studies have directly compared E. coli populations between different
species. Caugant et al. performed a study that subtyped 655 E. coli isolates by multilocus
enzyme electrophoresis (MLEE) from thirty-four individuals (twenty three humans, six
dogs, and five cats) (14). Eighty-five percent of E. coli subtypes were limited to a single
individual, and 15% of the E. coli subtypes were shared between individuals. Four
percent of the subtypes were shared between individuals from different species. These
results are similar to the ribotyping data presented in the current study; however, the
MLEE study did not observe a difference in the diversity of E. coli populations from
different species. This difference may be explained by differences in the physical
proximity of host species. The host species of the MLEE study included humans and
their pets (dogs and cats); which were living in the same home. The current study
sampled humans, horses and beef cattle; which are all located in different areas. The
close proximity of the humans, dogs and cats sampled in the MLEE study, coupled with
48

the fact that all had an omnivorous/carnivorous diet, may explain why no difference in
the E. coli population structure of these individuals was detected.
Although few studies directly compare the E. coli populations of different host
species, studies have investigated the population structure of E. coli within individuals
from a single species. Another MLEE study subtyped the E. coli population of a single
human for eleven months (15). At any given time the majority of E. coli isolates within
this human displayed a single dominant subtype, and the diversity of the population was
very low. These results are comparable to observations made in the current study, i.e.
diversity of human E. coli populations were low at any given time point, and were
usually dominated by a single subtype. A study performed by Whittam used MLEE to
subtype the E. coli populations of five individual birds (81). An average of 4.2 subtypes
per bird was observed when 20-30 isolates were analyzed. Although MLEE was used as
the subtyping method in each of these studies, different enzymes were chosen for each
method, which complicates comparison these studies. However, in a broad sense,
Whittam’s and Caugant’s studies demonstrate that the structure of E. coli populations, as
determined by MLEE, differed based on the source animal, which agrees with our
findings.
A recent study performed by Simpson et al used denaturing gradient gel
electrophoresis (DGGE), with primers for the V3 variable region of 16S rDNA gene, to
fingerprint the domimant bacterial population in the feces of dogs (71). Their study was
designed to assess differences in the enteric bacterial populations based on breed, age,
and diet of the dogs. Each dog appeared to have a distinct enteric bacterial population
based on DGGE banding patterns, however banding patterns did tend to cluster on a
49
similarity dendrogram according to the age of the dog. The DGGE study did not
specifically investigate the E. coli population of dogs, however in a general sense their
observations support those of the current study, i.e. there is high variability between the
fecal bacterial populations of host individuals.
A goal of the current study was to determine the number of isolates needed to
adequately represent the diversity of E. coli subtypes within a population. A gram of
feces may contain billions of E. coli cells (44), therefore it is impossible to sample the
entire E. coli population of a given individual. However, the assumption made for this
study is that the chosen sample size, although only a proportion of the total E. coli
population, should act as a representation of the diversity of the numerically dominant
subtypes that make up the E. coli population.
Accumulation curves were used as a tool to determine the adequacy of the chosen
sample size in the intensive sampling phase of this study. According to the accumulation
curves, ten to twelve E. coli isolates adequately represented the dominant ribotypes in the
feces of humans and beef cow individuals, while more isolates were needed to represent
the dominant antibiotic resistance patterns (20-25 for humans, and 45-50 for beef cattle
and horses). These accumulation curves only represent the number of dominant subtypes
that are present in a fecal swab sample processed as described in Chapter 2 (Materials
and Methods) and do not represent the total diversity of the entire E. coli population
within the feces, which is probably much higher. This limitation is acknowledged and
accepted because this particular sampling procedure is an accepted practice in
microbiological studies in general and in BST studies in particular. Therefore, even
though the total diversity is not represented, understanding the behavior of this limited E.
50

coli population has practical implications when attempting to optimize bacterial source
tracking methodology.
Another limitation of the current study is the small number of individuals (n=5)
sampled from each host species. The current study demonstrated a very low frequency of
ribotype sharing between individuals within a source category, and in the case of humans
there was no ribotype sharing at all. In another study in this laboratory (17), with a large
sample size of individuals (sixty individuals per source category), ribotype sharing was
demonstrated between individuals within a source category and between source
categories. It is understood that the current study may misrepresent the true frequency of
ribotype sharing that occurs within a source category due to the small sample size. A
greater frequency of subtype sharing both within and between source categories was
observed for ARA compared to ribotyping, but many more isolates were analyzed for
ARA. Thus, direct comparisons of the frequency of sharing by the two subtyping
methods must be cautiously interpreted.
In summary, the current study has demonstrated that the diversity of the dominant
E. coli populations of feces differ based on source and the chosen subtyping technique.
These results have strong implications for understanding and improving the efficiency
and accuracy of bacterial source tracking.
51

Chapter 3. Sampling of Individual Host Animals from Three Source Categories
Over Time
Materials and Methods
Sample Collection and Processing Three individuals per source category from three different source categories
(human, horse, and cattle) were sampled over several months. These individuals were
among the individuals sampled in the one time intensive sampling event (Chapter 2
Materials and Methods). Human individuals were sampled for twelve months, horse
individuals were sampled for eight months, and individual beef cows were sampled for
seven months. During the sampling period, a one-time intensive sampling event was
conducted for all individuals (Chapter 2 Materials and Methods). Once a month, a single
fecal swab sample was obtained from each individual. The fecal swabs were processed
for E. coli isolation as described previously (see Chapter 2, Materials and Methods).
Twenty-five blue colonies per swab were transferred from mFC to a microtitre plate
containing EC broth amended with MUG. Five MUG-positive E. coli isolates per
individual were analyzed by ribotyping each month, and all MUG-positive E. coli isolates
were analyzed by ARA.
Ribotypes and antibiotic resistance profiles (ARPs) were analyzed using
BioNumerics as described previously (Chapter 2, Materials and Methods). One-way
52

ANOVA with Dunnett's post test was performed (GraphPad Software, San Diego
California) on the mean richness estimator (S) values for the entire sampling session in
order to compare the accumulated richness within individuals over time.
53
Results
Population Structure of E. coli Within Individuals Over Time The dominant E. coli population in the feces of three human individuals was
assessed on a monthly basis for a twelve-month period using both ribotyping and
antibiotic resistance analysis to subtype E. coli (Figures 5-7). The hypothesis was that
the specific subtypes within an E. coli population for a single individual would not be
stable over time. Figure 5A represents the E. coli subtypes sampled from human A over
time, as determined by ribotyping. Each color/pattern in the figures represents a unique
ribotype, which was assigned a number. The number of dominant E. coli ribotypes
isolated per sample event from human A varied little over time. For each month (except
August 2002) the E. coli population was represented by one to two dominant ribotypes,
suggesting that the richness of the population remained relatively consistent over time.
However, there was a large amount of variation in the specific ribotypes observed over
time. The ribotypes of E. coli isolated from human A observed in June 2002 and July
2002 were not the same ribotypes observed in later months, i.e. December 2002 and
January 2003 (Figure 5A). Many ribotypes were only present for one month and then not
seen again, although ribotype 1 was a persistent ribotype and was observed in five
different months. In this case, a persistent ribotype is defined as any ribotype observed
at more than one consecutive sampling event.
Similar results were observed for the dominant E. coli populations of the other
two humans (Figures 7A and 8A). Humans B and C demonstrated a consistent richness
value for their E. coli populations over time, containing one to two different ribotypes for
54
any given month. A number of different ribotypes were observed throughout the
sampling period and many ribotypes were only observed at one sampling event. The E.
coli populations of human B demonstrated one very stable ribotype (ribotype 2) that was
present in 8 different months and persisted from August 2002 until May 2003 (Figure
7A). There was no significant difference (ANOVA, P =0.142) among the accumulated
richness of E. coli ribotypes within human individuals, although human B appeared to
have the lowest accumulated richness as only four ribotypes were observed throughout
the entire sampling period.
The dominant E. coli population structure within humans was also monitored
using ARA (Figures 5B-7B). More patterns were identified by subtyping with ARA
than with ribotyping. There was no significant difference (P =0.415, ANOVA) in the
richness of E. coli populations within human individuals over time, i.e. similar richness in
antibiotic resistance patterns (ARPs) was observed at any given month for all human
individuals. The E. coli populations demonstrated temporal instability by ARA as
different ARPs were observed throughout the sampling period. More ARPs
demonstrated persistence in human individuals than was observed with ribotyping. For
example, the E. coli population of human A contained four different ARPs that
demonstrated persistence (ARPs 7,10,16,19) while with ribotyping there was only one
persistent subtype (ribotype 1). However, this result was not unexpected due to the
greater amount of subtype variability in ARA that was demonstrated previously.
55

Figure 5. The E. coli population structure over time within Human A. Different colors represent different ribotypes (A) or ARPs (B). Samples were not obtained for all months.
Human A - Ribotype
0
2
4
6
8
10
12
14
Jun-02
Jul-02
Aug-02
Sep-02
Oct-02
Nov-02
Dec-02
Jan-03
Feb-03
Mar-03
Apr-03
May-03
Num
ber o
f iso
late
s w
ith p
atte
rn
1 23 45 67 89 1011 1213 14
A
Human A - ARA
0
10
20
30
40
50
60
70
80
Jun-02
Jul-02
Aug-02
Sep-02
Oct-02
Nov-02
Dec-02
Jan-03
Feb-03
Mar-03
Apr-03
May-03
Num
ber o
f iso
late
s w
ith A
RP
1 23 45 67 89 1011 1213 1415 1617 1819 2021 2223 2425 2627 2829 30
B
56

Figure 6. The E. coli population structure over time within human B. Different colors represent different ribotypes (A) or ARPs (B). Samples were not obtained for all months.
Human B - Ribotyping
0
2
4
6
8
10
12
14
16
Jun-02
Jul-02
Aug-02
Sep-02
Oct-02
Nov-02
Dec-02
Jan-03
Feb-03
Mar-03
Apr-03
May-03
Num
ber o
f iso
late
s w
ith p
atte
rn
1 2
3 4
A
Human B - ARA
0
10
20
30
40
50
60
70
80
Jun-02
Jul-02
Aug-02
Sep-02
Oct-02
Nov-02
Dec-02
Jan-03
Feb-03
Mar-03
Apr-03
May-03
Num
ber o
f iso
late
s w
ith A
RP 1 2
3 45 67 89 1011 1213 1415 1617 1819
B
57

Figure 7. The E. coli population structure over time within human C. Different colors represent different ribotypes (A) or ARPs (B). Samples were not obtained for all months.
Human C - Ribotyping
0
2
4
6
8
10
12
14
16
Jun-02
Jul-02
Aug-02
Sep-02
Oct-02
Nov-02
Dec-02
Jan-03
Feb-03
Mar-03
Apr-03
May-03
Num
ber o
f iso
late
s w
ith p
atte
rn 1 2
3 4
5 6
7 8
9 1011 12
13 14
15
A
Human C - ARA
0
10
20
30
40
50
60
70
80
Jun-02
Jul-02
Aug-02
Sep-02
Oct-02
Nov-02
Dec-02
Jan-03
Feb-03
Mar-03
Apr-03
May-03
Num
ber o
f iso
late
s w
ith A
RP 1 2
3 45 67 89 1011 1213 1415 1617 1819 2021 2223 2425 2627 2829 3031
B
58
The dominant E. coli populations of three individuals from the beef cattle source
category was monitored on a monthly basis for eight months by ribotyping and ARA
(Figures 8-10). The E. coli populations of all three cow individuals displayed similar
results with ribotyping. The dominant E. coli populations of beef cattle are unstable
through time as new ribotypes were observed at each sampling event throughout the
eight-month sampling period. There was no significant difference (ANOVA, P =0.8294)
in the accumulated richness of ribotypes between different individuals from the beef
cattle source, with a range of thirteen to nineteen different ribotypes observed within
these cattle over eight months.
The E. coli populations of beef cattle individuals displayed very few persistent
ribotypes. Most ribotypes were observed only once and then not found in any other
months. The dominant E. coli population of cow A demonstrated two persistent
ribotypes (ribotype 10 and 12) and the E. coli populations of cow B and C each
demonstrated only one ribotype that persisted for more than one month (ribotype 10 and
ribotype 3, respectively) (Figures 8A-10A). Generally, these persistent ribotypes were
observed at two sampling events, however, ribotype 10 in cow B was observed in four
sampling months (Figure 9A). Overall, E. coli populations in cattle were highly variable.
Antibiotic resistance analysis revealed results similar to what was observed with
ribotyping the E. coli populations of cattle over time (Figures 8B-10B). There was no
significant difference (ANOVA, P =0.272) in the accumulated richness of ARPs within
beef cattle individuals over time. Also, there was no temporal stability in the dominant E.
coli populations of beef cattle determined by ARA, with new ARPs observed each
month. Persistent ARPs were more frequently observed than persistent ribotypes in the
59

E. coli populations of cattle. For example, five persistent ARPs were isolated from beef
cow B, but only one ribotype demonstrated persistence. Again, this is not unexpected
due to the greater amount of subtype variability observed with ARA compared to
ribotyping and also the fact the more isolates were processed by ARA.
The dominant E. coli populations of three horses were monitored on a monthly
basis for eight months using both ribotyping and ARA (Figures 11-13). Both methods
revealed no significant difference in the richness of the dominant E. coli populations of
all horses at any given time (ANOVA, P =0.161 and 0.670, for ribotyping and ARA
respectively). The dominant E. coli populations of all horses were temporally unstable,
as determined by ribotyping and ARA. Many ribotypes and ARPs in the horse E. coli
populations were only observed at one sampling event. Only 4% of the many ribotypes
observed in horse individuals demonstrated any persistence through time. In the E. coli
populations of horses A and C there was one (ribotype 23) and three (ribotypes 15, 23,25)
ribotypes that persisted for more than one month. Horse B was the only individual, out of
all three source categories, with an E. coli population that did not have a single persistent
ribotype during the entire sampling period.
60

Figure 8. The E. coli population structure over time within cow A. Different colors represent different ribotypes (A) or ARPs (B). Samples were not obtained for all months.
Cow A - Ribotyping
0
2
4
6
8
10
12
14
16
Jul-02 Aug-02
Sep-02
Oct-02
Nov-02
Dec-02
Jan-03
Feb-03
Mar-03
Num
ber o
f iso
late
s w
ith p
atte
rn 1 2
3 4
5 6
7 8
9 10
11 12
13 14
15 16
17 18
19
A
Cow A - ARA
0
10
20
30
40
50
60
70
80
Jul-02 Aug-02
Sep-02
Oct-02
Nov-02
Dec-02
Jan-03
Feb-03
Mar-03
Num
ber o
f iso
late
s w
ith A
RP
1 23 45 67 89 1011 1213 1415 1617 1819 2021 2223 2425 2627 2829 30
B
61

Figure 9. The E. coli population structure over time within cow B. Different colors represent different ribotypes (A) or ARPs (B). Samples were not obtained for all months.
Cow A - Ribotyping
0
2
4
6
8
10
12
14
16
Jul-02 Aug-02
Sep-02
Oct-02
Nov-02
Dec-02
Jan-03
Feb-03
Mar-03
Num
ber o
f iso
late
s w
ith p
atte
rn 1 2
3 4
5 6
7 8
9 10
11 12
13 14
15 16
17 18
19
A
Cow B - ARA
0
10
20
30
40
50
60
70
Jul-02 Aug-02
Sep-02
Oct-02 Nov-02
Dec-02
Jan-03
Feb-03
Mar-03
Num
ber o
f iso
late
s w
ith A
RP 1 2
3 45 67 89 1011 1213 1415 1617 1819 2021 2223
B
62

Figure 10. The E. coli population structure over time within cow C. Different colors represent different ribotypes (A) or ARPs (B). Samples were not obtained for all months.
Cow C - Ribotyping
0
2
4
6
8
10
12
14
16
Jul-02 Aug-02 Sep-02 Oct-02 Nov-02 Dec-02 Jan-03 Feb-03 Mar-03
Num
ber o
f iso
late
s w
ith p
atte
rn
1 2
3 4
5 6
7 8
9 10
11 12
13 14
15 16
17 18
A
Cow C - ARA
05
101520253035404550
Jul-02 Aug-02
Sep-02
Oct-02 Nov-02
Dec-02
Jan-03 Feb-03
Mar-03
Num
ber o
f iso
late
s w
ith A
RP
1 23 45 67 89 1011 1213 1415 1617 1819
B
63

64
Horse A - ARA
0
10
20
30
40
50
60
70
Aug-02
Sep-02
Oct-02 Nov-02
Dec-02
Jan-03 Feb-03
Mar-03
Apr-03
Num
ber o
f iso
late
s w
ith A
RP
1 23 45 67 89 1011 1213 1415 1617 1819 2021 2223 2425 2627 2829 3031 3233 3435 3637 3839 4041 4243 4445 4647 48
Horse A - Ribotyping
0
2
4
6
8
10
12
14
16
Aug-02
Sep-02
Oct-02
Nov-02
Dec-02
Jan-03
Feb-03
Mar-03
Apr-03
Num
ber o
f iso
late
s w
ith p
atte
rn
1 23 45 67 89 1011 1213 1415 1617 1819 2021 2223 2425 2627 2829 30
B
A
Figure 11. The E. coli population structure over time within horse A. Different colors represent different ribotypes (A) or ARPs (B). Samples were not obtained for all months.

Figure 12. The E. coli population structure over time within horse B. Different colors represent different ribotypes (A) or ARPs (B). Samples were not obtained for all monthsa.
Horse B - Ribotyping
0
2
4
6
8
10
12
14
16
Aug-02 Sep-02 Oct-02 Nov-02 Dec-02 Jan-03 Feb-03 Mar-03
Num
ber o
f iso
late
s w
ith p
atte
rn
1 23 45 67 89 1011 1213 1415 1617 1819 2021 2223 2425 2627 2829 3031 3233
A
Horse B - ARA
0
10
20
30
40
50
60
Aug-02
Sep-02
Oct-02
Nov-02
Dec-02
Jan-03
Feb-03
Mar-03
Apr-03
Num
ber o
f iso
late
s w
ith A
RP
1 2 34 5 67 8 910 11 1213 14 1516 17 1819 20 2122 23 2425 26 2728 29 3031 32 3334 35 3637 38 3940 41 4243 44 4546 47 4849 50 5152 53 5455 56 5758 59 60
B
65

Figure 13. The E. coli population structure over time within horse C. Different colors represent different ribotypes (A) or ARPs (B). Samples were not obtained for all months.
Horse C - Ribotyping
0
2
4
6
8
10
12
14
16
Aug-02 Sep-02 Oct-02 Nov-02 Dec-02 Jan-03 Feb-03 Mar-03
Num
ber o
f iso
late
s w
ith p
atte
rn
1 23 45 67 89 1011 1213 1415 1617 1819 2021 2223 2425 2627 2829 3031 3233
A
Horse C - ARA
05
101520253035404550
Aug-02
Sep-02
Oct-02 Nov-02
Dec-02
Jan-03 Feb-03
Mar-03
Apr-03
Num
ber o
f iso
late
s w
ith A
RP
1 23 45 67 89 1011 1213 1415 1617 1819 2021 2223 2425 2627 2829 3031 3233 3435 3637 3839 40
B
66

Pattern Overlap Between Individuals Within a Source Category Over Time
Ribotyping
Results from the one-time sampling event of five human, beef cattle, and
horse individuals (Chapter 2, Results) demonstrated that in one month there was little
overlap in E. coli ribotypes between individuals in the same source category (Figure 4).
The overlap between the three individuals of each source category was compiled for the
entire experiment (over seven, eight, or twelve months) (Table 8). A shared ribotype is
any ribotype that was observed within two different individuals regardless of which
sampling date it was observed. For example, in Table 8, because ribotype 6c was
observed in cow A in July and then in cow C in August it would be considered a shared
ribotype. Only one ribotype was shared by more than one human over time. Ribotype 1
was observed in both human A and human B, and was shared in four different months
(Table 8). The fact that human A and human B live in the same household may have
contributed to the sharing of ribotype 1.
E. coli ribotypes appear to be shared between different cattle within a herd (Table
8). Eight different ribotypes were shared between individual cattle through time but were
not shared in consecutive months. For example, ribotype 7 appears in cow A in August
2002 and then is not found again until March 2003 in cow D. This type of distribution
was observed with a number of the beef cow ribotypes.
Horse individuals shared the largest number of ribotypes compared to the other
two source categories. Twelve different ribotypes were shared between individual horses
over eight months (Table 8). The E. coli ribotypes isolated from horses were not shared
67

between consecutive months but were sampled sporadically. For example, ribotype 5
was first observed in horse B in October 2002, then in horse A in December 2002 and
again in horse E in March 2003.
Human
A Human
B Human
C Cow A Cow B Cow C Horse A Horse B Horse C
Jun-02 - - - X X X X X X
Jul-02 - - - 6c 8c - X X X
Aug-02 1m 1m - 7c 8c 2c,6c - 3h -
Sep-02 - - - - - - 3h - 2h,3h,8h,9h,
11h
Oct-02 - - - 4c 8c - 2h,11h 5h,7h,9h 10h
Nov-02 - 1m - - - - 11h - -
Dec-02 1m 1m - X X X 5h,11h 10h,12h 6h,12h
Jan-03 1m 1m - 1c 1c,2c,3c 2c - - 1h
Feb-03 - 1m - 3c 4c 5c 1h,8h 4h,12h 3h,12h
Mar-03 - 1m - 5c,8c 8c 7c 2h,7h - 4h,5h
Apr-03 - - - X X X 6h,7h,8h - -
May-03 1m 1m - X X X
X X X
Table 8. Ribotype sharing by individuals within the same source category over time. Each number/letter represents a different ribotype. The letters correspond to a source category (m=human, c=cow, h=horse).
- signifies that there were no shared patterns in that month x signifies that the individual was not sampled in that month
68

Antibiotic Resistance Analysis (ARA)
A far greater amount of antibiotic resistance pattern (ARP) sharing over time was
observed in all three source categories than was observed by ribotyping. Due to the
difference in sample sizes for each typing method, four times as many isolates were
processed by ARA at each sampling event compared to ribotyping, resulting in a
comparison of hundreds more ARA isolates.
Twenty different ARPs were shared by the E. coli populations of human
individuals over time (Table 9A). Half of these ARPs were observed in the E. coli
population of all three human individuals at some point during the sampling. Generally,
the shared ARPs were present for no more than two months for any individual, however
three ARPs (6,8,13) were observed at more than 6 sampling events each. ARP 13 seems
to follow the same trend observed for ribotype 1m in the previous section. This result
was not unexpected because all E. coli isolates from humans A and B that had ribotype 1
also had ARP 13. This ARP is found in human B for eight months and is shared by
human A in three of those months and human C in one month. As mentioned earlier, the
fact that human A and B live in the same household may have influenced the sharing of
this E. coli subtype.
Eighteen different ARPs were shared by E. coli isolates from different individual
beef cattle during the sampling period (Table 9B). Over half of these ARPs (60%) were
shared by all three cattle at some point during the sampling period, which was very
similar to the results observed for the human source category. The E. coli populations of
horses demonstrated the greatest amount of ARP sharing through time (Table 9C).
Thirty-four different ARPs were shared by more than one horse individual at some point
69

during the sampling period. These results demonstrate that the source category with the
least diverse E. coli populations (humans) tends to have the lowest frequency of subtype
sharing over time, while the source category with the most diverse E. coli populations
(horses) tends to have the highest frequency of subtype sharing over time.
70
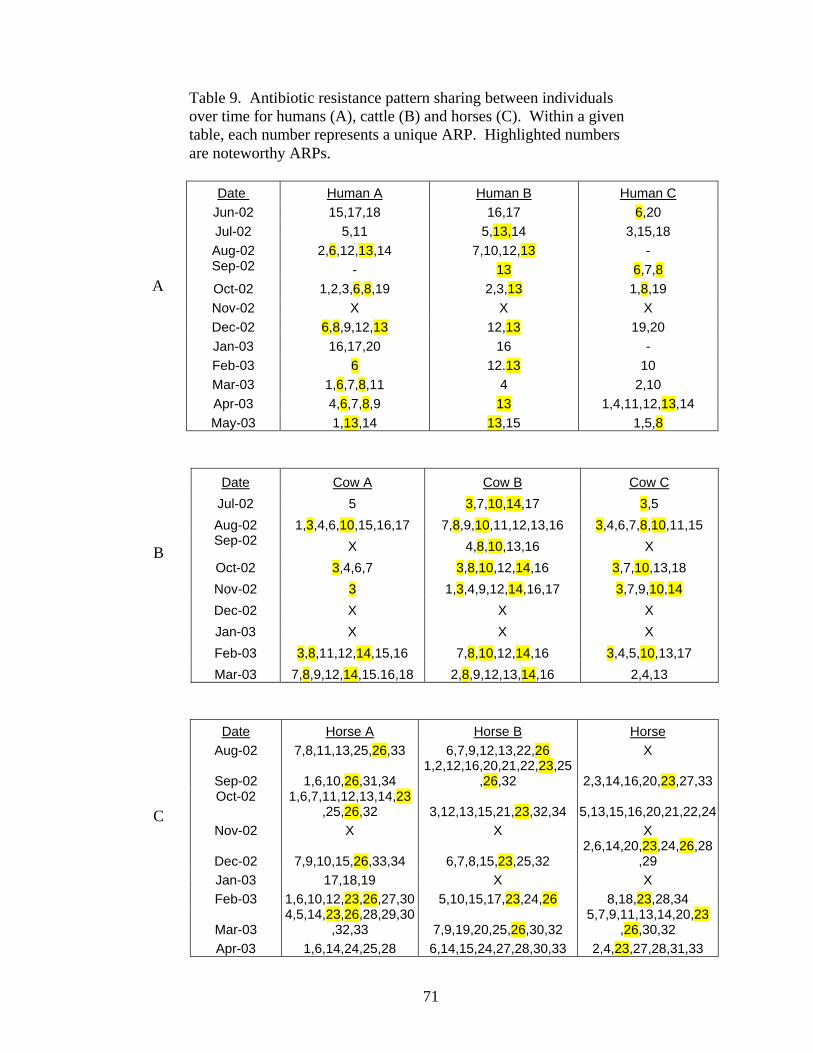
Date Human A Human B Human C Jun-02 15,17,18 16,17 6,20 Jul-02 5,11 5,13,14 3,15,18 Aug-02 2,6,12,13,14 7,10,12,13 - Sep-02 - 13 6,7,8 Oct-02 1,2,3,6,8,19 2,3,13 1,8,19 Nov-02 X X X Dec-02 6,8,9,12,13 12,13 19,20 Jan-03 16,17,20 16 - Feb-03 6 12.13 10 Mar-03 1,6,7,8,11 4 2,10 Apr-03 4,6,7,8,9 13 1,4,11,12,13,14 May-03 1,13,14 13,15 1,5,8
Date Cow A Cow B Cow C Jul-02 5 3,7,10,14,17 3,5 Aug-02 1,3,4,6,10,15,16,17 7,8,9,10,11,12,13,16 3,4,6,7,8,10,11,15 Sep-02 X 4,8,10,13,16 X Oct-02 3,4,6,7 3,8,10,12,14,16 3,7,10,13,18 Nov-02 3 1,3,4,9,12,14,16,17 3,7,9,10,14 Dec-02 X X X Jan-03 X X X Feb-03 3,8,11,12,14,15,16 7,8,10,12,14,16 3,4,5,10,13,17 Mar-03 7,8,9,12,14,15.16,18 2,8,9,12,13,14,16 2,4,13
Date Horse A Horse B Horse Aug-02 7,8,11,13,25,26,33 6,7,9,12,13,22,26 X
Sep-02 1,6,10,26,31,34 1,2,12,16,20,21,22,23,25
,26,32 2,3,14,16,20,23,27,33Oct-02 1,6,7,11,12,13,14,23
,25,26,32 3,12,13,15,21,23,32,34 5,13,15,16,20,21,22,24Nov-02 X X X
Dec-02 7,9,10,15,26,33,34 6,7,8,15,23,25,32 2,6,14,20,23,24,26,28
,29 Jan-03 17,18,19 X X Feb-03 1,6,10,12,23,26,27,30 5,10,15,17,23,24,26 8,18,23,28,34
Mar-03 4,5,14,23,26,28,29,30
,32,33 7,9,19,20,25,26,30,32 5,7,9,11,13,14,20,23
,26,30,32 Apr-03 1,6,14,24,25,28 6,14,15,24,27,28,30,33 2,4,23,27,28,31,33
C
B
A
Table 9. Antibiotic resistance pattern sharing between individuals over time for humans (A), cattle (B) and horses (C). Within a given table, each number represents a unique ARP. Highlighted numbers are noteworthy ARPs.
71

Discussion
Two findings emerged from the analysis of E. coli subtypes in individuals over
time. The most obvious result, which was observed in every individual sampled, was that
the dominant E. coli populations within individuals are temporally variable, i.e, new
subtypes were frequently observed within the populations over time. The second finding
of this study was that subtype sharing (repeatedly observed subtypes) between
individuals within a source category increased over time. For this phase, subtype sharing
is defined as a subtype being observed in two different individuals regardless of the time
the subtype is observed.
Few studies have followed E. coli populations over time, and ours is the first to
monitor the subtypes of E. coli populations, as determined by ribotyping and antibiotic
resistance analysis, in specific individuals from different animal sources over time.
Caugant subtyped the E. coli population of a single human by MLEE twenty-two times
over an eleven-month period (15). New E. coli subtypes appeared every month, and a
total of 53 different subtypes were observed throughout the sampling period. However,
three subtypes persisted throughout the sampling period. Furthermore, the diversity of E.
coli subtypes remained relatively consistent over time, as a single dominant subtype
comprised the majority of the sampled isolates at any given time. It is important to note
that the sampling events in Caugant’s study were not evenly spaced. In some months the
subject was sampled daily, while other sample events were separated by as many as five
months. Therefore, although the dominant E. coli subtypes sampled tended to vary over
time, it is difficult to interpret the frequency of change in this population. In spite of the
72
methodological discrepancies, the findings from the MLEE study (15) generally support
the findings of this study: when individuals are sampled on a month-by-month regime,
variability over time is observed in their respective E. coli populations. On the other
hand, some relatively persistent E. coli subtypes were observed in most individuals.
A major consideration in interpretation of the results of the current study, which
has been mentioned previously, is the small sample size used in the current study. Only
five isolates were collected per individual each month. This number was chosen because
other BST studies have collected five isolates or less per individual when creating a
library (10, 33, 80), and for the sake of practicality. It is possible that a temporally stable
E. coli population within an individual has so many different subtypes that each month a
different combination of subtypes would be collected, giving the false impression of
temporal instability. It would be important to test for this scenario, if the true diversity
of a population was being studied. However, the current study investigated the temporal
stability of E. coli populations as it applies to BST. Therefore, although the results of the
current study do not represent the dynamics of the total E. coli population, the results do
represent the dominant E. coli population that would be used when creating a BST
library.
The second finding of the current study was that subtype sharing between
individuals within a host species increases over time. One explanation for this
observation may be that E. coli subtypes are cycled between individuals within a source
category. This idea would be most applicable to herd animals, such as beef cattle and
horses, because of the close proximity of individuals within a population. Horses, with
the most diverse E. coli populations, demonstrated the largest frequency of subtype
73

sharing over time, while humans, with the least diverse E. coli populations, demonstrated
the lowest frequency of subtype sharing over time. These results support the above
hypothesis. However, another cause of the observed increase in subtype sharing over
time may be a function of sampling effort coupled with fluctuations in the dominant E.
coli subtype(s) in the feces at any given time. As more isolates are collected over time,
the possibility of observing shared E. coli subtypes increases. Such E. coli subtypes may
have been present in multiple individuals at all times but were missed because of the
small number of isolates collected from each individual at any given time.
Other studies have also observed high levels of subtype sharing within
individuals from the same host species over time. The MLEE subtyping study of
Australian feral mice (22) determined that 48% of mice shared one of three common
subtypes. This frequency of subtype sharing is greater than that observed in the current
study, probably because the MLEE study sampled 447 individuals while the current study
only sampled three. Ribotyping of E. coli isolates from yearling steers, collected at four
sampling events over a fifteen month period, (39) found that 8.3% of observed ribotypes
were shared by multiple steers from different sampling events. A higher frequency of
ribotype sharing over time was observed in the E. coli populations of horses and beef
cattle in the current study. Sixteen percent of the observed beef cattle ribotypes over
time were shared at different sampling events, and 13% of the observed horse ribotypes
were shared at different sampling events. The frequency of sampling events over time is
one possible reason for higher frequency of subtype sharing observed in the current
study. The yearling steers were sampled four times over fifteen months, while the cattle
and horses were sampled eight and nine times, respectively, over nine months.
74

In summary, the dominant E. coli populations of all individuals were variable
over time when using the described sampling procedure for collecting E. coli isolates,
and the frequency of subtype sharing increased over time, suggesting a possible cycling
of E. coli subtypes between individuals within a source category. These results
demonstrate that E. coli may not be a good candidate for BST libraries if the library is
meant for any long-term use.
75

Chapter 4. Intensive Sampling of E. coli from One Human for One Month
Materials and Methods
Sample Collection and Processing
One human individual was sampled every day for two weeks, followed by weekly
sampling for the remainder of one month. Single samples were obtained at each sampling
session using rectal swabs. E. coli isolates were processed as described previously
(Chapter 2, Materials and Methods). Four MUG-positive E. coli isolates per swab were
analyzed by ribotyping and all MUG-positive E. coli isolates (20-24 isolates) were
analyzed by ARA. Isolates chosen for ribotyping were a subset of the isolates subtyped
by ARA.
Two rounds of ribotyping were performed on these isolates. The first round was
the procedure described previously (Chapter 2 Materials and Methods), using Hind III as
the restriction enzyme in the DNA digestion. The protocol was slightly modified in the
second round by substituting Pvu II as the restriction enzyme used in the DNA digestion
as well as adding bovine serum albumin (BSA) (Promega, Madison WI) to the digestion
mix. BSA was added to increase enzyme (Pvu II) performance according to the
manufacturer’s instructions. Ribotypes were analyzed and compared using BioNumerics
software as described previously
76

Results
Distribution of Ribotypes and Antibiotic Resistance Profiles Found in Human X
Over Time
The fecal bacteria of human X were sampled on a daily basis for two weeks, and
once a week for the subsequent two weeks in order to investigate the E. coli population
structure within its feces. Human X was chosen for sampling because it had been taking
trimethoprim/sulfamethoxazole twice a day for seven days for the treatment of an urinary
tract infection. Treatment was completed one week prior to the first sampling event. The
hypothesis was that antibiotic use would alter the population structure of E. coli in this
human, resulting in greater diversity. All of the E. coli isolates sampled over the course
Figure 14. A ribotype gel using Hind III representing isolates from the first two days of sampling from human X.
1 2 3 4 5 6 7
- Lane 1; E. coli + control - Lanes 2,4 & 7; ribotype 1 - Lanes 5 & 6; ribotype 2 - Lane 3; empty
Figure 15. A ribotype gel using Pvu II representing isolates from the first two days of sampling from human X.
1 2 3 4 5 6 7
- Lane 1; E. coli + control - Lanes 2,3,4 & 7; ribotype 1 - Lanes 5 & 6; ribotype 2
77

of the experiment shared a single Hind III ribotype when the criterion of 90% similarity
was applied. However, upon closer inspection of the membranes, two separate ribotypes
were observed (Figure 14). The two Hind III ribotypes differed by a single band in the
high molecular weight region of the gel. In order to obtain greater discrimination,
ribotyping was performed on these isolates a second time with the restriction enzyme Pvu
II (Figure 15), which resolved two distinct subtypes in the E. coli population of human X.
Ribotypes 1 and 2, as they were designated, consistently linked with the two ribotypes
observed by eye using Hind III. Ribotype 1 made up 91% of E. coli isolates from human
X.
Antibiotic resistance analysis of the isolates from human X revealed ten different
antibiotic resistance patterns (ARPs) (Table 9). The vast majority of E. coli isolates were
represented by one of two ARPs. Seventy percent of the E. coli isolates from human X
shared ARP 3, while 21% shared ARP 9 (Figure 16). Inspection of the two dominant
ARPs revealed that ARP 3 represented an antibiotic resistance pattern showing little
Figure 16. Distribution of ARPs of E. coli isolates sampled from human X. Each number corresponds to a unique ARP.
Distribution of E. coli isolates among ARPsn = 383
12345678910
78
resistance to any antibiotics, while ARP 9 represented an antibiotic resistance pattern
showing heavy resistance to many antibiotics. Figure 17 is a similarity dendrogram
demonstrating isolates that share ARP 3 and ARP 9. The colored squares represent the
level of resistance and isolate has to the given antibiotics. The darker the square, the
higher the level of resistance. For example, isolate 266 had ARP 9 and displayed
resistance to the highest levels of amoxicillin, chloremphenicol, chlortetracycline,
doxycycline, oxytetracycline, penicillin, tetracycline, trimethoprim, to the second highest
level of cephalothin, and rifampicin, and was susceptible to gentamycin, kanamycin,
neomycin, naladixic acid, norfloxacin and streptomycin (Figure 17, Table 10).
The E. coli population of human X was also monitored over time by subtyping
with ARA (Figure 18). ARP 3, representing the weakly resistant isolates, was observed
at every sampling event and was often the dominant pattern at that time. ARP 9,
representing the heavily resistant isolates, was consistently present in the first two weeks
of sampling and was not observed again for the remainder of the sampling period.
Similar results were observed with the E. coli isolates subtyped by ribotyping (Figure
19). Ribotype 1 was found at every sampling date and was the dominant ribotype at each
sampling event except one (3/26). Ribotype 2 was only observed at four sampling dates,
all within the first two weeks of the sampling period.
79

Antibiotic Resistance Pattern
1 2 3 4 5 6 7 8 9 10 AMX 0 0 0 0 0 4 32 32 32 0 CEP 8 8 0 0 0 0 8 0 8 8 CLP 4 4 4 4 4 4 4 4 4 20 CHT 20 20 20 20 20 20 20 20 80 4 DOX 0 0 0 0 0 0 4 0 4 0 GEN 0 0 0 0 0 0 0 0 0 0 KAN 0 3 0 3 0 0 0 0 0 0 NA 0 0 0 0 3 0 3 0 0 0
NEO 0 0 0 0 0 0 0 0 0 0 NOR 0 0 0 0 0 0 0 0 0 0 OXY 0 0 0 0 0 0 20 0 20 20 PEN 20 20 20 20 20 20 200 20 200 200 RIF 2 2 2 2 2 2 2 2 2 2 STR 0 0 0 0 0 0 20 0 20 0 TET 0 0 0 0 0 0 0 0 64 64 TRI 0.25 0.25 0.25 0.25 0.25 0.25 0.25 0.25 1 1 TS 0 0 0 0 0 0 5 0 5 5
Table 10. Antibiotic resistance patterns (ARPs) of E. coli sampled from human X. Each number represents a unique ARP.
80

Figure 17. Similarity dendrogram for antibiotic resistance patterns of E. coli isolated from human X. The numbers correspond to isolate identifiers. The colored squares demonstrate levels of resistance to the various antibiotics. The darker the square, the higher the resistance.
100
959085807570 AMX
CEP
CLP
CHT
DOX
GEN
KAN
NA
NEO
NOR
OXY
PEN
RIF
STR
TET
TRI
TS265
361
73
178
274
370
82
179
275
371
83
276
372
84
170
362
74
171
363
75
268
364
269
365
270
366
175
271
367
79
272
368
80
177
273
369
81
180
266
267
169
172
76
173
77
174
78
176
ARP 9
ARP 3
Isolates
81

Figure 18. Distribution of antibiotic resistance patterns over time for E. coli isolated from human X. Each color and number represents a unique pattern.
Human X - ARA
0
5
10
15
20
25
30
3/24/2
003
3/26/2
003
3/28/2
003
3/30/2
003
4/1/20
03
4/3/20
03
4/5/20
03
4/7/20
03
4/9/20
03
4/11/2
003
4/13/2
003
4/15/2
003
4/17/2
003
4/19/2
003
4/21/2
003
# of
isol
ates
with
AR
P
1 23 45 6
7 89 10
Figure 19. Distribution of ribotypes over time for E. coli isolated from human X. Each color and number represents a unique ribotype.
Human X -Ribotyping
00.5
11.5
22.5
33.5
44.5
3/24/2
003
3/26/2
003
3/28/2
003
3/30/2
003
4/1/20
03
4/3/20
03
4/5/20
03
4/7/20
03
4/9/20
03
4/11/2
003
4/13/2
003
4/15/2
003
4/17/2
003
4/19/2
003
4/21/2
003
# of
isol
ates
with
ribo
type
21
82

The presence of two dominant ribotypes and two dominant ARPs in the E. coli
population in human X prompted the decision to link the ribotypes with their respective
ARPs. We hypothesized that ribotype 1 would consistently link with ARP 3 (weakly
resistant) and that ribotype 2 would consistently link with ARP 9 (heavily resistant).
Ribotype 2 isolates did consistently link with ARP 9, however, E. coli isolates with
ribotype 1 were found to have either ARP 3 or 9 during the sampling period (Table 10).
E. coli isolates exhibiting ribotype 1 and ARP 9 were only observed in the second week
of sampling and were not subsequently observed. The proportion of E. coli isolates with
each combination of ribotypes and ARPs is presented in Figure 20. Only 6% of all
ribotyped E. coli isolates have the combination of ribotype 1 with ARP 9.
Number of E. coli isolates with Ribotype/ARP combination
Ribotype 1/ARP 3Ribotype 1/ARP 9Ribotype 2/ARP 9Other
Figure 20. Frequency of observations of E. coli ribotype/ARP combinations in human X. The “Other” group represents those ribotypes that did not display ARP 3 or 9.
83
Discussion
Based on the data obtained from monthly sampling of different individuals
(Chapter 3, Results) it was determined that for some individuals, the entire E. coli
population can turn over in one month. One concern was that a single month was too
long an interval to observe the actual dynamics of an E. coli population, i.e a population
may turn over multiple times in a single month. In order to observe more detailed
population dynamics over time, the E. coli population of a single individual (human X)
was sampled more frequently (on a daily basis). It was not known until after the
sampling period was complete that human X had finished antibiotic treatment with
trimethoprim/sulfamethoxazole five days before sampling began. Therefore, it is not
valid to use the E. coli population of human X during this sampling period to judge the
daily population dynamics of an unperturbed E. coli population. However, because of
human X’s antibiotic treatment prior to sampling, the current study was able to observe
the effect of outside influences, like antibiotic treatment, on the E. coli population of a
human individual.
The results of the current study demonstrated that there were two dominant
subtypes in the E. coli population of human X during the first two weeks of sampling, as
determined by ribotyping and antibiotic resistance analysis. One of these subtypes was
present throughout the sampling period while the second subtype was only observed in
the first two weeks. The antibiotic resistance pattern that was lost represents a heavily
resistant pattern, leaving a single dominant pattern of weak resistance. We hypothesized
that the antibiotic treatment selected for the subtype carrying the heavily resistant pattern.
84

However, once treatment ended, this E. coli subtype would no longer have a selective
advantage, and it may not have been competitive with the subtype that became dominant
in the absence of selective pressures. These antibiotic resistance data correspond to the
shift in subtype dominance with ribotyping.
The two dominant ribotypes and the two dominant ARPs isolated from human X
exhibited similar behavior over time. Ribotypes were linked to their respective ARPs
with the expectation that ribotype 1 would consistently link with ARP 3, the weakly
resistant pattern, and ribotype 2 would consistently link with ARP 9, the heavily resistant
pattern. The majority of ribotypes were associated with their respective ARPs in this
fashion, however 6% of the E. coli ribotypes from human X were designated ribotype 1
with ARP 9. One reason for this discrepancy may be that the heavy resistance found in
ARP 9 is plasmid driven. Therefore, any ribotype with this plasmid would demonstrate
the appropriate resistance pattern (ARP 9), including both ribotype 1 and 2. Further
research needs to be conducted on the E. coli isolated from human X to determine if this
hypothesis is correct.
Ribotyping using Hind III alone was not able to resolve differences in certain E.
coli subtypes. By using a second restriction enzyme (Pvu II) on the same isolates in a
separate digest, greater discrimination was achieved. The diversity observed in E. coli
populations presented in previous sections of this study based on ribotyping (Chapter 2
and 3, Results) is therefore a conservative estimate of the true diversity present. Most
ribotyping studies utilize a single restriction enzyme (Hind III) (10, 49, 59, 75).
Therefore the results of the current study, although a conservative estimate, have practical
implications when addressing issues involving other ribotyping BST studies.
85

Throughout this study, the term “subtype” is used as an overarching definition for
any unique “fingerprint” of an E. coli isolate determined by the chosen typing method.
Based on this definition, the variability of E. coli subtypes within an individual is not
only determined by individual host dynamics but, in part, determined by the subtyping
technique. In the current study, more antibiotic resistance patterns were observed in E.
coli populations than ribotypes, suggesting greater discriminatory capability for ARA
compared to ribotyping. These results demonstrate the need to obtain preliminary data on
indicator organism population structure using the subtyping technique that will be used in
the actual study. For example, it would not be useful to use the results from phenotypic
subtyping as a guide to the sampling strategies for a genotypic subtyping study. As a
scientist, one chooses a subtyping method and acknowledges the limitations inherent in
the method. Therefore, it must be understood that the conclusions of this study are an
estimation of the population dynamics of E. coli as determined by the chosen typing
method and may not represent the dynamics of E. coli populations that would be
observed using other typing techniques.
86

Chapter 5. Sampling of Cattle Herds From Four Geographic Regions
Materials and Methods
Sample Collection and Processing Samples were obtained from five beef cattle individuals within a herd. Four herds
were each sampled one time from four different geographic regions of varying distance
from one another. Herd TFL was located in Tampa, Florida, herd PCFL was located in
Plant City, Florida, herd GFL was located in Gainesville, Fl, and herd HMS was located
in Hattiesburg, Mississippi. Samples were obtained using fecal swabs and E. coli isolates
were processed as described previously (Chapter 2 Materials and Methods). Fifteen
MUG-postive E. coli isolates were processed using ribotyping and the ribotypes were
compared using BioNumerics software as described previously (Chapter 2 Materials and
Methods). One-way ANOVA with Dunnett's post test was performed using GraphPad
InStat version 3.00 (GraphPad Software, San Diego California) to determine differences
in the E. coli population structures of different herds. Chi-square analysis (GraphPad
Software, San Diego California) was performed to compare the frequency of subtype
sharing observed between individuals within different herds and also to compare the
frequency of ribotype sharing between individuals from different herds. Significance was
determined at P <0.05.
87

Results
Population Structure of E. coli in Various Herds of Beef Cattle The dominant members of the E. coli populations of five individual cows from
four different beef cattle herds from various geographical regions were subtyped by
ribotyping. Ribotypes were analyzed and diversity indices were calculated as a method
of comparison (Table 11). The hypothesis was that E. coli population structures are
determined by host and not by location, therefore there would be no difference in the
population structure of E. coli in the feces of individuals from different herds. One way
ANOVA’s determined no significant difference between the E. coli populations of
individuals from different beef cattle herds according to the richness estimator (P=0.388),
Shannon index (P= 0.120), Simpson index (P=0.054) and Pielou’s eveness (P=0.388).
Ribotype sharing was assessed to determine if E. coli ribotypes within beef cattle
demonstrate any geographic distinctiveness. A geographically distinct E. coli population
would demonstrate a greater frequency of subtype sharing between individuals from a
specific region then between individuals from different regions. Figure 21 represents the
distribution of E. coli ribotypes among cattle individuals from all four herds in order to
demonstrate sharing within herds versus sharing between herds. More than half of the E.
coli isolates from each of the four herds had ribotypes that were found only in one
specific herd (their herd of origin). The ribotypes from herds PCFL and GFL were the
least broadly distributed, as the majority of E. coli isolates (55% and 62% respectively)
88

Richness
Estimator (S) Shannon Index
(H') Pielou's Eveness
Index (J') Simpson's Index (1/λ)
Herd TFL (Tampa Fl)
Cow A (n = 15) 6 1.52 0.85 4.4 Cow B (n = 15) 3 0.88 0.8 2.4 Cow C (n = 15) 1 0 1 1 Cow D (n = 15) 5 0.7 0.43 1.9 Cow E (n = 15) 2 0.25 0.36 1.1
Mean 3.4 0.67 0.69 2.2
Herd PCFL (Plant City Fl) Cow AA (n=13) 4 1.27 0.91 4.5 Cow BB (n = 15) 6 1.62 0.9 6.3 Cow CC (n = 15) 5 1.4 0.88 3.7 Cow DD (n = 15) 5 1.23 0.77 3.1 Cow EE (n = 15) 6 1.68 0.93 6.7
Mean 5.2 1.44 0.88 4.9
Herd GFL (Gainseville FL) Cow AAAA (n = 15) 8 1.79 0.86 6.3 Cow BBBB (n = 15) 6 1.46 0.82 4.2 Cow CCCC (n = 11) 4 1.16 0.84 3.2 Cow DDDD (n = 15) 5 1.52 0.94 5.5 Cow EEEE (n = 15) 3 0.48 0.44 1.3
Mean 5.2 1.28 0.78 4.1
Herd HMS (Hattiesburg MS) Cow AAA (n = 15) 1 0 1 1 Cow BBB (n = 15) 6 1.4 0.77 3.5 Cow CCC (n = 15) 7 1.62 0.83 4.5 Cow DDD (n = 15) 1 0 1 1 Cow EEE (n = 15) 4 0.95 0.69 2.2
Mean 3.8 0.79 .86 2.4
Table 11. Diversity measurements of E. coli populations within beef cattle individuals from different herds.
89

from these herds had a ribotype observed in only a single individual beef cow within a
herd. About thirty percent of E. coli isolates from each of the three Florida herds had a
ribotype that was shared between more than one herd. The largest number of E. coli
isolates demonstrating ribotype sharing between multiple herds was observed in herd
HMS (47%). These data suggest that E. coli populations are not geographically distinct,
as the frequency of between herd ribotype sharing is greater than the frequency of within
herd ribotype sharing, however most ribotypes are limited to single individuals.
The frequency of ribotype sharing between individuals within a herd was
compared for all herds. There was significantly greater sharing of ribotypes between
individuals found in each of the Florida herds than was observed between individuals
found in the Mississippi herd (Chi-square, P < 0.01 for all tests). There was no
significant difference between the amount of ribotype sharing between herds observed in
either Florida herds or the Mississippi herd (Chi-square, P =0.833).
The E. coli isolates that had a ribotype found in more thane herdt were further
analyzed to determine if there was preferential ribotyping sharing, with a single herd
sharing its riboytpes with only one of the others, or if all herds were sharing their
ribotypes equally amongst themselves (Table 12). A single herd was held constant and
the amount of sharing between this herd and the remaining three was compared using
multiple chi-square tests. Significance values are presented in Table 13. Significantly
greater sharing of ribotypes was observed between herd PCFL and HMS than was
observed between herd PCFL and the two remaining Florida herds (TFL and GFL).
There was significantly greater sharing of ribotypes between herds TFL and GFL than
between GFL and the remaining two herds. These results suggest preferential ribotype
90

sharing between certain herds, however it does not appear that the preference is based on
region, as one of the Florida herds has a greater frequency of ribotype sharing with the
Mississippi herd instead of the other Florida herds.
Figure 21. Sharing of E. coli ribotypes within and between herds, expressed as percentages of total E. coli isolates isolated from a given herd.
Ribotype Sharing Within and Between Herds
0%
10%
20%
30%
40%
50%
60%
70%
TFL (n = 75) PCFL (n = 73) GFL (n = 66) HMS (n = 71)
% o
f E. c
oli i
sola
tes
SingleIndividual>1 individual
>1 herd
91
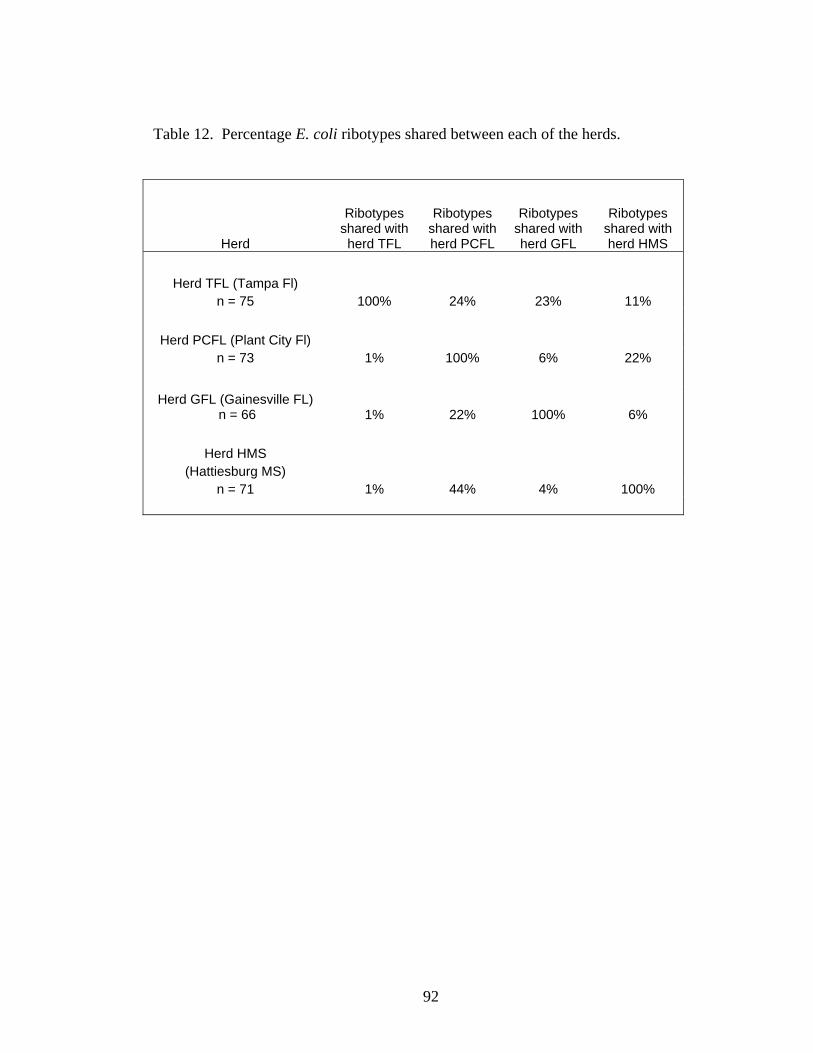
Herd
Ribotypes shared with herd TFL
Ribotypes shared with herd PCFL
Ribotypes shared with herd GFL
Ribotypes shared with herd HMS
Herd TFL (Tampa Fl)
n = 75 100% 24% 23% 11%
Herd PCFL (Plant City Fl) n = 73 1% 100% 6% 22%
Herd GFL (Gainesville FL)
n = 66 1% 22% 100% 6%
Herd HMS (Hattiesburg MS)
n = 71 1% 44% 4% 100%
Table 12. Percentage E. coli ribotypes shared between each of the herds.
92
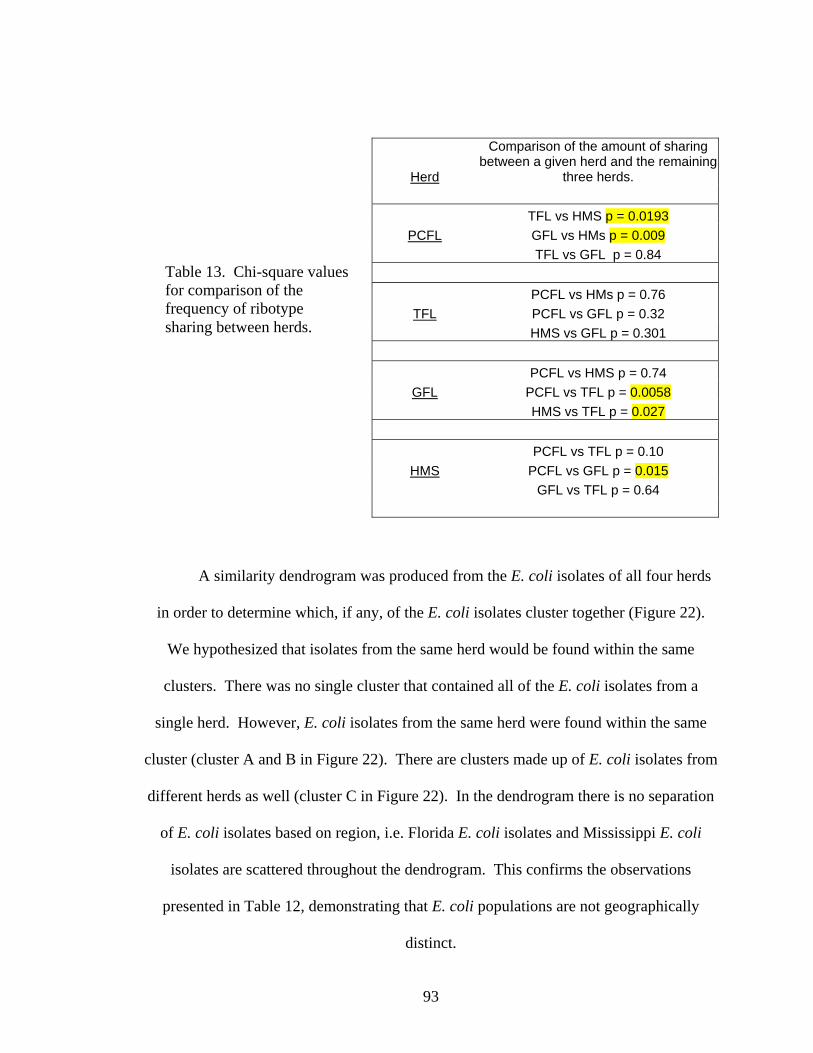
Herd
Comparison of the amount of sharing between a given herd and the remaining
three herds. TFL vs HMS p = 0.0193
PCFL GFL vs HMs p = 0.009 TFL vs GFL p = 0.84 PCFL vs HMs p = 0.76
TFL PCFL vs GFL p = 0.32 HMS vs GFL p = 0.301 PCFL vs HMS p = 0.74
GFL PCFL vs TFL p = 0.0058 HMS vs TFL p = 0.027 PCFL vs TFL p = 0.10
HMS PCFL vs GFL p = 0.015 GFL vs TFL p = 0.64
Table 13. Chi-square values for comparison of the frequency of ribotype sharing between herds.
A similarity dendrogram was produced from the E. coli isolates of all four herds
in order to determine which, if any, of the E. coli isolates cluster together (Figure 22).
We hypothesized that isolates from the same herd would be found within the same
clusters. There was no single cluster that contained all of the E. coli isolates from a
single herd. However, E. coli isolates from the same herd were found within the same
cluster (cluster A and B in Figure 22). There are clusters made up of E. coli isolates from
different herds as well (cluster C in Figure 22). In the dendrogram there is no separation
of E. coli isolates based on region, i.e. Florida E. coli isolates and Mississippi E. coli
isolates are scattered throughout the dendrogram. This confirms the observations
presented in Table 12, demonstrating that E. coli populations are not geographically
distinct.
93

Figure 22. A similarity dendrogram of ribotypes generated from a subset of E. coli isolated from four cattle herds. An equal number of isolates from each herd were selected at random for inclusion in the dendrogram.
Dice (Opt:0.20%) (Tol 0.7%-0.7%) (H>0.0% S>0.0%) [0.0%-100.0%]ribotyping
100
908070605040302010
Cow416
Cow417
Cow430
Cow432
Cow415
Cow35
Cow386
Cow240
Cow242
Cow241
Cow445
Cow447
Cow255
Cow256
Cow257
Cow370
Cow372
Cow270
Cow271
Cow50
Cow52
Cow431
Cow225
Cow227
Cow355
Cow356
Cow357
Cow340
Cow342
Cow371
Cow310
Cow311
Cow312
Cow325
Cow327
Cow286
Cow287
Cow341
Cow446
Cow401
Cow402
Cow326
Cow95
Cow96
Cow97
Cow80
Cow81
Cow82
Cow65
Cow66
Cow67
Cow400
Cow36
Cow37
Cow285
Cow272
Cow51
Cow385
Cow387
Cow226
Gainesville
Gainesville
Gainesville
Gainesville
Gainesville
Tampa
Gainesville
Plant City
Plant City
Plant City
Gainesville
Gainesville
Plant City
Plant City
Plant City
Hattiesburg
Hattiesburg
Plant City
Plant City
Tampa
Tampa
Gainesville
Plant City
Plant City
Hattiesburg
Hattiesburg
Hattiesburg
Hattiesburg
Hattiesburg
Hattiesburg
Hattiesburg
Hattiesburg
Hattiesburg
Hattiesburg
Hattiesburg
Plant City
Plant City
Hattiesburg
Gainesville
Gainesville
Gainesville
Hattiesburg
Tampa
Tampa
Tampa
Tampa
Tampa
Tampa
Tampa
Tampa
Tampa
Gainesville
Tampa
Tampa
Plant City
Plant City
Tampa
Gainesville
Gainesville
Plant City
C
B
A
94

Discussion
Two major findings, based on ribotyping results, were observed in this phase of
the current study. The first finding was that no geographically-driven differences in the
E. coli population structures could be discerned in beef cattle. The second major finding
was that E. coli populations of beef cattle did not form distinctive groups on the herd
level or the state level. The frequency of subtype sharing between individuals within
beef cattle herds was no greater than the frequency of subtype sharing between
individuals from different beef cattle herds. No greater frequency of ribotype sharing
was observed between beef cattle herds located in Florida than between beef cattle herds
from different states (i.e. Florida and Mississippi). In general, 62% of the E. coli
ribotypes sampled from beef cattle were confined to a single individual.
Similar results have been observed in studies of E. coli populations of individual
humans from different regions. One such study subtyped the E. coli populations of five
families (34 individuals) by MLEE (14). These families were located in two separate
regions, New York and Massachusetts. The results of this study were mentioned
previously (Chapter 2, Discussion) when discussing the E. coli population structure of
individuals from different animal categories. Eighty-five percent of E. coli subtypes were
limited to a single individual, and only a small proportion (7%) of E. coli subtypes were
shared between individuals from different families. Five percent of the subtypes were
shared between individuals from the same state and only two percent of the E. coli
subtypes were shared between individuals from different states. These results suggest
that geographic distinctiveness on the state level may exist in E. coli populations from
humans, however more individuals from different states should be sampled before this
95

hypothesis is accepted. Another study investigated geographic distinctiveness of E. coli
populations in humans from different countries (82), subtyping 178 E. coli isolates by
MLEE collected from humans located in the United States, Sweden, and Tonga. Each
human sampled provided a single E. coli isolate. The study demonstrated that there is
little genetic differentiation between E. coli subtypes from each of the three regions and
that the majority of humans sampled had a unique E. coli subtype. Both studies (14, 82)
observed very limited, if any, geographic distinctiveness in the E. coli populations of
humans, and most subtypes were confined to single individuals.
Results from these studies support the observations of the current study, i.e. most
E. coli subtypes were limited to a single beef cow. However, the current study
demonstrated a much greater frequency of subtype sharing between individuals. The
hypothesis was that greater sharing of subtypes would be observed between the Florida
herds than between the Florida and Mississippi herds, and that E. coli populations would
be geographically distinct on the state level. This was not observed in this study.
Sharing between herds appeared random with respect to geographic distance. One
Florida herd (PCFL) shared more subtypes with the Mississippi herd (HMS) than with
any other herd, while the other two Florida herds (TFL and GFL) demonstrated greater
sharing of subtypes between each other. It should be noted that the sample size for the
current study was relatively small, as only three herds from Florida were sampled and
only one herd from another state (Mississippi) was sampled, and only five cattle were
sampled from each herd. Beef cattle herds can be made up of hundreds of cows. It is
possible that if more individuals from a single herd were sampled, a greater frequency of
subtype sharing within a herd would be observed. More herds from within Florida as
96

well as from different states would need to be subtyped and compared in order to
determine the true extent, if any, of geographic distinctiveness. In summary, the E. coli
populations of beef cattle displayed no measurable geographical distinctiveness as the
frequency of subtype sharing within herds was no greater than the frequency of subtype
sharing between herds.
97

Chapter 6. Discussion – Implications for Bacterial Source Tracking (BST) Each part of the larger study addresses some question relevant to bacterial source
tracking (BST) methods that rely on E. coli as the indicator organism:
• Is the population structure of E. coli dependent on host species?
• Is there greater subtype sharing between individuals within a hosts species than
between individuals from different host species?
• Are the dominant E. coli populations of individuals invariant or variable over
time?
• What effect does a major physiological perturbance, like antibiotic therapy, have
on the temporal variability of an E. coli population?
• Does geographic distance correlate with the observed variability in E. coli
subtypes in cattle?
The “perfect” indicator organism for a BST library would have the following
characteristics: 1) it would demonstrate a large amount of subtype sharing within a host
species but no subtype sharing between host species, 2) it would have a stable population
within individuals over time, and 3) it would exhibit no geographically-associated
variability, i.e. individuals within host species would share the same subtypes regardless
of location. This final characteristic of the “perfect” indicator differs from the previously
mentioned criteria set out by in Gordon (23). Gordon argues that having a geographically
98

distinct indicator population is necessary because this characteristic allows a well-
sampled library to be highly effective when used on a specific watershed. However,
limiting the use of a library to single watersheds requires the construction of a large
number of libraries. It has been argued by others that the “perfect” indicator organism
should have no geographic distinction, allowing for the construction of a single library
that is applicable over a large geographic area (72). A better understanding of the
population dynamics of E. coli within various hosts can aid the resolution of the
questions above and help determine whether E. coli is the appropriate indicator
microorganism for BST.
Optimizing sampling strategy to achieve adequate representation of the E. coli
subtypes within host animals, without repeatedly sampling “sister clones” is necessary for
efficient construction of BST libraries. A well-sampled BST library is one that fully
represents the diversity of the indicator organism in all sources (80, 85). This study has
demonstrated that the diversity of E. coli populations differ based on host species using
either ribotyping or antibiotic resistance analysis, therefore sampling strategies need to be
adjusted when collecting isolates from various host species. Previous BST studies have
utilized arbitrarily chosen sample sizes for library construction (10, 28, 33, 80, 84).
Some studies collected the same number of isolates for each source category, while
others utilized the available isolates without a defined sampling plan. The results of this
study support the argument that the E. coli population structure in various hosts should
provide the basis for designing a sampling plan. For example, due to the significantly
greater diversity observed in horse E. coli populations compared to those in humans and
cattle, more isolates should be collected from a single horse than from a single human.
99

A consistent observation was that many E. coli ribotypes were limited to single
host animals. These data suggest high subytpe variability in E. coli populations
determined by ribotyping. Other studies using genetic subtyping techniques on E. coli
isolates support this high variability (39, 46, 50). The high genetic variability in E. coli
suggests that BST libraries would require very large numbers of isolates from many
different individuals to be effective (72, 80).
The frequency of ribotype sharing between individuals from the same host
species was relatively low, which was unexpected, particularly since the five horses and
five cattle were from the same herd. There was no significant difference in the frequency
of ribotype sharing within a host species vs. between host species. It is important to note
that the sample size in this study was small, as only five individuals for each source
category were sampled, and only fifteen isolates from each individual were ribotyped.
Greater ribotype sharing might be observed with larger sample sizes (17).
In contrast to ribotype sharing, a much greater frequency of antibiotic resistance
subtype sharing was observed between individuals. Within each host species, the
majority of E. coli isolates had an antibiotic resistance pattern (ARP) found in more than
one individual. There was also a large number of E. coli isolates (58%) represented by an
ARP found in all three source categories. In fact, a single ARP made up of almost 400 E.
coli isolates was observed in all three source categories. Such a large frequency of ARP
sharing between sources can severely impair the accuracy of a BST library, as unknown
E. coli isolates may have an ARP belonging to a number of different host species.
Another observation that has implications for the structure of BST libraries is the
fact that over time, the subtypes of E. coli populations within individuals vary. One
100

sample event per individual will therefore not capture the diversity that is present over
time, so more work is needed to the make a representative library, including sampling
individuals more than once over time. Having a temporally variable E. coli population
within host species may also limit the long term effectiveness of a BST library (23).
The current study did not detect geographically distinct E. coli populations in beef
cattle. The majority of E. coli isolates sampled had ribotypes that were observed in
single beef cows. Furthermore, the frequency of ribotype sharing between beef cattle
from the same region was no greater than the frequency of ribotype sharing between beef
cattle from different regions. These results suggest that a BST library would only be
applicable to the region where the host animals sampled are located. These results are
supported by another study of geographic variability that subtyped 1,800 isolates
collected from humans, swine, poultry, beef, and dairy cattle located in three regions of
Florida by ribotyping (64). The study found that a library constructed of isolates from
three regions of Florida was consistently effective for each region. This implies that a
BST library could be used over large geographic areas if isolates are collected from all
areas. Region-specific E. coli ribotypes in the beef cattle populations sampled may not
have been observed because of the small sample size used in this study, as mentioned
previously.
The results of the current study suggest that E. coli doe not have the appropriate
characteristics of the “perfect” BST organism: there is high subtype variability in E. coli
populations, which dictates that very large numbers of isolates are required for
constructing a BST library. Subtype sharing between source categories makes source
identification problematic. E. coli populations are temporally variable, limiting the long-
101

term effectiveness of BST libraries; and, E. coli subtypes do not appear to be extensively
shared by host species from different geographic regions, limiting the effective area of a
BST library. Therefore, other indicator organisms must be considered for BST, and
many studies have begun to use Enterococcus spp. (17, 27, 78, 79, 86). A study using
ARA on enterococci isolated from known sources in Virginia (85), addressed many of the
same issues discussed in the current study. The study observed that an enterococci BST
library was applicable over large geographic areas, however the library was more
effective for the areas where samples were collected. The enterococci study (85)
demonstrated that their BST library remained effective over one year, demonstrating the
potential for long term use. These results suggest that enterococci are better BST
organisms than E. coli, however further research is needed on Enterococcus spp. before it
can become the standard BST organism.
Two subtyping techniques were used in this study, ribotyping and antibiotic
resistance analysis (ARA). Ribotyping is a much more expensive and time consuming
method than antibiotic resistance analysis. For this reason, up to five times as many
isolates were subtyped using ARA compared to ribotyping. Although results from the
subtyping methods generally agreed, two major differences were observed. First, larger
diversity values were consistently associated with E. coli populations subtyped by ARA.
One reason for the observed difference may be the difference in sample size; more
isolates were subtyped with ARA so there was a greater chance of observing relatively
rare subtypes. The second major difference was observed in the amount of subtype
sharing between individuals from different source categories. E. coli isolates subtyped by
ARA demonstrated significantly greater amounts of subtype sharing between host species
102

compared to ribotyping results. The major conclusion from these results was that the
population structure of E. coli was determined not only by source, but also by the typing
technique and sample size chosen. Many studies support this observation and have
demonstrated different E. coli population dynamics within the same isolate set based on
subtyping techniques (4, 11, 46, 61, 65).
In summary, preliminary studies of E. coli populations using two different
subtyping techniques (ribotyping and ARA) suggest that E. coli may not be the
appropriate microorganism for library-based bacterial source tracking for the following
reasons:
1) Different sampling strategies are needed when collecting isolates from each
source category to construct a representative BST library.
2) An E. coli BST library may not be effective for long periods of time due to the
instability of E. coli populations within individuals.
3) BST libraries may only be effective in the limited region where isolates were
collected because E. coli populations tend to be individual-specific.
4) Preliminary studies must be performed using the chosen subtyping technique
because E. coli population structures differ based on technique as well as source.
103

References 1. American Public Health Association. 1998. Standard Methods for the
Examination of Water and Wastewater, 20th edition ed. American Public Health Association, Washington DC.
2. American Public Health Association. 1905. Standard Methods of Water Analysis,, 1 ed. American Public Health Association, Washington, DC.
3. Arthur, M., R. D. Arbeit, C. Kim, P. Beltran, H. Crowe, S. Steinbach, C. Campanelli, R. A. Wilson, R. K. Selander, and R. Goldstein. 1990. Restriction fragment length polymorphisms among uropathogenic Escherichia coli isolates: pap-related sequences compared with rrn operons. Infect Immun. 58(2):471-9.
4. Avery, S. M., E. Liebana, C. A. Reid, M. J. Woodward, and S. Buncic. 2002. Combined use of two genetic fingerprinting methods, pulsed-field gel electrophoresis and ribotyping, for characterization of Escherichia coli O157 isolates from food animals, retail meats, and cases of human disease. J Clin Microbiol. 40(8):2806-12.
5. Bitton, G., Koopman, B., and Jung, K. 1995. An assay for the enumeration of total coliforms and Escherichia coli in water and wastewater. Water Environment Research. 67(6):906-909.
6. Bitton, G. 1994. Wastewater Microbiology. Wiley-Liss, Inc., New York. 7. Bochner, B. R. 1996. The Biolog MicroStation System and General Procedures
for Identifying Environmental Bacteria and Yeast. In W. P. Olson (ed.), Automated Microbial Identification and Quantitation Technologies for the 2000's. Interpharm Press, NY, New york.
8. Bruce, J. 1996. Automated system rapidly identifies and characterizes microorganisms in food. Food Technology. January:77-81.
9. Byappanahalli, M. N., and R. S. Fujioka. 1998. Evidence that tropical soil can support the growth of Escherichia coli. Wat Sci Tech. 38(12):171-174.
10. Carson, C. A., B. L. Shear, M. R. Ellersieck, and A. Asfaw. 2001. Identification of fecal Escherichia coli from humans and animals by ribotyping. Appl Environ Microbiol. 67(4):1503-7.
11. Carson, C. A., B. L. Shear, M. R. Ellersieck, and J. D. Schnell. 2003. Comparison of Ribotyping and Repetitive Extragenic Palindromic-PCR for Identification of Fecal Escherichia coli from Humans and Animals. Appl Environ Microbiol. 69(3):1836-9.
12. Caugant, D. A., B. R. Levin, G. Lidin-Janson, T. S. Whittam, C. Svanborg Eden, and R. K. Selander. 1983. Genetic diversity and relationships among strains of Escherichia coli in the intestine and those causing urinary tract infections. Prog Allergy. 33:203-27.
104

13. Caugant, D. A., B. R. Levin, I. Orskov, F. Orskov, C. Svanborg Eden, and R. K. Selander. 1985. Genetic diversity in relation to serotype in Escherichia coli. Infect Immun. 49(2):407-13.
14. Caugant, D. A., B. R. Levin, and R. K. Selander. 1984. Distribution of multilocus genotypes of Escherichia coli within and between host families. J. Hyg. Camb. 92:377-384.
15. Caugant, D. A., B. R. Levin, and R. K. Selander. 1981. Genetic diversity and temporal variation in the E. coli population of a human host. Genetics. 98(3):467-90.
16. Dombek, P. E., L. K. Johnson, S. T. Zimmerley, and M. J. Sadowsky. 2000. Use of repetitive DNA sequences and the PCR To differentiate Escherichia coli isolates from human and animal sources. Appl Environ Microbiol. 66(6):2572-7.
17. Dontchev, M., Whitlock, J.E., and Harwood, V. J. 2003. Presented at the 103rd General Meeting, American Society for Microbiology, Washington, D.C.
18. Dufour, A. P. 1984. Health Effects Criteria for Fresh Recreational Waters EPA-600/1-84-004. U. S. Environmental Protection Agency.
19. Faith, N. G., J. A. Shere, R. Brosch, K. W. Arnold, S. E. Ansay, M. S. Lee, J. B. Luchansky, and C. W. Kaspar. 1996. Prevalence and clonal nature of Escherichia coli O157:H7 on dairy farms in Wisconsin. Appl Environ Microbiol. 62(5):1519-25.
20. Geldrich, E. E., and B. A. Kenner. 1969. Concepts of fecal streptococci in stream pollution. J Water Pollut Control Fed. 41:R336-R352.
21. Gerba, C. P., S. M. Goyal, R. L. Labelle, I. Cech, and G. F. Bodgan. 1979. Failure of indicator bacteria to reflect the occurrence of enteroviruses in marine waters. Am J Public Health. 69(11):1116-1119.
22. Gordon, D. M. 1997. The genetic structure of Escherichia coli populations in feral house mice. Microbiology. 143(Pt 6):2039-46.
23. Gordon, D. M. 2001. Geographical structure and host specificity in bacteria and the implications for tracing the source of coliform contamination. Microbiology. 147(Pt 5):1079-85.
24. Gordon, D. M., S. Bauer, and J. R. Johnson. 2002. The genetic structure of Escherichia coli populations in primary and secondary habitats. Microbiology. 148(Pt 5):1513-22.
25. Guan, S., R. Xu, S. Chen, J. Odumeru, and C. Gyles. 2002. Development of a procedure for discriminating among Escherichia coli isolates from animal and human sources. Appl Environ Microbiol. 68(6):2690-8.
26. Guttman, D. S., and D. E. Dykhuizen. 1994. Clonal divergence in Escherichia coli as a result of recombination, not mutation. Science. 266(5189):1380-3.
27. Hagedorn, C., J. B. Crozier, K. A. Mentz, A. M. Booth, A. K. Graves, N. J. Nelson, and R. B. Reneau. 2003. Carbon source utilization profiles as a method to identify sources of faecal pollution in water. J Appl Microbiol. 94(5):792-9.
28. Hagedorn, C., S. L. Robinson, J. R. Filtz, S. M. Grubbs, T. A. Angier, and R. B. Reneau, Jr. 1999. Determining sources of fecal pollution in a rural Virginia watershed with antibiotic resistance patterns in fecal streptococci. Appl Environ Microbiol. 65(12):5522-31.
105

29. Hahm, B. K., Y. Maldonado, E. Schreiber, A. K. Bhunia, and C. H. Nakatsu. 2003. Subtyping of foodborne and environmental isolates of Escherichia coli by multiplex-PCR, rep-PCR, PFGE, ribotyping and AFLP. J Microbiol Methods. 53(3):387-99.
30. Hanes, N. B., and R. Fragala. 1967. Effect of seawater concentration on survival of indicator bacteria. Water Pollut Control Fed. 39:97.
31. Harris, H. 1966. Enzyme polymorphism in man. Proc. R. Soc. Lond. Ser. B. 164:298-310.
32. Harwood, V. J., J. Butler, D. Parrish, and V. Wagner. 1999. Isolation of fecal coliform bacteria from the diamondback terrapin (Malaclemys terrapin centrata). Appl Environ Microbiol. 65(2):865-7.
33. Harwood, V. J., J. Whitlock, and V. Withington. 2000. Classification of antibiotic resistance patterns of indicator bacteria by discriminant analysis: use in predicting the source of fecal contamination in subtropical waters. Appl Environ Microbiol. 66(9):3698-704.
34. Havelaar, A. H., Pot-Hogeboom, W.M., Furuse K., Pot, R.,and Hormann, M.P. 1990. F-Specific RNA bacteriophages and sensitive host strains in faeces and wastewater of human and animal origin. J Appl Bacteriol. 69(1):30-37.
35. Hill, M. O. 1973. Diversity and eveness: A unifying notation and its consequences. Ecology. 54:427-432.
36. Hill, T. C. J., Walsh, K.A, Harris, J.A., and Moffett, B.F. 2003. Using ecological diversity measures with bacterial communities. FEMS Microbiology Ecology. 43:1-11.
37. Hsu, F. C., Y. S. Shieh, J. van Duin, M. J. Beekwilder, and M. D. Sobsey. 1995. Genotyping male-specific RNA coliphages by hybridization with oligonucleotide probes. Appl Environ Microbiol. 61(11):3960-6.
38. Hughes, J. B., Hellmann, J.J., Ricketts, T.H., and Bohannan, J.M. 2001. Counting the Uncountable: Statistical Approaches to Estimatiing Microbial Diversity. Appl Environ Microbiol. 67(10):4399-4406.
39. Jenkins, M. B., P. G. Hartel, T. J. Olexa, and J. A. Stuedemann. 2003. Putative temporal variability of Escherichia coli ribotypes from yearling steers. J Environ Qual. 32(1):305-9.
40. Kauffmann, F. 1944. Zur serolgie der coli-gruppe. Acta Pathol. Microbiol. Scand. 21:20-45.
41. Krumperman, P. H. 1983. Multiple antibiotic resistance indexing of Escherichia coli to identify high-risk sources of fecal contamination of foods. Appl Environ Microbiol. 46(1):165-170.
42. Lewontin, R. C., and J. L. Hubby. 1966. A molecular approach to the study of genic heterozygosity in natural populations. II. Amount of variation and degree of heterozygosity in natural populations of Drosophila pseudoobscura. Genetics. 54:595-609.
43. Ludwig, J. A., and Reynolds, J. F. 1988. Statistical Ecology. A primer on methods and computing. John Wiley and Sons, New York.
44. Maier, R. M., Pepper, I.L. and Gerba, C.P. 2000. Environmental Microbiology. Academic Press, San Diego.
106

45. Marzouk, Y., S. M. Goyal, and C. P. Gerba. 1980. Relationship of viruses and indicator bacteria in water and wastewater of Israel. Water Res. 14(11):1585-1590.
46. Maslow, J. N., T. S. Whittam, C. F. Gilks, R. A. Wilson, M. E. Mulligan, K. S. Adams, and R. D. Arbeit. 1995. Clonal relationships among bloodstream isolates of Escherichia coli. Infect Immun. 63(7):2409-17.
47. Miescier, J. J., and V. J. Cabelli. 1982. Enterocooci and other microbial indicators in municipal wastewater effluents. J Water Pollut Control Fed. 54(12):1599-1606.
48. Milkman, R. 1973. Electrophoretic variation in Escherichia coli from natural sources. Science. 182(116):1024-6.
49. Morrison, D., Woodford, N., Barrett, S.P., Sisson, P., and Cookson, B.D. 1999. DNA banding pattern polymorphism in vancomycin-resistant Enterococcus feacium and criteria for defining strains. J Clin Microbiol. 37(4):1084-1091.
50. Nagy, B., R. A. Wilson, and T. S. Whittam. 1999. Genetic diversity among Escherichia coli isolates carrying f18 genes from pigs with porcine postweaning diarrhea and edema disease. J Clin Microbiol. 37(5):1642-5.
51. National Committee for Clinical Laboratory Standards. 2001. Performance standards for antimicrobial susceptibility testing. National Committee for Clinical Laboratory Standards, Wayne, PA.
52. Ochman, H., T. S. Whittam, D. A. Caugant, and R. K. Selander. 1983. Enzyme polymorphism and genetic population structure in Escherichia coli and Shigella. J Gen Microbiol. 129(Pt 9):2715-26.
53. Orskov, F., I. Orskov, and A. J. Furowicz. 1972. Four new Escherichia coli O antigens, O148, O151, O152, O153, and one new H antigen, H50, found in strains isolated from enteric diseases in man with a discussion on the future numbering of K antigens. Acta Pathol Microbiol Scand [B] Microbiol Immunol. 80(3):435-40.
54. Orskov, I., and F. Orskov. 1976. Five new Escherichia coli K antigens, K95, K96, K97, K98 and K100. Acta Pathol Microbiol Scand [B]. 84B(6):321-5.
55. Orskov, I., and F. Orskov. 1970. The K antigens of Escherichia coli. Re-examination and re-evaluation of the nature of L antigens. Acta Pathol Microbiol Scand [B] Microbiol Immunol. 78(5):593-604.
56. Orskov, I., and F. Orskov. 1977. Special O:K:H serotypes among enterotoxigenic E. coli strains from diarrhea in adults and children. Occurrence of the CF (colonization factor) antigen and of hemagglutinating abilities. Med Microbiol Immunol (Berl). 163(2):99-110.
57. Orskov, I., F. Orskov, A. Birch-Andersen, M. Kanamori, and C. Svanborg-Eden. 1982. O, K, H and fimbrial antigens in Escherichia coli serotypes associated with pyelonephritis and cystitis. Scand J Infect Dis Suppl. 33:18-25.
58. Osawa, S., K. Furuse, and I. Watanabe. 1981. Distribution of ribonucleic acid coliphages in animals. Appl Environ Microbiol. 41(1):164-8.
59. Parveen, S., K. M. Portier, K. Robinson, L. Edmiston, and M. L. Tamplin. 1999. Discriminant analysis of ribotype profiles of Escherichia coli for differentiating human and nonhuman sources of fecal pollution. Appl Environ Microbiol. 65(7):3142-7.
107

60. Pipes, W. O. 1982. Bacterial Indicators of Pollution. CRC Press, Inc, Boca Raton, FL.
61. Pupo, G. M., R. Lan, P. R. Reeves, and P. R. Baverstock. 2000. Population genetics of Escherichia coli in a natural population of native Australian rats. Environ Microbiol. 2(6):594-610.
62. Rodrigues, J., I. C. Scaletsky, L. C. Campos, T. A. Gomes, T. S. Whittam, and L. R. Trabulsi. 1996. Clonal structure and virulence factors in strains of Escherichia coli of the classic serogroup O55. Infect Immun. 64(7):2680-6.
63. Savageau, M. A. 1983. Escherichia coli habitats, cell types, and melecular mechanisms of gene control. Amer. Nat. 122:732-744.
64. Scott, T. M., Parveen, S., Portier, K.M, Rose, J.B, Tamplin, M.L., Farrah, S.R., Koo, A., and Lukasik, J. 2003. Geographical variation in ribotype profiles of Escherichia coli isolates from humans, swine, poultry, beef, and dairy cattle in Florida. Appl Environ Microbiol. 69(2):1089-1092.
65. Selander, R. K., and Levin, B.R. 1980. Genetic structure and variation in natural populations of Escherichia coli, p. 1625-1648. In F. C. Neidhardt (ed.), Escherichia coli and Salmonella typhimurium: Cellular and Molecular Biology. Merican Society for Microbiology, Washington DC.
66. Selander, R. K., D. A. Caugant, H. Ochman, J. M. Musser, M. N. Gilmour, and T. S. Whittam. 1986. Methods of multilocus enzyme electrophoresis for bacterial population genetics and systematics. Appl Environ Microbiol. 51(5):873-84.
67. Selander, R. K., T. K. Korhonen, V. Vaisanen-Rhen, P. H. Williams, P. E. Pattison, and D. A. Caugant. 1986. Genetic relationships and clonal structure of strains of Escherichia coli causing neonatal septicemia and meningitis. Infect Immun. 52(1):213-22.
68. Selander, R. K., and B. R. Levin. 1980. Genetic diversity and structure in E. coli populations. Science. 210:545-547.
69. Selander, R. K., and B. R. Levin. 1980. Genetic diversity and structure in Escherichia coli populations. Science. 210(4469):545-7.
70. Silveira, W. D., M. Lancellotti, A. Ferreira, V. N. Solferini, A. F. P. De Castro, E. G. Sehling, and M. Brocchi. 2003. Determination of the clonal structure of avian Escherichia coli strains by isoenzyme and ribotyping analysis. J. Vet. Med. B. 50:63-69.
71. Simpson, J. M., B. Martineau, W. E. Jones, J. M. Ballam, and R. I. Mackie. 2002. Characterization of fecal bacterial populations in canines: effects of age, breed and dietary fiber. Microb Ecol. 44(2):186-97.
72. Simpson, J. M., J. W. Santo Domingo, and D. J. Reasoner. 2002. Microbial source tracking: state of the science. Environ Sci Technol. 36(24):5279-88.
73. Sinton, L. W., Finlay, R.K., and Hannah, D. J. 1998. Distinguishing human from animal faecal contamination in water: a review. New Zealand journal of marine and freshwater research. 32:323-348.
74. Solo-Gabriele, H. M., M. A. Wolfert, T. R. Desmarais, and C. J. Palmer. 2000. Sources of Escherichia coli in a coastal subtropical environment. Appl Environ Microbiol. 66(1):230-237.
108

75. Soto, S. M., Martinex, N., Guerra, B., Gonzalez-Hevia, M.A., Mendoza, M.C. 2000. Usefulness of genetic typing methods to trace epidemiologically Salmonella serotype Ohio. Epidemiol Infect. 125(3):481-490.
76. Urakawa, H., K. Kita-Tsukamoto, and K. Ohwada. 1999. 16S rDNA restriction fragment length polymorphism analysis of psychrotrophic vibrios from Japanese coastal water. Can J Microbiol. 45:1001-1007.
77. Wagner, E. K., and Martinez, J.H. 2003. Basic Virology, 2nd ed. Blackwell Science, Malden, MA.
78. Wallis, J. L., and Taylor, H.D. 2003. Phenotypic population characteristics of the enterococci in wastwater and animal faeces: implications for the new European directive on the quality of bathing waters. Water Sci Technol. 47(3):27-32.
79. Wheeler, A. L., P. G. Hartel, D. G. Godfrey, J. L. Hill, and W. I. Segars. 2002. Potential of Enterococcus faecalis as a human fecal indicator for microbial source tracking. J Environ Qual. 31(4):1286-93.
80. Whitlock, J. E., D. T. Jones, and V. J. Harwood. 2002. Identification of the sources of fecal coliforms in an urban watershed using antibiotic resistance analysis. Water Res. 36(17):4273-82.
81. Whittam, T. S. 1989. Clonal dynamics of Escherichia coli in its natural habitat. Antonie Van Leeuwenhoek. 55(1):23-32.
82. Whittam, T. S., H. Ochman, and R. K. Selander. 1983. Geographic components of linkage disequilibrium in natural populations of Escherichia coli. Mol Biol Evol. 1(1):67-83.
83. Whittam, T. S., H. Ochman, and R. K. Selander. 1983. Multilocus genetic structure in natural populations of Escherichia coli. Proc Natl Acad Sci U S A. 80(6):1751-5.
84. Wiggins, B. A. 1996. Discriminant analysis of antibiotic resistance patterns in fecal streptococci, a method to differentiate human and animal sources of fecal pollution in natural waters. Appl Environ Microbiol. 62(11):3997-4002.
85. Wiggins, B. A., Cash, P.W., Creamer, W.S., Dart, S.E., Garcia, P.P., Gerecke, T.M., Han, J., Henry, B.L., Hoover, K.B., Johnson, E.L., Jones, K.C., McCarthy, J.G., McDonough, J.A., Mercer, S.A., Noto, M.J., Park, H., Phillips, M.S., Purner, S.M., Smith, B.M, Stevens, E.N. 2003. Use of antibiotic resistance analysis for representativeness testing of multiwatershed libraries. Appl Environ Microbiol. 69(6):3399-3405.
86. Wiggins, B. A., R. W. Andrews, R. A. Conway, C. L. Corr, E. J. Dobratz, D. P. Dougherty, J. R. Eppard, S. R. Knupp, M. C. Limjoco, J. M. Mettenburg, J. M. Rinehardt, J. Sonsino, R. L. Torrijos, and M. E. Zimmerman. 1999. Use of antibiotic resistance analysis to identify nonpoint sources of fecal pollution. Appl Environ Microbiol. 65(8):3483-6.
87. Wyer, M. D., J. M. Fleisher, J. Gough, D. Kay, and H. Merrett. 1995. An investigation into parametric relationships between Enterovirus and faecal indicator organisms in the coastal waters of England and Wales. Water Res. 29(8):1863-1868.
109