frequency distribution of potential temperatures and salinities in the indian ocean
TRANSCRIPT

Frequency distribution of potential temperatures and salinities in the Indian Ocean
M. J. POLLAK
(Received 30 September 1957)
A~traet--A correlation table of potential temperatures and salinities for the entire volume of the Indian Ocean is presented. Frequencies, in terms of 104 km 3, are given for class intervals of 0-5 ° C × 0.1 per mille. Three classes, in the temperature range 0'5 to 2-0 ° C and salinity range 34.7 to 34.8 per mille, include 32 per cent of the total volume. This group represents the core of the deep water of the Indian Ocean. In the central portion of the ocean, and in the Arabian Sea and Bay of Bengal, only very limited station data are available. Consequently, the correlation table represents a substantial amount of subjective interpolation.
INTRODUCTION
THE identification of ocean waters by their temperature-salinity correlation has long been a standard technique in oceanography. Most commonly, in situ tempera- tures, T, have been used for this purpose, rather than the more significant potential temperatures, 8, in which the effect of pressure has been eliminated.
But, to date, very little work has been done to determine the volumes of water represented by the various 8-S types, especially on an ocean-wide basis. A quantita- tive inventory of water characteristics is virtually a prerequisite to the development of a valid theory of oceanic circulation.
The present paper represents such an inventory of the Indian Ocean. Together with parallel studies of the Atlantic and Pacific Oceans by MONTGOMERY and C o e m ~ respectively, it should help to eliminate a substantial gap in descriptive oceanography. The results for the Indian Ocean must be considered preliminary in nature because of the inadequacy of the data ; large areas in the central and northern sectors of this ocean are almost completely devoid of serial observations.
METHODS
The volume of the Indian Ocean, including the Red Sea, Persian Gulf, and Andaman Sea, is 29,195 × l0 g km 3 according to KOSSINNA (1921), with a surface area of about 75 × 106 km 2. In order to obtain results that would be comparable with those for the other two oceans, a sampling network of one station per 106 km 2 of surface area was selected. In the region south of latitude 50°S and along the east coast of Africa, the outstanding series of data obtained by the R.R.S. Discovery in the course of 20 years would have permitted a denser network of stations. On the other hand, in the large unsampled areas already mentioned, even the minimum number of stations was unobtainable.
First, as many stations as possible were selected on the basis of reasonably uniform horizontal spacing and maximum depth of sampling. These are the primary stations shown in Fig. 1. Wherever an otherwise unused deeper station was located in the
128

Frequency distribution of potential temperatures and salinities in the Indian Ocean 129
vicinity of a primary station, provided no shallow ridge intervened, its additional sampling depths were appended to the primary series. These secondary deep stations are also indicated on the chart. This procedure yielded 66½ primary stations, with the half station referring to the one in the Red Sea. Because of the small volume and shallow sill depth of this sea, its station was weighted only one half.
Fig. 1. The Indian Ocean and adjacent seas, showing primary and secondary stations used in this study.
To compensate for the horizontal gaps in the data it was assumed that any missing station could be represented by mean values of the nearest surrounding stations. This averaging was accomplished by giving additional weight to the adjacent data. Even this process was unsatisfactory in some instances, especially in the Bay of Bengal, where one station had to be given a weight of 2½. However, no alternative was possible.
Vertically, each observation was weighted according to the half-distances to the next higher and lower sampling depths. Ten metres was taken as unit weight. With 106 km 2 as the area unit, the volumetric unit thus becomes 104 km 3. When con-

130 M . J . POLLAK
sidered in the light of the total volume of the Indian Ocean and the limited number of observations available, the magnitude of the unit volume does not appear unduly large.
One additional adjustment to the weight of each observation was required. This correction factor was based on the average area enclosed by each depth zone, for instance 1000-2000 m, and on the number of stations providing observations in this zone. In the case of the deepest observation at a station, the depth to the bot tom was also taken into account. The adjustment was made by 10 ° zones of latitude, a convenient form of subdivision used by KOSS1NNA. After this final processing, the sum of all weights equalled the total volume of the Indian Ocean.
For 66½ stations, the average weight per station is 439 units of volume. But, as a result of their irregular geographical distribution and different depths attained, the station weights varied widely. The largest weight was 1213 units, or slightly over 4 per cent of the total, assigned to Discovery Station 2888 near the centre of the Indian Ocean. This station included the individual observation with the greatest weight, 369 units at a depth of 3950 m.
The basic tg-S class covered the ranges 0.5 °C by 0.1 per mille. The weights of all observations in each class were summed, thus giving the frequency of that class in terms of 104 km 3. The distribution of these frequencies is shown in Fig. 2.
POTENTIAL TEMPERATURE IN DEGREES C -2 0 2 4. (, 8 10 132.8 ( ~ ' I ' ! ' I ' I ' I ' I ' I ~ I ' I ' 1 ' I ' I ' I ' I ' I ~ I ' I ' L
: -.. \ \ N 5~5 %
\
2 5~
l lz lo7
9 5o5 z 12.14 - ~q
>- 133"~
9 ~ _~ J71
ZM
50 t~
22 87
, \ \ \ \
T "vnz~v\ \
"~ \ \ % • i . i . i . i . , . i . ) , t , i , I , i i I *
TEMPERATURE TOTALS IN IO 4 kn'#
(V,a Ir
,c ~5.0 It ~" -- ~"
9 "# 5L0
Fig. 2. Frequency distribution, in terms of 10¢ km3, of Indian Ocean potential temporatures and salinities by classes ofO'5 ° C xO.l per mille. Heavy class boundariea include 50 per cent mad light class boundaries 75 per cent of the total volume. High te~npcraturc classes, compr~.xl in the
marginal band, comprise 3 per cent of the volume.
In order to retain practical limits to this correlation table, the observations at potential temperatures above 16°C, comprising only 3 per cent of the total volume, have been summarized in the margin.
Frequency distribution of potential temperatures and salinities in the Indian Ocean 131
The 50 per cent and 75 per cent boundaries were established by the cumulative addition of frequencies in descending order of magnitude. The discontinuity of the 75 per cent boundary, as well as the discontinuity of the data in general (as exemplified by scattered classes with no observations), may be attributed to the crude sampling method employed. The question whether these discontinuities are real or fictitious will be resolved only after the establishment of a far more comprehensive network of serial observations than is now extant.
DISCUSSION
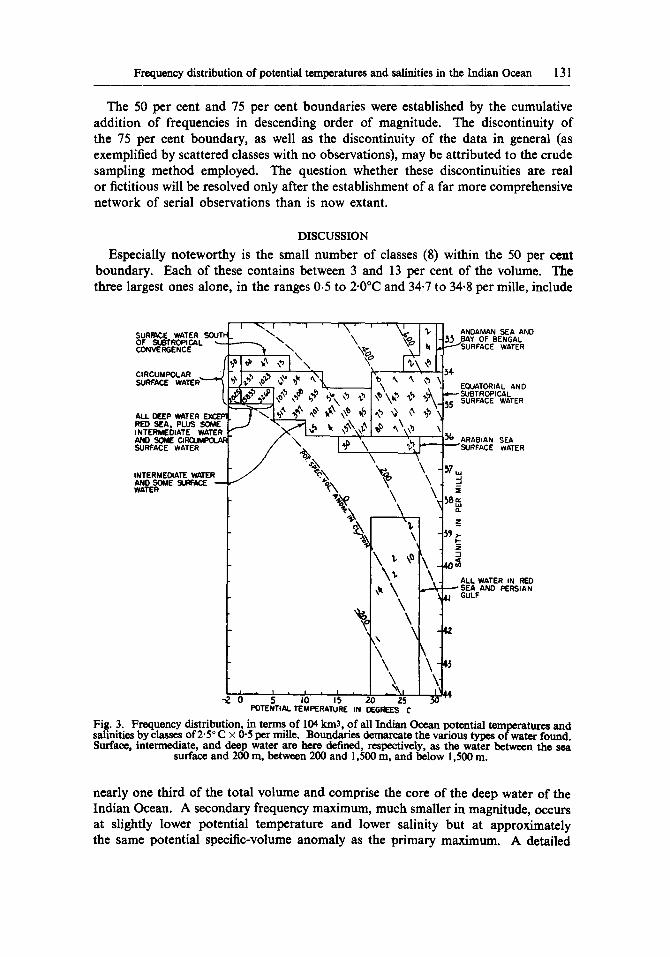
Especially noteworthy is the small number of classes (8) within the 50 per c ~ t boundary. Each of these contains between 3 and 13 per cent of the volume. The three largest ones alone, in the ranges 0.5 to 2.0°C and 34.7 to 34.8 per mille, include
' ~ ' - ,~ ' ' \ ' ' ' ~ - t ~ , 1 / ANOA~,SEAANO SuRRa, CE wATER SOUTH. ~ \ \~:~ I I - I ~ BAY OF BENGAL OF SUBTROPICAL ".-.--.-------..-~ ~ \]p~ "~" I k ~-.--"JSURFACE WATER v ENCE , ' ,"
C,RCU.POLAR " '1.~ .e" " k",l I'~ ", ", '~', ',l s* SURFACE WATER ~ ' ' ' ~ ~ ~ ' ~ . i~ J \ _ L I EQUATORIAL AND
~'~ ~ ~"> ~ ~ % ~b .~ % SUBTROPICAL ~ , ~ ,~ ~ ~\~ ~ I~ \~ • ~ , ,_I~, ~OR~ACE WATER
Re) S~A. PLUS soME ~ ~ . ~ ~, ~ . \ . INTERMEDIATE WATER
~ ' \ ' I ~ ~ . i \ ~ 1 I ~ ARABIAN SEA
\
WATER "V~o'~_ \ ~ ~)80:
~"~,, I \ . Z
~1 , \ ALL WATER IN RED ~, \ .~ ~ S E , ANO ~ S , A N 44 GULF
\ \ \ \ .
0 5 IO J5 20 Z5 POTENTIAL TEMPERA'I~JRE IN DEGREES C
Fig. 3. Frequency distribution, in terms of 104 km3, of all Indian Ocean potential temperatures and salinities by classes of 2.5 ° C × 0"5 per mille. Boundaries demarcate the various types of water found. Surfac¢, intermediate, and deep water arc here defined, respectively, as the water between the sea
surface and 200 m, between 200 and 1,500 m, and below 1,500 m.
nearly one third of the total volume and comprise the core of the deep water of the Indian Ocean. A secondary frequency maximum, much smaller in magnitude, occurs at slightly lower potential temperature and lower salinity but at approximately the same potential specific-volume anomaly as the primary maximum. A detailed

132 M.J. POLLAK
station-by-station analysis of the deep water, to determine if it is all of the same origin, is beyond the scope of the present study. However, a cursory inspection of the data suggests that the deep water originates in the circumpolar regions, though not necessarily formed in the Indian Ocean sector of the Antarctic waters. In this regard it should be remembered that the data used were obtained over a period of many years and that there is no reason to expect bottom water of identical charac- teristics to be formed year after year. Also worthy of mention is the finding, in the single 0-S class of maximum frequency, of observations separated by as much as 66 ° of latitude (e.g. Albatross Station 240 and Discovery Station 884).
In Fig. 3 the entire potential temperature and salinity range of the Indian Ocean is covered in classes of 2.5°C by 0.5 per mille. The Table brings out clearly the relative isolation of the highly saline waters of the Red Sea and the Persian Gulf. Also to be noted are the wide temperature and salinity ranges of the 200 m surface layer in the equatorial and subtropical expanses of the ocean. This feature brings up an additional weakness in the data. The relationship of the surface layer to the subsurface waters cannot be fully established without a reasonably complete observational coverage of the ocean both in winter and summer. Because of the paucity of stations, the present study included data from all seasons indiscriminately. Since the upper 200 m contain only 5 per cent of the total volume, this merging of all seasons does not do undue violence to the statistical results in their present preliminary form.
As has already been suggested, the frequency distribution of potential temperatures and salinities in the Indian Ocean can be made more detailed and reliable only after a major increase in observational data has been accomplished.
An interesting by-product of this study is the determination of average values of potential temperature and salinity for the entire Indian Ocean. These means, derived from the original tabulation of the data by intervals of 0-5°C and 0.1 per mille, are 3-72°C and 34.76 per mille. Their probable errors are not evaluated.
Chesapeake Bay Institute, The Johns Hopkins University, Baltimore 18, Maryland
Contribution No. 34from the Chesapeake Bay Institute. This investigation was supported in part by the Geophysics Branch of the Office of Naval Research.
REFERENCES KOSSINNA, ERW1N (1921) Die Tiefen des Weltmeeres. Berlin Univ., Inst. f. Meereskunde,
VerOff., N.F., A. Geogr . - naturwiss. Reihe, Heft 9, 70 pp.
STATION DATA Albatross ." Reports of the Swedish Deep-Sea Expedition 1947-1948. Vol. III Physics
and Chemistry No. 4. L. BRUNEAU, N. J. JERLOV and F. F. KoEzY. Physical and Chemical Methods. 1953. Goteborg.
Charcot : Bulletin d'Information du C.O.E.C. III e An., No. 10, Dec. 1951, Service Central Hydrographique, Paris.
Dana : Hydrographical observations made during the " D a n a " Expedition 1928-30. Dana-Rep. No. 12. 1937. Copenhagen.
Discovery : Discovery Reports, Vols. IV (1932), XXI (1941), XXII (1943), XXIV (1944), XVIII (1957). Cambridge Univ. Press.
Investigator : Mem. Asiat. Soc. Bengal, Vol. IX, No. 6. R.B.S. Sewell, Geographic and Oceanographic Research in Indian Waters. VI The Temperature and Salinity of the Deeper Waters of the Bay of Bengal and Andaman Sea. 1938. Calcutta.

Frequency distribution of potential temperatures and salinities in the Indian Ocean 133
Mabahiss : JOHN MURRAY Expedition Scientific Reports. Vol. I Introduction and Topo- graphy. No. 1. R. B. S. SEWELL. Introduction and List of Stations. 1935. British Mus. (Nat. Hist.), London.
Scoresby : Discovery Reports, Vol. XXVI. 1953. Cambridge Univ., Press. Snellius : Ann. der. Hydrogr. u. Mar. Met. LX Jahrg. (1932), Heft X. p. 401. P. M. VAN
RIEL. Einige ozeaographische Bcobachtungen im Roten Meer, Golf von Aden und Indischer Ozean.