french youth unemployment: an overvie · employment and training papers 23 french youth...
TRANSCRIPT

EMPLOYMENT AND TRAININGPAPERS
23French youth unemployment:
An overview
Catherine BrunoOFCE Paris
Sandrine CazesEmployment and Labour Market Policies Branch
Action Programme on Youth Unemployment
Employment and Training DepartmentInternational Labour Office Geneva
ISBN 92-2-111142-3ISSN 1020-5322First Published 1998

Copyright © International Labour Organization 1998
Publications of the International Labour Office enjoy copyright under Protocol 2 of the Universal CopyrightConvention. Nevertheless, short excerpts from them may be reproduced without authorization, on conditionthat the source is indicated. For rights or reproduction, or translation, application should be made to the ILOPublications Bureau (Rights and Permissions), International Labour Office, CH-1211 Geneva 22,Switzerland. The International Labour Office welcomes such applications.
Libraries, institutions and other users registered in the United Kingdom with the Copyright LicensingAgency, 90 Tottenham Court road, London W1P 9HE (Fax:+44 171 436 3986), in the United States withthe Copyright Clearance Center, 222 Rosewood Drive, Danvers, MA 01923 (Fax:+ 1 508 750 4470), or inother countries with associated Reproduction Rights Organizations, may make photocopies in accordancewith the licences issued to them for this purpose.
The designations employed in ILO publications, which are in conformity with United Nations practice, andthe presentation of material therein do not imply the expression of any opinion whatsoever on the part of theInternational Labour Office concerning the legal status of any country, area or territory or of its authorities,or concerning the delimitation of its frontiers.The responsibility for opinions expressed in signed articles, studies and other contributions rests solely withtheir authors, and publication does not constitute an endorsement by the International Labour Office of theopinions expressed in them. Reference to names of firms and commercial products and processes does not imply their endorsement bythe International Labour Office, and any failure to mention a particular firm, commercial product or processis not a sign of disapproval.
ILO publications can be obtained through major booksellers or ILO local offices in many countries, or directfrom ILO Publications, International Labour Office, CH-1211 Geneva 22, Switzerland. Catalogues or listsof new publications are available free of charge from the above address.
Contents
1. Introduction . . . . . . . . . . . . . . . . . . . . . . . . . . . . . . . . . . . . . . . . . . . . . . . . . . . . . . . . . . . 1
2. The specificity of youth unemployment: A dynamic approach . . . . . . . . . . . . . . . . . . . . . . . . . . 22.1. Variations in youth unemployment and in adult unemployment: Common or
idiosyncratic shocks? . . . . . . . . . . . . . . . . . . . . . . . . . . . . . . . . . . . . . . . . . . . . . . . 22.2. Causality between youth unemployment and adult unemployment . . . . . . . . . . . . . . . . . . 32.3 Young people are most vulnerable than adults to unemployment . . . . . . . . . . . . . . . . . . . 5
3. The determinants of youth labour market situation . . . . . . . . . . . . . . . . . . . . . . . . . . . . . . . . . 73.1. Labour costs . . . . . . . . . . . . . . . . . . . . . . . . . . . . . . . . . . . . . . . . . . . . . . . . . . . . . 73.2 Educational and training qualifications . . . . . . . . . . . . . . . . . . . . . . . . . . . . . . . . . . . 93.3 Active employment policy measures . . . . . . . . . . . . . . . . . . . . . . . . . . . . . . . . . . . . . 133.4 Shortage of jobs . . . . . . . . . . . . . . . . . . . . . . . . . . . . . . . . . . . . . . . . . . . . . . . . . . 14
4. Some econometric elements: The estimation of the rate of youth unemployment . . . . . . . . . . . . . 164.1 The specification of the equation . . . . . . . . . . . . . . . . . . . . . . . . . . . . . . . . . . . . . . . 164.2 Results of the estimation . . . . . . . . . . . . . . . . . . . . . . . . . . . . . . . . . . . . . . . . . . . . . 19
5. Conclusion . . . . . . . . . . . . . . . . . . . . . . . . . . . . . . . . . . . . . . . . . . . . . . . . . . . . . . . . . . . . . 22
Bibliography . . . . . . . . . . . . . . . . . . . . . . . . . . . . . . . . . . . . . . . . . . . . . . . . . . . . . . . . . . . . . 23
TablesTable 1. Cyclicality of youth and adult unemployment flows . . . . . . . . . . . . . . . . . . . . . . . . . . . 3Table 2. Common and idiosyncratic shocks for youth and adult unemployment . . . . . . . . . . . . . . . 3Table 3. Causality between youth and adult unemployment (per cent) . . . . . . . . . . . . . . . . . . . . . 4Table 4. Causality between unemployment and minimum wage (per cent) . . . . . . . . . . . . . . . . . . 5Table 5. Comparison of youth and adult unemployment stocks and flows . . . . . . . . . . . . . . . . . . . 5Table 6. Annual inflows to unemployment (per cent) . . . . . . . . . . . . . . . . . . . . . . . . . . . . . . . . 6Table 7. Annual flows into and out of employment (per cent) . . . . . . . . . . . . . . . . . . . . . . . . . . . 6Table 8. Structure of the labour force by educational qualification, 1962-1990 (per cent) . . . . . . . . . 10Table 9. School leavers, including apprenticeship, by educational qualification (1975-1993) . . . . . . 10Table 10. Youth unemployment by educational qualification . . . . . . . . . . . . . . . . . . . . . . . . . . . . 10Table 11. Cyclicality and persistence of youth unemployment rates, by qualification, 1970-1995 . . . . 13Table 12. Estimation of the youth unemployment rate (1974-1994) . . . . . . . . . . . . . . . . . . . . . . . . 20Table 13. Estimation of youth unemployment rates by qualification (1974-1994) . . . . . . . . . . . . . . . 21
FiguresFigure 1. Youth and adult unemployment . . . . . . . . . . . . . . . . . . . . . . . . . . . . . . . . . . . . . . . . 11Figure 2. ALM Programmes . . . . . . . . . . . . . . . . . . . . . . . . . . . . . . . . . . . . . . . . . . . . . . . . . 15Figure 3a. Youth employment . . . . . . . . . . . . . . . . . . . . . . . . . . . . . . . . . . . . . . . . . . . . . . . . 17Figure 3b. Total employment . . . . . . . . . . . . . . . . . . . . . . . . . . . . . . . . . . . . . . . . . . . . . . . . . 18

Acknowledgements
We wish to thank G. Cornilleau, G. Forgeot, J. Gautié, F. Portier and S. Scarpetta forproviding detailed comments on a previous draft. However, any errors of facts or judgmentmust be laid most firmly at the authors’ door.

Foreword
This paper represents a contribution to the ILO’s Action Programme on YouthUnemployment being undertaken in the 1996-97 biennium. The Action Programme is intendedto: (i) raise awareness amongst constituents concerning the problems associated with the labourmarket entry of young people; (ii) to improve their understanding of the advantages anddisadvantages of the principal policy and programme options for tackling the problem of youthunemployment; and thus, (iii) enhance the capacity of member States to design and implementpolicies and programmes for promoting youth employment. The Action Programme includescountry case studies from all over the world as well as policy reviews concentrating on specifictopics within the ambit of the youth unemployment “problem”. The country case studies willbe used as the basis for the first major output of the Programme, a comparative report on youthunemployment and youth employment policy.
Over the last twenty years, youth unemployment has become a major issue of the Frenchlabour market situation. This explains the increasing public intervention in the labour markettargeted to young people. This paper tries to shed some light on two main aspects of the youthlabour market situation : the impact of the minimum wage on the youth unemployment and theadequacy of qualifications acquired at school to the needs of firms. It compares also theunemployment situation among young people and adults, so as to identify the specific featuresof the former. An econometric analysis is conducted using annual stock and flows data fromthe Employment Survey on youth unemployment by sex and educational qualification.
Overall, it emerges that a single dynamic process underlies fluctuations in youth and adultunemployment, showing that labour market conditions, themselves linked to the level ofeconomic activity, are determinant in explaining the level of unemployment. Furthermore, ourresults suggest no evidence of an effect of the minimum wage on youth unemployment as awhole over the past 25 years. However, distinguishing between levels of qualifications ofyoung people reveals substantial heterogeneity in their situations on the labour market: inparticular, because of the shortage of jobs, the less qualified find themselves forced to the backof the ‘queue for jobs’ and may therefore seem “too expensive” compared to other categoriesof workers. But to state that it is the rigidity of the wage system which is responsible forunqualified youth unemployment or that it is the unsuitability of training for works offered byfirms, are simply two sides of the same coin. In the face of the inequality in unemploymentsituations and of the shift in the pattern of demand for unskilled labour, access to qualificationsas well as a better matching between these qualifications and the needs of firms should beemphasised as priorities.
Gek-Boo Ng,Chief,
Employment and Labour Market Policies Branch,Employment and Training Department.

1
1 In 1996 the labour force participation rate of youth aged 15-19 was the lowest of all western countries. 2 8 months for young people and 16 months for adults in 1995.
1. Introduction
Over the last twenty years, youth unemployment -e.g. of unemployment among the under25’s - has become a major issue of the French labour market situation, and therefore a keychallenge for all successive governments. Indeed, since 1983, the rate of unemployment(according to the ILO definition) among young people has rarely fallen below the 20 per centmark - twice the average for the labour force as a whole - even if there has been a slightdecrease in 1986; at the end of 1996, the rate was 26 per cent.This French experience,however, is by no means unique in Europe: in Italy in 1996 one young person out of three wasunemployed, and in Spain two out of five, although in Germany the corresponding figure wasonly 1 in 10 (Eurostat, 1996). By contrast, in Germany, only out of ten was jobless (Eurostat,1996). Germany is often taken as an example, since it is the only western country where theyouth unemployment rate is lower than the overall unemployment rate, over the 1970-1990period (Elbaum, Marchand, 1994).
The persistence, in France, of a high youth unemployment rate is all the more surprisinggiven that during the same period the school enrolment rate has continued to rise, leading toa progressive and significant reduction of their participation in the labour force1. Furthermore,governments have undertaken very large-scale initiatives in support of young people: youthemployment programmes have become ever more diversified and above all ever morenumerous during the same period, while expenditure on active employment programmes hasmultiplied by six in twenty years (Gélot and Osberg, 1995). Demographic factors do notworsen the youth situation on the labour market: total youth population has been decreasingcompared with total population since the beginning of the seventies. Finally, the growingdemand for labour in sectors that employ more than the average of young people (retail trade,catering etc.) during the last twenty years (OECD, 1996), should also have contributed to areduction in French youth unemployment.
Instead, unemployment would appear to have become an obligatory stage for most schoolleavers, for whom direct entry into a job has increasingly become the exception (Meron andMinni, 1995). Furthermore, young people frequently are employed on a series of fixed-termcontracts punctuated by periods of unemployment (the ‘carousel’ effect), so that the averagelength of each period of unemployment is shorter for young people than for adults2, eventhough their total time spent out of work is greater. Thus another feature of the position ofyoung people on the labour market is the problems they encounter in finding a stable job.
In the face of these problems the debate on youth unemployment has focused in Franceon two issues : qualifications - it concerns either the shortage of a qualified workforce or theinadequacy of qualifications acquired in school to the needs of firms - and labour costs - youngpeople are not employed because labour costs are too high. For instance some Europeancountries as Belgium or The Netherlands are sometimes taken as examples, since they havechosen to create youth minimum wages in order to reduce youth unemployment. But theseconsiderations may not be sufficient to explain youth unemployment. In France, job shortagefalls disproportionately upon young people. So far, youth unemployment may be understood

2
3 All the analysis refers to annual rates: inflows rate (inflows into unemployment as a percentage of employment)and outflows rate (outflows from unemployment as a percentage of unemployment). 4 Inflows into unemployment (÷ U) are coming from inactivity (I ÷ U) or from employment (E ÷ U);destinations of outflows from unemployment (U ÷) are inactivity (U ÷ I) or employment (U ÷ E). In thefollowing tables, y represents young people, a adults. 5 15-24, 25-49, 50 and over. 6 We have a measure of the business cycle, Y, using a GDP smoothing approach based on the Hodrick-Prescottfilter.
as a « queuing for jobs » problem. One must therefore take this fact into account whendebating about youth labour costs or qualifications.
Before examining these different aspects of the problem, we first compare theunemployment situation among young people and adults, so as to identify the specific featuresof the former. We then review the determinants of youth labour market situation, byproceeding to an analysis of wage costs, the educational qualifications system and employmentpolicy. Finally, we conduct an econometric analysis since we have data on youthunemployment by sex and educational qualifications, to find out whether the training offeredin the educational system offers effective insurance against unemployment: were this to be thecase, young people would have an incentive to pursue their studies for as long as possible,other things being equal. We also evaluate the ‘queuing for jobs’ effect in the job market intowhich young people are channelled.
2. The specificity of youth unemployment: A dynamic approach
We use stock and flow data in order to analyse youth unemployment in France since1970. These data come from the Employment Survey that is carried out in March by theNational Institute of Statistics (INSEE)3. Inflows into unemployment and outflows fromunemployment4 are available by age5.
2.1. Variations in youth unemployment and in adult unemployment: Common oridiosyncratic shocks?
The correlation coefficients between youth/adult unemployment and the business cycle6
are respectively 0.35 and 0.48. This means that both unemployment rates varycountercyclically: in case of recovery, the unemployment rates decrease. We find the samerelationships for the inflows into unemployment, which decrease with an economic expansion(table 1). We would expect however that outflows from unemployment increase in case ofeconomic recovery. Our results show the opposite: outflows are also countercyclical. Theseresults are confirmed by others studies (see for example, Burda and Wyplosz, 1994). Theycould be explained by the existence of a strong correlation between the flows (whatever theirorigin or their destination). Another explanation could be that, in case of recession, moreinstable jobs are created compared to regular ones. Outflows from unemployment (and inparticular to employment) increase because the unemployed constitute the bulk of those hiredin these newly created unstable jobs.

3
Table 1. Cyclicality of youth and adult unemployment flowsFlows Uy ÷ Ey Ua÷ Ea Uy ÷ Iy Ua ÷ Ia Ey÷ Uy Ea ÷ Ua Iy ÷ Uy Ia ÷ Ua
C( ,Y) -0.61 -0.50 -0.38 -0.44 -0.46 -0.39 -0.29 -0.31
Source : Enquête Emploi, INSEE.
Our portrait of the dynamics of the youth labour market situation needs to besupplemented by Aoki factorisation, which decomposes each unemployment rate into acommon component and an idiosyncratic one. The common component is defined as follows:
3 = (ua + uy) / 2
the idiosyncratic one, as follows:
) = (ua - uy ) / 2
where ua represents the adult unemployment rate and uy, the youth unemployment rate. We canalso write:
ua = 3 + )
uy = 3 - )
These components can be interpreted as follows: if variations in unemployment rates aredue only to common shocks, the variance of delta will be equal to zero; in the opposite, ifvariations are due only to idiosyncratic shocks, the variance of sigma will be equal to zero.
Table 2. Common and idiosyncratic shocks for youth and adult unemploymentYouth Adult V()) V(')
uy ua 14.97 86.20U ÷ E U ÷ E 0.12 0.76
U ÷ I U ÷ I 0.11 0.96
E ÷ U E ÷ U 0.05 1.77
I ÷ U I ÷ U 0.01 1.00
Source: Enquête Emploi, INSEE.Note: V(AA) = variance
Table 2 shows that common shocks are clearly responsible for variations in youth andadult unemployment, in terms of stocks as well as flows. This result confirms the idea thatboth unemployment rates follow a similar pattern.
2.2. Causality between youth unemployment and adult unemployment
In defining the nature of the relationship between youth and adult unemployment we useGranger’s sense of causality. Granger’s definition of causality (1969) states that variations inx are caused by variations in y if, to predict x, the history of y provides additional informationwhich applies exclusively to the history of x. The causal relationship between the two variablescan thus be decomposed as follows: a causal direction going from x to y (Cxy), a causal

4
7 The statistical tests required to estimate the causality are applied to variables in a stationary process: Dickey’sand Fuller’s tests show that stock and flow variables exhibit stationary differences as pointed out by Hénin andJobert (1993). Prior to carrying out causality tests it is necessary to determine the number of lags required toeliminate residuals. 8 We have used four minimum wage indicators: the gross minimum wage as a proportion of the average wage;the gross minimum wage cost as a proportion of the average gross wage cost; the real gross minimum wage; andthe real gross minimum wage cost. The results do not change with a change in the indicator used. Beforecalculating the measures of causality we calculate the correlation between youth (and adult) unemployment onthe one hand, and the wage indicator (w) on the other. This latter correlation is positive for both stocks and flowsof youth as well as adult unemployment.
direction going from y to x (Cyx) and an instantaneous causal relationship (Gourrieroux,Monfort, and Renault, 1987).7 Table 3 shows a measure of dependence for each pair ofvariables decomposed into one-directional and instantaneous causalities estimated in percentagesof the total dependency.
The youth and adult unemployment rates, and the flows of both youth and adult intounemployment from employment and into employment from unemployment, all constitutevariables which depend upon one another in the Granger sense, this dependence beingexplained by instantaneous causality. In contrast, there is no similar mutual causal relationshipbetween the flow of young people into unemployment (whether from a job or from having beenoutside the labour force altogether) and the flows of adults out of unemployment into a job.This result constitutes a real contribution to the debate on youth unemployment in France, sinceit shows that adults who do find work do not do so at the expense either of young people losinga job or of young people out of the labour force becoming unemployed.
Table 3. Causality between youth and adult unemployment (per cent)Youth (y) Adult (a) Dependence(1) Cy,a Ca,y Ci
uy ua 1.28* 8 2 90÷ Uy ÷ Ua 1.21* 0 0 100Uy ÷ Ua ÷ 0.61* 17 16 67Ey ÷ Uy Ea ÷ Ua 0.99* 0 2 98Uy ÷ Ey Ua ÷ Ea 0.71* 10 14 76Ey ÷ Uy Ua ÷ Ea 0.24 87.5 12.5 0Iy ÷ Uy Ua ÷ Ea 0.16 94 6 0
Source: Enquête Emploi, INSEE.Note: (*) significant at 5 per cent level.
We calculate the mutual dependance for each pair of variables, which can be decomposed as follows: for example, acausal direction going from uy to ua (Cy,a), a causal direction going from ua to uy (Ca,y) and an instantaneous causalrelationship Ci. The percentages can be interpreted as follows: the mutual dependance of uy and ua is due for 8 per centto a causal direction from uy to ua, 2 per cent to a causal direction from ua to uy and to 90 per cent to instantaneouscausality.
We have also examined, in Table 4, the causal relationship - in Granger’s sense -between youth unemployment, the flows of young people into unemployment as a result oflosing their jobs, and a minimum wage indicator8. Table 4 shows that as this indicator increasesthe number of young people losing their jobs and becoming unemployed also increases. Thisresult would seem to show that wage cost variable would play a determining role in themovement of young people out of work and into unemployment. In contrast, the level of wageis not the principal concern of young people who find work: there is no Granger-type causal

5
link between the minimum wage indicator and the inflows into employment.
Table 4. Causality between unemployment and minimum wage (per cent)
Variable 1 Variable 2: min.wage
Dependence C1,w Cw,1 Ci
uy w 0.28* 29 57 14ua w 0.38* 66 18 16Ey ÷ Uy w 0.47* 25 75 0Ea ÷ Ua w 0.30* 66 34 0Uy ÷ Ey w 0.21 9 91 0Ua ÷ Ea w 0.46* 17 33 50
Source : Enquête Emploi, INSEE.
Note: (*) significant at 5 per cent level.
For adults the situation is completely different: it is the adult unemployment rate whichcauses - in the Granger sense - the variations of the minimum wage indicator, and the samegoes for the flow of adults from jobs into unemployment. These results point towards asegmentation of the labour market whereby adults in employment possess superior bargainingpower, and wage claims are highly sensitive to the level of unemployment. Conversely,unemployed adults who do find a job make concessions on the wage front: thus we observe aninstantaneous causal relationship between wage levels and the flow of adults out ofunemployment and into jobs.
2.3 Young people are most vulnerable than adults to unemployment
A stock and flow approach enables us to show that although youth unemployment hasbeen high for twenty years, that does not imply that the youth labour market is stagnant. Infact, in a typical year three times as many young people as adults will become unemployed,while the rate of moving from unemployment into jobs is the same for both groups (Table 5).Stated more precisely, the number of unemployed young people finding a job is comparableto the number of unemployed adults: since 1990 the relationship between the two has remainedconstant. On the other hand, young people were two to three times more likely to lose theirjobs in any given year during the 1970-1994 period. Thus, the flow of young people intounemployment emerges as an adjustment mechanism in the French labour market: when thereis a downturn in economic activity businesses will first cut back on jobs held by young peoplewhile protecting those held by adults.
Table 5. Comparison of youth and adult unemployment stocks and flowsYouth/Adults 1970 1975 1980 1985 1990 1994
uy / ua 3.26 3.13 3.60 3.01 2.11 2.15Uy÷ Ey / Ua÷ Ea 0.89 1.13 0.91 1.25 1.20 1.20Ey÷ Uy / Ea÷ Ua 2.19 2.52 3.28 3.42 3.66 2.92
Source: Enquête Emploi, INSEE.

6
Table 6 confirms that young people in employment are more vulnerable than adults tounemployment: in 1970 1.2 per cent of them became unemployed as compared to 15.6 per centin 1994, while the corresponding rates for adults were 0.5 per cent and 5.3 per cent. However,the ratio between the vulnerability of the two groups has not changed over the period,throughout which three times as many young people as adults became unemployed in any givenyear.
Table 6. Annual inflows to unemployment (per cent)
Youth Adult
1970 1.2 0.51975 3.0 1.11980 5.8 1.71985 10.1 2.91990 11.4 3.11994 15.6 5.3
Source : Enquête Emploi, INSEE.
To round off the analysis of youth labour mobility, it is interesting to observe the annualflows of labour in and out of employment (Table 7): throughout the 1970-1994 period themovement of young people into employment either from unemployment or from outside thelabour force, is higher than that of adults, and the same goes for movement from employmentout of the labour force or into unemployment.
Table 7. Annual flows into and out of employment (per cent)
Flows 1970 1975 1980 1985 1990 1994
÷ Ey 9.8 11.3 14.2 15.1 13.8 17.9÷ Ea 5.7 5.3 5.7 3.9 4.8 5.4Ey ÷ 10.1 12.2 14.6 17.9 20.0 24.9Ea ÷ 3.4 3.0 3.7 4.4 4.4 6.7
Source : Enquête Emploi, INSEE.
In conclusion, this first section seems to show that although for the most part youth andadult unemployment have common causes, the position of young people on the labour marketdoes have some idiosyncratic features. In particular the causal relationship in the Grangersense shows that the positive link between the minimum wage indicator and unemploymentgoes from wage to unemployment for young people, but in the reverse direction for adults.However, if youth employment policies are taken into account this link between the level ofthe wage and youth unemployment ceases to be significant, as will be shown below.Furthermore movements of young labour force (towards inactivity and unemployment)completely cannot be explained by those of adults (notably by the return of unemployed adultsinto jobs).

7
9 For an example of recent press discussion, see the article by A. Fourçans in Libération 6 February 1997. 10 The SMIC, which was established in January 1970, is a gross hourly wage indexed to the consumer priceindex; in July of each year it is adjusted by at least half the increase in the average hourly wage, in constantFrancs, and its level may also benefit from occasional upward ‘nudges’.
3. The determinants of youth labour market situation
3.1. Labour costs
The scale of unemployment among certain sections of the labour force in France(especially the young and the unskilled) has fed the debate about the need for structuraladjustments in the labour market. Economic studies often state that the high rate of youthunemployment is a result of the high relative level of the wages paid to them (Moghadam,1993)9. Proposals are regularly advanced for the establishment of a “youth minimum wage”,like in Belgium and the Netherlands.
However, France does have in practice a variety of mechanisms that bring youth wagesbelow the level of the SMIC (the minimum wage).10 Thus it is possible to fix the wages of 16-18-year-olds on the basis of a floor equal to 80 per cent of the SMIC, and some 600,000 youngpeople (i.e. 20 per cent of those under 26 years in the labour force) were employed under‘insertion’ contracts which enable businesses to reduce their labour costs (Cette et al., 1996).Besides, opponents to the “youth minimum wage” highlight that the main features of youthunemployment are those of ‘labour market access unemployment’: a high incidence of entryinto unemployment combined with a high probability of exiting the pool of unemployment.Several studies have shown how difficult it is for young people, whatever their educationalqualifications, to achieve a rapid and direct entry onto the labour market (CSEC, 1996). Theoverall shortage of jobs in France would tend to penalise the most recent market entrants andto place them at the back of the queue (Gautié, 1994). In that context the labour cost argumentseems to be a second choice argument in the debate about youth unemployment.
However, the debate is not so simple: on the one hand young people, who constitute onequarter of those earning less than 1.33 times the SMIC, are over-represented among the lowpaid, the level of youth employment is likely to be particularly sensitive to the SMIC, and onthe other because of the substantial proportion with no qualifications among the youngunemployed. Indeed, those without any qualification accounted for practically half theunemployed under the age of 26 in 1996. Certain European countries have decided to sever theconnection between youth and adult wages. In this context Germany - the only majorindustrialised country in which the unemployment rate for young people and adults ispractically the same - constitutes a special case, since here the delinking of youth and adultwages occurs in the framework of a system in which professional training is guaranteed, andthe lower level of youth wages is justified in terms of the cost of the system to the employer -though of course the training is undertaken as part of an investment in human capital. Anotherinteresting case is Holland where youth unemployment declined from 25 per cent in 1983 to10 per cent in 1996 in the wake of the vigorous application of a policy to reduce the costs ofemploying young people: the legal minimum wage was cut in 1984, the increase in the

8
11 Passed in early 1974, the youth minimum wage is based on a percentage of the minimum wage itself andincreases with age: thus between the ages of 15 and 22 it rises gradually from 30 per cent of the minimum to 85per cent - percentages which themselves were revised upwards in 1981 and 1983. 12 So long as the minimum wage is below the equilibrium level of wages, the level of employment is determinedby the supply of labour which will rise together with the wage level. The monopsony model therefore produces arising correlation between the level of the minimum wage and employment at low levels of the former, and adeclining correlation at high levels (for a more detailed account of the model see for example Machin, 1994;Manning, 1994; Cahuc and Zylberberg, 1996). 13 These studies generally try either to establish a correlation between the variations of employment and thoseof the level of the minimum wage, or to use experimental data with a control group (one receiving a wage differingfrom the minimum and the other not) - a method widely applied in the United States, as in the work of Card andKrueger (1994); or, in a further variant, to study the direct effect of the minimum wage on the cross-sectiondistribution of wages (Meyer and Wise, 1993). 14 This study compared the results of various studies using both time series and cross-section data: the formerprovide a view of the change over time in the level of the minimum wage in relation to wages as a whole, whilethe cross-section data compare the effects of the minimum wage, at a given point in time, but under differentconditions - such as differences in legislation, in the number receiving the minimum wage etc.
difference between the ‘young people’s minimum wage’ and the minimum wage itself11, andthen the freezing of the level of both until 1990 all contributed to a substantial reduction ofthe ‘youth minimum wage’ in both real and relative terms. It should be recalled that this cost-reduction policy was undertaken together with a substantial increase in the flexible workinghours (including a growth in part-time work and the frequent use of temporary workers duringthe period) leading to an overall reduction of unemployment (OECD, 1996). Finally let usrecall that in the first part of this paper we drew attention to the link between youthunemployment and the minimum wage indicator, in which Granger-type causality went fromthe minimum wage level to the unemployment rate. This labour cost approach to youthemployment continues to be relevant in France, and more generally it leads to a considerationof the effects of the minimum wage on young people’s position in the labour market.
A review of recent literature shows that at the theoretical level there are as manyarguments for as against the minimum wage (Dolado et al., 1996). One approach finds aninverse relation between employment and the level of the minimum wage (Cahuc andZylberberg, 1996). According to this argument, in an economy with a variety of types oflabour the minimum wage has several effects - influencing both the structure of demand forlabour and the distribution of wages, and thus employment as a whole. Furthermore, the‘downwards stickiness’ of labour costs which a minimum wage brings about imposesparticularly painful costs on unskilled workers (i.e. the young) as the cost of employing thembecomes more expensive to that of other types of worker. However, it is also possible to arguefor a positive relationship between the minimum wage and employment, especially wherebusinesses have a monopsony power in the labour market enabling them to determine wagelevels unilaterally (Stigler, 1946).12
Empirical studies are no less in disagreement among themselves. There are numerousstudies seeking to estimate the effects of the level of the minimum wage on employment andunemployment.13 At the beginning of the 1980s, one review of the literature on data andmethods used, concluded that, other things being equal, a rise of 10 per cent in the minimumwage would reduce youth employment by between 1 per cent and 3 per cent in the UnitedStates (Brown, Gilroy and Cohen, 1982)14, However, in bringing their study up to date in1983, the authors found a lower employment elasticity (-0.1) and no effect at all on youthunemployment.
Several studies were subsequently undertaken in the US, especially to assess whether rises
9
15 In the US the federal government fixes a floor, but thereafter each state is free to fix a higher level of minimumwage. 16 The elasticities produced were at a very low level of significance. 17 That is, the ratio of the number of hirings in the active population of young people.
in the minimum wage which had occurred in certain states had had an effect on employment.15
For example, in their study of the effect of increases in the minimum wage in different statesCard and Krueger (1995) found a positive correlation between the minimum wage andemployment in the New Jersey fast-food industry after the level had been raised in that state,but they did not find a significant correlation in other states.
Likewise, the results of studies undertaken in France are not very conclusive. Theeconometric tests carried out by Bazen and Martin (1991) on the relationship between theminimum wage and youth employment produce negative elasticities between -0.1 and -0.3, buteven then the authors express some doubts concerning their results: ‘We have not, from theeconometric point of view, been able to establish satisfactorily that the increase in the real costof youth labour has had a negative effect on youth employment - even if we believe this in factto be the case’. And in updating a study originally carried out in 1990, Benhayoun (1994)found that the effect of the minimum wage on youth employment was so weak that it could notjustify the introduction of measures such as the ‘youth minimum wage’ in France.16
A recent macro-economic study concludes that the reduction of the cost of employingyoung people through the creation of a ‘youth minimum wage’ or through a reduction ofemployers’ contributions, would have a small, but significant, effect on employment (Cetteet al., 1996). These prospective gains remain nonetheless small - 100,000 extra jobs to begained from a 20 per cent average reduction in the minimum paid to young people, and eventhen at the cost of significant losses of jobs for adults. On the basis of longitudinal individualdata Abowd et al. (1996) reach stronger conclusions: starting from an analysis of the effect ofchanges in the minimum wage on movements between employment and unemployment amongworkers earning different levels of wages, they conclude that the minimum wage has quitesignificant effects on employment levels, but very important wage effects on workers earningthe minimum itself: ‘ a rise of 1 per cent in the real minimum wage increases by 4.3 per centthe probability that a man employed on the minimum wage will lose his job’. These resultssuggest that the minimum wage does tend to lead to job losses among certain types of worker,such as the unskilled and the young.
3.2 Educational and training qualifications
Direct entry into employment among school-leavers is increasingly unusual becauseexperience is an increasingly widespread factor in hiring decisions, so that for any given levelof qualifications employers will prefer the more experienced of the young candidates. Duringthe 1980s the proportion of young people employed declined in all sectors, even those whichwitnessed a growth in jobs. In general, the rate of entry into employment among youngpeople17 did not rise perceptibly during the 1970-1994 period (Table 5) while the rate of exitfrom employment grew until 1990. This despite the continuous improvement in the educationallevel of the labour force, as measured by the highest level of educational qualifications declaredin successive censuses (Table 8). More precisely, the entry into the labour market of ever bettereducated generations of workers has produced an increasingly well educated workforce. The

10
distribution of qualifications among those leaving the educational system provided by the‘Direction des Etudes Prospectives’ of the Ministry of Education is instructive in this regard(Table 9).
Table 8. Structure of the labour force by educational qualification, 1962-1990 (per cent)
Year Noqualification
CEP BEPC CAP or BEP BAC > BAC
1962 49.8 28.7 4.0 9.0 5.8 2.7 1968 37.7 30.2 5 15.4 7.9 3.8 1975 30.7 25.8 6.5 19.4 9.3 8.3 1982 29.7 19.1 7 22.2 11.1 10.9 1990 21 14.5 8.1 28.1 13.1 15.2Source: Enquête Emploi, INSEE.
Notes: CEP= basic vocational training certificate. BEPC = basic general secondary certificate. CAP or BEP=secondary vocational training certificates. BAC = “baccalauréat”, the school-leavers certificate (before the
university).
Table 9. School leavers, including apprenticeship, by educational qualification(1975-1993)
1975 1980 1985 1990 1994
< CAP (per cent) 22.3 15.8 15.4 11.7 8.3CAP or BEP (%) 41.7 47.5 45.2 34.7 26.1BAC level (%) 10.9 10.4 8.8 8.8 13.4> BAC (%) 25.1 26.3 30.8 44.8 52.2Outflows (thousands) 764 832.2 796.4 770.4 775.2
Source: DEP, Ministère de l’Education nationale.
Despite the uninterrupted growth in education during the past twenty years in France,youth unemployment continues to grow, especially relative to adult unemployment (Chart 1).One explanation is that youth unemployment consists mostly of those without qualifications,who are more vulnerable to unemployment than their more highly educated contemporaries,and who do indeed represent more than half of the young unemployed over the past twentyyears (Table 10).However, it is also the case that as the numbers of young educated people hasincreased, so also both their share of youth unemployment and their rate of unemployment havegrown continuously (Table 10), leading us to conclude that educated young people are alsohaving great difficulties entering the labour market.
Table 10. Youth unemployment by educational qualification
(Per cent) 1983 1986 1992 1996
Unemployment rate among the unqualified (<CAP) 25 31 28 36Part of unqualified in youth unemployment rate 54 53 52 47Unemployment rate among the young educated (>BAC) 10.3 14.8 12.2 18.8Part of young educated in youth unemployment rate 9.7 9.6 12.5 24.5
Source: Enquête Emploi, INSEE.

Figure 1. Youth and adult unemployment
0
5
10
15
20
25
30
1970
1971
1972
1973
1974
1975
1976
1977
1978
1979
1980
1981
1982
1983
1984
1985
1986
1987
1988
1989
1990
1991
1992
1993
1994
year
%
youth unemployment
adult unemployment
11

12
18 By ‘young educated people’ is meant those possessing at least the equivalent of a general or professional‘baccalauréat’, the school-leavers’ certificate. 19 Among the jobs created between 1982 and 1991, 17 per cent of the senior positions and 35 per cent of themiddle-level ones were filled by people holding qualifications equivalent to the ‘baccalauréat’ or less. 20 The Beveridge curve, which links the unemployment rate and the number of job vacancies is the standardmeasure of unemployment due to the mismatching. The relation between the two is normally inverse: when theeconomy expands the vacancies rate rises while the unemployment rate declines. A shift of the Beveridge curveto the right indicates a deterioration of the matching process between supply and demand for labour, since itdenotes a growing number of vacancies for a constant level of unemployment. 21 Gautié (1996) contains an exhaustive criticism of the work of Bourdet and Persson (1991, 1994). 22 In 1996 the proportion in education was 91 per cent among the 15-19 year-olds; 44 per cent among the 20-24year-olds, and 5 per cent among those aged 25 to 29.
Thus as youth unemployment grows, so the young seem to choose en masse to go onstudying. This visible extension of education, and the considerable growth of the number ofpeople with secondary and higher education qualifications, produces a supply of educatedyoung people which is increasingly in tune with the development of a labour market whichrequires ever-increasing standards of training in response to technical progress and growingcompetition. In 1996 France cannot reasonably be said to be suffering from a shortage ofskilled workers. The growth of the labour market ‘s requirement in skills has been paralleledby the growth in the level of education, and the rate of unemployment of young educatedpeople18 has in fact risen in the 1983-1996 period: it grew at first, between 1983 and 1986, andthen declined between 1986 and 1992, only to grow again between 1992 and 1996 (Table 10).
The demand for highly qualified work-force has not increased sufficiently to absorb thegrowing numbers of educated young people, especially during the 1990s. As Goux and Marin(1993) have shown, career positions, especially those at the middle level, are by no meansbeing filled by higher education graduates, as businesses choose to fill them by internalpromotion of less formally qualified, but more experienced, employees.19 Thus the lack of jobshas been more of a burden for young educated people than for less educated, but moreexperienced, adults.
Another explanation of educated youth unemployment is in terms of a mismatchingbetween the educational system and the real needs of the economy.20 For example, Sneessens(1994) has shown that during the period 1974-1994 there was an increase in structuralunemployment in France arising from skill mismatching. However in the light of hisobservation that few businesses experienced a shortage of educated labour force in the late1980s, the author recognises that the persistently high levels of unemployment cannot be adirect effect of qualified labour force. Bourdet and Persson (1991, 1994) have used theBeveridge curve to study unemployment arising from the mismatching in France and Sweden,and they find that the persistence of youth unemployment in France is a result of the inadequatelevel of aggregate demand and of a faltering adjustment mechanism between supply anddemand for jobs - although they go on to state that youth employment measures havecompensated for this failure. However, both their methodology and their interpretation of theresults give cause for concern.21
Despite the continuous improvement in the educational level of the young during the lasttwenty years22, some 280,000 young people without any educational qualification wereunemployed in 1996. This is not a new, but rather a recurrent situation especially since 1983(Table 10). Thus the unemployment rate among the unqualified young people, after brieflyfalling until 1992, has not ceased to increase since then, reaching 36 per cent in 1996

13
23 By unqualified is meant those not even possessing a CAP (certificat d’aptitude professionnelle), a basicvocational training certificate. 24 We have shown that there is no link between the flows of adult unemployed finding jobs and the flows of youngpeople into unemployment, or being unemployed, drop out he labour force. 25 No study of youth unemployment by level of education is complete without taking sex into account, which isthe reason for the presentation of the data for young men and young women separately.
(Table 10). To be precise, the unqualified young unemployed23 account for practically half ofall youth unemployment since 1983, except in 1996. The inequalities that arise from leavingschool before the end of the upper level of secondary school are accentuated by systems ofcontinuous training which tend to favour the better qualified workers. Thus someone who dropsout of school at the start of their adolescence eventually drops out of the labour market too,having little chance of finding a job or to improve his or her productivity, and unable tocompete with either adults or young people in jobs.24 It is possible with appropriate trainingpolicies, to avoid a situation of high unemployment and low growth, as shown by thefrequently demonstrated positive theoretical and empirical relationship between education andgrowth (Mankiw, Romer and Weil, 1992; Barro and Sala-i-Martin, 1995). Indeed, lowinvestment in human capital hampers growth and weak growth does not improve employment,leading in turn to a lack of incentive to invest in human capital. Thus a training policy canchange the composition of the supply of labour and adapt its structure to the growing demandfor skills. However, since investments in training are costly and subject to numerousexternalities, public sector involvement is necessary.
Table 11 shows that if we look at the cyclical and persistent pattern of unemployment formen and women25 aged 15-24, by qualification, in the 1970-1995 period, the unemploymentrate is all the more counter-cyclical if the young unemployed, male or female, are unqualified.That is to say that it is the unqualified among the young who are the first to be affected byshort-term fluctuations in the labour market, as demonstrated by Merino and Minni (1995).
Table 11. Cyclicality and persistence of youth unemployment rates, by qualification,1970-1995
Unemployed < CAP(men)
< CAP(wom)
CAP/BEP(men)
CAP/BEP(wom)
BAC (men)
BAC (wom)
> BAC(men)
> BAC (wom)
C( ,Y) (1) -0.43 -0.38 -0.35 -0.29 -0.18 -0.21 -0.16 -0.16AC(1)(2) 0.87 0.86 0.84 0.86 0.62 0.76 0.36 0.66
Source: Enquête Emploi, INSEE.Notes: (1) C( , Y) represents the correlation of one variable with the business cycle. (2) AC(1) represents the order
one auto-correlation.
Likewise the rate of unemployment is less persistently high where young people, male orfemale, are highly qualified. This reflects the fact that a qualified young unemployed personhas a better chance of finding a job than an unqualified one.
3.3 Active employment policy measures
During the period under consideration expenditure on active employment policies hasmultiplied some six times and more than fifty different measures have been put forward to fightthe growth of youth unemployment (DARES, 1996). It is therefore important that these policiesbe taken into account in the analysis. Active employment policy measures comprise various

14
26 In that case, they are more likely to affect the structural unemployment. 27 A measure of the net effects on unemployment of these measures would need to take into account leakages suchas the pure deadweight effect (where a business would have created a job anyway and would have filled it with aperson having the same characteristics as the beneficiary of the measure); the substitution effect (where the firmwould have created the job, but would have filled it with a person having different characteristics); the crowdingout effect (where regular employment declines due to competitive behaviour of firms who take advantage ofsubsidized jobs to increase market share and to wage increases arising from those schemes), and the crowding ineffect (bringing more people into the labour force). For a more detailed account see Gautié, 1996. 28 In fact they began in 1982 with the ‘young volunteer’ programmes, but these did not affect many young people.
types of measures including the provision of information and guidance, training and thepromotion of both commercial and non-profit employment. These affect the level ofunemployment in various ways: information and training can improve the workings of thelabour market through a better balance between supply and demand26, they can raise the skilllevel of labour, raise its productivity and reduce its unit costs (whence a change in the reallevel of labour supply and repercussions for the overall level of employment and theequilibrium rate of unemployment); the effects of employment promotion measures are moredifficult to capture because they bring into play complex and sometimes contradictorymechanisms - deadweight effects, substitution effects between subsidised and regularemployment, and both crowding out and crowding in effects27.
It is therefore very difficult to assess the impact of the measures. One, imperfect, methodof taking them into account in an econometric analysis would be through the introduction ofa dummy variable reflecting the effect of the most significant youth training schemes in 1987and 1988 (Benhayoun, 1994). Another would reconstruct detailed series of youth employmentsubsidies based on Ministry of Labour sources. However, apart from the apprenticeship systemwhich has existed throughout the period, most of the policies have been applied only for alimited period lasting a few years. Thus, even if one combined the different types of measuresunder three main headings - subsidies for youth hiring in commercial sectors (includingapprenticeship); subsidies for youth hiring in non-profit sectors, and training schemes - thefitting of the three series into a single regression poses a serious problem. For example,subsidised youth employment only got under way in the non-profit sector from 198528 with thecommunity service jobs (TUC, “travaux d’utilité collective”), replaced in the early 1990s bythe employment solidarity contracts (CES, “contrats emploi-solidarité”). Work experienceschemes and subsidised employment in the commercial sector got under way in the mid-1970sand grew rapidly in the 1980s, with subsidised employment reaching its height in 1987 becauseof the proliferation of different types of contract offered to young people (apprenticeshipcontracts, adaptation contracts etc.), while work experience schemes were created in 1985 andthen abolished in 1990 (Chart 2). Finally, we choose to merge all these programmes into onesingle employment promotion variable (see below).
3.4 Shortage of jobs
To assess the shortage of jobs, we construct a “queuing for jobs” variable which measuresthe queuing phenomenon which young people must undergo in the labour market. The variableis the residual of an equation that explains adult unemployment on the basis of the level ofeconomic activity, a minimum wage indicator and the lagged variable of the adult rate ofunemployment. By removing from this residual the elements that are common to youth andadult unemployment we can then account for the influence of adults’ situation on young

Figure 2. ALM programs
0
200000
400000
600000
800000
1000000
1200000
1400000
1973 1974 1975 1976 1977 1978 1979 1980 1981 1982 1983 1984 1985 1986 1987 1988 1989 1990 1991 1992 1993 1994 1995
year
tho
usa
nd
s
commercial
non profit
training
15

16
29 More precisely, for unchanged levels of economic activity and labour costs. 30 We do not present a theoretical model from which to derive this equation, but it could be possible to derivea comparable form of it from various orthodox models (for example a bargaining model). 31 Some studies use the minimum wage, others the ratio of the minimum wage to the average wage (for exampleBurns, 1966; Adie, 1971; Benhayoun, 1994); some take gross wages others wages net of social securitycontributions; yet others argue on the basis of wage cost -i.e. including employer’s social security contributions(Hamernesh, 1981; Benhayoun 1994) - or of the real minimum wage (Adie and Chapin, 1971; Adie, 1973;Gramlich, 1976; Abowd and Killingworth, 1981; Benhayoun, 1994); finally the ‘Kaitz index’ is often used (Kaitz,1970).
people in the labour market. The residual can therefore capture the queuing for jobsphenomenon faced by young people. To understand this ‘queuing for jobs’ variable, take a firmwhich only employs people between the ages of 25 and 60 and which then closes down. As aresult, all other things being equal,29 the flow of adults into unemployment rises and, holdingeducational level constant, school-leavers and the young unemployed looking for work go tothe back of the queue behind these newly unemployed adults.
In the estimation of the rate of youth unemployment, we only consider the past businesscycle - which is contained into the lagged youth unemployment rate - and not thecontemporaneous one, as it is very often done by using the rate of adult unemployment as aproxy. This is because of multicollinearity problems arising between uat and uyt-1.
4. Some econometric elements: The estimation of the rateof youth unemployment
In order to establish whether the existence of a minimum wage in France has had aninfluence on the position of young people in the labour market in the 1971-1994 period, itmight be relevant, in the context of simple regression coefficients, to treat youth employmentas a dependent variable, so as to show a direct effect of labour costs. However, the trend ofyouth employment since the beginning of the 1970s has differed notably from that ofemployment as a whole (Charts 3a and 3b). It therefore seems that while youth employmenthas been almost completely insensitive to short-term fluctuations, it has been stronglydetermined by demographic trends (the sharp decline, since the beginning of the 1970s, of theshare of young people in the total population) and by the lengthening period of time spent ineducation. This is why in our estimations we have chosen the youth unemployment rate as theendogenous variable.
4.1 The specification of the equation
The equation30 estimated is as follows:
uyt = a0 + a1log (costt) + a2queuet + a3log(Polt) + a4uyt-1 + ,t
where:
• uyt represents youth unemployment at time t (as defined in the Employment Survey, thatis in the ILO definition); uyt-1 at time (t-1).
• cost : several variables appear in the literature to represent the impact of the minimumwage.31 In France the minimum wage (SMIC) applies to wage-earners as a whole and is

Figure 3a. Youth employment
0
500
1000
1500
2000
2500
3000
3500
4000
4500
1970
1971
1972
1973
1974
1975
1976
1977
1978
1979
1980
1981
1982
1983
1984
1985
1986
1987
1988
1989
1990
1991
1992
1993
1994
17

Figure 3b. Total employment
19500
20000
20500
21000
21500
22000
22500
23000
1970
1971
1972
1973
1974
1975
1976
1977
1978
1979
1980
1981
1982
1983
1984
1985
1986
1987
1988
1989
1990
1991
1992
1993
1994
18

19
32 Bazin and Martin (1991) first suggested that strong increases of the SMIC may have introduced a non linearrelationship between the minimum wage and the unemployment. 33 This is particularly the case for training contracts and subsidized employment in the voluntary sector (‘TUC’-travaux d’utilité collective- and ‘SIVP’ -stage d’initiation à la vie professionnelle-) where the stocks ofparticipants were particularly high in 1987 and 1988.
calculated as an hourly wage. Therefore we have used the minimum hourly wage: the costvariable reflects the evolution of the cost of labour (that is including employers’ socialsecurity contributions) associated with the minimum wage, in relative or absolute terms.Thus we use either (i) the ratio between wage costs -the ratio between the minimum andthe average wage cost - thus enabling measures to reduce wage costs to be taken intoaccount together with changes in the relative cost of employing young people; or (ii) thereal hourly cost of work paid at the level of the minimum wage.
• queue is an indicator for the queuing for jobs phenomenon (see before).
• Pol represents the total number of subsidised jobs in the commercial and non-profit sector(including work experience) for young people relative to the number of young unemployed.
The econometric specification being tested is semi-logarithmic32, and therefore differs fromthe log-linear relationship first developed by Mincer (1976). The specification can be obtainedthrough a simple theoretical model (Forgeot, 1996) and suggests that the higher the minimumwage - by definition fixed at a level higher than the equilibrium wage in the labour market -the higher the increase it brings about in the rate of unemployment. The specification also hasthe advantage of offering a simple interpretation of the estimated coefficients: for example thecoefficient assigned to wage costs represents the variation of the unemployment rate resultingfrom a 1 per cent rise in wage costs. We also choose to explain the rate of youth unemploymentoverall, then by educational qualifications, in terms of its past evolution because, except in thecase of young educated men, youth unemployment is a very persistent phenomenon. Thispersistence is taken into account by drawing on past history rather than a trend. Thus, theestimation of the youth unemployment rate is as follows: taking into account its past evolution,the youth unemployment rate, holding educational qualifications constant, is influenced by thecost of labour, employment policy and the ‘queue for jobs’.
4.2 Results of the estimation
Tables 12 and 13 respectively present for the 1974-1994 period estimates of the youthunemployment rate and the rate for young men and women by educational qualifications.
Considering the unemployment rate of all young people, we find that unsurprisingly, itrises faster the greater the shortage of jobs, taking into account its past evolution. The activelabour market variable is also significant and has the expected sign: mechanisms put into placeto help young people seem to have had a strong influence in reducing youth unemployment.33
In contrast no influence was detectable of the wage cost indicator on youth unemployment, andthis remains the case whichever specification is used (Table 12); in fact even the use of thegross hourly minimum wage rather than the real hourly cost of labour, or of the ratio of theminimum to the average hourly wage does not change this result. But another study(Forgeot,1996) finds an effect of the minimum wage on youth unemployment: it concludes thatsuccessive increases in the real value of the minimum wage may have increased youthunemployment in France by 2.8 per cent between 1980 and 1994 - equivalent to 32 per cent

20
34 We have used only the absolute cost of labour, because the estimates obtained on the basis of relative costproduced results which were very difficult to interpret. 35 As explained before, the chosen specification has the advantage of offering a simple interpretation of theestimated coefficients. For example, the coefficients assigned to wage costs in the unemployment equation arerespectively for the less qualified men: 0.27; for the less qualified women: 0.37 (table 13). They can be interpretas follows: a 1 per cent rise in wage costs will lead to a 0.27 point increase of the youth less qualified maleunemployment rate and to a 0.37 point increase of the youth less qualified female unemployment rate.
of the overall increase in unemployment among 15-24 year-olds during the period It seemstherefore that the quantification of the effects of the minimum wage on youth unemploymentis quite sensitive to the econometric specification used. Furthermore, Forgeot uses quarterlyseries that enable him to make a particularly focused study of the 1980-1994 period.
Table 12. Estimation of the youth unemployment rate (1974-1994) (1)
Youth unemployment rate [1] [2]
Constant -12.8 (-1.24) -10.8 (-0.95)Lagged youth unemployment rate 0.61 (4.64*) 0.6 (4.59*)Queue indicator 2.15 (2.15*) 2.33 (4.77*)ALM program -1.71(-2.41*) -1.46 (-2.24*)Minimum wage 0.25 (1.41) 0.3 (1.90)R2 0.96 0.97
Source: Enquête Emploi ; DARES ; INSEE.
Notes: (1) T-Student statistics are presented in brackets. (2) The estimation (1) takes the real hourly minimum wagecost and the estimation (2) takes the ratio hourly minimum wage cost / hourly mean wage cost as wage costindicator. (*) significant at 5 per cent level.
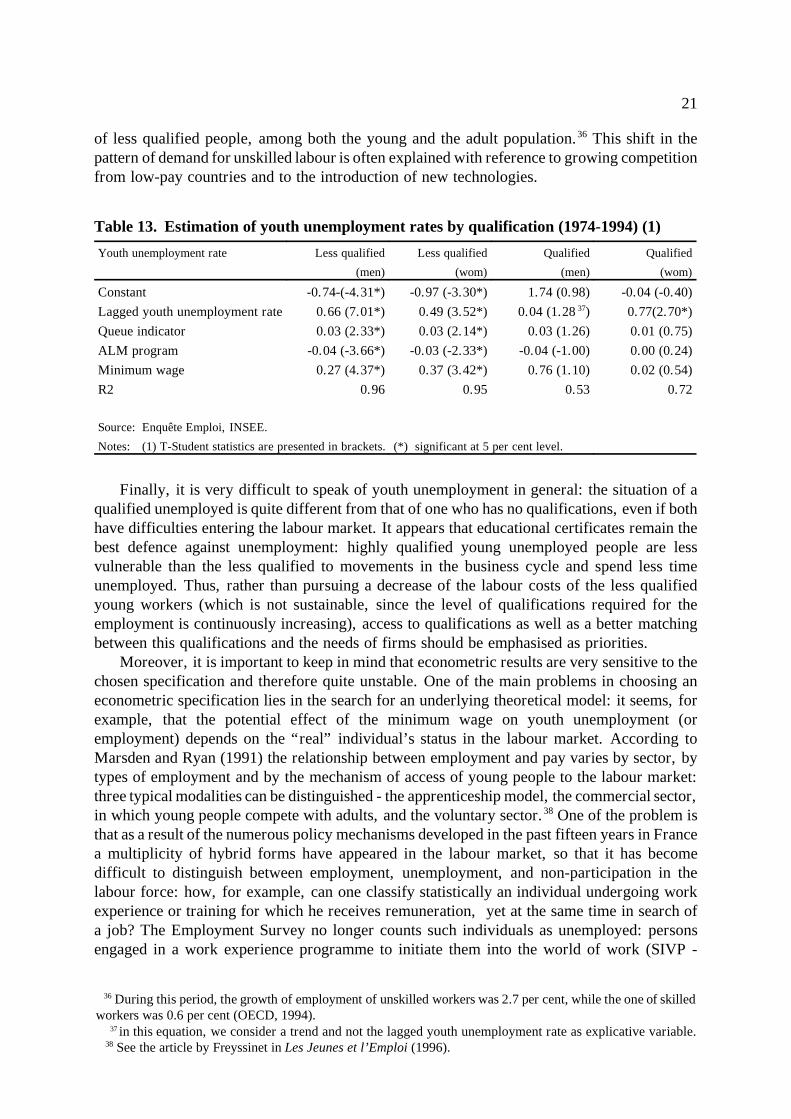
Table 13 presents the results of the same regression, by level of qualifications and bygender.34 Distinguishing between “less qualified” young men and women (here, those leavingschool at best with the ‘baccalauréat’), from those who are educationally qualified (thosehaving a qualification superior to the baccalauréat), we find a very clear borderline betweenthem, be they male or female. For young women with an educational qualification, forexample, the present unemployment trend is explained exclusively by past evolution, whereasfor both less qualified young men and women unemployment is explained by the same set ofvariables than for the whole young population (see table 12), plus the minimum wageindicator35. These striking differences according to the level of qualification, and particularlythe effect of the minimum wage on the non graduates, are all the more significant given thatall young people have problems entering the labour market.The development of temporary jobsand the progresssion of wage costs exemption measures targeted on the less qualified, whichwere widely reintroduced in 1986 to compensate for the supposed inferiority of the productivityof unskilled, may have contribute to affect the nature of all youth labour market situation, butparticularly those less qualified: they may have confined them to secondary segments of thelabour market and to sectors which often combine wage and employment flexibility. Forexample, they are concentrated in the tertiary sector, especially hotels and catering, which hirethem on the basis of fixed-term contracts, training schemes, or even work experience. Lessqualified young people are thus particularly vulnerable in the labour market. Furthermore, thechange in the structure of employment in France during the 1980s took place to the detriment
21
36 During this period, the growth of employment of unskilled workers was 2.7 per cent, while the one of skilledworkers was 0.6 per cent (OECD, 1994). 37
in this equation, we consider a trend and not the lagged youth unemployment rate as explicative variable. 38 See the article by Freyssinet in Les Jeunes et l’Emploi (1996).
of less qualified people, among both the young and the adult population.36 This shift in thepattern of demand for unskilled labour is often explained with reference to growing competitionfrom low-pay countries and to the introduction of new technologies.
Table 13. Estimation of youth unemployment rates by qualification (1974-1994) (1)
Youth unemployment rate Less qualified
(men)
Less qualified
(wom)
Qualified
(men)
Qualified
(wom)
Constant -0.74-(-4.31*) -0.97 (-3.30*) 1.74 (0.98) -0.04 (-0.40)Lagged youth unemployment rate 0.66 (7.01*) 0.49 (3.52*) 0.04 (1.28
37) 0.77(2.70*)Queue indicator 0.03 (2.33*) 0.03 (2.14*) 0.03 (1.26) 0.01 (0.75)ALM program -0.04 (-3.66*) -0.03 (-2.33*) -0.04 (-1.00) 0.00 (0.24)Minimum wage 0.27 (4.37*) 0.37 (3.42*) 0.76 (1.10) 0.02 (0.54)R2 0.96 0.95 0.53 0.72
Source: Enquête Emploi, INSEE.
Notes: (1) T-Student statistics are presented in brackets. (*) significant at 5 per cent level.
Finally, it is very difficult to speak of youth unemployment in general: the situation of aqualified unemployed is quite different from that of one who has no qualifications, even if bothhave difficulties entering the labour market. It appears that educational certificates remain thebest defence against unemployment: highly qualified young unemployed people are lessvulnerable than the less qualified to movements in the business cycle and spend less timeunemployed. Thus, rather than pursuing a decrease of the labour costs of the less qualifiedyoung workers (which is not sustainable, since the level of qualifications required for theemployment is continuously increasing), access to qualifications as well as a better matchingbetween this qualifications and the needs of firms should be emphasised as priorities.
Moreover, it is important to keep in mind that econometric results are very sensitive to thechosen specification and therefore quite unstable. One of the main problems in choosing aneconometric specification lies in the search for an underlying theoretical model: it seems, forexample, that the potential effect of the minimum wage on youth unemployment (oremployment) depends on the “real” individual’s status in the labour market. According toMarsden and Ryan (1991) the relationship between employment and pay varies by sector, bytypes of employment and by the mechanism of access of young people to the labour market:three typical modalities can be distinguished - the apprenticeship model, the commercial sector,in which young people compete with adults, and the voluntary sector.38 One of the problem isthat as a result of the numerous policy mechanisms developed in the past fifteen years in Francea multiplicity of hybrid forms have appeared in the labour market, so that it has becomedifficult to distinguish between employment, unemployment, and non-participation in thelabour force: how, for example, can one classify statistically an individual undergoing workexperience or training for which he receives remuneration, yet at the same time in search ofa job? The Employment Survey no longer counts such individuals as unemployed: personsengaged in a work experience programme to initiate them into the world of work (SIVP -

22
39 For example, there was a positive correlation between the number of participants in active employmentprogrammes and the unemployment rate in France of 0.76 for the period 1985-1994 (Scarpetta, 1996). 40 See in this connection the article by D. Cohen, in Libération.
‘stage d’initiation a la vie professionnelle’), or in receipt of a ‘solidarity-employment contract’(CES - contrat d’emploi-solidarité’) in the voluntary sector are now counted as employed. Itfollows that any expenditure on these measures leads directly to a reduction of the stock ofunemployed - and all the more so since the participation to such programmes increases withunemployment.39
5. Conclusion
In conclusion, it emerges from this study that a single dynamic process underliesfluctuations in youth and adult unemployment, showing that labour market conditions,themselves linked to the level of economic activity, are determinant in explaining the level ofunemployment. Furthermore, we could not show in the econometric analysis over the past 25years, using annual data from the Employment Survey, that young people as a whole were notemployed because labour costs were too high. However, distinguishing between levels ofqualifications reveals substantial heterogeneity in their situations on the labour market: inparticular, as there is a strong unfavourable competition between young people and adults, theproblems of qualifications are exacerbated by the fact that the shortage of jobs facing youngpeople in general is worse for the unqualified who find themselves forced to the back of the‘queue for jobs’. Therefore, unqualified young labour force may seem “too expensive”compared to other categories of workers. But to state that it is the rigidity of the wage systemwhich is responsible for unqualified youth unemployment or that it is the unsuitability oftraining for works offered by firms, are simply two sides of the same coin. In the face of theinequality in unemployment situations and of the shift in the pattern of demand for unskilledlabour, access to qualifications as well as a better matching between these qualifications andthe needs of firms should be emphasised as priorities.
Besides it is worth questioning the relevance of employment policy measures targeted ata particular section of the population - in this case young people.40 In France since 1973 therehas been a roughly sixfold increase in expenditure on active youth employment policymeasures, and more than 50 measures have been put forward to deal with the growth of youthunemployment. Thus employment policy has been focused on an ever-increasing number ofbeneficiaries of whom an average of 45 per cent were aged 16-25 in the 1973-1994 period(DARES, 1996). Now, we found in this paper than “young unemployed” are a veryheterogeneous population, and that they were hit by a “labour market access” problem. So,should government keep targeting on young people? Or should they rather target on theunqualified? Should they even have a fine tuning approach, by targeting very specific groupof young unemployed? Surely a targeted policy has substitution effects if it changes thedistribution - but not the level - of unemployment. Has not the increase in expenditure on activemeasures to deal with youth unemployment taken place at the expense of other, equallyvulnerable, categories, such as the long-term unemployed, the unqualified and women? Finally,even if overall employment policy can hold back the increase in unemployment, especially inthe downward phase of the economic cycle, it is no substitute for an expansionary macro-economic policy which is the only way to create jobs on a massive scale.

23
Bibliography
Abowd, J.M. and M. Killingworth (1981) : “Structural Models of the Effects Wages on Employment by AgeGroups”, Report of the Minimum Wage Study Commission, Vol.V Washington, DC.
Abowd, J.M., F. Kramarz, T. Lemieux and D.N. Margolis (1995): “Minimum Wages and YouthUnemployment in the United States”, Paper presented at the ‘Séminaire d’été sur le chômage dans lesannées 80’, CIRANO, Juillet.
Adie, D. (1971) : “The Lag in the Effect of Minimum Wages on Teenage Unemployment”, Proceedings of theIndustrial Relations Research Association, New Orleans.
Adie, D. (1973) : “Teenage Unemployment and Real Federal Minimum Wages”, Journal of Political Economy,Vol 81(2).
Aucouturier, A.-L. and D. Gélot (1994) : “Les dispositifs pour l’emploi et les jeunes sortant de scolarité”,Economie et Statistique n/277-278.
Barro, R. and X. Sala-i-Martin (1995) : “Economic Growth”, New-York: MacGraw Hill.Bayet, A. (1994): “Les salaires de 1991 à 1993 dans le secteur privé et semi-public”, Emploi-Revenus n/ 64,
INSEE.Bazen, S. and J.P. Martin (1991): “L’impact du salaire minimum sur les salaires et l’emploi des jeunes et des
adultes en France”, Revue économique de l’OCDE.Benhayoun, G. (1994): “The impact of Minimum Wages on Youth Employment and Unemployment in France
Revisited”, International Journal of Manpower.Bourdet, Y. and I. Persson (1991) : “Chômage des jeunes et fonctionnement du marché du travail : les cas
français et suédois”, Economie et Statistique n/249.Bourdet, Y. and I. Persson (1994) : “Youth Unemployment and Labour Market Policy in France”, Conférence
annuelle de l’EALE, Varsovie.Burda, M. and C. Wyplosz (1994) : “Gross Worker and Job Flows in Europe”, European Economic Review
n/38.Brown, C., C. Gilroy and A. Kohen (1982): “The Effect of the Minimum Wage on Employment and
Unemployment”, Journal of Economic Literature.Burns, A. (1966) : The Management of Prosperity, New York, Columbia University Press.Cahuc, P. and J. Michel (1996) : “Minimum Wage, Unemployment and Growth”, European Economic
Review.Cahuc, P. and A. Zylberberg (1996) : Economie du travail, De Boeck éditeur.Card, D. and A. Krueger (1994) : “Minimum Wages and Employment : A case study of the Fast Food
industry in New Jersey and Pennsylvania”, American Economic Review.
Card, D., F. Kramarz and T. Lemieux (1996) : “Changes in the Relative Structure of Wages andEmployment : A Comparison of the United States, Canada and France”, Working Paper 5487, NationalBureau of Economic Research.
Cette, G., P. Cuneo, D. Eyssartier and J. Gautié (1996) : “Coût du travail et emploi des jeunes”, Revue del’OFCE n/56.
Combault, P. (1995) : “Les salaires au SMIC en juillet 1990”, INSEE.CSERC (1996) : “L’allégement des charges sociales sur les bas salaires”, La Documentation Française, Paris.DARES (1996) : “40 ans de politique de l’emploi”, Ministère du travail et des affaires sociales, La
Documentation Française. Dolado, J., Kramarz, F., Machin, S., Manning, A., D. Margolis, D. and C. Teulings (1996) : “The
Economic Impact of Minimum Wages in Europe”, Economic Policy, October.Elbaum, M. and O. Marchand (1994) : “Emploi et chômage des jeunes dans les pays industrialisés : la
spécificité française”, Travail et Emploi n/58, Vol 1.Eurostat (1996) : Labour Force Surveys.

24
Forgeot, G. (1996) : “Salaire minimum et chômage des jeunes : quelques nouvelles estimationséconométriques”, mimeo, presented at the « journées de Microéconomie appliquée », Liège, june 1996.
Freyssinet, J. (1996) : “Les déterminants de l’emploi des jeunes”, dans Les jeunes et l’emploi, Cahier Travailet Emploi, La Documentation Française.
Gautié, J. (1994) : “Le chômage des jeunes en France : problème de formation ou de file d’attente?”, WorkingPaper INSEE n/ G9402.
Gautié, J. (1996) : “L’évaluation de la politique de l’emploi en faveur des jeunes en France”, Centre d’Etudesde l’Emploi, Dossier 8.
Gelot, O. and D. Osberg, (1995) : “Youth Employment Programs in France”, papier présenté au NBER. Gouriéroux, C., Monfort, A. and E. Renault (1987) : “Kullback Causality Measures”, Annales d’Economie
et de Statistiques, Vol 6/7. Goux, D. and E. Maurin (1993) : “La sécurité de l’emploi, une priorité croissante pour les diplômés”,
Economie et Statistique n/261.Goux, D. and E. Maurin (1993) : « Dynamique des professions et adaptation du système productif», Economie
et Statistique n/261.Granger, C. (1969) : “Investigating Causal Relations by Econometrics Models and Cross Spectral Methods”,
Econometrica, Vol 37(3).Gramlich E. (1976) : “Impact of Minimum Wages on Other Wages, Employment and Family Incomes”,
Brooking Papers on Economic Activity, Vol 2.Hamermeesh, D. (1981) : “Minimum Wages and the Demand for Labour”, Working Paper NBER n/656.Hénin, P.-Y. and T. Jobert (1993) : “Caractérisation et mesure du chômage”, in La persistance du chômage,
Economica.INSEE : “Enquête Emploi: detailed results”, from 1970 to 1996.Kaitz, H, (1970) : “Experience of the Past : The National Minimum”, Youth Unemployment and Minimum
Wages, Bulletin 1657, U.S. Department of Labor.Machin, S. and A. Manning (1994) : “Minimum Wages, Wage Dispersion and Employment : Evidence from
the U.K Wages Councils”, Industrial and Labor Relations Review.
Machin, S. and A. Manning (1996) : “Employment and the Introduction of a Minimum Wage in Britain”, TheEconomic Journal, 106.
Manning, A. (1995) : “How Do We Know That Real Wages are Too High ?”, Quarterly Journal of Economics.Mankiw G., Romer, D. and D. Weil (1992) : “A Contribution to the Empirics of Economics Growth”,
Quarterly Journal of Economics, Vol 104.Mardsen, Ryan (1992) : “A Contribution to the Empirics of Economics Growth”, Quarterly Journal of
Economics, Vol 104.Meron, M. and C. Minni (1995) : “Des études à l’emploi : plus tard et plus difficilement qu’il y a vingt ans”,
Economie et Statistique n/283-284.Meyer, R. and D. Wise (1983a) : “The Effects of the Minimum Wage on the Employment and Earnings of
Youth”, Journal of Labor Economics. Mincer, J. (1976) : “Unemployment effects of minimum wages”, Journal of Political Economy, 84, n/4,
August. Moghadham, R. (1993) : “Les causes du chômage en France”, mimeo, IMF, June.OECD : Employment Outlook, 1994, 1996.Rebitzer, J. and L. Taylor (1995) : “The Consequences of Minimum Wage Laws : Some New Theoretical
Ideas”, Journal of Public Economics.Ryan, P., Garonna, P. and R. Edwards (1991) : “The Problem of Youth”, Macmillan, London.Salverda, W. (1992) : Youth unemployment dynamics of the Dutch labour market 1955-1988, Wolters
Noordhoff, Gröningen.Scarpetta, S. (1996) : “Assessing the role of labour market policies and institutional settings on unemployment :
a cross-country study”, Revue économique de l’OCDE n/26.Sneessens, H. (1994) : “Courbe de Beveridge et demande de qualifications”, Economie et Prévision n/113-114.Stigler, G. (1946) : The Economics of Minimum Wage Legislation, American Economic Review, vol 36.