freight rail usage and performance 2020-21 quarter 3
TRANSCRIPT

Freight Rail Usage and Performance 2020-21 Quarter 3
4 March 2021
Background:
This quarterly statistical release contains information on the usage and performance of rail freight in Great Britain.
The statistics cover freight moved, freight lifted, freight delivery metric (FDM), freight delays per 100 train km and freight train km by operator.
Sources: Network Rail, Freight Operating Companies.
Latest quarter: 2020-21 Q3 (October to December 2020).
Contents:
Freight moved – p2 Freight lifted – p4 Freight Delivery Metric – p5 Freight delay per 100 train km – p6 Freight train kilometres – p7 Annexes – p8
Author: Oliver Lowe
Responsible Statistician: Jay Symonds
Public Enquiries: [email protected]
Media Enquiries: Tel: 020 7282 2094
Next publication: 27 May 2021
Freight rail usage and performance during the third quarter of 2020-21 was affected by the coronavirus (Covid-19) pandemic. The lower number of passenger train services in operation led to improvements in freight performance. Freight usage has recovered in Q3 following the impact of Covid-19 in 2020-21 Q1 and Q2.
Total freight moved was 4.07 billion net tonne kilometres in 2020-21 Q3, an increase of 2.1% compared with 2019-20 Q3. Total freight lifted increased by 12% to 17.8 million tonnes in 2020-21 Q3.
Freight moved (billion net tonne kilometres), Great Britain, 2015-16 Q1 to 2020-21 Q3
Freight train kilometres dropped by 1.4% in 2020-21 Q3 compared with the same quarter the previous year, falling to 8.0 million kilometres.
The proportion of freight trains arriving within 15 minutes, as measured by the Freight Delivery Metric, reached 94.7%.
All data tables, a quality and methodology report and an interactive dashboard associated with this release are published on the Freight rail usage and performance page on the ORR data portal. Key definitions are in Annex 1 of this release.

Freight Rail Usage and Performance 2020-21 Quarter 3
Office of Rail and Road | 04 March 2021 2
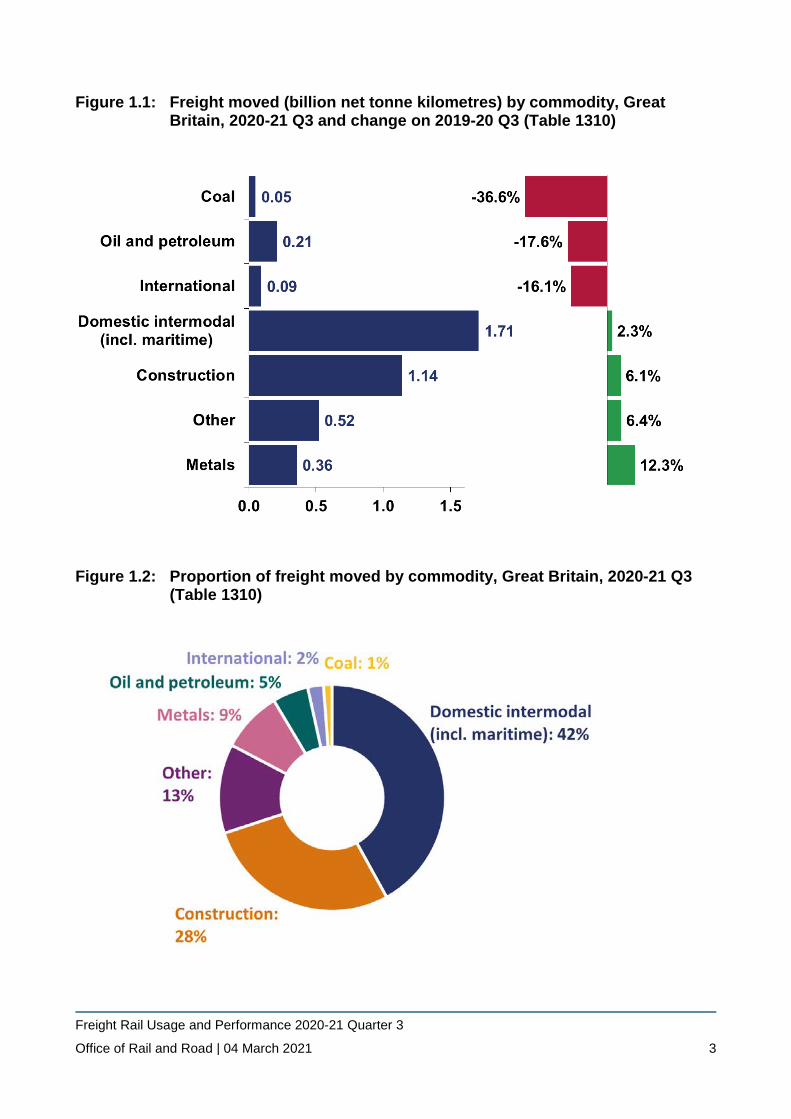
1. Freight moved The volume of freight moved was 4.07 billion net tonne kilometres in 2020-21 Q3. This was a 2.1% increase on the same quarter last year. It indicates that freight volumes have recovered following the impact of Covid-19 on 2020-21 Q1 and Q2.
Metals volumes saw a 12.3% rise compared with 2019-20 Q3. This may be associated with the lengthening of some steel trains, which allows more to be moved on each train.
In terms of absolute volumes, the construction sector has seen the largest increase, rising by 0.07 billion net tonne kilometres compared with the same quarter last year. This in part was due to increased activity from High Speed 2 (HS2) construction. The market share of construction is 28% (the second largest commodity share).
Coal has seen the biggest percentage reduction in freight moved (down 36.6%) compared with the same quarter last year. This fall is consistent with the longer-term trend for coal volumes.
Oil and petroleum volumes saw an 17.6% reduction in freight moved compared with the same quarter last year. This is in the context of the continued suspension of aviation fuel to airports, where there are fewer flights due to Covid-19 and reduced need for additional fuel to be supplied by rail. This led to OiI and petroleum having the biggest decrease in market share compared with the same quarter last year, falling by 1.2 percentage points to 5%.
International volumes moved had a reduction of 16.1%. The ban on freight movements across the Channel from 20th to 22nd December by the French government and the delays caused by associated Covid testing are likely to have impacted the international volumes.
Domestic intermodal (transporting of goods to and from GB ports makes up the majority of this category) had the largest share of freight moved (42%). There was a 2.3% increase in the volume moved, however this rise may have been dampened by congestion at deep sea container ports this quarter.
Freight Rail Usage and Performance 2020-21 Quarter 3
Office of Rail and Road | 04 March 2021 3
Figure 1.1: Freight moved (billion net tonne kilometres) by commodity, Great Britain, 2020-21 Q3 and change on 2019-20 Q3 (Table 1310)
Figure 1.2: Proportion of freight moved by commodity, Great Britain, 2020-21 Q3 (Table 1310)
Freight Rail Usage and Performance 2020-21 Quarter 3
Office of Rail and Road | 04 March 2021 4
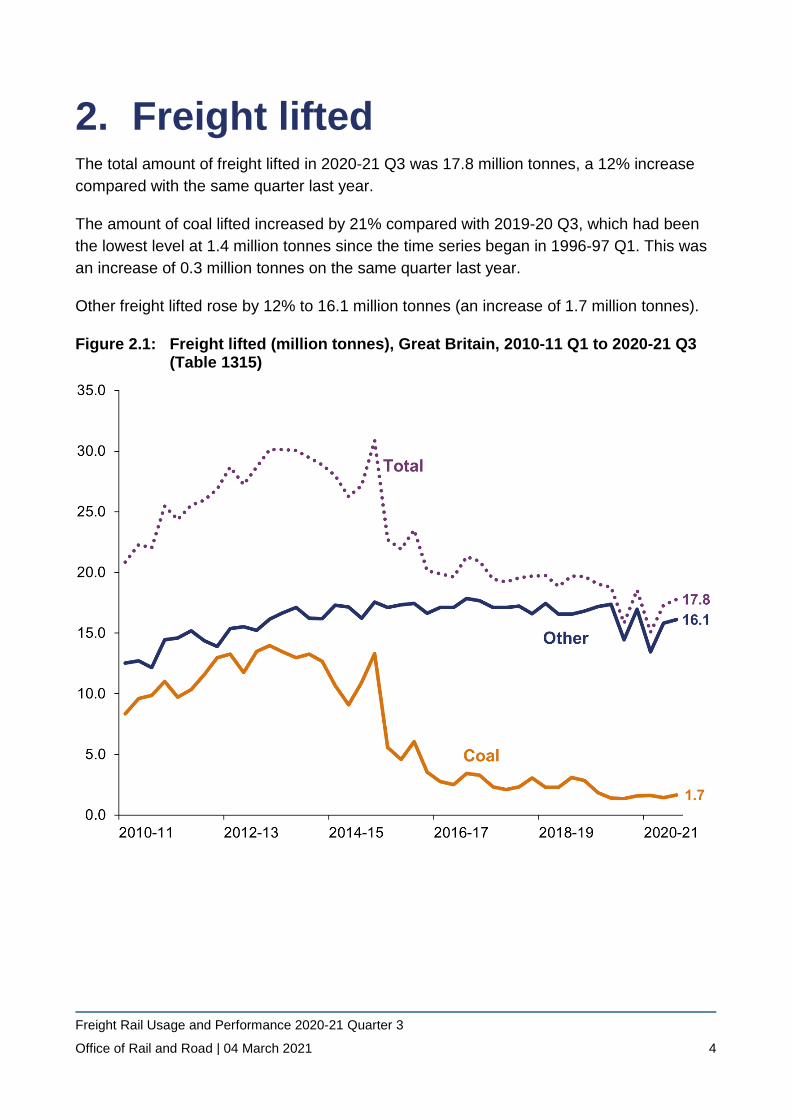
2. Freight lifted The total amount of freight lifted in 2020-21 Q3 was 17.8 million tonnes, a 12% increase compared with the same quarter last year.
The amount of coal lifted increased by 21% compared with 2019-20 Q3, which had been the lowest level at 1.4 million tonnes since the time series began in 1996-97 Q1. This was an increase of 0.3 million tonnes on the same quarter last year.
Other freight lifted rose by 12% to 16.1 million tonnes (an increase of 1.7 million tonnes).
Figure 2.1: Freight lifted (million tonnes), Great Britain, 2010-11 Q1 to 2020-21 Q3 (Table 1315)

Freight Rail Usage and Performance 2020-21 Quarter 3
Office of Rail and Road | 04 March 2021 5
3. Freight Delivery Metric (FDM) The Freight Delivery Metric was 94.7% in 2020-21 Q3. This was the highest level of Q3 freight punctuality since the start of the time series in 2012-13. Freight performance has improved due to passenger operators running a reduced timetable compared with before the coronavirus pandemic. Network Rail have enabled freight trains to be longer, heavier and make better use of network capacity. This has allowed freight services to run more efficiently.
The improvement in freight punctuality is reflected in the FDM moving annual average (MAA). The FDM MAA was 94.4% at the end of 2020-21 Q3, which is the highest level in the whole time series. It was up 0.6 percentage points compared with the same quarter last year.
Figure 3.1: Freight Delivery Metric (quarterly and MAA), Great Britain, 2014-15 Q1 to 2020-21 Q3 (Table 1320)

Freight Rail Usage and Performance 2020-21 Quarter 3
Office of Rail and Road | 04 March 2021 6
4. Freight delay per 100 train kilometres
Freight operators experienced 9.85 minutes of delay per 100 train kilometres in 2020-21 Q3. This was down 24% on the same quarter last year. It represents the lowest level of Q3 freight delay since the time series began in 2007-08.
The reduction in the number of passenger services operating across the network and the improvements in access to the network for freight trains during the pandemic led to lower freight delays.
Figure 4.1: Freight delays per 100 train kilometres, Great Britain, 2015-16 Q1 to 2020-21 Q3 (Table 1325)

Freight Rail Usage and Performance 2020-21 Quarter 3
Office of Rail and Road | 04 March 2021 7
5. Freight train kilometres Nationally, freight train kilometres fell by 1.4% compared with 2019-20 Q3. The context of longer, heavier trains may have resulted in this small reduction from fewer freight services being required to transport the same volume. Additionally, freight trains utilising the network more efficiently could have led to more efficient pathing arrangements and fewer trains being re-routed.
The second largest operator had the greatest absolute reduction. Freight train kilometres for Freightliner decreased by 0.19 million kilometres (down 9.4%).
Two operators saw rises in freight train kilometres compared with the same quarter last year. Freightliner Heavy Haul saw an increase of 0.13 million kilometres (up 18.6%). This rise can be attributed to their acquisition of the Mendip contract from DB Cargo UK in November 2019. Direct Rail Services increased by 0.08 million kilometres (up 15.7%).
Figure 5.1: Freight train kilometres (millions) by operator, Great Britain, 2020-21 Q3 and change on 2019-20 Q3 (Table 1333)
Freight Rail Usage and Performance 2020-21 Quarter 3
Office of Rail and Road | 04 March 2021 8
6. Annexes Annex 1 – Definitions ● Freight moved measures the amount of freight moved on the railway network, taking
into account the weight of the load and the distance carried. It is measured in net tonne kilometres.
● Freight lifted is the mass of goods carried on the rail network measured in tonnes, excluding the weight of the locomotives and wagons. Unlike freight moved it takes no account of the distance travelled.
● Freight Delivery Metric (FDM) measures the percentage of commercial freight services that arrive at planned destination within 15 minutes of their booked arrival time or with less than 15 minutes of Network Rail or passenger operator delay. A higher score indicates better performance.
● Moving annual average (MAA) reflects the proportion of trains that met FDM in the past 12 months. In Q4, the MAA also represents the FDM for the financial year.
● Freight delay per 100 train kilometres is a normalised measure of delay experienced by freight operators. It is calculated from the total delay experienced by all GB freight operators divided by their train mileage. Freight train mileage can fluctuate depending on demand so a normalised measure allows for comparison over time regardless of changing levels of freight traffic on the network. A lower score indicates better performance.
● Freight train kilometres is the actual kilometres travelled by freight operators on Network Rail infrastructure. The data is sourced from Network Rail’s Track Access Billing System (TABS) and covers only the mileages charged through TABS. Competition between freight operators means we would expect a greater level of variation in mileage from year to year than in the passenger market.
Further information on each of these measures and other definitions can be found in the Freight quality and methodology report.

Freight Rail Usage and Performance 2020-21 Quarter 3
Office of Rail and Road | 04 March 2021 9
Annex 2 – Quality and methodology Data sources and methodology Most of the data contained within this statistical release is sourced from Network Rail, with the exception of freight lifted data, which is sourced directly from the six largest Freight Operating Companies (DB Cargo UK, Freightliner, GB Railfreight, Direct Rail Services, Colas Freight, and Devon & Cornwall Railways) and provided on a quarterly basis.
To provide more comprehensive coverage of the freight market, estimates of freight lifted have been calculated for Devon & Cornwall Railways (2011-12 Q1 onwards) and Colas Freight (2010-11 Q1 to 2019-20 Q4). From 2020-21 Q1, Colas Freight are providing actual freight lifted data but Devon & Cornwall Railways will continue to be estimated in future releases. These estimates are based on calculating the number of freight train movements in a quarter for each operator (estimated from their actual train mileage data) and multiplying that by the average tonnes lifted per train for the latest full year, at a national level.
Network Rail provides data to ORR within 21 days of the end of each of the 13 railway reporting periods (each period lasts four weeks). The quarterly data in this release sourced from Network Rail are derived by splitting the periodic data according to the number of days of the period that fall within each quarter.
The latest freight train kilometres data and freight delay per 100 train kilometres data should be treated as provisional. Freight operators can provide Network Rail with additional data (e.g. cancellations) and Network Rail may re-attribute delays over time.
Freight moved data is not revised as the data is provided as a periodic snapshot.
Further development of these statistics Our freight lifted statistics are currently disaggregated between Coal and Other. Following the slowdown in Coal lifted, this split has limited value. We are investigating the possibility of providing a more disaggregated set of commodities in future.
Revisions There have been revisions to previously published data since last quarter’s publication. Further details on the revisions can be found in the Revisions log.
Further information on data sources, quality, and the methodology used to calculate the data within the release can be found in the Freight quality and methodology report.

Freight Rail Usage and Performance 2020-21 Quarter 3
Office of Rail and Road | 04 March 2021 10
Annex 3 – List of data tables associated with this release and other related statistics Data tables All data tables can be accessed on the ORR data portal free of charge in OpenDocument Spreadsheet (.ods) format. We can also provide data in csv format on request.
All tables associated with this release can be found under the Data tables heading at the bottom of the Freight rail usage and performance page.
Freight usage ● Freight moved (quarterly) – Table 1310 ● Freight moved (periodic) – Table 1314 ● Freight lifted (quarterly) – Table 1315 ● Rail freight impact on road haulage (annual) – Table 1340 ● Rail freight market share (annual) – Table 1350
Freight performance ● Freight Delivery Metric (FDM) (quarterly) – Table 1320 ● Freight Delivery Metric by Network Rail Region (FDM-R) (quarterly) – Table 1324 ● Freight delays per 100 train kilometres (quarterly) – Table 1325
Freight traffic ● Freight trains run (annual) – Table 1330 ● Freight train kilometres by operator (quarterly) – Table 1333
Other related statistics Passenger rail usage statistics are published on the Passenger rail usage page on the data portal.
Passenger rail performance statistics are published on the Passenger rail performance page on the data portal.
Estimates of passenger and freight energy consumption and carbon dioxide equivalent (CO2e) emissions are published on the Rail emissions page on the data portal.
The Department for Transport (DfT) also publishes some multimodal freight statistics as part of the Transport Statistics Great Britain publication.
The Department for Transport (DfT) also publishes rail statistics. For example, Rail passenger numbers and overcrowding on weekdays in major cities.

Freight Rail Usage and Performance 2020-21 Quarter 3
Office of Rail and Road | 04 March 2021 11
Annex 4 – ORR’s statistical publications Statistical Releases This publication is part of ORR’s National Statistics accredited releases, which consist of seven annual publications: Estimates of Station Usage; Rail Industry Finance (UK); Rail Fares Index; Rail Safety Statistics; Rail Infrastructure and Assets; Rail Emissions; Regional Rail Usage; and four quarterly publications: Passenger Rail Performance; Freight Rail Usage and Performance; Passenger Rail Usage; Passenger Rail Service Complaints.
In addition, ORR also publishes a number of Official Statistics, which consist of three annual publications: Train Operating Company Key Statistics; Rail Statistics Compendium; Occupational Health; and four quarterly publications: Signals passed at danger (SPADS); Delay Compensation Claims; Disabled Person’s Railcard (DPRC); Passenger assistance.
All the above publications are available on the ORR data portal along with a list of publication dates for the next 12 months.
National Statistics The United Kingdom Statistics Authority designated these statistics as National Statistics, in accordance with the Statistics and Registration Service Act 2007 and signifying compliance with the Code of Practice for Official Statistics. National Statistics status means that official statistics meet the highest standards of trustworthiness, quality and public value.
The majority of these statistical releases were assessed in 2012 and also hold National Statistics status. Since our assessment we have improved the content, presentation and quality of our statistical releases. In addition, in July 2019 we launched our new data portal. Therefore, in late 2019 we worked with the Office for Statistics Regulation (OSR) to conduct a compliance check to ensure we are still meeting the standards of the Code. On 4 November 2019, OSR published a letter confirming that ORR’s statistics should continue to be designated as National Statistics. OSR found many positive aspects in the way that we produce and present our statistics and welcomed the range of improvements made since the statistics were last assessed. Estimates of Station Usage statistics were assessed in 2020.
For more information on how we adhere to the Code please see our compliance statements. For more details or to provide feedback, please contact the Statistics Head of Profession (Lyndsey Melbourne) at [email protected].

Freight Rail Usage and Performance 2020-21 Quarter 3
Office of Rail and Road | 04 March 2021 12
© Crown copyright 2021
This publication is licensed under the terms of the Open Government Licence v3.0 except where otherwise stated.
Where we have identified any third party copyright information you will need to obtain permission from the copyright holders concerned.
This publication is available on the ORR data portal
Any media enquiries regarding this publication should be sent to us at orr.gov.uk/contact-us.