freight logistics ecommerce trends - tandla.net - freight logistics... · – warehouse management...
TRANSCRIPT
Prepared for:
Prepared by:
Freight Logistics
eCommerce Trends
January 12, 2018

Disclaimer Statement
1
This report has been prepared by Transportation and Logistics Advisors (T&LA) for Stifel Capital
Markets (Stifel). The report is based upon information obtained from sources deemed to be reliable.
All findings, conclusions, and recommendations are based upon the information made available to us.
Market analyses and projections represent T&LA’s judgment, based upon data sources cited, and are
subject to the validity of the assumptions noted herein. For purposes of the analyses presented in this
report, T&LA has relied upon, and considered accurate and complete, data obtained from the sources
cited, but has not independently verified the accuracy and completeness that data. No representation
or claim is made that the results projected will actually be achieved. It is expected that any and all
recipients will conduct their own independent analysis. All estimates and projections contained in this
report are based on data obtained from the sources cited and involve significant elements of
subjective judgment and analysis, which may or may not be correct.
Stifel has agreed that any report prepared by T&LA and any information, findings, conclusions or
recommendations provided by T&LA or any of its representatives to Stifel in connection with its work
are for the exclusive use of Stifel and that no third party may rely on our report or our work. The
delivery of this and any report in connection therewith, is intended to confer rights upon any other
person or provide any other person (including affiliates, partners, advisors and of such person) with
any direct or indirect benefits or permit any other person to be regarded as a third party beneficiary.

Agenda
2
• Market Size and Characteristics
• Key eCommerce Trends
• Potential Implications for Transportation

US eCommerce is a $450B market, growing nearly 15% per year
• Estimated US 2017 eCommerce sales of $450 B
• Growth is accelerating
– Q1-Q3 2017 grew ~15.6% year over year
– 2016 growth: 14.9%
– 2015 growth: 14.0%
– 2012 – E2017 CAGR: 14.4%
• eCommerce sales accounted for about 8.4% of Q1-Q3 2017 total US retail sales
– 2016 eCommerce was 10.5% of US Retail Sales excluding autos and auto parts
– Internet Retailer claims 2016 eCommerce penetration of 11.7%
Note: E2017 based on annualized Q1-Q3 2017 increase
Source(s): US Census Bureau; Internet Retailer 3
$0
$100
$200
$300
$400
$500
2012 2013 2014 2015 2016 E2017
US eCommerce Sales by Year ($B)

18%
15%
10%
7%4%4%4%
3%3%
33%
Apparel, Footwear, Accessories Electronics & Computers
Furniture & Home Furnishings Health & Beauty
Sporting Goods Books & Magazines
Toys, Hobbies Office Equipment & Supplies
Food & Beverage All Other
In the US, apparel and consumer electronics account for nearly
one-third of eCommerce sales. Sales are dispersed across a
range of product categories
• eCommerce sales are across a
wide range of product
categories
• Apparel/footwear, electronics,
and furniture/home furnishings
are the largest eCommerce
categories by spend
• “All Other” makes up a big
percentage
Source(s): U.S. Census Bureau, 20174
E2015 US eCommerce Sales
by Product Category

38%44%
8%
7%3%
4%3%
4%
1%
2%
1%
1%
1%
1%
0%
10%
20%
30%
40%
50%
60%
70%
2016 2017
Amazon eBay WalmartApple Home Depot Best BuyMacy's Wayfair CostcoQVC
Amazon.com is by far the largest eCommerce retailer – and a
leading influencer of eCommerce supply chains
• Amazon.com, including its marketplace, is far and away the leading U.S. eCommerce retailer with an estimated 43.5% of the market
• After Amazon, the market is relatively dispersed
– Retailer #2-10: 20.5% of eCommerce sales
– Retailer #11-500: 20%
– Retailer #501 and higher: 16%
• Amazon’s share of U.S. online sales is growing
• Amazon is a major influencer of eCommerce supply chains
– Free shipping
– Free returns
– Same day delivery
– Developing transportation capabilities
– Driving eC DC network
Source(s): Chain Store Age/eMarketer 10/2017; Internet Retailer5
eCommerce Market by Retailer

Other retailers and carriers are starting to respond
6
Retailers Carriers
• Walmart becoming more competitive
‒ Acquires Jet.com (2016)
‒ Lowering barriers for free
shipping
• Target
‒ Acquires same day delivery
platform Shipt (2017)
‒ Free shipping with branded card
• IKEA acquires “jobber” company TaskRabbit
• UPS investment in same day delivery company Deliv (2016)
• Parcel carrier changes to pricing
Agenda
7
• Market Size and Characteristics
• Key eCommerce Trends
– Retailer/ e-Tailer Capabilities
– Transportation and Fulfillment Models
– Relative Economics
• Potential Implications for Transportation

eCommerce is growing fast and still evolving — making it difficult
to plan and manage the supply chain
8
How companies go to
market
Customer
expectations on
product delivery times
Customer
expectations on ability
to return products
Fast growth
• Manufacturers/ distributors
‒ Sell through
traditional retailers?
‒ Sell through
Amazon and other
eTailers?
‒ Sell direct through
brand website?
‒ Channel conflicts?
• Retailers
‒ Omni-channel
approach
‒ Marketplaces
• Slow and cheap, or fast and expensive?
• Free shipping expectations?
• What will consumers demand and pay for?
• Same-day?
• How to compete with Amazon?
• Free shipping of returns?
• Consumer mentality — buy 3, return 2
• Where and how to process returns?
• What volumes should be planned for
• How to maintain flexibility
How eCommerce is Changing

Most traditional/old-line companies have been set up to ship and
receive pallets, not packages ― companies have to add
capabilities to facilitate eCommerce
9
Traditional Retail eCommerce Fulfillment
Outbound
Shipment
Volume
• DC to store
• Low frequency of large shipments (TL, TL multi-stop)
• DC to consumer
• High frequency of small shipments (parcel)
Warehouse
Operations
• Racked pallets, moved with fork lifts
• Staging of multiple pallets to move into trailers
• Limited handling or packaging ― some mixing, shrink wrapping
• At individual product level – “eaches”
• Manual picking
• Packaging lines
• Can have pre-sort for packages for parcel carriers
• Can be highly automated picking systems with large capex investment

Technology to support single pick is very different and requires
additional capabilities
• Inventory management at various levels
– Pallet
– Case
– Each
• Order picking
• Premium on real-time information ― in both directions
– What is in-stock
– Applying orders immediately to inventory
– Shipping cost
• Integration with various systems, often cross-company
– Web “front end” (Demandware, IBM, Oracle, SAP)
– Various order management systems (Jagged Peak)
– Warehouse management systems (JDA, Manhattan)
– Various ERPs (SAP, Netsuite)
• More complex returns
10

Web-only retailers have significant challenges as they scale
11
eCommerce Challenges Options/Issues
• Typically begin with single point fulfilment
‒ Insufficient scale to stock
multiple DC’s
‒ Leads to high delivery costs,
longer delivery times
• When grow to multi-DC
‒ Causes technology issues
‒ Legacy DC’s in wrong location
‒ Requires more inventory
• DIY vs. Outsource
• Single vs. multi-user facility
• Managing returns
• Returns restock vs. liquidation
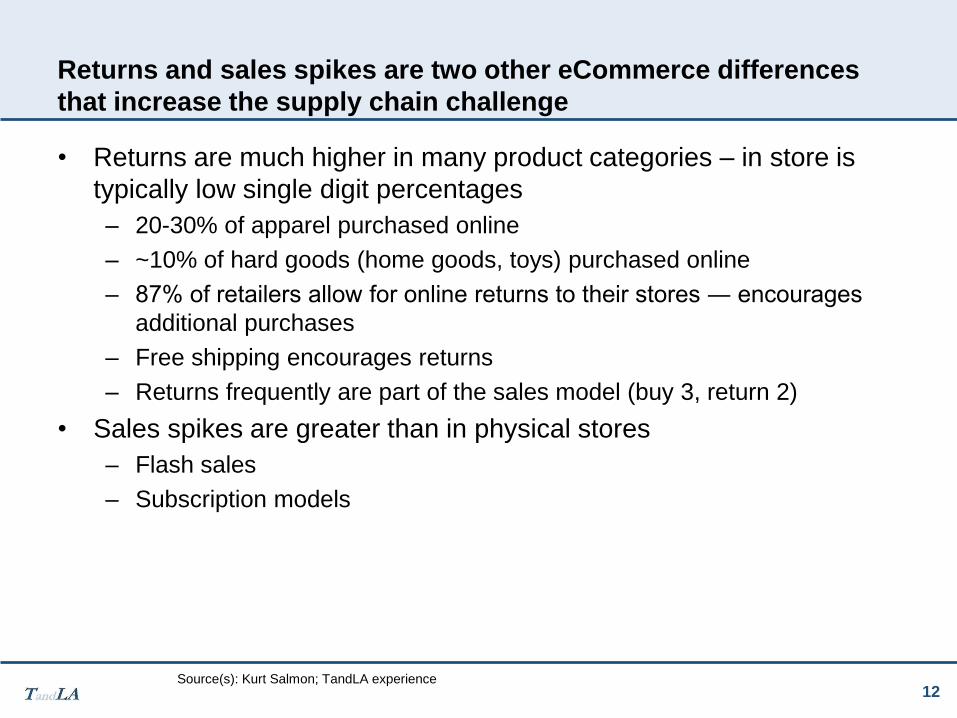
Returns and sales spikes are two other eCommerce differences
that increase the supply chain challenge
12
• Returns are much higher in many product categories – in store is
typically low single digit percentages
– 20-30% of apparel purchased online
– ~10% of hard goods (home goods, toys) purchased online
– 87% of retailers allow for online returns to their stores ― encourages
additional purchases
– Free shipping encourages returns
– Returns frequently are part of the sales model (buy 3, return 2)
• Sales spikes are greater than in physical stores
– Flash sales
– Subscription models
Source(s): Kurt Salmon; TandLA experience

Agenda
13
• Market Size and Characteristics
• Key eCommerce Trends
– Retailer/ e-Tailer Capabilities
– Transportation and Fulfillment Models
– Relative Economics
• Potential Implications for Transportation

US final mile/delivery - there are a range of delivery options at
different service levels and price points
14
Express GroundUSPS Delivery
(Parcel Select)Same Day
Service • Parcel carrier air or ground
• Time definite
• Parcel ground carrier
• Parcel carrier does bulk pick-up, sort, line haul
• USPS provides final mile delivery
• Courier delivery
Speed • Next day/ 2nd day
• 2-5 days • 2-7 days • Same day
Cost • High • Medium • Lowest • High
Position • Easy
• High quality
• Expensive
• Easy, less expensive than Express
• DIM issues
• Lowest service
• Lowest cost
• <5 Lb. packages
• Amazon in major metros
• Difficult for most others to follow
• Some via shared economy
Oversized products can come LTL or specialized 3PL

USPS Parcel Select products have grown fast as a low cost parcel
option
• USPS Parcel Select product growth has been rapid
– 2012 – 2017 Revenue CAGR: 33%
– 2012 – 2017 Volume CAGR: 24%
• Providers such as FedEx SmartPost, Newgistics, and UPS SurePost have been growing fast
• Parcel Select has grown despite USPS pricing increases
– Revenue Per Piece:
• 2012: $1.43
• 2017: $2.02
– Revenue Per Lb.:
• 2012: $0.77
• 2017: $0.89
Source(s): USPS Revenue, Pieces & Weight data; TandLA experience15
USPS Parcel Select Annual Revenue
$ Billions
$0
$1
$2
$3
$4
$5
$6
2012 2013 2014 2015 2016 2017

However, Parcel Select shipments with FedEx and UPS are
converting to dimensional pricing (DIM). Ground shipments were
already based on DIM
*FedEx rate change except for shipment by the ounce
Source(s): UPS, FedEx websites; TandLA experience 16
Description Impact
• DIM pricing is used by carriers more effectively cost light, bulky shipments
– Parcel pricing based on both package weight and dimensions
– Light bulky shipments are assigned a higher weight and billed at that weight
• FedEx and UPS instituted dimensional pricing for ground shipments around year end 2014
• More recently UPS changed SurePost product to DIM pricing, FedEx changing SmartPost to DIM pricing 1/22/2018*
• Shippers of relatively large, low weight packages pay higher parcel rates
• Operational impact - Increased emphasis on better packaging. Smaller boxes
• Merchandizing impact - Potential to add products to a shipment without adding shipping cost
• Benefit of avoiding DIM pricing by using Parcel Select products is going away

In addition to the change in use of DIM pricing, there are other
factors that could impact Parcel Select
Source(s): UPS, FedEx websites; WSJ 12/29/2017; TandLA experience17
Introduction of DIM Pricing
by FedEx and UPSPolitical Influences USPS Capital Requirements
• Could decrease attractiveness of Parcel Select products vs. standard ground
• President Trump tweets that for delivering parcels to homes for Amazon, USPS “Should be charging MUCH MORE” 12/29/2017
• USPS fleet designed for mail delivery, not parcels
• Could require a new fleet investment
• New sort capabilities?

Same day was considered too costly, but Amazon is making an
aggressive push, leveraging its local fulfillment network
Source(s): Amazon.com, Best Buy website; Techcrunch; TandLA expertise18
• Amazon offerings
– 1 and 2 hour delivery (Prime Now)
currently available in 32 metro areas (not
all zip codes)
– Sunday delivery
• Retailers offering same day through
3PLs and crowd sourcing providers
• Without a local network Same day is
cost prohibitive
Advantages Challenges
• Highest speed to customer
• Best alternative to physical shopping -“need it now”
• Inventory must be close to customers
• Very difficult to have density to make low cost delivery
2015 Amazon Prime
Same Day Free Shipping Cities
Now claim 8,000 towns and cities
2016 Amazon Prime
Same Day Free Shipping Cities
~1,000 towns and cities

Companies fulfill orders with various models, each has its pros
and cons as there is no “one-size fits all”
Source(s): TandLA expertise19
Advantages Disadvantages
Single
Fulfillment
Center
• Fits in existing technology/network as a “store”
• Can start small, easy to start and manage
• Minimize inventory safety stock
• High cost final mile delivery
• Long and variable delivery transit
Multiple
Fulfilment
Centers
• Lower final mile costs
• Better delivery transit
• Omni-channel technology issues/complexity
• Inventory levels
• Scale to make centers efficient
Stores • Close to customers
• Existing space and inventory
• Facilitates same day
• Greatest omni-channel issues
• High cost DC – labor, per sq ft
• Interrupt merchandizing and store operations

Moving to multiple DC’s dramatically lowers final mile costs, but
adds significant complexity
• Significantly lowers average
Zones
– Lower cost
– Faster delivery
– Reduced variability
• However ― Creates a lot of
issues and challenges
– Omni-channel technology and
operations issues
– Increased inventory
– Required scale to support
multiple operations
• Note: Optimal network
requires moving the initial DC
Source(s): UPS website; TandLA expertise20
Example UPS Zones
1
8
8 6
5
4
4
4
4
3
5
8
7
5
2
4
5
5
4
5
5
2
3
4
24
6
1 DC
2 DCs

Many companies outsource fulfillment to a 3PL to gain more
sophisticated capabilities
Source(s): TandLA expertise21
Outsourcing Benefits Example Providers
• 3PL invests in technology
• 3PL expert in handling “eaches”
• Can use space in a shared facility to gain scale benefits
• Faster way to build capability
• Can have lower cost labor
• Can have lower cost transport
‒ Leverages scale of 3rd party provider
‒ Provider may have volume to pre-
sort for carrier
• Fulfillment is non-core for many companies
• Amazon Fulfillment
• Radial (acquired by bpost, 2017)
• PFSWeb
• Newgistics
• Saddle Creek

Agenda
22
• Market Size and Characteristics
• Key eCommerce Trends
– Retailer/ e-Tailer Capabilities
– Transportation and Fulfillment Models
– Relative Economics
• Potential Implications for Transportation

There are many drivers to lower eCommerce supply chain costs ―
companies must balance across them
Source(s): TandLA expertise23
Inbound
Cost
Facility Cost Handling
Cost
Inventory
Cost
Delivery Cost
• Volume to support full loads
• Multiple facilities to limit distance, re-shipping
• Scale benefits, dedicated or shared
• Low cost locations
• Amount of inventory
• Increased automation
• Managing staffing to volume
• Intelligent picking logic
• Less complex product profile
• Multiple products per shipment
• Fewer facilities = less inventory
• Tech to manage inventory as pool
• Faster inventory turns
• Cost of capital
• Service level
• Distance from customer
• Volume to support density
• Number of products per shipment
Drivers to Lower eCommerce Supply Chain Costs

Supply chain costs are about 21%-23% of total store-based retail,
or about three times the cost of the stores themselves
*US Retail sales excluding auto and auto parts, assumes 7.7% pre-tax unadjusted operating margin
Source(s): U.S. Census Bureau; NYU Stern Business School industry profitability database; TandLA
expertise and model estimates
24
• Store costs can be 6-10% (or
more) of sales, $243 B - $405 B
Est. US Store Retail Sales
Cost Buildup
Total $4.05 T*
Supply Chain21%-23%
Stores6%-10%
Category % of
Sales
Spend
($B)
Inbound Fgt. 7% $283
Fulfillment 4% $162
Inventory 5% $202
Outbound 3%-5% $121-$202
Returns 2% $81
TOTAL Supply
Chain
21%-23% $850-$930
Est. Retail Store Supply Chain Cost

With eCommerce, supply chain costs are about 25% to 30% of the
total cost
*US eCommerce sales excluding, assumes 5.15% pre-tax unadjusted operating margin
Source(s): U.S. Census Bureau; NYU Stern Business School industry profitability database; TandLA
expertise and model estimates
25
• Assumes a well run supply chain
• If sub-optimal, costs escalate –
fast!
Est. 2015 US eCommerce Sales
Cost Buildup
Total $429 B*
Supply Chain21%-23%
Stores6%-10%
Category % of
Sales
Spend
($B)
Inbound Fgt. 4-6% $17-$26
Fulfillment 5% $21
Inventory 6% $26
Outbound 6%-9% $26-$39
Returns 4.5% $19
TOTAL Supply
Chain
25.5% -
30.5%
$109 -
$131
Est. eCommerce Supply Chain Cost
Supply Chain25%-30%

Outbound costs are critical - eCommerce turns a 40,000 pound
truckload to a store into 10,000 four pounds shipments to homes
• Outbound transportation cost
– Increase significantly in
eCommerce environment
– Parcel cost/pound can be over
10x the cost of LTL and TL to
store
• Dimensional pricing further
increases costs for light
products
Source(s): TandLA expertise and model estimates26
Example Relative Shipping Economics
Per Pound
(by shipment weight)
$1.74
$0.39
$0.18 $0.11$0.03
$0.00
$0.20
$0.40
$0.60
$0.80
$1.00
$1.20
$1.40
$1.60
$1.80
$2.00
2 to 5lbs.
20 to 50lbs.
500 to600 lbs.
2,000 to2,500lbs.
40,000lbs.
Parcel LTL Truckload

Based on some example moves TandLA has modeled, economics
change significantly based upon number of DCs, products per
shipment, and delivery service
• Inbound transportation cost
benefits from local move from
port in 2 DC scenarios
• Handling cost benefits from
multiple products per customer
shipment
• Delivery cost benefits from
multiple products per shipment
• DDU induction rates are much
lower than standard ground
rates
Source(s): UPS and USPS websites, FedEx financial filings, client fulfillment economics, Stern School,
Port of LA/LB; TandLA estimates 27
Estimated Sample Cost/Unit
High Volume Shippers
$0
.60
$
0.6
0
$0
.84
$
0.8
4
$1
.92
$
1.9
2
$1
.92
$2.73
$1
.86
$3.45
$3.63
$6.56
$0 $3 $6 $9 $12
2 Units; 2 DCs; DDUDelivery
2 Units; 2 DCs; GrndDelivery
2 Units; 1 DC; GrndDelivery
1 Unit; 1 DC; GrndDelivery
Inbound Storage & Handling Delivery
$1
0.1
3
$5
.97
$4
.38
$6
.39
Cost Per Unit
Illustrative

Agenda
28
• Market Size and Characteristics
• Key eCommerce Trends
• Potential Implications for Transportation

Full truckload is likely to lose volume to LTL as products flow to
smaller DCs in/near market – Positive for LTL carriers, minimal
impact for TL carriers
29
Truckload LTL
Mark
et
• Built around “old” retailing model
• Likely to lose volume
‒ More fragmented inbound results in smaller
shipment sizes
‒ Less dedicated store delivery
• Truckload is huge, so doesn’t significantly impact market
• Gains from eCommerce
‒ Smaller shipments to more DC’s/
fulfillment centers benefits LTL
‒ Home delivery of larger items (>
parcel) a high growth market
‒ Increase in drop ship could convert
some LTL to parcel (a negative)
• LTL much smaller than TL, and traditionally less focus on retail, so gains could be meaningful to overall LTL industry volumes
Carr
iers
• Highly fragmented, share gains can more than make up difference
• Performance remains based on execution, not market
• Shift to LTL shipments to more locations will be positive
• Some LTL carriers struggling to develop home delivery model – who will be successful at B2C?
Oversized products can come LTL or specialized 3PL

Rail carload is likely unaffected by eCommerce, while rail
intermodal could be marginally hurt by shift to eCommerce
30
Rail Carload Rail Intermodal
Mark
et
• Little to no impact on carload
• Most commodities not B2C
• Likely to lose some volume due to eCommerce
• International intermodal imports likely to be more fragmented –outside of core intermodal lanes
• Increased transloading of ISO to domestic containers and OTR dry vans near ports
• Domestic intermodal likely to be impacted as less volume between major markets more into secondary markets, closer to consumers
• In Canada intermodal less impacted due to concentration of population around cities
Carr
iers • Limited differences
across railroads• US impacted given dispersion of population and shift from large
regional DC’s to smaller in-market DC’s
• Canadian roads impacted less

In the US, the shift to market-based DCs will likely result in volume
in lanes where railroads do not currently offer intermodal service.
Shipments could go direct to consumer
31
Store-Based Example eCommerce Examples
eCommerce-Based
• TL or LTL to in-market fulfillment centers
– DC 10,000 to 30,000 ft2
• Local package delivery from in-market fulfillment centers
eCommerce-Based
• Out of market
fulfillment center
parcel direct to
consumer
Traditional Store-Based
• Intermodal to DFW DC
– DC 500,000 ft2
• Truck from DFW DC to stores in other Texas cities
• Customers shop at stores

Parcel carriers are experiencing volume surges from eCommerce
– this is both good and bad
32
Integrators Alternative Small Package
Mark
et
• Volume increases are good and bad
‒ Significant volume increase
‒ High B2C makes delivery
economics worse
‒ High seasonality and spikes
(how much capacity to invest
in?)
• Love/hate Amazon relationship
• Move in US to put home delivery on USPS
• Small companies focused on eCommerce space designed for B2C
• Typically regional
• Big upside growth
• Often high customer concentration
• Some have high reliance on USPS for delivery
• Typically have lower cost structure than integrators
Carr
iers
• B2C likely to continue to grow for major integrators despite handling lower share of Amazon
• Many different models
• Have to develop long-term sustainability (not Amazon insource)

Amazon.com has been developing its own transportation
capabilities. It is not clear what its “end game” is
33
Integrators Alternative Small Package
• Obtained NVOCC operating license for shipments from China to US
• Added air cargo capacity through relationship with ATSG and DHL
• Acquiring a private truck fleet to transport shipments between facilities
• Developed several programs for final mile delivery
‒ Amazon Flex (Uber-like) model
‒ Use of local delivery companies
‒ Fleet of branded delivery trucks for
final mile delivery
• Amazon could follow a number of potential strategies:
‒ Support Peak: Build guaranteed
capacity to support holiday peak;
other carriers will remain a core
aspect of delivery network
‒ Handle Amazon Business: Take
control of shipments where density
allows it beyond what is required for
holiday peak; Support companies
selling through Amazon marketplace
‒ For-Hire Parcel Carrier: Leverage its
own volume and capabilities to
become full for-hire carrier
In many ways Amazon may be viewed as well on its way to becoming the largest
3PL in the world!

Air Freight carriers may win, but likely only in niches. Barge likely
not impacted
34
Air Freight Barge
Mark
et
• Grounded air freight networks are participating in eCommerceby doing line haul, sort and delivery for larger items (e.g., seasonal charcoal grills)
• Extend two-day network Nationwide for B2C
• Increased de minimis values in 2016 should increase eCommerce imports
• Little to no impact on Most commodities not B2C
Ca
rrie
rs
• Forward Air, other grounded air freight providers?
• Providers to Amazon Air
• No differences across barge lines

eCommerce is a strong positive for warehousing and distribution
35
• eCommerce typically requires more warehousing space than brick and mortar stores
• Demand for new 1M+ sf. warehouses has skyrocketed
– 120 built between 2010 and 2016
– Totaled 141M sf. – average of 1.175M sf. per warehouse
– ~30 more planned or being built
– Most are near large population centers
– Many built by Amazon
• eCommerce now driving demand for regional fulfillment centers
– Shift in demand from a few large national DCs to many regional/local fulfillment centers (think Amazon)
– Needs very closer to population to speed delivery
– Limited land to build new
– Older, smaller warehouses of all shapes and sizes back in strong demand
• Historically abandoned in favor or mega-warehouses
• Now adequate for eCommerce fulfillment -don’t need high ceilings, and typically very close to population

3PLs and technology providers are in a position to manage
complexity and provider better solutions
36
3PLs Tech Providers
Mark
et
• eCommerce adds complexity – good for 3PLs
• Retailers not used to “eaches” may outsource B2C fulfillment
• Requirements of systems and processes very different for B2C
• eCommerce start ups want to scale fast –often done more easily through a 3PL
• Can be economic benefits to shared facilities
• Requires re-think of inbound, too
• Strong positive from having to manage the complexity
• Inventory and order management at the “eaches” level, not case or pallet
• Integration between front end and back end, across partners
• Management across more locations, including stores (OmniChannel)
• Heavy returns component
Pro
vid
ers
• “Traditional” 3PLs frequently are not equipped to do eCommerce
• Targeted eFulfillment providers – many have struggled to-date
• Likely to be some big winners
• Major players and niche providers in the game

1910 First Street
Suite 300
Highland Park, IL
60035
TandLA.net
Lee A. Clair
Managing Partner
312-961-4403
Steven Fox
Principal
773-580-6115