freight broker sample business plan executive summary
TRANSCRIPT
(This plan is only a sample and intended to only provide an outline to write your own business plan. See www.bplan.com)
FREIGHT BROKER SAMPLE BUSINESS PLAN Executive Summary
Silicon Freight Brokers (SFB) is a specialized freight broker service located in Hood River, OR. The company has been set up as an Oregon C
Corporation by the owner, Joe Smith. SFB's objective is to become the premier silicon chip freight broker, increasing their client base by 20% a year.
Freight Brokers and Silicon Chips
The freight broker industry is the middle man of the shipping industry. They are also known as third party transportation providers. Freight brokers
provide a service by linking customers with shippers and trucking companies. Their service is indispensable when moving goods throughout this
country as there are literally hundreds of different shippers offering thousands of different services. The freight brokers make the process of securing a
shipper quite easy with one-stop shopping.
The silicon chip industry is a growing industry that to a large degree has fueled the incredible growth of the late 90's Internet boom. Silicon chips are
the basis of all types of computers as well as hand held devices such as cell phones, PDAs, even watches and some household appliances.
SFB will be occupying a niche within the general freight brokerage market by specializing in the shipment of silicon chips. Silicon chips are very
specific, unusual cargo that requires special attention. The chips have a very narrow range of temperature and humidity parameters that must be
maintained. In addition to these unusual requirements, there are other specific needs that silicon chip companies have. By specializing on silicon chips
as their only cargo, SFB will quickly gain market share and be known as the premier broker for chips.
The industry of chips is comprised of two distinct customers, manufacturers of chips and purchasers of chips. The manufacturers are based in the
USA, however some of them produce in the States while others farm out production overseas and them import them. The chip purchasers are primarily
Intel, IBM, and Motorola.
Management
SFB is led by a seasoned management team of Joe and Amy Smith. Joe has over 10 years of freight experience, working for several different
companies. This work experience has been instrumental in allowing Joe to accurately determine the market need and meet it. SFB has coupled Joe's
in-depth trucking/ freight brokerage knowledge and insight with his wife's expertise in the silicon chip industry. For the last seven years Amy has been
an industry consultant, working quite close with companies such as Intel.
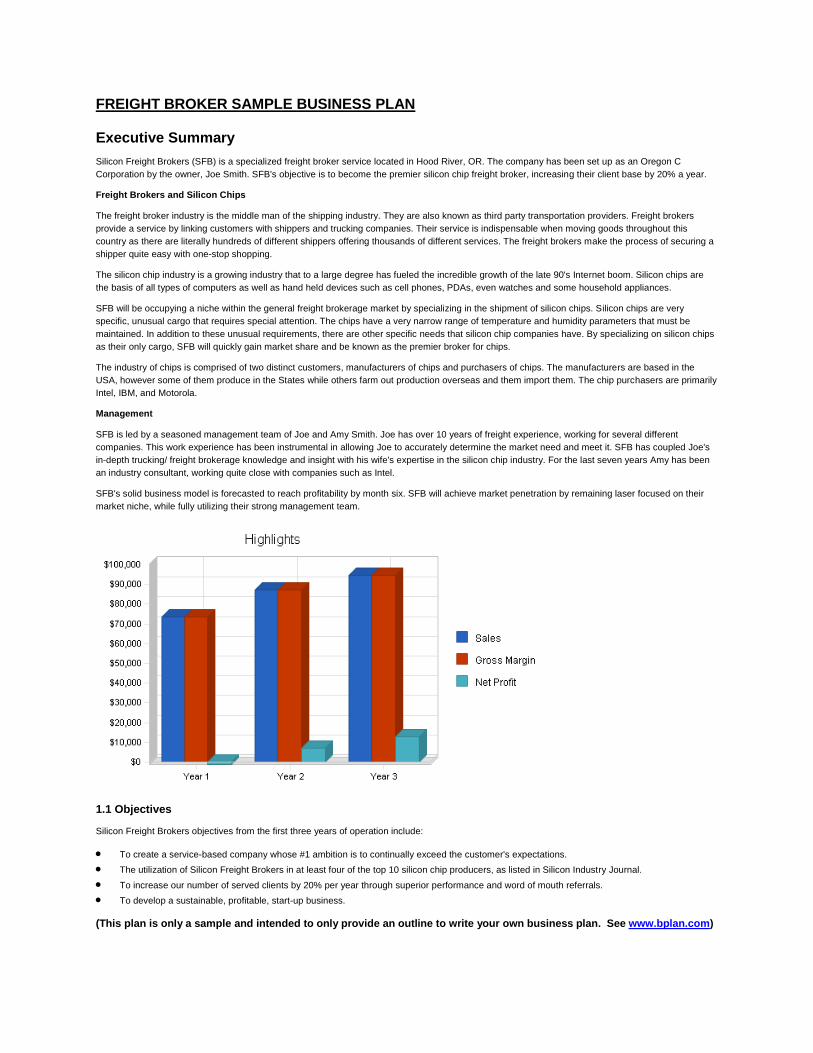
SFB's solid business model is forecasted to reach profitability by month six. SFB will achieve market penetration by remaining laser focused on their
market niche, while fully utilizing their strong management team.
1.1 Objectives
Silicon Freight Brokers objectives from the first three years of operation include:
To create a service-based company whose #1 ambition is to continually exceed the customer's expectations.
The utilization of Silicon Freight Brokers in at least four of the top 10 silicon chip producers, as listed in Silicon Industry Journal.
To increase our number of served clients by 20% per year through superior performance and word of mouth referrals.
To develop a sustainable, profitable, start-up business.

(This plan is only a sample and intended to only provide an outline to write your own business plan. See www.bplan.com)
1.2 Mission
The Silicon Freight Brokers' mission is to provide the customer with the most satisfying shipping experience that they have ever experienced. We exist
to attract and maintain customers. When we adhere to this maxim, everything else will fall into place. Our services will exceed the expectations of our
customers.

(This plan is only a sample and intended to only provide an outline to write your own business plan. See www.bplan.com)
Company Summary
Silicon Freight Brokers, as the name implies, is a freight broker for the silicon chip industry. SFB has two types of customers, buyers and sellers
of silicon chips. SFB is establishing relationships with carriers that specialize in this unique cargo. We will offer our customers the highest level of
service.
2.1 Start-up Summary
Silicon Freight Brokers' (SFB) start-up costs include all the equipment needed for an office. Additionally, there will be legal fees, marketing fees,
accounting fees, trade association dues, and deposit for the lease.
The largest expense for the office is a computer system. The minimum requirements for this system are: 600 mhz Pentium processor, 128 megabytes
RAM, 10 gigabyte hard drive, printer, and CD-RW, Microsoft Office, and an accounting suite. The office will also require a DSL broadband connection,
two land-line phones, fax machine, copier machine, and some office furniture.
The legal fees are for corporate formation, and the generation and review of contracts.
The marketing fees are the costs associated with advertisements in industry journals, brochures, and website visibility generation.
The accounting fees are for the services necessary for the formation of the business, while the majority of the accounting after start up will be done in-
house with an accounting suite on the computer.
Trade association dues and a deposit for the lease of the office are self explanatory.
Start-up
Requirements
Start-up Expenses
Legal $600
Stationery etc. $200
Website Development $500
Consultants $500
Insurance, Licenses $200
Rent $450
Copier, Fax, Phones, Office Furniture $500
Other $500
Total Start-up Expenses $3,450
Start-up Assets
Cash Required $16,350
Other Current Assets $0
Long-term Assets $2,200
Total Assets $18,550
Total Requirements $22,000
Start-up Funding
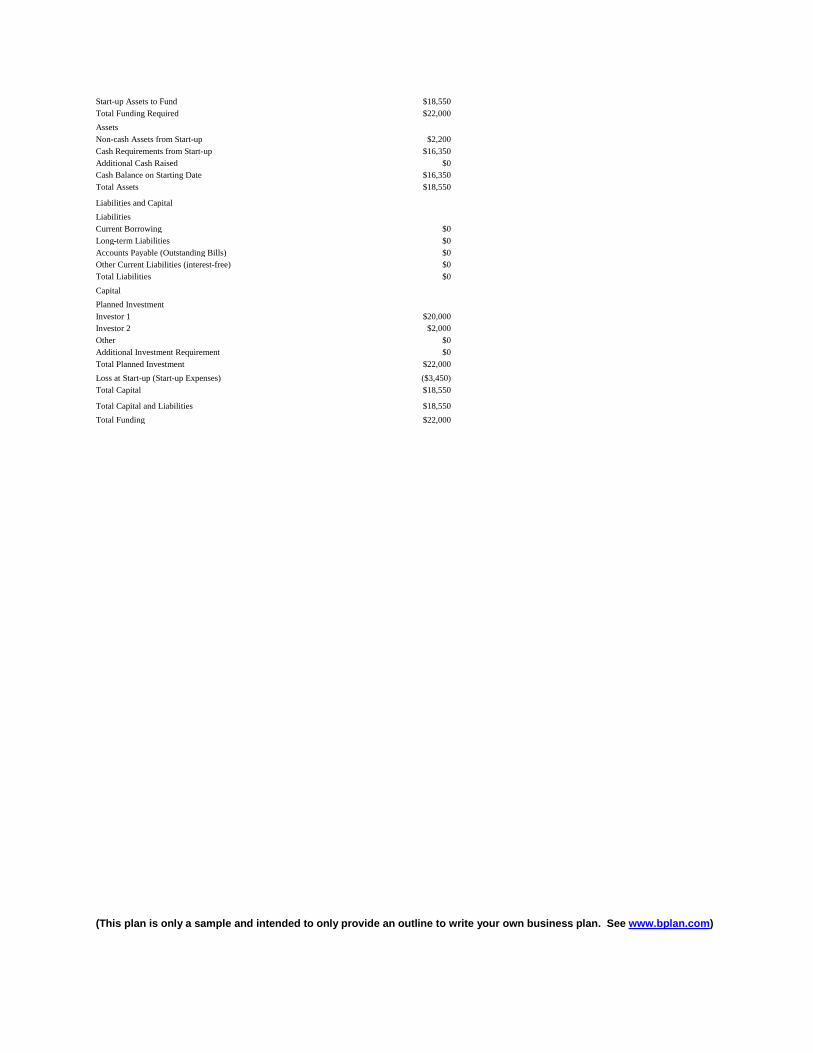
Start-up Expenses to Fund $3,450
(This plan is only a sample and intended to only provide an outline to write your own business plan. See www.bplan.com)
Start-up Assets to Fund $18,550
Total Funding Required $22,000
Assets
Non-cash Assets from Start-up $2,200
Cash Requirements from Start-up $16,350
Additional Cash Raised $0
Cash Balance on Starting Date $16,350
Total Assets $18,550
Liabilities and Capital
Liabilities
Current Borrowing $0
Long-term Liabilities $0
Accounts Payable (Outstanding Bills) $0
Other Current Liabilities (interest-free) $0
Total Liabilities $0
Capital
Planned Investment
Investor 1 $20,000
Investor 2 $2,000
Other $0
Additional Investment Requirement $0
Total Planned Investment $22,000
Loss at Start-up (Start-up Expenses) ($3,450)
Total Capital $18,550
Total Capital and Liabilities $18,550
Total Funding $22,000
(This plan is only a sample and intended to only provide an outline to write your own business plan. See www.bplan.com)
Services
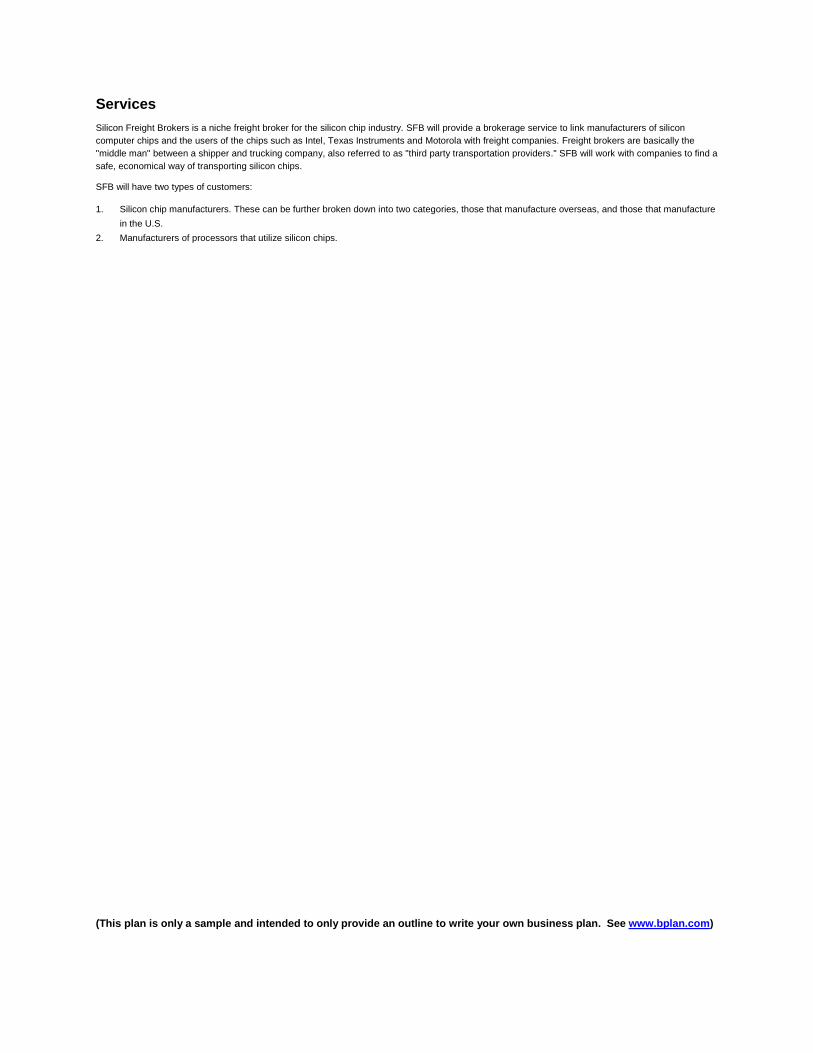
Silicon Freight Brokers is a niche freight broker for the silicon chip industry. SFB will provide a brokerage service to link manufacturers of silicon
computer chips and the users of the chips such as Intel, Texas Instruments and Motorola with freight companies. Freight brokers are basically the
"middle man" between a shipper and trucking company, also referred to as "third party transportation providers." SFB will work with companies to find a
safe, economical way of transporting silicon chips.
SFB will have two types of customers:
1. Silicon chip manufacturers. These can be further broken down into two categories, those that manufacture overseas, and those that manufacture
in the U.S.
2. Manufacturers of processors that utilize silicon chips.

(This plan is only a sample and intended to only provide an outline to write your own business plan. See www.bplan.com)
Market Analysis Summary
Silicon Freight Brokers will be concentrating on the freight brokerage of silicon chips. This is a small, specialized, niche of the general freight brokerage
industry. SFB is concentrating on this space for several reasons:
1. SFB has extensive industry knowledge and insight regarding freight brokerage and silicon chips.
2. The silicon chip industry is continuing to grow as our dependence on technology increases.
3. There is plenty of space for a new specialty freight brokerage company. SFB's extensive knowledge of both the freight and chip industry provides
for valuable insights that can add significant value to SFB's customers.
4.1 Market Segmentation
Silicon Freight Brokers will be focusing solely on the freight brokerage of silicon chips. There are two distinct customers in this niche market,
manufacturers of the chips, and the buyers of the chips who are processor manufacturers.
The manufacturers of the chips can be further broken down into two groups, those that have manufacturing facilities abroad and those in the
U.S. Those that have facilities abroad will generally ship them to a United States ocean port, and from there they travel via truck to a processor
manufacturer. The second group of chip manufacturers, those that have facilities in the U.S., transport chips via truck from their facility to the processor
manufacturer.
Although, in general, silicon chip production has shifted overseas, there are a collection of chip manufacturers still located in the States. The difference
between the two types is not very significant, SFB arranges for the carrier to pick up the chips either off the boat or from the manufacturing facility.
Whether SFB deals with the manufacturer or the seller is a function of the contractual terms that the buyer and seller agree to. Sometimes it is the
manufacturer's obligation to ship, other times it is the buyer's obligation to arrange pick up of the chips.
The chip buyers are manufacturers that use the chips in their processors. The largest processor manufacturers, Intel, Texas Instruments and
Motorola, are located in the U.S.
Market Analysis
Year 1 Year 2 Year 3 Year 4 Year 5
Potential Customers Growth
CAGR
Buyers 7% 340 364 389 416 445 6.96%
Sellers 6% 220 233 247 262 278 6.02%
Other 0% 700 700 700 700 700 0.00%
Total 3.09% 1,260 1,297 1,336 1,378 1,423 3.09%
4.2 Target Market Segment Strategy
Silicon Freight Brokers is concentrating on the silicon chips niche as it is a very specialized, thriving market. By focusing in this market space, SFB will
be able to offer superior service. Shipping of silicon chips requires special types of trucks that are humidity and temperature controlled. SFB will form
intimate relationships with the unique carriers because this relationship will provide SFB with special insight, which will allow SFB to meet any need
a customer might have. Shipping silicon chips has special requirements and SFB will be more familiar with these requirements because it will not be
distracted by offering other services. Specialization also allows SFB to develop close relationships to the limited number of carriers that are equiped to
transport chips. Lastly, the growth of processor manufacturing, which requires silicon chips, has far outpaced most other industries in this country. This
growth rate makes this niche especially attractive.

(This plan is only a sample and intended to only provide an outline to write your own business plan. See www.bplan.com)
In the freight broker market, there are general brokers that offer a wide range of services. There are a few companies that specialize, but no one
is as niche focused as SFB. Because most all of the silicon chips are transported through the U.S. via trucks, there is considerable growth in the
specialty freight brokerage business.
SFB will be marketing our business through several different outlets. The first is the Internet. A lot of the industry has moved to the Web as means for
communication regarding freight quotes. SFB will be developing a website where a customer can go to find out an estimate for freight rates. The
website would key for finding the requisite information like weight, pick up and destination, and SFB would work with our carriers to find them the most
safe and economical solution. Because SFB is only working with silicon chips, the complexity of the number and type of trucks to be used (non-
temperature controlled, etc.) is reduced.
SFB will also be running advertisements in silicon chip trade journals. The ads in the silicon chip journals will provide visibility for SFB to the
manufacturers and buyers of the chips.
4.3 Service Business Analysis
There are many different freight brokerage services. This market is broken up into generalists, handling all types of freight brokerage, and specialists,
handling materials ranging from heavy equipment, oversized loads, perishable commodities, or hazardous materials.
The chip buyers and sellers make the shipping decision based on service (defined by many variables including customer service, speed, safety of the
product) and price. Most business is repeat business, 70-80% according to industry statistics. Once a customer finds someone who they are happy
with, they typically stay with them.

(This plan is only a sample and intended to only provide an outline to write your own business plan. See www.bplan.com)
Market Analysis Summary
Silicon Freight Brokers will be concentrating on the freight brokerage of silicon chips. This is a small, specialized, niche of the general freight brokerage
industry. SFB is concentrating on this space for several reasons:
1. SFB has extensive industry knowledge and insight regarding freight brokerage and silicon chips.
2. The silicon chip industry is continuing to grow as our dependence on technology increases.
3. There is plenty of space for a new specialty freight brokerage company. SFB's extensive knowledge of both the freight and chip industry provides
for valuable insights that can add significant value to SFB's customers.
4.1 Market Segmentation
Silicon Freight Brokers will be focusing solely on the freight brokerage of silicon chips. There are two distinct customers in this niche market,
manufacturers of the chips, and the buyers of the chips who are processor manufacturers.
The manufacturers of the chips can be further broken down into two groups, those that have manufacturing facilities abroad and those in the
U.S. Those that have facilities abroad will generally ship them to a United States ocean port, and from there they travel via truck to a processor
manufacturer. The second group of chip manufacturers, those that have facilities in the U.S., transport chips via truck from their facility to the processor
manufacturer.
Although, in general, silicon chip production has shifted overseas, there are a collection of chip manufacturers still located in the States. The difference
between the two types is not very significant, SFB arranges for the carrier to pick up the chips either off the boat or from the manufacturing facility.
Whether SFB deals with the manufacturer or the seller is a function of the contractual terms that the buyer and seller agree to. Sometimes it is the
manufacturer's obligation to ship, other times it is the buyer's obligation to arrange pick up of the chips.
The chip buyers are manufacturers that use the chips in their processors. The largest processor manufacturers, Intel, Texas Instruments and
Motorola, are located in the U.S.
Market Analysis
Year 1 Year 2 Year 3 Year 4 Year 5
Potential Customers Growth
CAGR
Buyers 7% 340 364 389 416 445 6.96%
Sellers 6% 220 233 247 262 278 6.02%
Other 0% 700 700 700 700 700 0.00%
Total 3.09% 1,260 1,297 1,336 1,378 1,423 3.09%
4.2 Target Market Segment Strategy
Silicon Freight Brokers is concentrating on the silicon chips niche as it is a very specialized, thriving market. By focusing in this market space, SFB will
be able to offer superior service. Shipping of silicon chips requires special types of trucks that are humidity and temperature controlled. SFB will form
intimate relationships with the unique carriers because this relationship will provide SFB with special insight, which will allow SFB to meet any need
a customer might have. Shipping silicon chips has special requirements and SFB will be more familiar with these requirements because it will not be
distracted by offering other services. Specialization also allows SFB to develop close relationships to the limited number of carriers that are equiped to

(This plan is only a sample and intended to only provide an outline to write your own business plan. See www.bplan.com)
transport chips. Lastly, the growth of processor manufacturing, which requires silicon chips, has far outpaced most other industries in this country. This
growth rate makes this niche especially attractive.
In the freight broker market, there are general brokers that offer a wide range of services. There are a few companies that specialize, but no one
is as niche focused as SFB. Because most all of the silicon chips are transported through the U.S. via trucks, there is considerable growth in the
specialty freight brokerage business.
SFB will be marketing our business through several different outlets. The first is the Internet. A lot of the industry has moved to the Web as means for
communication regarding freight quotes. SFB will be developing a website where a customer can go to find out an estimate for freight rates. The
website would key for finding the requisite information like weight, pick up and destination, and SFB would work with our carriers to find them the most
safe and economical solution. Because SFB is only working with silicon chips, the complexity of the number and type of trucks to be used (non-
temperature controlled, etc.) is reduced.
SFB will also be running advertisements in silicon chip trade journals. The ads in the silicon chip journals will provide visibility for SFB to the
manufacturers and buyers of the chips.
4.3 Service Business Analysis
There are many different freight brokerage services. This market is broken up into generalists, handling all types of freight brokerage, and specialists,
handling materials ranging from heavy equipment, oversized loads, perishable commodities, or hazardous materials.
The chip buyers and sellers make the shipping decision based on service (defined by many variables including customer service, speed, safety of the
product) and price. Most business is repeat business, 70-80% according to industry statistics. Once a customer finds someone who they are happy
with, they typically stay with them.
(This plan is only a sample and intended to only provide an outline to write your own business plan. See www.bplan.com)
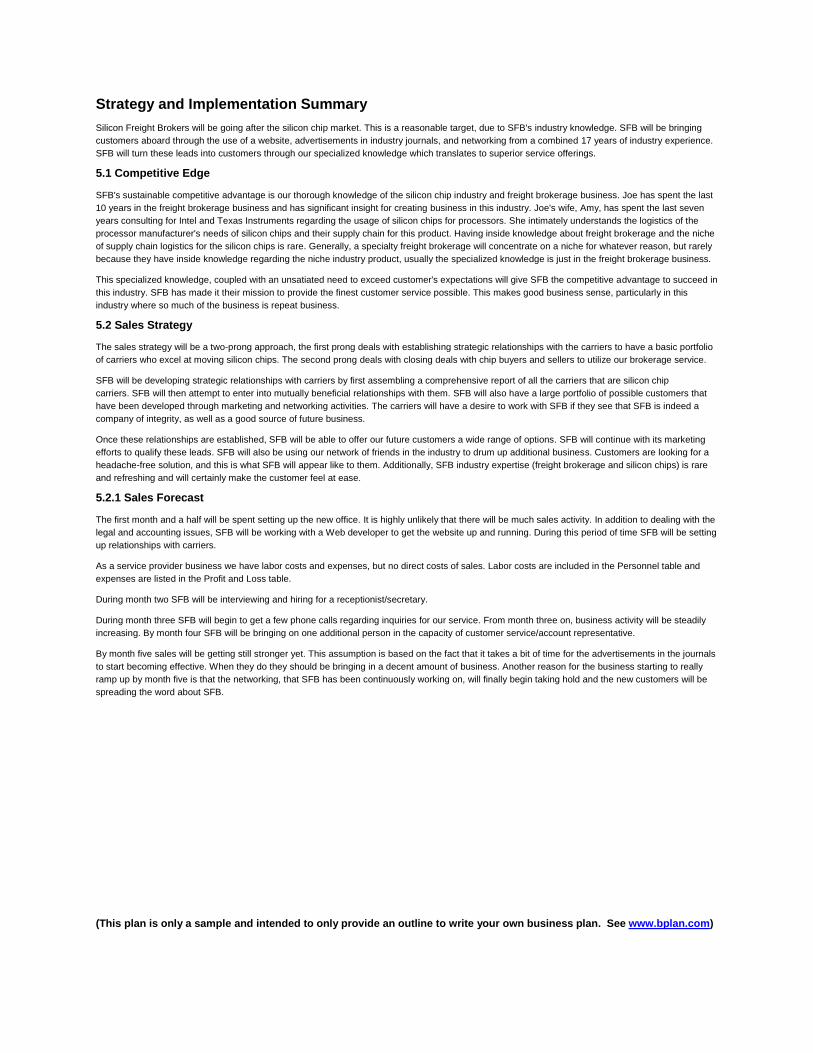
Strategy and Implementation Summary
Silicon Freight Brokers will be going after the silicon chip market. This is a reasonable target, due to SFB's industry knowledge. SFB will be bringing
customers aboard through the use of a website, advertisements in industry journals, and networking from a combined 17 years of industry experience.
SFB will turn these leads into customers through our specialized knowledge which translates to superior service offerings.
5.1 Competitive Edge
SFB's sustainable competitive advantage is our thorough knowledge of the silicon chip industry and freight brokerage business. Joe has spent the last
10 years in the freight brokerage business and has significant insight for creating business in this industry. Joe's wife, Amy, has spent the last seven
years consulting for Intel and Texas Instruments regarding the usage of silicon chips for processors. She intimately understands the logistics of the
processor manufacturer's needs of silicon chips and their supply chain for this product. Having inside knowledge about freight brokerage and the niche
of supply chain logistics for the silicon chips is rare. Generally, a specialty freight brokerage will concentrate on a niche for whatever reason, but rarely
because they have inside knowledge regarding the niche industry product, usually the specialized knowledge is just in the freight brokerage business.
This specialized knowledge, coupled with an unsatiated need to exceed customer's expectations will give SFB the competitive advantage to succeed in
this industry. SFB has made it their mission to provide the finest customer service possible. This makes good business sense, particularly in this
industry where so much of the business is repeat business.
5.2 Sales Strategy
The sales strategy will be a two-prong approach, the first prong deals with establishing strategic relationships with the carriers to have a basic portfolio
of carriers who excel at moving silicon chips. The second prong deals with closing deals with chip buyers and sellers to utilize our brokerage service.
SFB will be developing strategic relationships with carriers by first assembling a comprehensive report of all the carriers that are silicon chip
carriers. SFB will then attempt to enter into mutually beneficial relationships with them. SFB will also have a large portfolio of possible customers that
have been developed through marketing and networking activities. The carriers will have a desire to work with SFB if they see that SFB is indeed a
company of integrity, as well as a good source of future business.
Once these relationships are established, SFB will be able to offer our future customers a wide range of options. SFB will continue with its marketing
efforts to qualify these leads. SFB will also be using our network of friends in the industry to drum up additional business. Customers are looking for a
headache-free solution, and this is what SFB will appear like to them. Additionally, SFB industry expertise (freight brokerage and silicon chips) is rare
and refreshing and will certainly make the customer feel at ease.
5.2.1 Sales Forecast
The first month and a half will be spent setting up the new office. It is highly unlikely that there will be much sales activity. In addition to dealing with the
legal and accounting issues, SFB will be working with a Web developer to get the website up and running. During this period of time SFB will be setting
up relationships with carriers.
As a service provider business we have labor costs and expenses, but no direct costs of sales. Labor costs are included in the Personnel table and
expenses are listed in the Profit and Loss table.
During month two SFB will be interviewing and hiring for a receptionist/secretary.
During month three SFB will begin to get a few phone calls regarding inquiries for our service. From month three on, business activity will be steadily
increasing. By month four SFB will be bringing on one additional person in the capacity of customer service/account representative.
By month five sales will be getting still stronger yet. This assumption is based on the fact that it takes a bit of time for the advertisements in the journals
to start becoming effective. When they do they should be bringing in a decent amount of business. Another reason for the business starting to really
ramp up by month five is that the networking, that SFB has been continuously working on, will finally begin taking hold and the new customers will be
spreading the word about SFB.

(This plan is only a sample and intended to only provide an outline to write your own business plan. See www.bplan.com)
Sales Forecast
Year 1 Year 2 Year 3
Sales
Buyers $55,172 $64,587 $69,854
Sellers $18,560 $22,587 $24,854
Total Sales $73,732 $87,174 $94,708
Direct Cost of Sales Year 1 Year 2 Year 3
Buyers $0 $0 $0
Sellers $0 $0 $0
Subtotal Direct Cost of Sales $0 $0 $0
5.3 Milestones
Silicon Freight Brokers will have several milestones early on:
1. Business plan completion. This will be done the first month.
2. Office Set-up. This will be done the first month.
3. Have the website up and running by month two.
4. Hire a third employee by month four.

(This plan is only a sample and intended to only provide an outline to write your own business plan. See www.bplan.com)
Milestones
Milestone Start Date End Date Budget Manager Department
Business Plan Completion 1/1/2001 1/1/2001 $0 Joe Marketing
Office Set-up 3/1/1999 4/1/1999 $0 Joe Department
Website Creation 3/1/1999 2/2/2002 $0 Joe Department
Hiring Third Employee 3/1/1999 4/1/2002 $0 Joe Department
Totals
$0

(This plan is only a sample and intended to only provide an outline to write your own business plan. See www.bplan.com)
Management Summary
Silicon Freight Brokers is a C Corporation with Joe Smith owning 100% of the stock.
Joe, the founder and sole stockholder has a degree in mathematics from Notre Dame University. While in college, Joe worked in a travel agency,
learning the nuances of a service-based organization that works on commission. After college, Joe joined Speedy Freight Lines beginning in the
accounts department. Recognizing the talent that they had with Joe, Speedy began to move him through many different departments to familiarize him
with the entire company. Joe rose to manager of broker accounts and held the position for two years. Joe spent a total of eight years at Speedy. During
2000, Speedy brought a new CEO on board and Joe felt that the company was now being guided in the wrong direction so he left to start his own
company.
Joe will be assisted on a consulting basis by his wife, Amy, who has spent the last seven years as a consultant for Intel and Texas Instruments (among
others). Amy's areas of expertise include processor usage of silicon chips.
The combination of Joe's knowledge of the shipping industry and Amy's knowledge of silicon chip usage has given SFB the power to succeed in this
niche freight brokerage market.
6.1 Personnel Plan
The staff will consist of Joe working full time for SFB as the capacity of owner and licensed broker.
SFB will be hiring additional employees for a secretary/receptionist position and then a customer service/account representative. These positions will
be paid an hourly wage and will generally be working full time. SFB will bring these two positions on at staggered times.
SFB will also be using Joe's wife, Amy, as an industry consultant who will be generally paid on a monthly invoice.
Personnel Plan
Year 1 Year 2 Year 3
President/Broker $24,000 $24,000 $24,000
Secretary $15,840 $15,840 $15,840
Customer Service/Account Representitve $12,960 $15,840 $15,840
Other $0 $0 $0
Total People 3 3 3
Total Payroll $52,800 $55,680 $55,680
(This plan is only a sample and intended to only provide an outline to write your own business plan. See www.bplan.com)
Financial Plan
The following subtopics will provide more financial information.
7.1 Important Assumptions
See following table for general assumptions.
General Assumptions
Year 1 Year 2 Year 3
Plan Month 1 2 3
Current Interest Rate 10.00% 10.00% 10.00%
Long-term Interest Rate 10.00% 10.00% 10.00%
Tax Rate 25.42% 25.00% 25.42%
Other 0 0 0
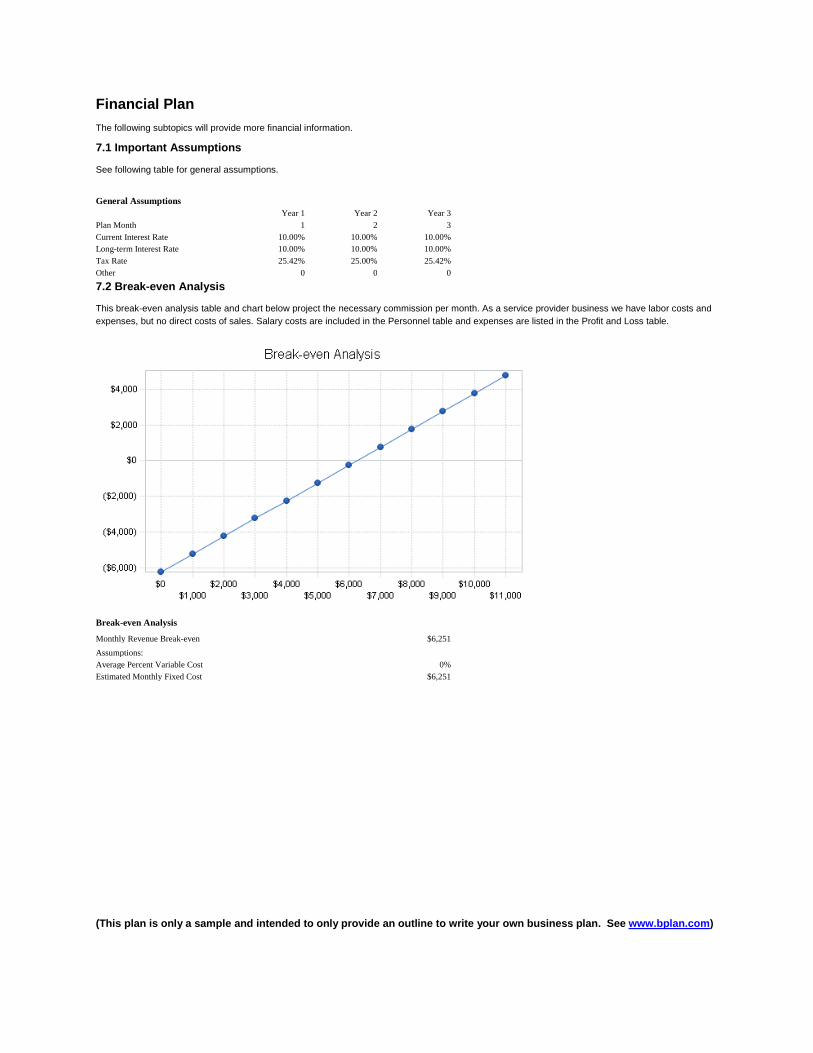
7.2 Break-even Analysis
This break-even analysis table and chart below project the necessary commission per month. As a service provider business we have labor costs and
expenses, but no direct costs of sales. Salary costs are included in the Personnel table and expenses are listed in the Profit and Loss table.
Break-even Analysis
Monthly Revenue Break-even $6,251
Assumptions:
Average Percent Variable Cost 0%
Estimated Monthly Fixed Cost $6,251

(This plan is only a sample and intended to only provide an outline to write your own business plan. See www.bplan.com)
7.3 Projected Profit and Loss
The following table presents the projected profit and loss.

(This plan is only a sample and intended to only provide an outline to write your own business plan. See www.bplan.com)
Pro Forma Profit and Loss
Year 1 Year 2 Year 3
Sales $73,732 $87,174 $94,708
Direct Cost of Sales $0 $0 $0
Other $0 $0 $0
Total Cost of Sales $0 $0 $0
Gross Margin $73,732 $87,174 $94,708
Gross Margin % 100.00% 100.00% 100.00%
Expenses
Payroll $52,800 $55,680 $55,680
Sales and Marketing and Other Expenses $4,800 $4,250 $4,250
Depreciation $672 $672 $672
Website Maintenance $780 $780 $780
Utilities, DSL $1,440 $1,440 $1,440
Insurance, Licenses $1,200 $1,200 $1,200
Rent $5,400 $5,400 $5,400
Payroll Taxes $7,920 $8,352 $8,352
Other $0 $0 $0
Total Operating Expenses $75,012 $77,774 $77,774
Profit Before Interest and Taxes ($1,280) $9,400 $16,934
EBITDA ($608) $10,072 $17,606
Interest Expense $0 $0 $0
(This plan is only a sample and intended to only provide an outline to write your own business plan. See www.bplan.com)
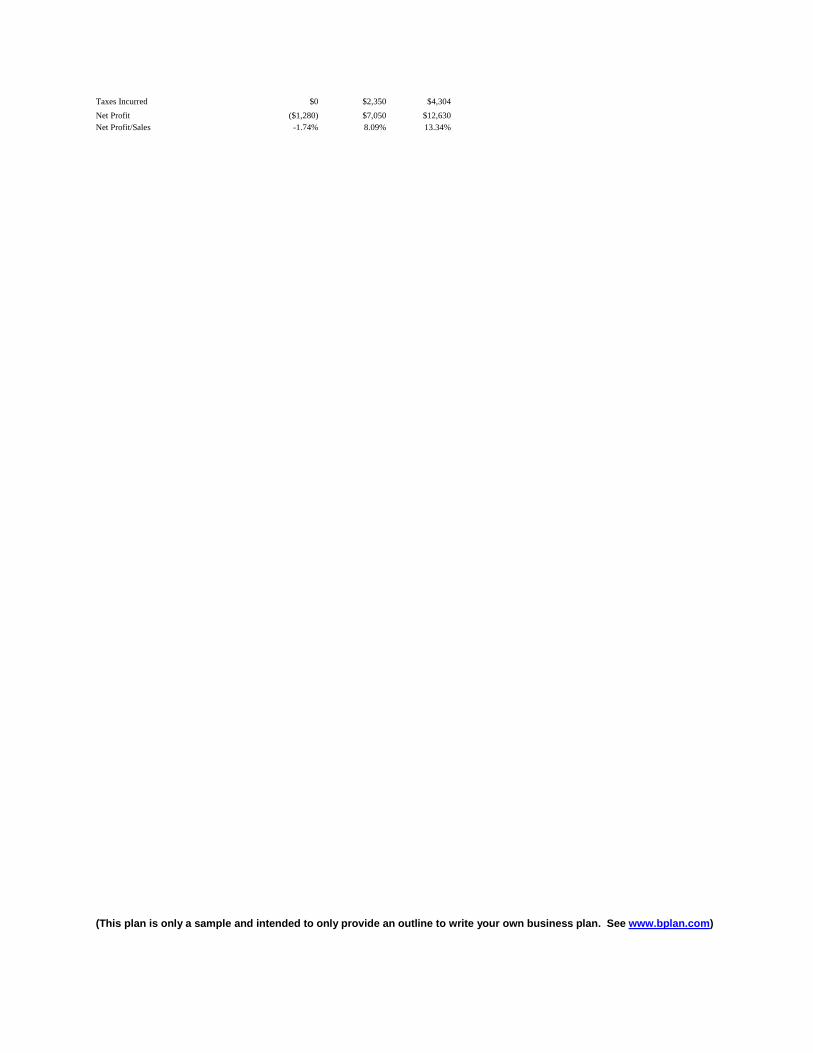
Taxes Incurred $0 $2,350 $4,304
Net Profit ($1,280) $7,050 $12,630
Net Profit/Sales -1.74% 8.09% 13.34%

(This plan is only a sample and intended to only provide an outline to write your own business plan. See www.bplan.com)
7.4 Projected Cash Flow
The following table shows our projected cash flow.
Pro Forma Cash Flow
Year 1 Year 2 Year 3
Cash Received
Cash from Operations
Cash Sales $18,433 $21,794 $23,677
Cash from Receivables $42,219 $62,996 $69,694
Subtotal Cash from Operations $60,652 $84,789 $93,371
Additional Cash Received
Sales Tax, VAT, HST/GST Received $0 $0 $0
New Current Borrowing $0 $0 $0
New Other Liabilities (interest-free) $0 $0 $0
New Long-term Liabilities $0 $0 $0
Sales of Other Current Assets $0 $0 $0
Sales of Long-term Assets $0 $0 $0
New Investment Received $4,000 $0 $0
Subtotal Cash Received $64,652 $84,789 $93,371
Expenditures Year 1 Year 2 Year 3
Expenditures from Operations
Cash Spending $52,800 $55,680 $55,680
Bill Payments $19,784 $23,575 $25,565
Subtotal Spent on Operations $72,584 $79,255 $81,245
Additional Cash Spent
Sales Tax, VAT, HST/GST Paid Out $0 $0 $0
Principal Repayment of Current Borrowing $0 $0 $0
Other Liabilities Principal Repayment $0 $0 $0
Long-term Liabilities Principal Repayment $0 $0 $0
Purchase Other Current Assets $0 $0 $0
Purchase Long-term Assets $0 $0 $0
Dividends $0 $0 $0
Subtotal Cash Spent $72,584 $79,255 $81,245
Net Cash Flow ($7,932) $5,535 $12,126
Cash Balance $8,418 $13,953 $26,079

(This plan is only a sample and intended to only provide an outline to write your own business plan. See www.bplan.com)
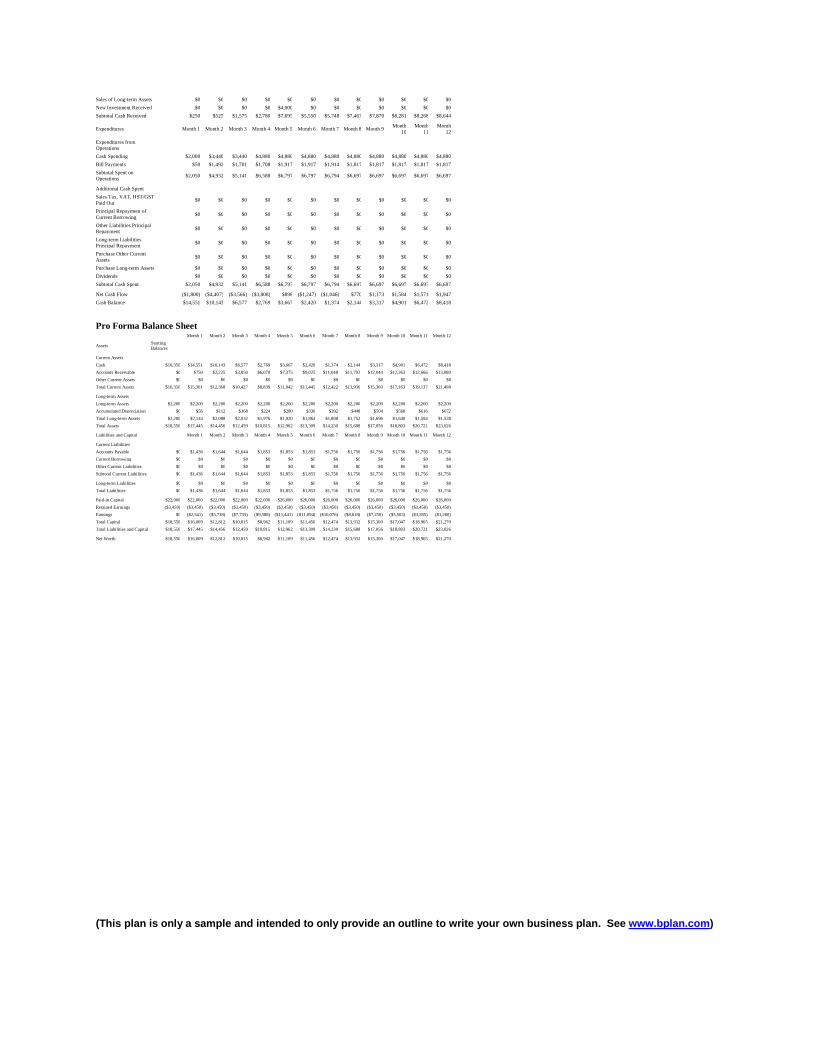
7.5 Projected Balance Sheet
The following table shows the projected balance sheet.
Pro Forma Balance Sheet
Year 1 Year 2 Year 3
Assets
Current Assets
Cash $8,418 $13,953 $26,079
Accounts Receivable $13,080 $15,465 $16,801
Other Current Assets $0 $0 $0
Total Current Assets $21,498 $29,418 $42,880
Long-term Assets
Long-term Assets $2,200 $2,200 $2,200
Accumulated Depreciation $672 $1,344 $2,016
Total Long-term Assets $1,528 $856 $184
Total Assets $23,026 $30,274 $43,064
Liabilities and Capital Year 1 Year 2 Year 3
Current Liabilities
Accounts Payable $1,756 $1,954 $2,114
Current Borrowing $0 $0 $0
Other Current Liabilities $0 $0 $0
Subtotal Current Liabilities $1,756 $1,954 $2,114
Long-term Liabilities $0 $0 $0
Total Liabilities $1,756 $1,954 $2,114
Paid-in Capital $26,000 $26,000 $26,000
Retained Earnings ($3,450) ($4,730) $2,320
Earnings ($1,280) $7,050 $12,630
Total Capital $21,270 $28,320 $40,950
Total Liabilities and Capital $23,026 $30,274 $43,064
Net Worth $21,270 $28,320 $40,950
7.6 Business Ratios
The following table contains important business ratios from the freight transportation arrangement industry, as determined by the Standard Industry
Classification (SIC) Index code 4731.
Ratio Analysis
Year 1 Year 2 Year 3 Industry Profile
Sales Growth 0.00% 18.23% 8.64% 4.00%
Percent of Total Assets
Accounts Receivable 56.80% 51.08% 39.01% 27.00%
Other Current Assets 0.00% 0.00% 0.00% 37.60%
Total Current Assets 93.36% 97.17% 99.57% 65.20%
Long-term Assets 6.64% 2.83% 0.43% 34.80%
Total Assets 100.00% 100.00% 100.00% 100.00%
Current Liabilities 7.63% 6.45% 4.91% 36.10%
Long-term Liabilities 0.00% 0.00% 0.00% 16.30%
Total Liabilities 7.63% 6.45% 4.91% 52.40%
Net Worth 92.37% 93.55% 95.09% 47.60%
Percent of Sales
Sales 100.00% 100.00% 100.00% 100.00%
Gross Margin 100.00% 100.00% 100.00% 33.90%
Selling, General & Administrative
Expenses 101.74% 91.91% 86.59% 24.00%
Advertising Expenses 1.63% 0.75% 0.69% 0.50%
Profit Before Interest and Taxes -1.74% 10.78% 17.88% 1.20%
Main Ratios
Current 12.24 15.06 20.28 1.59
Quick 12.24 15.06 20.28 1.32
Total Debt to Total Assets 7.63% 6.45% 4.91% 52.40%
Pre-tax Return on Net Worth -6.02% 33.19% 41.35% 2.90%
Pre-tax Return on Assets -5.56% 31.05% 39.32% 6.10%
Additional Ratios Year 1 Year 2 Year 3
Net Profit Margin -1.74% 8.09% 13.34% n.a
Return on Equity -6.02% 24.89% 30.84% n.a

(This plan is only a sample and intended to only provide an outline to write your own business plan. See www.bplan.com)
Activity Ratios
Accounts Receivable Turnover 4.23 4.23 4.23 n.a
Collection Days 56 80 83 n.a
Accounts Payable Turnover 12.26 12.17 12.17 n.a
Payment Days 27 28 29 n.a
Total Asset Turnover 3.20 2.88 2.20 n.a
Debt Ratios
Debt to Net Worth 0.08 0.07 0.05 n.a
Current Liab. to Liab. 1.00 1.00 1.00 n.a
Liquidity Ratios
Net Working Capital $19,742 $27,464 $40,766 n.a
Interest Coverage 0.00 0.00 0.00 n.a
Additional Ratios
Assets to Sales 0.31 0.35 0.45 n.a
Current Debt/Total Assets 8% 6% 5% n.a
Acid Test 4.79 7.14 12.33 n.a
Sales/Net Worth 3.47 3.08 2.31 n.a
Dividend Payout 0.00 0.00 0.00 n.a

(This plan is only a sample and intended to only provide an outline to write your own business plan. See www.bplan.com)
Appendix
Sales Forecast
Month
1 Month
2 Month
3 Month
4 Month
5 Month
6 Month
7 Month
8 Month
9 Month
10 Month
11 Month
12
Sales
Buyers 0% $750 $1,400 $2,100 $3,500 $4,100 $5,400 $5,874 $6,212 $6,321 $6,400 $6,457 $6,658
Sellers 0% $250 $600 $1,100 $1,500 $900 $1,800 $1,897 $1,999 $1,800 $2,100 $2,214 $2,400
Total Sales
$1,000 $2,000 $3,200 $5,000 $5,000 $7,200 $7,771 $8,211 $8,121 $8,500 $8,671 $9,058
Direct Cost of Sales
Month
1
Month
2
Month
3
Month
4
Month
5
Month
6
Month
7
Month
8
Month
9
Month
10
Month
11
Month
12
Buyers
$0 $0 $0 $0 $0 $0 $0 $0 $0 $0 $0 $0
Sellers
$0 $0 $0 $0 $0 $0 $0 $0 $0 $0 $0 $0
Subtotal Direct Cost
of Sales $0 $0 $0 $0 $0 $0 $0 $0 $0 $0 $0 $0
Personnel Plan
Month
1
Month
2
Month
3
Month
4
Month
5
Month
6
Month
7
Month
8
Month
9
Month
10
Month
11
Month
12
President/Broker 0% $2,000 $2,000 $2,000 $2,000 $2,000 $2,000 $2,000 $2,000 $2,000 $2,000 $2,000 $2,000
Secretary 0% $0 $1,440 $1,440 $1,440 $1,440 $1,440 $1,440 $1,440 $1,440 $1,440 $1,440 $1,440
Customer
Service/Account
Representitve
0% $0 $0 $0 $1,440 $1,440 $1,440 $1,440 $1,440 $1,440 $1,440 $1,440 $1,440
Other 0% $0 $0 $0 $0 $0 $0 $0 $0 $0 $0 $0 $0
Total People
1 2 2 3 3 3 3 3 3 3 3 3
Total Payroll
$2,000 $3,440 $3,440 $4,880 $4,880 $4,880 $4,880 $4,880 $4,880 $4,880 $4,880 $4,880
General Assumptions
Month 1 Month 2 Month 3 Month 4 Month 5 Month 6 Month 7 Month 8 Month 9
Month
10
Month
11
Month
12
Plan Month
1 2 3 4 5 6 7 8 9 10 11 12
Current
Interest Rate 10.00% 10.00% 10.00% 10.00% 10.00% 10.00% 10.00% 10.00% 10.00% 10.00% 10.00% 10.00%
Long-term
Interest Rate 10.00% 10.00% 10.00% 10.00% 10.00% 10.00% 10.00% 10.00% 10.00% 10.00% 10.00% 10.00%
Tax Rate
30.00% 25.00% 25.00% 25.00% 25.00% 25.00% 25.00% 25.00% 25.00% 25.00% 25.00% 25.00%
Other
0 0 0 0 0 0 0 0 0 0 0 0
Pro Forma Profit and Loss
Month 1 Month 2 Month 3 Month 4 Month 5 Month 6 Month 7 Month 8 Month 9 Month 10 Month 11 Month 12
Sales
$1,000 $2,000 $3,200 $5,000 $5,000 $7,200 $7,771 $8,211 $8,121 $8,500 $8,671 $9,058
Direct Cost of
Sales $0 $0 $0 $0 $0 $0 $0 $0 $0 $0 $0 $0
Other
$0 $0 $0 $0 $0 $0 $0 $0 $0 $0 $0 $0
Total Cost of
Sales $0 $0 $0 $0 $0 $0 $0 $0 $0 $0 $0 $0
Gross Margin
$1,000 $2,000 $3,200 $5,000 $5,000 $7,200 $7,771 $8,211 $8,121 $8,500 $8,671 $9,058
Gross Margin %
100.00% 100.00% 100.00% 100.00% 100.00% 100.00% 100.00% 100.00% 100.00% 100.00% 100.00% 100.00%
Expenses
Payroll
$2,000 $3,440 $3,440 $4,880 $4,880 $4,880 $4,880 $4,880 $4,880 $4,880 $4,880 $4,880
Sales and
Marketing and
Other Expenses
$450 $450 $450 $450 $450 $450 $350 $350 $350 $350 $350 $350
Depreciation
$56 $56 $56 $56 $56 $56 $56 $56 $56 $56 $56 $56
Website
Maintenance $65 $65 $65 $65 $65 $65 $65 $65 $65 $65 $65 $65
Utilities, DSL
$120 $120 $120 $120 $120 $120 $120 $120 $120 $120 $120 $120
Insurance,
Licenses $100 $100 $100 $100 $100 $100 $100 $100 $100 $100 $100 $100
Rent
$450 $450 $450 $450 $450 $450 $450 $450 $450 $450 $450 $450
Payroll Taxes 15% $300 $516 $516 $732 $732 $732 $732 $732 $732 $732 $732 $732
Other
$0 $0 $0 $0 $0 $0 $0 $0 $0 $0 $0 $0
Total Operating
Expenses $3,541 $5,197 $5,197 $6,853 $6,853 $6,853 $6,753 $6,753 $6,753 $6,753 $6,753 $6,753
Profit Before
Interest and Taxes ($2,541) ($3,197) ($1,997) ($1,853) ($1,853) $347 $1,018 $1,458 $1,368 $1,747 $1,918 $2,305
EBITDA
($2,485) ($3,141) ($1,941) ($1,797) ($1,797) $403 $1,074 $1,514 $1,424 $1,803 $1,974 $2,361
Interest Expense
$0 $0 $0 $0 $0 $0 $0 $0 $0 $0 $0 $0
Taxes Incurred
$0 $0 $0 $0 $0 $0 $0 $0 $0 $0 $0 $0
Net Profit
($2,541) ($3,197) ($1,997) ($1,853) ($1,853) $347 $1,018 $1,458 $1,368 $1,747 $1,918 $2,305
Net Profit/Sales
-254.10% -159.85% -62.41% -37.06% -37.06% 4.82% 13.10% 17.76% 16.85% 20.55% 22.12% 25.45%
Pro Forma Cash Flow
Month 1 Month 2 Month 3 Month 4 Month 5 Month 6 Month 7 Month 8 Month 9
Month
10
Month
11
Month
12
Cash Received
Cash from Operations
Cash Sales
$250 $500 $800 $1,250 $1,250 $1,800 $1,943 $2,053 $2,030 $2,125 $2,168 $2,265
Cash from Receivables
$0 $25 $775 $1,530 $2,445 $3,750 $3,805 $5,414 $5,839 $6,156 $6,100 $6,379
Subtotal Cash from
Operations $250 $525 $1,575 $2,780 $3,695 $5,550 $5,748 $7,467 $7,870 $8,281 $8,268 $8,644
Additional Cash Received
Sales Tax, VAT, HST/GST
Received 0.00% $0 $0 $0 $0 $0 $0 $0 $0 $0 $0 $0 $0
New Current Borrowing
$0 $0 $0 $0 $0 $0 $0 $0 $0 $0 $0 $0
New Other Liabilities
(interest-free) $0 $0 $0 $0 $0 $0 $0 $0 $0 $0 $0 $0
New Long-term Liabilities
$0 $0 $0 $0 $0 $0 $0 $0 $0 $0 $0 $0
Sales of Other Current
Assets $0 $0 $0 $0 $0 $0 $0 $0 $0 $0 $0 $0
(This plan is only a sample and intended to only provide an outline to write your own business plan. See www.bplan.com)
Sales of Long-term Assets
$0 $0 $0 $0 $0 $0 $0 $0 $0 $0 $0 $0
New Investment Received
$0 $0 $0 $0 $4,000 $0 $0 $0 $0 $0 $0 $0
Subtotal Cash Received
$250 $525 $1,575 $2,780 $7,695 $5,550 $5,748 $7,467 $7,870 $8,281 $8,268 $8,644
Expenditures
Month 1 Month 2 Month 3 Month 4 Month 5 Month 6 Month 7 Month 8 Month 9 Month
10
Month
11
Month
12
Expenditures from
Operations
Cash Spending
$2,000 $3,440 $3,440 $4,880 $4,880 $4,880 $4,880 $4,880 $4,880 $4,880 $4,880 $4,880
Bill Payments
$50 $1,492 $1,701 $1,708 $1,917 $1,917 $1,914 $1,817 $1,817 $1,817 $1,817 $1,817
Subtotal Spent on
Operations $2,050 $4,932 $5,141 $6,588 $6,797 $6,797 $6,794 $6,697 $6,697 $6,697 $6,697 $6,697
Additional Cash Spent
Sales Tax, VAT, HST/GST
Paid Out $0 $0 $0 $0 $0 $0 $0 $0 $0 $0 $0 $0
Principal Repayment of
Current Borrowing $0 $0 $0 $0 $0 $0 $0 $0 $0 $0 $0 $0
Other Liabilities Principal
Repayment $0 $0 $0 $0 $0 $0 $0 $0 $0 $0 $0 $0
Long-term Liabilities
Principal Repayment $0 $0 $0 $0 $0 $0 $0 $0 $0 $0 $0 $0
Purchase Other Current
Assets $0 $0 $0 $0 $0 $0 $0 $0 $0 $0 $0 $0
Purchase Long-term Assets
$0 $0 $0 $0 $0 $0 $0 $0 $0 $0 $0 $0
Dividends
$0 $0 $0 $0 $0 $0 $0 $0 $0 $0 $0 $0
Subtotal Cash Spent
$2,050 $4,932 $5,141 $6,588 $6,797 $6,797 $6,794 $6,697 $6,697 $6,697 $6,697 $6,697
Net Cash Flow
($1,800) ($4,407) ($3,566) ($3,808) $898 ($1,247) ($1,046) $770 $1,173 $1,584 $1,571 $1,947
Cash Balance
$14,551 $10,143 $6,577 $2,769 $3,667 $2,420 $1,374 $2,144 $3,317 $4,901 $6,472 $8,418
Pro Forma Balance Sheet
Month 1 Month 2 Month 3 Month 4 Month 5 Month 6 Month 7 Month 8 Month 9 Month 10 Month 11 Month 12
Assets Starting
Balances
Current Assets
Cash $16,350 $14,551 $10,143 $6,577 $2,769 $3,667 $2,420 $1,374 $2,144 $3,317 $4,901 $6,472 $8,418
Accounts Receivable $0 $750 $2,225 $3,850 $6,070 $7,375 $9,025 $11,048 $11,792 $12,044 $12,263 $12,666 $13,080
Other Current Assets $0 $0 $0 $0 $0 $0 $0 $0 $0 $0 $0 $0 $0
Total Current Assets $16,350 $15,301 $12,368 $10,427 $8,839 $11,042 $11,445 $12,422 $13,936 $15,360 $17,163 $19,137 $21,498
Long-term Assets
Long-term Assets $2,200 $2,200 $2,200 $2,200 $2,200 $2,200 $2,200 $2,200 $2,200 $2,200 $2,200 $2,200 $2,200
Accumulated Depreciation $0 $56 $112 $168 $224 $280 $336 $392 $448 $504 $560 $616 $672
Total Long-term Assets $2,200 $2,144 $2,088 $2,032 $1,976 $1,920 $1,864 $1,808 $1,752 $1,696 $1,640 $1,584 $1,528
Total Assets $18,550 $17,445 $14,456 $12,459 $10,815 $12,962 $13,309 $14,230 $15,688 $17,056 $18,803 $20,721 $23,026
Liabilities and Capital
Month 1 Month 2 Month 3 Month 4 Month 5 Month 6 Month 7 Month 8 Month 9 Month 10 Month 11 Month 12
Current Liabilities
Accounts Payable $0 $1,436 $1,644 $1,644 $1,853 $1,853 $1,853 $1,756 $1,756 $1,756 $1,756 $1,756 $1,756
Current Borrowing $0 $0 $0 $0 $0 $0 $0 $0 $0 $0 $0 $0 $0
Other Current Liabilities $0 $0 $0 $0 $0 $0 $0 $0 $0 $0 $0 $0 $0
Subtotal Current Liabilities $0 $1,436 $1,644 $1,644 $1,853 $1,853 $1,853 $1,756 $1,756 $1,756 $1,756 $1,756 $1,756
Long-term Liabilities $0 $0 $0 $0 $0 $0 $0 $0 $0 $0 $0 $0 $0
Total Liabilities $0 $1,436 $1,644 $1,644 $1,853 $1,853 $1,853 $1,756 $1,756 $1,756 $1,756 $1,756 $1,756
Paid-in Capital $22,000 $22,000 $22,000 $22,000 $22,000 $26,000 $26,000 $26,000 $26,000 $26,000 $26,000 $26,000 $26,000
Retained Earnings ($3,450) ($3,450) ($3,450) ($3,450) ($3,450) ($3,450) ($3,450) ($3,450) ($3,450) ($3,450) ($3,450) ($3,450) ($3,450)
Earnings $0 ($2,541) ($5,738) ($7,735) ($9,588) ($11,441) ($11,094) ($10,076) ($8,618) ($7,250) ($5,503) ($3,585) ($1,280)
Total Capital $18,550 $16,009 $12,812 $10,815 $8,962 $11,109 $11,456 $12,474 $13,932 $15,300 $17,047 $18,965 $21,270
Total Liabilities and Capital $18,550 $17,445 $14,456 $12,459 $10,815 $12,962 $13,309 $14,230 $15,688 $17,056 $18,803 $20,721 $23,026
Net Worth $18,550 $16,009 $12,812 $10,815 $8,962 $11,109 $11,456 $12,474 $13,932 $15,300 $17,047 $18,965 $21,270