free-radical polymerization of acid-containing deep
TRANSCRIPT

Louisiana State UniversityLSU Digital Commons
LSU Doctoral Dissertations Graduate School
6-19-2018
Free-Radical Polymerization of Acid-ContainingDeep Eutectic SolventsKylee FazendeLouisiana State University and Agricultural and Mechanical College, [email protected]
Follow this and additional works at: https://digitalcommons.lsu.edu/gradschool_dissertations
Part of the Materials Chemistry Commons, and the Polymer Chemistry Commons
This Dissertation is brought to you for free and open access by the Graduate School at LSU Digital Commons. It has been accepted for inclusion inLSU Doctoral Dissertations by an authorized graduate school editor of LSU Digital Commons. For more information, please [email protected].
Recommended CitationFazende, Kylee, "Free-Radical Polymerization of Acid-Containing Deep Eutectic Solvents" (2018). LSU Doctoral Dissertations. 4630.https://digitalcommons.lsu.edu/gradschool_dissertations/4630

FREE-RADICAL POLYMERIZATION OF ACID-CONTAINING DEEP EUTECTIC SOLVENTS
A Dissertation
Submitted to the Graduate Faculty of the Louisiana State University and
Agricultural and Mechanical College in partial fulfillment of the
requirements for the degree of Doctor of Philosophy
in
The Department of Chemistry
by Kylee Fazende
B.S., University of Southern Mississippi, 2013 August 2018

ii
ACKNOWLEDGEMENTS
I would like to thank my family for their never ending love and encouragement thorough
out my academic career.
I would like to thank my advisor Dr. John Pojman for his continuous support and always
challenging me to be the best scientist possible.
I would like to thank my committee members and mentors: Dr. Donghui Zhang, Dr.
Daniel Kuroda, and Dr. Josué Mota-Morales for being willing to answer questions and
being prime examples of excellent scientists and professionals.
I would like to thank my fellow Pojmanites, past and present, for support, understanding,
and willingness to share ideas and answer questions.
I would like to thank my fellow graduate students Garrett Sternhagen and Elizabeth
Kimball for their willingness to act as a sounding board for ideas, questions, and general
thoughts.
Last but certainly not least, I would like Dr. Stephen Foster for being my mentor during
my undergraduate career and teaching me more about being a graduate student,
mentor, and scientist than he ever realized or intended.
iii
TABLE OF CONTENTS
Acknowledgements ......................................................................................................... ii
List of Abbreviations ........................................................................................................ v
Abstract ......................................................................................................................... viii
I. Introduction .................................................................................................................. 1
1.1 Free-Radical Polymerization .................................................................................. 1
1.2 Ionic Liquids ........................................................................................................... 4
1.3 Deep Eutectic Solvents .......................................................................................... 5
II. Frontal Polymerization of an Acid-Monomer-Containing Deep Eutectic Solvent ....... 16
2.1 Introduction .......................................................................................................... 16
2.2 Materials and Methods ........................................................................................ 20
2.3 Varied Initiator Concentration Experiments ......................................................... 26
2.4 Choline Chloride Replacement ............................................................................ 28
2.5 Conclusions ......................................................................................................... 32
III. Kinetic Studies of Photopolymerization of Monomer-Containing Deep Eutectic Solvents ........................................................................................................................ 34
3.1 Introduction .......................................................................................................... 34
3.2 Materials and Methods ........................................................................................ 38
3.3 Photopolymerization of Acid-Monomer-Containing DESs .................................... 47
3.4 Photopolymerization of Acid DESs Containing Methyl Ester Monomers ............. 54
3.5 Conclusions ......................................................................................................... 56
IV. Summary and Conclusions ...................................................................................... 57
References .................................................................................................................... 59
Appendix A. Permission for Reproduction of Chapter 2 ................................................ 67
Appendix B. Front Temperature Profiles ....................................................................... 75
B.1 FT Profiles for AA-ChCl Varied Initiator Samples ................................................ 75
B.2 FT Profiles for MAA-ChCl Varied Initiator Samples ............................................. 78
B.3 FT Profiles for AA-Analog Samples ..................................................................... 81
Appendix C. Front Velocity Position versus Time Plots ................................................. 83
C.1 FV Profiles for AA-ChCl Varied Initiator Samples ............................................... 83
C.2 FV Profiles for MAA-ChCl Varies Initiator Samples ............................................. 86
C.3 FV Profiles for AA-Analog Samples .................................................................... 89
Appendix D. RTIR Sample Set Information ................................................................... 91
D.1 Camphorquinone Sample Sets (365 nm Measurements) ................................... 91
D.2. 1% DESs and Pure Monomers (365 nm Measurements) .................................. 91
D.3. 0.1% DESs and Pure Monomers (365 nm Measurements) ............................... 92

iv
D.4. 0.1% DESs and Pure Monomers (400 nm Measurements) ............................... 93
D.5. Methyl Ester Monomer Sample Sets (365 nm Measurements) .......................... 94
Vita ................................................................................................................................ 95

v
LIST OF ABBREVIATIONS
AA Acrylic acid
AIBN 2,2′-azobis(2-methylpropionitrile)
aIL Advanced ionic liquid
APS Ammonium persulfate
ATR Attenuated total reflectance
ATRP Atom-transfer radical polymerization
BPO Benzoyl peroxide
ChBr Choline bromide
ChBT Choline bitartrate
ChCl Choline chloride
CQ Camphorquinone
CRP Controlled radical polymerization
CTA Chain transfer agent
DES Deep eutectic solvent
DMF Dimethyl formamide
DMSO Dimethyl sulfoxide
FP Frontal polymerization
FRP Free-radical polymerization
FS Fumed silica
FT Front temperature
FTIR Fourier transform-infrared spectroscopy
FV Front velocity

vi
HBA Hydrogen bond acceptor
HBD Hydrogen bond donor
HEMA Hydroxyethyl methacrylate
HIPE High internal phase emulsion
IBA Isobutyric acid
IL Ionic liquid
iPCM Inert phase change material
kp Propagation rate constant
L231 Luperox ® 231
LA Lauric acid
MAA Methacrylic acid
MeA Methyl acrylate
MMA Methyl methacrylate
MWCNT Multi-wall carbon nanotube
NDF Neutral density filter
NMP Nitroxide-mediated polymerization
OD Optical density
PA Propionic acid
PLP Pulsed-laser initiated polymerization
RAFT Reversible addition-fragmentation chain transfer polymerization
ROMP Ring opening metathesis polymerization
RTIL Room temperature ionic liquid

vii
RTIR Real-time infrared spectroscopy
SA Stearic acid
SARA ATRP Supplemental activation reducing agent atom-transfer radical polymerization
TMACl Tetramethylammonium chloride
TPO Diphenyl(2,4,6-trimethylbenzoyl) phosphine oxide

viii
ABSTRACT
The forefront of this study explored polymerization, specifically thermally-initiated,
free-radical frontal polymerization of (meth)acrylic acid monomers while the monomers
acted as a hydrogen bond donor of a deep eutectic solvent. These frontal
polymerizations were shown to exhibit unusual front velocities and, in some cases,
lower front temperatures than the frontal polymerization of the neat monomers or
systems containing inert analogs in the place of the hydrogen bond acceptor of these
monomer-containing deep eutectic solvents. The frontal polymerization will occur with a
range of initiator concentrations including ones that were too low for the pure monomer
systems to sustain a front. Because of the unusual behavior of these frontal systems, an
isothermal photopolymerization was performed using these acid-monomer systems.
The second half of this work focuses on the studying kinetics of
photopolymerization of these monomer-containing deep eutectic solvents using real-
time infrared spectroscopy. Analysis of this real-time reaction monitoring indicated
increases in polymerization rate that span orders of magnitude when comparing the
deep eutectic solvent polymerization to pure monomer polymerization. A significant
increase in polymerization rate was also seen in systems that include a methyl ester
derivative of the hydrogen bond donor monomer in a nonpolymerizable deep eutectic
solvent. Because the increase in rate was present in systems in which the monomer is a
component of the deep eutectic solvent as well as when the monomer is just within a
deep eutectic solvent, it can be determined that in addition to increased solvent
viscosity, both preorganization due to hydrogen bonding and the polarity of the deep
eutectic solvent around the monomer play a role in the enhancement of the rate.

1
I. INTRODUCTION
1.1 FREE-RADICAL POLYMERIZATION
Polymerizations can occur in a number of ways, but one that is extremely common (and
the focus of this work) is free-radical polymerization (FRP). FRP is a type of addition
polymerization meaning each polymer chain is grown one monomer addition at a time,
and the polymer typically only grows from one end when producing linear polymer. The
pool of FRP monomers is quite large because, in theory, any C-C double bond can form
a radical. In practice, less substituted alkenes make better monomers because less
substitutions lead to more reactive, less stable radicals as well as producing radicals
that are less sterically hindered against attack.1
FRP typically occurs in three steps: initiation, propagation and termination; a
summary of which can be seen in Scheme 1.1. Initiation is the beginning of an FRP and
determines how the polymerization is started. Initiation is the process of fragmenting a
molecule and forming radicals on the fragments that can then react with polymerizable
molecules. The three main types of initiation are thermal, photo, and redox; some
commonly used initiators from each category can been seen in Figure 1.1.2
Initiation: I—I 2I· Propagation: I· + M M· M· + M P· Termination: P1· + P2· P12 (combination) P1· + P2· P1 + P2 (disproportionation) Scheme 1.1. The general process of initiation, propagation, and termination as seen in FRP.

2
Figure 1.1. Commonly used FRP initiators (clockwise from top left): benzoyl peroxide
(BPO, thermal) 2,2′-azobis(2-methylpropionitrile) (AIBN, thermal), ammonium persulfate (APS, redox) and camphorquinone (CQ, photo).
This work employs both thermal and photoinitiators as can be seen in Chapters 2
and 3, respectively. Initiator concentration determines the number of polymer chains
that can be produced as well as influencing how fast the polymerization can
occur. Propagation occurs when the initiator radical (I·) combines with a single electron
from a monomer’s pi bond to break the double bond and form a new, more stable single
bond between the initiator fragment and monomer along with a new radical (M·,
Scheme 1.1). This new monomer radical then combines with the alkene of a different
monomer to keep the polymer chain growing (P·). Eventually termination occurs during
which radicals react in such a way that a new radical is not produced, thus ending the
polymerization reaction. Termination can occur by two mechanisms: combination and
disproportionation. Combination termination happens when the radicals of two polymer
chains react together to form a single, longer polymer chain. Disproportionation
termination is a reaction in which a growing chain radical abstracts a hydrogen from
3
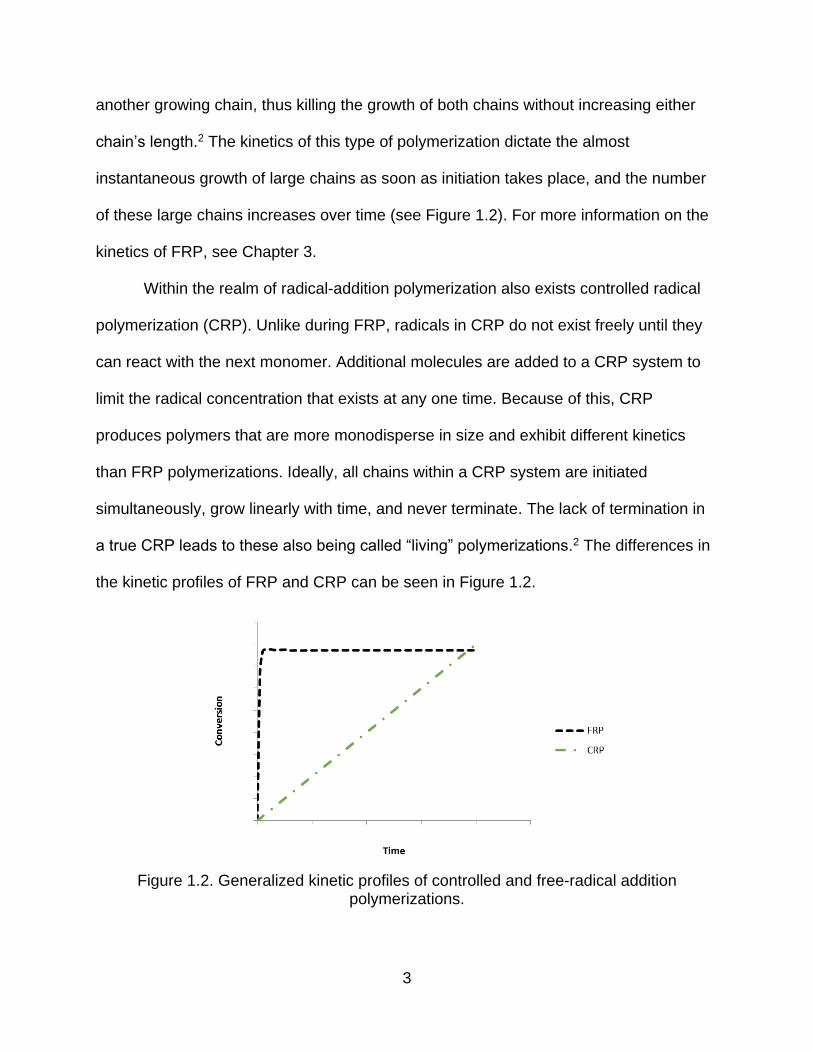
another growing chain, thus killing the growth of both chains without increasing either
chain’s length.2 The kinetics of this type of polymerization dictate the almost
instantaneous growth of large chains as soon as initiation takes place, and the number
of these large chains increases over time (see Figure 1.2). For more information on the
kinetics of FRP, see Chapter 3.
Within the realm of radical-addition polymerization also exists controlled radical
polymerization (CRP). Unlike during FRP, radicals in CRP do not exist freely until they
can react with the next monomer. Additional molecules are added to a CRP system to
limit the radical concentration that exists at any one time. Because of this, CRP
produces polymers that are more monodisperse in size and exhibit different kinetics
than FRP polymerizations. Ideally, all chains within a CRP system are initiated
simultaneously, grow linearly with time, and never terminate. The lack of termination in
a true CRP leads to these also being called “living” polymerizations.2 The differences in
the kinetic profiles of FRP and CRP can be seen in Figure 1.2.
Figure 1.2. Generalized kinetic profiles of controlled and free-radical addition
polymerizations.

4
Three main types of CRP exist: nitroxide-mediated polymerization (NMP),3 atom-
transfer radial polymerization (ATRP),4 and reversible addition-fragmentation chain
transfer polymerization (RAFT);5 each with their own control process, advantages, and
disadvantages. NMP uses stable nitroxide radicals to react with the radicals of growing
chains to minimize the number of active growing chains and therefore minimize
termination. ATRP uses redox chemistry between an activated metal (usually Cu or Fe)
and metal halide to react with growing chain radicals and reversibly deactivate the
growing chains.4 RAFT uses chain transfer agents (CTAs) to cap the majority of growing
chains during the polymerization process keeping them from terminating.5
1.2 IONIC LIQUIDS
Ionic liquids (ILs) have in recent decades become a large contender in the field of
polymers because of their ability to solvate polymers and monomers for polymerization
reactions. Kubisa has written an excellent review on the subject highlighting both the
utility and limitations of ILs in relation to polymerizations.6 Ionic liquids are ionic
complexes that can form a molten salt at some temperature below 100 ºC. Room
temperature ionic liquids (RTILs) are desirable for most applications. These ionic
complexes are typically comprised of a large, organic cation and a smaller anion (see
Figure 1.3 for some commonly employed RTIL components). Imidazolium cations are
arguably the most commonly used for RTILs. Initially, RTIL anions were quite air and
water sensitive which minimized their usefulness in real world applications. By the
1990s a second generation of ILs had emerged that were much more stable to ambient
conditions, but the anions tended to have weaker complexation ability than the more
sensitive first-generation anions. After the turn of the century, a third generation of ILs
5
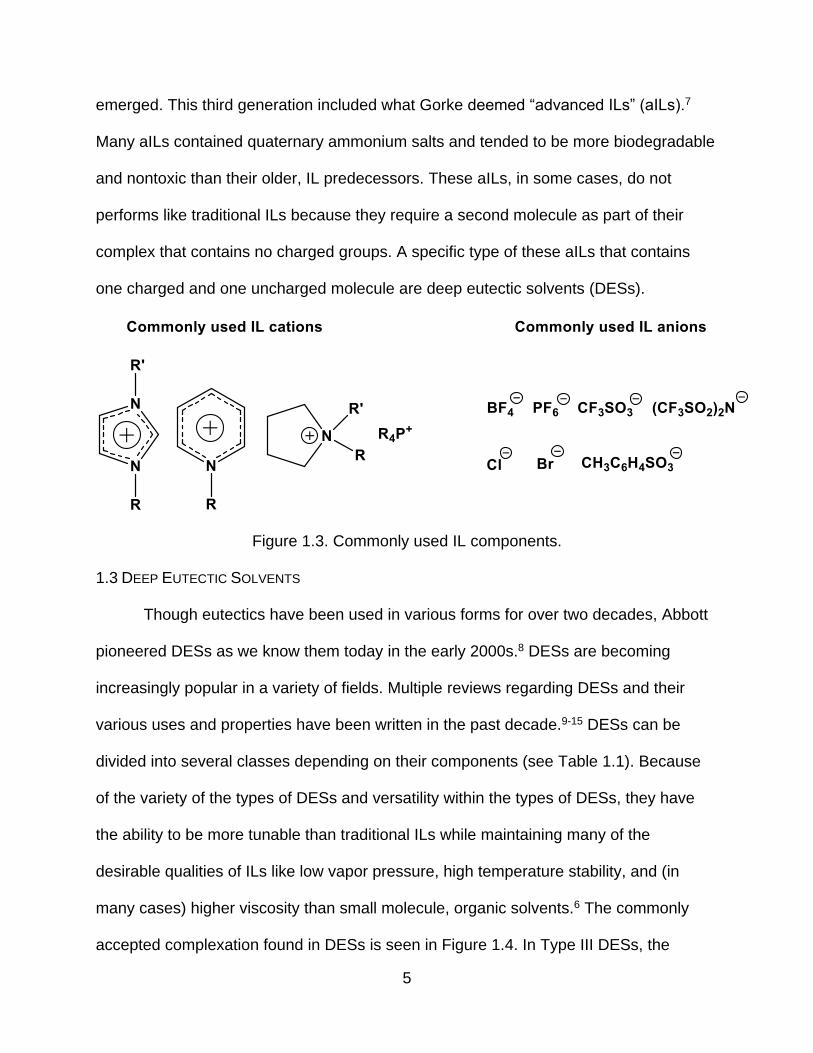
emerged. This third generation included what Gorke deemed “advanced ILs” (aILs).7
Many aILs contained quaternary ammonium salts and tended to be more biodegradable
and nontoxic than their older, IL predecessors. These aILs, in some cases, do not
performs like traditional ILs because they require a second molecule as part of their
complex that contains no charged groups. A specific type of these aILs that contains
one charged and one uncharged molecule are deep eutectic solvents (DESs).
Figure 1.3. Commonly used IL components.
1.3 DEEP EUTECTIC SOLVENTS
Though eutectics have been used in various forms for over two decades, Abbott
pioneered DESs as we know them today in the early 2000s.8 DESs are becoming
increasingly popular in a variety of fields. Multiple reviews regarding DESs and their
various uses and properties have been written in the past decade.9-15 DESs can be
divided into several classes depending on their components (see Table 1.1). Because
of the variety of the types of DESs and versatility within the types of DESs, they have
the ability to be more tunable than traditional ILs while maintaining many of the
desirable qualities of ILs like low vapor pressure, high temperature stability, and (in
many cases) higher viscosity than small molecule, organic solvents.6 The commonly
accepted complexation found in DESs is seen in Figure 1.4. In Type III DESs, the

6
hydrogen bond acceptor (HBA) is the quaternary ammonium salt, and the hydrogen
bond donor (HBD) is an organic molecule that is capable of hydrogen bonding. Many
types of HBDs have been studied including alcohols,16, 17 amides,8 and carboxylic
acids.18, 19 Table 1.2 shows some commonly used DES components. This work focuses
on HBDs that are exclusively carboxylic acids. Because of the hydrogen bonding nature
of DESs, they tend to be quite hydrophilic. Hydrophobic eutectics based on menthol and
a variety of carboxylic acids have been reported,20 but to classify these as DESs is
debatable since the eutectics contain no charged species.
Table 1.1. The types of DESs.9
Type General Formula Formula Terms and Components
I Cat+X−zMClx M = Zn, Sn, Fe, Al, Ga, In
II Cat+X−zMClx ∙ yH2O M = Cr, Co, Cu, Ni, Fe
III Cat+X−RZ Z = COOH, CONH2, OH,
NH2CONH2
IV MClx + RZ = MClx−1+ ∙ RZ + MClx+1
− M = Al or Zn
Z = CONH2 or OH

7
Table 1.2. Type III DES components.
HBA HBD
The formation of the DESs itself is generally believe to be due to a massive
depression in freezing point (see Figure 1.4) caused by charge delocalization because
of the strong hydrogen bonding interactions between the halide anion and the HBD.21 In
some cases, the decrease in freezing point can be greater than 200 ºC.18 DESs have
been applied to an number of fields including CO2 capture,21-23 drug solubilization and
release,24-26 biomass and biopolymer processing,27-31 oil separation,32, 33 and many
more.

8
Figure 1.4. A model phase diagram of a DES (top), and the bimolecular
complexation found in a Type III DES (bottom).
With the increase in popularity of these complex solvents has come those who
seek to understand and hope to predict the molecular interactions that influence and
dictate the properties of DESs. It is generally recognized that for many, if not most
DESs, the eutectic point is at a molar ratio of 2:1, HBD:HBA, thus, many DES
researchers consider 2:1 to be the “ideal” ratio for a DES. Little is known or understood
about this ratio or why this occurs at this specific ratio, though an argument can be
made for the number of hydrogen bond capable hydrogens in relation to the number of
HBA anions. Bednarz noted in their publication on itaconic acid DESs that the most

9
successful ratio was 1:1 as opposed to 2:1,34 but since itaconic acid is a difunctional
carboxylic acid, the ratio of 2 hydrogens per Cl- anion is conserved.
Without a complete understanding of the molecular interactions within DESs, the
ability to predict properties and DESs behavior is not possible. Several researchers are
making progress in this area using a variety of tools including molecular dynamic
simulations,35, 36 neutron scattering,37, 38 nuclear magnetic resonance spectroscopy,39
and infrared spectroscopy.36, 40 Kuroda’s 2D FTIR work is specifically interesting
because they propose a heterogeneous molecular structure within the DES that if
properly understood, could largely influence and expand the utility of DESs in the future.
Quasi-elastic neutron scattering has also been used to examine DESs at the molecular
level and, in that case, the typical bimolecular complexation model (Figure 1.4) of DESs
is also questioned.37 Similar conclusions have been reached about RTILs.6 Much more
exploration into DES structure is left to be completed before DES properties will be able
to be predicted.
Another advantage of DESs over their RTIL counterparts is that DES
components can quite easily be derived from biomass and other natural sources,
making them desirable as “green” solvents. Because of these more naturally derived
components, DESs (like some of their aIL counterparts) tend to have lower toxicity and
better biodegradability than many RTILs. Examples of these more “green” DES
components previously seen in literature are fructose,26 glycerol,41 citric acid,42 lactic
acid,42 levulinic acid,19 and probably most commonly urea.8 The most commonly used
HBA is choline chloride (ChCl) which can be considered quite green due to its being a B
vitamin derivative (and having provitamin status in Europe) making it a common additive
10
to livestock feed.9 DESs like RTILs are also recyclable as solvents under the correct
conditions43 further increasing their “green” character. One area in which “greenness” as
well as DESs’ other previously mentioned desirable qualities are being taken advantage
of as solvents (and in some cases, reactants) is in polymerization reactions. DESs have
been shown to be especially useful in the realm of polymerization. Below, the concept of
the polymerization in and of DESs will be addressed with a special emphasis given to
free-radical polymerization, which is the focus of this work.
1.3.1 Polymerization in DESs
One of the many advantages to DESs is their ability to solvate materials and be
used in reactions where traditional organic solvents would not perform well—high heat,
partial vacuum, or high viscosity. Because of this, DESs are ideal for use as solvents in
polymerization reactions.
Gutierrez et al. demonstrated that furfuryl alcohol and formaldehyde can undergo
polycondensation within a p-toluenesulfonic acid-choline chloride DES.44 This work is
worth noting for two reasons: one, because this is one of the earliest examples of DES
polycondensation without diluting the DES, and two, because that particular DES had
quite a low viscosity allowing MWCNTs to be homogeneously dispersed into the DES.
After post-polymerization pyrolysis, it was found that the MWCNTs were
homogeneously incorporated into the polymer network due to condensation with the
furfuryl alcohol carbons.
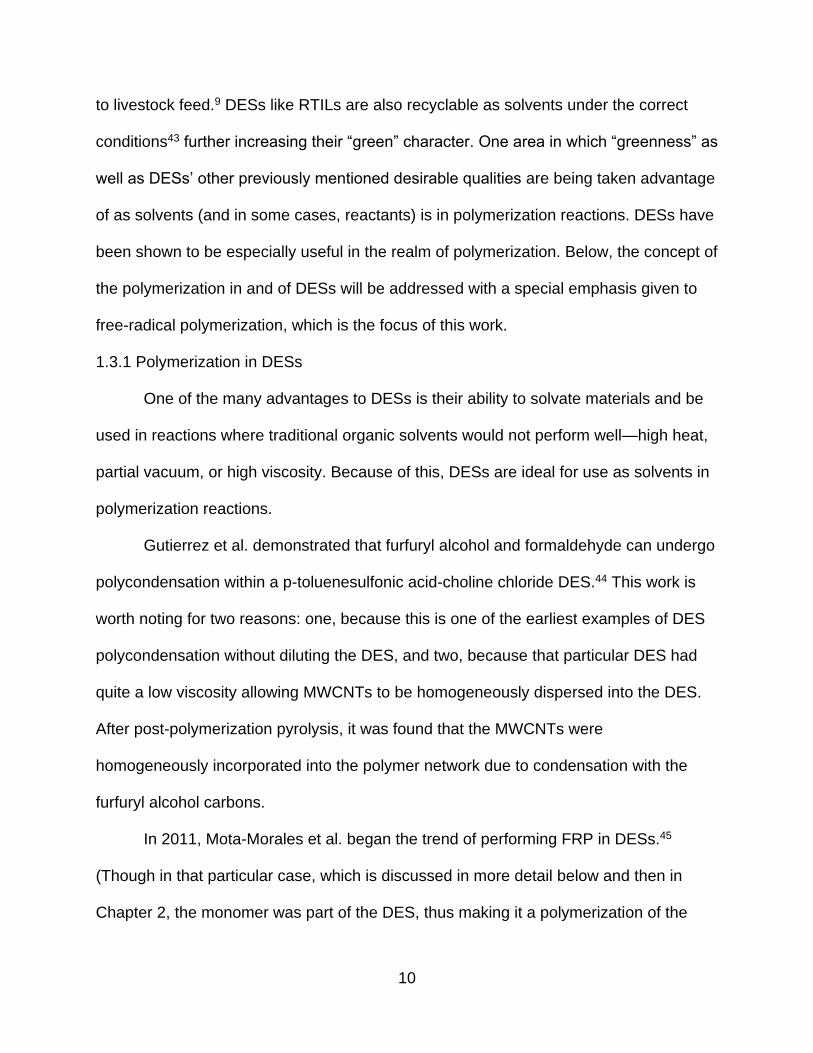
In 2011, Mota-Morales et al. began the trend of performing FRP in DESs.45
(Though in that particular case, which is discussed in more detail below and then in
Chapter 2, the monomer was part of the DES, thus making it a polymerization of the

11
DES as opposed to in the DES.) This work showed that FRP can be successful in
DESs, and many researchers have expanded upon that finding by using DESs as inert
solvents for FRP reactions. Hydroxyethylmethacrylate (HEMA) is a common monomer
used in DESs and has been polymerized in fructose-ChCl,26 orcinol-ChCl,46 and
ethylene glycol-ChCl16 DESs. The resulting materials were quite interesting and applied
to drug delivery (fructose-ChCl) and gel electrolytes that can be used as flexible
supercapacitors (orcinol-ChCl and ethylene glycol-ChCl). Methyl methacrylate,47
HEMA,48 and methyl acrylate49 have both been polymerized via ATRP in DESs.47 One
interesting note about the aforementioned ATRP of methyl methacrylate is that the
reaction was performed without a traditional ATRP ligand.47 The DESs were also shown
to enhance the recovery of the metallic ATRP catalyst.49 Both acrylate and methacrylate
monomers have been shown to exhibit controlled polymerization behavior during SARA
ATRP in DESs as well.48
Another interesting type of radical polymerization that has been performed in
DESs is enzyme-mediated radical polymerization. Sanchez-Leija and coworkers
showed that acrylamide within a DES could be polymerized and that the polymerization
was mediated by the enzyme.50 Polymerization within the DES did occur at low
temperature (4 ºC) while in pure aqueous environment, no polymer was obtained.50
One last and rather interesting application of free-radical polymerization in DESs
is that of heterogeneous FRP. In a series of papers spearheaded by Carranza of the
Pojman team, high internal phase emulsions that contained DESs were polymerized.
DESs were the internal phase of the HIPEs while the continuous phase consisted of
monomer and crosslinker.43 A number of monomers including lauryl acrylate, styrene,

12
methyl methacrylate, and stearyl acrylate were applied to these HIPE systems. Upon
polymerization and crosslinking of the continuous phase, the internal phase was able to
be removed and recycled. The resulting crosslinked material was porous, and the
porosity corresponded quite well to the dispersion and droplet size within the
unpolymerized HIPEs. This concept was advanced a step further by incorporating
nanomaterials including nitrogen doped MWCNTs51 or nanohydroxyapetite52 to produce
nanocomposites with defined and predictable porosity.
1.3.2 Polymerizations of DESs
Because of the wide variety of molecules that can be used in DESs, it is only
reasonable to assume that some monomers, whether readily available or specifically
synthesized for the purpose, can be used as DES components. In this case, the DES,
or at least one of its components, functions as a monomer and participates in the
polymerization reaction. The idea of polymerization of a DES is the focus of this work,
but many have already successfully polymerized DESs and, in some cases, created
very interesting materials in the process.
Polycondensations of resorcinol-choline chloride DESs with formaldehyde were
among the first polymerization reactions performed within and of DESs. This makes
sense as the HBDs are often molecules that can participate in polycondensation
reactions (alcohols and carboxylic acids). The poly(DES) monoliths had bimodal
porosity with both meso and micropores.53 Carriazo then expanded this work to ternary
DESs containing urea, resorcinol, and choline chloride to create high surface area
materials.54 Resorcinol-choline chloride DESs can also be polymerized in the presence
of 3-hydroxypyridine to create a monolith that contains significant nitrogen content with

13
the high carbon content.55 Another example of polycondensation of a DES is that of the
octanediol-lidocaine DES which when polymerized with citric acid, creates an
elastomeric material that is capable of drug release of the lidocaine.25 Octanediol,
combined a number of HBAs including ChCl and tetraethylammonium bromide, was
also used for polycondensation with citric acid to produce biodegradable polyester
elastomers which showed some antimicrobial properties due to the presence of the
HBA cation.56
As previously stated, CO2 capture is an area where DESs have been found
useful. Isik et al. have taken the concept a step further by polymerizing DESs that
contain special monomeric components for CO2 capture.21, 22 In this case two very
different monomers were employed. The first was a quaternary ammonium
methacrylate synthesized by starting with an amine containing methacrylate that was
then quaternized to produce the polymerizable quaternary ammonium HBA. The
methacrylate HBA was used with amidoxime as the HBD and was polymerized using
photopolymerization and an additional crosslinker. The second type of HBA monomer
was multifunctional alcohols (both tri and tetrafunctional) that were used in
condensation polymerization with citric acid, which acted as the HBD for those systems.
It is worth nothing that similar to the polycondensations performed by Serrano et al,25
these polycondensation reactions were performed over a matter of days as opposed to
the almost instantaneous crosslinking seen in a photopolymerization. After the
polymerization and characterization of the resulting polymers only the methacrylate-
amidoxime system was selected to be applied in CO2 capture.21 This nonporous

14
poly(DES) material was shown to have better CO2 absorption than analogous
poly(amines) functionalized with amidoximes that had been previously reported.22
Recently, Li and colleagues reported the polymerization of an acrylic acid-choline
chloride DES with a crosslinker using photopolymerization.57 The use of
photopolymerization allowed for a 3D patternable material that was elastomeric and
transparent. Because this material also exhibited conductivity, the poly(DES) was
applied to strain and tactile sensors using changes in resistance to indicate changes in
the polymer network that corresponded to the respective stimuli.57
Mota-Morales was able to perform free-radical polymerizations in DESs. This
case is unique, however, because those polymerizations were performed using frontal
polymerization (FP),45 which is discussed in more detail in Chapter 2. Over several
years, a series of publications by Mota-Morales and coworkers showed that FP and
DESs can be quite successful when used in tandem,58 including in the production of
nanocomposites.59 The success of these free-radical, and specifically frontal,
polymerizations inspired this work.
1.3.3 Choline activation of polymerization reactions
In a few cases, choline chloride has been shown to have a catalytic effect on
reactions. The first case is that of epoxide ring opening by nucleophilic attack in the
presence of a SnCl2/ChCl DES.60 Though, not performed as a polymerization, epoxide
ring opening polymerizations are extremely common and useful, so the relevance to
polymerization is present. Most of the epoxide ring openings that were performed in the
DES produced a greater than 90% yield of ring opened product in less than two hours

15
without the addition of any additional heat regardless of the type of nucleophile used.
Some thiol nucleophiles reached greater than 90% yield in just 10 minutes.
The second and more relevant case to this manuscript is the report of choline
chloride affecting the decomposition of a free-radical initiator.61 Itaconic acid DESs were
shown by the same group to be able to be polymerized using redox-initiated FRP,
These itaconic acid-choline chloride DESs were able to be crosslinked and produce
hydrogels.34 The interesting thing is that in the aqueous solution polymerization, choline
chloride was shown to activate the redox decomposition of the ammonium persulfate
initiator (seen in Figure 1.1).61 This activation led to a higher molecular weight of the
resulting polymer but also a larger polydispersity. The activation also led to the oxidation
of the choline cation to form an aldehyde as can be seen in Figure 1.5.
Figure 1.5. One proposed route for the oxidation of choline to betaine aldehyde during the redox FRP of itaconic acid.
16
II. FRONTAL POLYMERIZATION OF AN ACID-MONOMER-CONTAINING DEEP EUTECTIC SOLVENT1
2.1 INTRODUCTION
Frontal polymerization (FP) is a polymerization method during which the site of
reaction is localized and propagates through the monomer. FP falls into three
categories: thermal, isothermal, and photofrontal; with each relying on a different
phenomenon to allow the front to propagate. Thermal frontal polymerization—the focus
of this manuscript—relies on the Arrhenius dependence of an exothermic reaction
coupled with heat transport in the system.62 Isothermal frontal polymerization occurs
when the Trommsdorff-Norrish gel effect creates a localized area of low termination that
propagates through the system.63-65 The front in a photofrontal polymerization
propagates due to a continuous flux of radiation (most commonly UV light).66, 67 FP was
first studied by Soviet scientists Chechlio, et al. in the mid-1970s using benzoyl peroxide
initiated methyl methacrylate polymerization.68 In the case of that particular system,
pressure was needed to ensure that the front occurred,69 but there are many monomers
that can be polymerized using FP under ambient conditions. Since then, research on FP
has expanded significantly to include cure-on-demand materials,70, 71 synthesis of gels34,
72-78 and gradient materials,79-81 and epoxide polymerizations,82-85 composite
materials,59, 86-89 and many other applications.
One of the most commonly studied types of FP (and the focus of this work) is
thermal free-radical frontal polymerization of acrylic monomers. Acrylic (also called
A portion of this chapter has been previously published as Fazende, K. F.; Phachansitthi, M.; Mota-Morales, J. D.; Pojman, J. A. J. Polym. Sci. A Polym. Chem. 2017, 55, (24), 4046-4050. Permission for the reproduction of this article can be found in Appendix A.

17
acrylate) FP is typically performed via free-radical polymerization, but many other types
of polymerizations have also been applied in FP including cationic90-93, ROMP94, 95,
controlled free radical96, and thiol-ene.65, 97, 98 Multifunctional monomers are especially
popular in FP studies70, 99-102 due to their increased reactivity and crosslinked nature
which makes the polymerization less susceptible to convective instabilities. The type of
polymerization and its corresponding initiator typically dictates whether the reaction is
classified as thermal, isothermal, or photofrontal. Monomers that can be polymerized
using a free-radical mechanism, such as acrylates, can be thermal or photofrontal, as
the corresponding initiator can be obtained in both thermally initiated and photoinitiated
varieties. This work utilizes peroxide, thermal initiators.
Two major values are used to determine the usefulness of a frontal reaction: front
temperature (FT) and front velocity (FV); these two values give the ability to
quantitatively compare one frontal system to another as long as factors that affect the
values are taken into account. Front temperature is the maximum temperature recorded
during front propagation. As will be seen in the section 2.3.4 (as well as Appendix B),
the temperature profile in a thermal FP system is well defined; for any specific point in
the monomer mixture, the temperature does not drastically change until the front
propagates through and then FT is reached. Front velocity is the determination of how
quickly the front propagates through a system. Section 2.3.4 will provide details on how
this is determined using video recording and the position versus time graphs that are
obtained to determine FV.
All types of FP have certain requirements to allow the front to propagate, but as
this work focuses on thermal FP (from this point forward, “FP”), those requirements are
18
the most pertinent. The polymerization reaction must be exothermic, and its rate of
reaction must exhibit an Arrhenius dependence as well as being drastically larger at the
front temperature than at ambient temperature (or storage temperature if not stored at
ambient conditions). Zero reaction at ambient temperature is ideal, but any reaction
with a sufficiently low reaction rate at ambient temperature can produce a front.
Sufficiently high viscosity is also desired so that convection does not decrease the
amount of heat at the front to the point that propagation ceases.
These requirements for FP create limitations for the utility of frontal systems.
Oftentimes, due to the need for such a drastic increase in reaction rate, front temperatures
are very high, some reaching over 200 ºC,62 too high to be used in many biological
systems and many other applications. (Though Totaro et al. have found ways to decrease
FT by using thiol-ene comonomer systems.71) Due to these high temperatures (as well
as viscosity limitations that will be discussed further on), solvent selection for solution FP
is very limited. High boiling point solvents such as dimethyl sulfoxide (DMSO)103, 104 and
dimethyl formamide (DMF)104 are some of the organic solvents that have been
successfully used in FP, but even these have limitations due to viscosity. Diluting a
monomer for FP can be advantageous because it can decrease front temperature,105 but
it can also decrease solution viscosity and front velocity.104 The front velocity is
decreased by the dilution of the reactants and by the absorption of heat. If the monomer
solution viscosity is too low, an inert viscosity modifier must be added to inhibit convection,
which can quench the front.70
Two types of convection are commonly observed in FP: buoyancy-driven and
surface-tension-induced. Buoyancy-driven convection typically occurs when a front is not

19
propagating directly downward, hence why all fronts in this work are descending.
Surface-tension-induced convection (also known as Marangoni convection) occurs due
to localized changes in surface tension. Of the two types of convection, Marangoni
convection limits the utility of FP more drastically. In thin layers, buoyancy-driven
convection is quite minimal, but heat loss due to the Marangoni effect can be devastating
to the front.106 As mentioned above, inert fillers can be used to overcome convection and
other limitations of FP.
Fillers can cause some systems to meet requirements for frontal polymerization
when they normally would not. Fumed silica, for example, is an excellent viscosity
modifier for frontal polymerization; while kaolin or talc can act as both viscosity modifier
and heat sink. The disadvantage to adding viscosity modifier is that, oftentimes, this
addition slows the front even further.100 A low vapor pressure, high viscosity, and high
temperature stable solvent is therefore ideal for FP, and ILs easily meet these criteria.107,
108 ILs are oftentimes, and rather unfortunately, expensive and difficult to synthesize. An
alternative to traditional ILs is a similar but fundamentally different system known as deep
eutectic solvents.
First reported by Abbott less than two decades ago, DESs are greener, cheaper,
and, in many cases, easier to synthesize than traditional ILs. Several excellent reviews
have been published on DESs in recent years.9-11 The fundamental difference between
DESs and ILs lies in the type of interactions that occur within the liquid. DESs contain
hydrogen bond interactions while ILs contain short lived ion pair interactions. By
employing these hydrogen bond interactions—instead of ionic interactions—DES
components are usually easier to obtain commercially than IL components.
20
DESs consist of a hydrogen bond donor (HBD) and hydrogen bond acceptor
(HBA). The HBD can be a variety of molecules, including chlorometalate salts,109 amides,8
and carboxylic acids.18, 19 These HBDs can also be polymerizable molecules such as
acrylic acid45, 58, 59 and acrylamide.58 The HBA is usually a halogen-containing, ammonium
salt. The most common HBA is choline chloride (ChCl). Because of its provitamin status
in several European countries as well as its being a common animal food additive, ChCl
is produced on a very large industrial scale making it an inexpensive and easily accessible
DES component.10
Frontal polymerization of DESs, i.e., one of the DES components is the monomer,
has been reported previously,45, 58, 59 but little research has been done into why or how
the presence of the DES affects the behavior of the front. Herein we do just that by
examining the FP behavior of DESs as well as the FP behavior of systems that contain
analogs of ChCl to mimic the non-chemical effects that the ChCl may impart on the
polymerization. Specifically, we added talc to mimic the effect of the heat absorption by
ChCl, or a solvent (DMSO) to mimic the dilution and heat absorption by ChCl and added
stearic acid or lauric acid to mimic the effect of heat absorption and hydrogen bonding.
The effect of initiator concentration on the front velocity and front temperature was also
studied.
2.2 MATERIALS AND METHODS
2.2.1 Materials
Acrylic acid (AA), methacrylic acid (MAA), Luperox® 231 (L231), stearic acid
(SA), and lauric acid (LA) were all obtained from Sigma Aldrich. Dimethylsulfoxide
(DMSO) was obtained from Fisher Scientific, and Acros Organics supplied ChCl. Talc

21
and fumed silica were supplied by U. S. Composites. All reagents and components
were used as received. Chemical structures for all DES components and nonreactive
analogs can be seen in Figure 2.1.
Figure 2.1. Chemical structures (clockwise from top left) acrylic acid, methacrylic acid, Luperox® 231, lauric acid, stearic acid, and DMSO.
2.2.2 DES Synthesis
DESs were formulated in molar ratios of 1.6:1 and 2:1 (HBD:HBA) for acrylic acid
and methacrylic acid, respectively. As reported by Mota-Morales,58 acrylic acid-choline
chloride DESs have the highest viscosity at the 1.6:1 ratio making this ratio most
suitable for frontal polymerization. DES synthesis was done by mixing the HBD and
HBA, (the HBD is always added to the container first to minimize water absorption by
the HBA) and then placing the mixture in a 70 °C oven until no solid was visible. Once
the DES was fully synthesized, it was removed from the oven and prepared for frontal
polymerization
2.2.3 Frontal Polymerization Sample Preparation
Once the DESs were fully formed, they could be used for FP. The thermal radical
initiator chosen was Luperox® 231 (1,1-bis(tert-butylperoxy)-3,3,5-
trimethylcyclohexane) and was always added to the DES first in the sample preparation.

22
Due to the small amounts of initiator added, a syringe and 23G needle were used to add
the initiator, and it was mixed in using magnetic stirring. The stirring of the initiator and
silica into the DES, in some cases, acted as a nucleation source and caused small
crystals to form in the DES (Figure 2.2A)—if a stir bar is left in a DES for a long enough
period, crystals will grow without stirring (Figure 2.2B).
Figure 2.2. Crystallization of a DES by A) stirring and B) after sitting with a stir bar
present.
After removing the DES from the oven, it was allowed to cool for ~15 minutes to
ensure that homopolymerization would not occur upon addition of initiator. Initiator was
added as mol% initiator relative to double bonds present in the monomer. Fumed silica
was added at 1% w/w to ensure high enough viscosity was achieved to allow the front
to propagate. (It is important to note that the overall macroscopic viscosity increase
caused by fumed silica has been reported to have no impact on the final results of the
polymerization in relation to molecular weight or conversion.)110, 111 Once all
components were stirred in, the contents of each vial was placed into a 15 cm x 1.6 cm
unsealed, borosilicate glass test tube and polymerized as a descending front.
In all samples, polymerization was initiated with a butane-fueled soldering torch
without a soldering tip. The torch was applied to the exterior of the tube until the
polymer covered the entire top of the monomer mixture. For the front to be considered

23
successful, it must have propagated without the addition of external heat for a minimum
of 60 mm; though, this constraint was not necessary. The fronts examined in this work
clearly did or did not exhibit frontal behavior.
2.2.4 Measurement of Frontal Properties
Front temperatures were measured by placing a wire K type thermocouple into
the sample with the exposed portion of the wire approximately 2 cm from the bottom of
the test tube and not touching the glass of the tube. The thermocouple was connected
to a computer via a Vernier Go!Link detector, and data was recorded by Logger Pro®
software. An example of a temperature profile obtained by this system can be seen in
Figure 2.3 and all FT profiles can be found in Appendix B. The front temperature was
taken as the maximum temperature recorded during the polymerization.
Figure 2.3. Recorded front temperature profiles for AA-ChCl samples.
To determine FV, video of each polymerization reaction was recorded. (It is
important to note that samples were used for either FT or FV determination, not both, as
0
50
100
150
200
250
0 50 100 150 200 250
Tem
pera
ture
(°C
)
Time (s)
2-41-1 2-41-3 2-41-7 2-41-10 2-41-11

24
the presence of the thermocouple can, in some cases, alter the front velocity.) The tube
was placed on a stand next to a ruler while the FP was recorded as video (see Figure
2.4 for a photograph of the setup). Analysis of the video yielded time data recorded in
correlation to the front’s position as measured by the ruler. Time data points were
recorded every 5 mm during the polymerization. These time and position data points
produce a position vs. time plot, an example of which can be seen in Figure 2.5, and all
of which can be found in Appendix C. A linear regression was performed using
Microsoft Excel, and the slope of the resulting line was taken as the front velocity.

25
Figure 2.4. FP setup during initiation (left) and polymerization (right).

26
Figure 2.5. Position vs. time graph produced from video analysis of front propagation.
2.3 VARIED INITIATOR CONCENTRATION EXPERIMENTS
Initiator concentrations of 0.2%, 0.3%, 0.8%, 1.7%, 2.5%, and 3.3% were
measured for frontal properties (FV and FT). Figures 2.6 and 2.7 show the frontal
properties of AA-ChCl and MAA-ChCl, respectively, as a function of initiator
concentration. The corresponding temperature profiles (FT) position versus time graphs
(FV) that were obtained experimentally can be found in Appendices B and C,
respectively.
2.3.1 Acrylic Acid DESs Polymerized Using Various Initiator Concentrations
The velocity data in Figure 2.6 for AA indicated that ~0.7% initiator is the
solubility limit for the initiator. The opacity caused by crystal formation made the exact
limit difficult to identify, but the decrease in the data between 0.7% and 1.3% indicated
y = 0.0151x + 11.028
y = 0.0154x + 10.522
y = 0.0145x + 10.428
10
12
14
16
18
20
22
24
0 200 400 600 800
Po
sit
ion
(cm
)
Time (s)
2-86-1 2-86-2 2-86-3
Linear (2-86-1) Linear (2-86-2) Linear (2-86-3)

27
that heterogeneity in initiator dispersion is likely. The second increase in velocity beyond
the solubility limit was most likely due to a decrease in distance between heterogeneous
areas of high initiator concentration, thus creating a more “pseudo-homogeneous”
system. The FT data shows similar trends.
Figure 2.6. AA-ChCl front properties.
2.3.2 Methacrylic Acid DESs Polymerized Using Various Initiator Concentrations
The frontal behavior and trends for MAA-ChCl varied initiator systems were
similar to the AA-ChCl samples but with lower overall values. The decrease in values
between AA and MAA was expected, as MAA is inherently less reactive. Due to the
similarity in the frontal behavior of these systems, further study into monomer containing
DESs and their impact on polymerization was performed.
0
50
100
150
200
250
1.0
1.5
2.0
2.5
3.0
3.5
0.0 1.0 2.0 3.0 4.0
Fro
nt
Tem
pe
ratu
re (
ºC)
Fro
nt
Velo
cit
y (
cm
/min
)
L231 Initiator (mol %)
FV
FT

28
Figure 2.7. MAA-ChCl front properties.
2.4 CHOLINE CHLORIDE REPLACEMENT
In order to ascertain what kind of effect the presence of choline chloride (and
therefore the DES) in the front has on the properties of the FP, analogs were used to
replace the ChCl and mimic several common nonchemical effects including heat loss,
dilution, and crystalline melting. The frontal properties of these analog systems can be
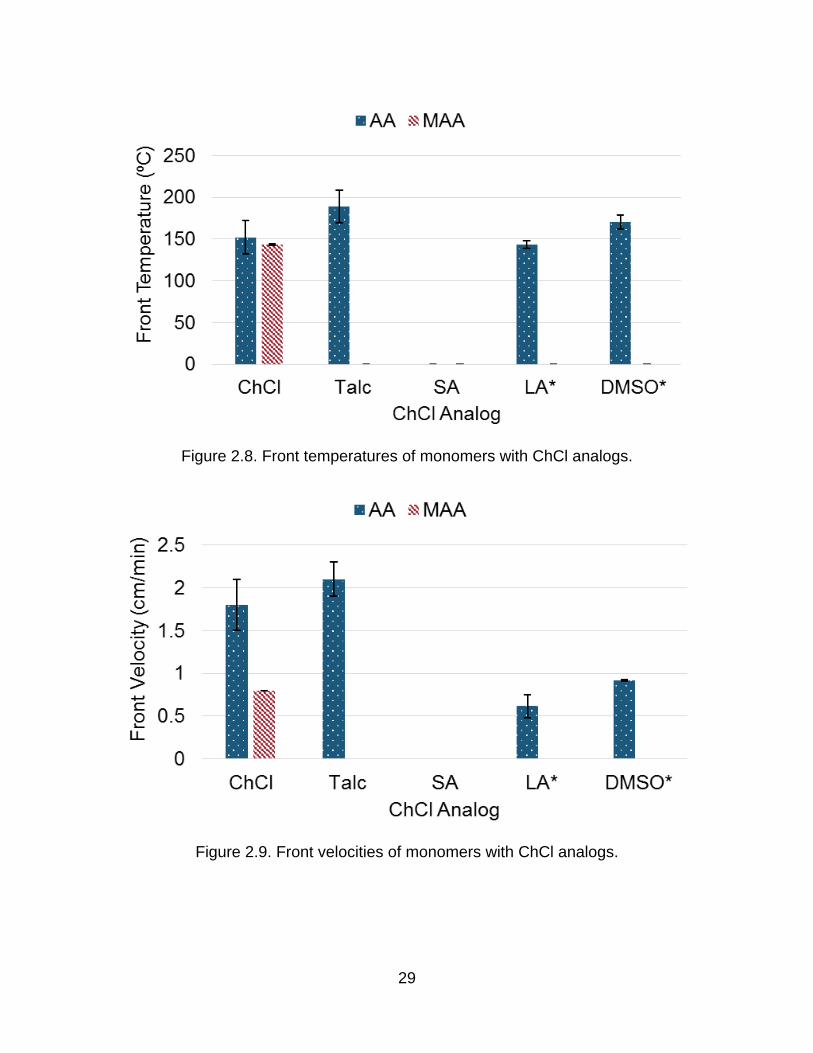
seen in Figures 2.8 and 2.9.
0
40
80
120
160
200
0.0
0.5
1.0
1.5
2.0
2.5
0 1 2 3 4
Fro
nt
Tem
pera
ture
(ºC
)
Fro
nt
Velo
cit
y (
cm
/min
)
L231 Initiator (mol %)
FV
FT
29
Figure 2.8. Front temperatures of monomers with ChCl analogs.
Figure 2.9. Front velocities of monomers with ChCl analogs.

30
2.4.1 Talc Substitution
For the talc experiments, one large batch of the talc mixture was made because
the high viscosity of the mixture caused for a large amount of the mixture to stick to the
sides of the container in which the mixture was prepared and therefore not be usable for
the actual experimentation. The large batch was a much more effective way of producing
the mixture with minimal waste. The talc samples, which were to simulate the heat
absorption effect by the ChCl, behaved more similarly to the pure AA polymerization than
to the AA-DES polymerization with violent bubbling and popping throughout the
propagation of the front. However, the front velocity was slightly higher with talc as with
ChCl. This is consistent with talc acting only as a heat sink but not as diluent. However,
the methacrylic acid samples would not polymerize frontally with talc.
2.4.2 Inert Phase Change Material (iPCM) Substitution
Due to the crystallization of DES seen in mixing, it was realized that a
comparison needed to be made to an inert filler that would also melt during the
propagation of the front. Stearic acid (SA) was selected as the inert phase change
material (iPCM), based on the work of Viner, et al.112 The SA was added to the
monomer and placed in a 90 ºC oven until all solid was no longer visible. Because the
SA mixtures solidified upon cooling, as soon as the SA was completely melted, the vials
were moved to the 60 ºC oven to keep them warm while minimizing the risk of
homopolymerization. The lower temperature allowed the cooling time to be shortened to
~5 minutes before adding the silica and initiator. Once all components were mixed, the
monomer-stearic acid mixture including silica and initiator was placed into a test tube
where it was allowed to cool completely and solidify completely before being

31
polymerized. The high melting point of the SA made the samples solidify, and this
prevented the frontal polymerization because the heat required to melt the stearic acid
suppresses front propagation. It is important to note that even when samples were
initiated before complete solidification, solidification still occurred during the initiation
process and fronts would not propagate.
2.4.3 Solvent Substitution
To verify that dilution was not the sole mechanism by which the front temperature
was lowered, ChCl was replaced with dimethylsulfoxide (DMSO) and lauric acid (LA).
Lauric acid was originally chosen as an iPCM for its relatively low melting point, but as it
was found to be soluble in both acid monomers, the lauric acid acted as a hydrogen
bond capable diluent instead. The lauric acid samples were treated the same as the
ChCl: mixed into the monomer, placed in the oven, removed from the oven when no
solid was visible, allowed to cool, and stirred with silica and initiator before being placed
into the tubes. DMSO and monomer were mixed for ~10 minutes then L231 was added.
In the cases of both LA and DMSO, the fumed silica concentration had to be increased
approximately five-fold to ensure high enough viscosity to minimize convective
instabilities; these samples with increased silica are denoted with * in Figure 2.8 and
Figure 2.9.
DMSO was an inert diluent while LA will dilute the monomers and hydrogen bond
with them in a similar fashion to the ChCl. Again, the MAA samples did not polymerize.
The AA samples would produce a front that was much slower than the AA-DES, and the
dilute analog fronts did also require a much higher silica content. DMSO lowered the front
velocity of acrylic acid below that with talc or ChCl and prevents methacrylic acid from

32
supporting frontal polymerization. DMSO had a greater effect than talc because the
DMSO not only absorbs heat, it diluted the reactants, reduced the rate of reaction beyond
that caused by the reduction in front temperature. Lauric acid reduced the front velocity
with acrylic acid compared to ChCl, talc and DMSO and suppressed front propagation
with methacrylic acid. The decrease in front velocity was greater for the LA than the
DMSO relative to the AA-DES because of the hydrogen bonding capability of LA. The
formation of the AA-LA solution was clearly endothermic, as the samples become cold to
the touch. The dissolving of the solid LA and breaking of the hydrogen bonds already
present in the pure LA required more energy than is released by the formation of the
hydrogen bonds between the monomer and LA. A portion of the heat of the polymerization
was absorbed by the solution to break the large number of already present hydrogen
bonds. It is interesting to note, however, that while the DES formation was also
endothermic, the same type of large decrease in the front velocity is not seen in the AA-
DES polymerization. This fact strongly indicated that the reactivity of the acrylic acid and
methacrylic acid are enhanced by the ChCl.
2.5 CONCLUSIONS
Acrylic acid and methacrylic acid will easily form polymerizable DESs that sustain
a front with a range of initiator concentrations. This ability to perform a free-radical
polymerization in a DES allows for a wide range of useful monomers and systems to be
applied to DESs, and the ability to use FP in conjunction with a DES increases their
usefulness even further. By replacing ChCl with nonreactive analogs that mimic various,
common phenomena that can impact the behavior of FP in a DES made with a
polymerizable HBD, it was clear that the DES has an overall positive impact on the FP

33
of the system. AA-DESs polymerized in a more controlled fashion than acrylic acid
alone, and MAA-DESs polymerized as fronts while the samples that contained MAA and
the analogs would not sustain a front. While the exact mechanism behind this impact is
yet to be determined, the current hypothesis is that the DES altered the reactivity of the
monomers within the DES. Future work will be performed to determine in more detail
how this change in polymerization behavior happens.

34
III. KINETIC STUDIES OF PHOTOPOLYMERIZATION OF MONOMER-CONTAINING DEEP EUTECTIC SOLVENTS
3.1 INTRODUCTION
3.1.1 Free-radical Photopolymerization Kinetics
In order to understand the factors that could alter the rate of a
photopolymerization, the kinetics must be examined. The equations below show the
rates of the respective steps of the polymerization and show the factors that can
influence the actual rate of a polymerization. Generally speaking, FRP rates are based
on the disappearance of the monomer (M) (equation 3.1)
(3.1) −𝑑[𝑀]
𝑑𝑡= 𝑅𝑖 + 𝑅𝑝
where Ri is the rate of initiation and Rp is the rate of propagation. Because Rp is
significantly higher, equation 3.1 is approximated and seen in the approximated form in
equation 3.2.
(3.2) −𝑑[𝑀]
𝑑𝑡= 𝑅𝑝
Rp is dependent on three main factors, the concentration of propagating radicals [Mr],
the concentration of monomer [M], and the propagation rate constant (kp). Equation 3.3
shows the relationship of these to the polymerization rate.
(3.3) 𝑅𝑝 = 𝑘𝑝[𝑀𝑟][𝑀]
Because the radical concentration remains very low, the steady-state approximation is
used which assumes that upon initiation of the polymerization system, the radical
concentration instantaneously increases to a steady, constant value. This assumption
leads to the equivalence of the rates of initiation Ri and termination Rt. Equation 3.4
shows this equivalence and defines Rt, where kt is the termination rate constant, and

35
rearrangement to equation 3.5 gives the ability to eliminate [Mr] in calculating Rp
(equation 3.6).
(3.4) 𝑅𝑖 = 𝑅𝑡 = 2𝑘𝑡[𝑀𝑟]2
(3.5) 𝑀𝑟 = (𝑅𝑖
2𝑘𝑡)
0.5
(3.6) 𝑅𝑝 = 𝑘𝑝 (𝑅𝑖
2𝑘𝑡)
0.5[𝑀]
At this point it is necessary to address Ri and the factors within a photopolymerization
specifically that affect rate; the first being not initiator concentration as seen in other
types of FRP, but rather light intensity (I). (Because of this, it often much easier to alter
light intensity as opposed to initiator concentration within photopolymerization systems
as will be seen in this work.) Equation 3.7 shows the simplest form of the equation for Ri
as a function of light intensity where Iabs is the intensity of light absorbed by the initiator
and ɸi is the quantum yield or the number of propagating chains that are actually
produced per photon of light absorbed.
(3.7) 𝑅𝑖 = 2𝐼𝑎𝑏𝑠ɸ𝑖
Because the amount of light absorbed is difficult to determine Iabs must be presented in
a way that can be measured which is the intensity of the incident light Io. This is
accomplished by incorporating the Beer-Lambert law (equation 3.8)
(3.8) 𝐼𝑎𝑏𝑠′ = 𝐼0 − 𝐼0𝑒−2.3𝜀𝐷𝑐
where ε is the molar extinction coefficient, D is the penetration depth within sample, and
c is the concentration of the photoinitiator. It is important to note that in samples with
large D values, the differences in light absorbance at different D must be taken into
account because I’abs and Iabs are not equivalent in that case. For the purposes of this

36
manuscript, D is sufficiently small that the two are taken to be equivalent. Combining
equations 3.7 and 3.8 gives
(3.9) 𝑅𝑖 = 2ɸ𝑖𝐼0(1 − 𝑒−2.3𝜀𝐷𝑐)
which when incorporated into equation 3.6 gives
(3.10) 𝑅𝑝 = 𝑘𝑝 (2ɸ𝑖𝐼0(1−𝑒−2.3𝜀𝐷𝑐)
2𝑘𝑡)
0.5
[𝑀]
which shows that a photopolymerization is affected by three main factors when the
concentrations of monomer and initiator are kept constant: kp, kt, and I0. In the next
section, some examples of enhancement to kp in ionic liquids will be discussed.
Viscosity and the related Trommsdorff-Norrish effect are often the most effective way to
decrease kt in a traditional FRP thus increasing polymerization rate.
3.1.2 Free-radical Polymerization Kinetics in Ionic Liquids
Ionic liquids, like DESs, can be used as solvents for polymerization reactions and
have been for a much longer time period. Kubisa’s review on the subject is an excellent
overview,6 but for the purposes of this chapter, the focus will be on kinetics of
polymerization in ionic liquids.
Free-radical polymerization in ILs tends to behave unlike solution polymerizations
performed in organic solvents or in the bulk. In 2006, Strehmel and coworkers reported
thermally-initiated polymerizations of n-butyl methacrylate using AIBN as the initiator in
both ILS and toluene.113 A plethora of ILs were used including imidazolium, pyridinium,
and alkylammonium cations each coupled with multiple anions. In some cases, the
polymer was produced in higher yield in the IL than in the bulk. One interesting point the
authors make is that in the cursory kinetic studies they performed, no Trommsdorff–
Norrish effect is observed as would be observed in typical bulk polymerization. Such an

37
effect gives a distinctive S shape (Figure 3.1) to the resulting conversion versus time
plot for the polymerization. It is also stated that increased conversions and molecular
weights are obtained for the polymerizations performed in the ILs. These increases are
attributed to a combination of the decrease of the termination rate, and an increase of
the propagation rate. The authors claim this combination because the increases in
molecular weight do not follow increases in viscosity of the ILs in which they are
polymerized indicating more than one impact on the reaction kinetics. In the specific
case of the n-butyl methacrylate monomer, imidazolium ILs were found to have the
greatest positive impact on the polymerization and final polymer properties.
Figure 3.1. The distinct shape of a conversion versus time graph when the
Trommsdorff–Norrish effect is present. Another highly interesting example of kinetic work using pulsed-laser initiated
polymerization (PLP), performed in ILs comes from a group of German scientists in
2007.114 The authors claim that the presence of the highly polar imidazolium salt causes
a decrease in the activation energy of the two monomers tested (glycidal methacrylate
and methyl methacrylate) compared to the bulk polymerization. They also state that this
0
0.1
0.2
0.3
0.4
0.5
0.6
0.7
0.8
0.9
1
0 1000 2000 3000 4000
Co
nvers
ion
(%
)
Time (s)

38
decrease in activation energy leads to increases of the kp by factors of two and four,
respectively, when compared to a bulk polymerization.
Another instance where PLP was used and propagation rate constants were
reported to be enhanced was that of the polymerization of hydroxypropylmethacrylate in
imidazolium and pyridinium ILs.115 In solution polymerization using benzyl alcohol or
toluene as the solvent, the kp for the polymerization was the same as the kp for the bulk
polymerization, while most of the ILs used resulted in an increased kp. In this case as
well, the polarity of the solvent that increases monomer solvent interaction is attributed
to the increased kp.
3.2 MATERIALS AND METHODS
3.2.1 Materials
AA and methyl methacrylate (MMA) were supplied by Sigma Aldrich.
Diphenyl(2,4,6-trimethylbenzoyl) phosphine oxide (TPO), propionic acid (PA), choline
bromide (ChBr), choline bitartrate (ChBT), tetramethylammonium chloride (TMACl), and
MAA were obtained from TCI America. Acros Organics supplied ChCl, isobutyric acid
(IBA), methyl acrylate (MeA). All reagents and components were used as received.
3.2.2 Real-Time Infrared Spectroscopy
All spectra were obtained on a Bruker Tensor 27 Fourier transform-infrared
spectrometer (FTIR) equipped with a Peak Miracle single-bounce diamond attenuated
total reflectance (ATR) cell using real-time infrared spectroscopy (RTIR). The spectral
range for all spectra was 4000 – 650 cm-1, and all spectra were recorded at a resolution
of 4 cm-1. All experimental and background spectra consisted of 16 scans. The FTIR
was set to take a spectrum after a specified interval of time until a total number of
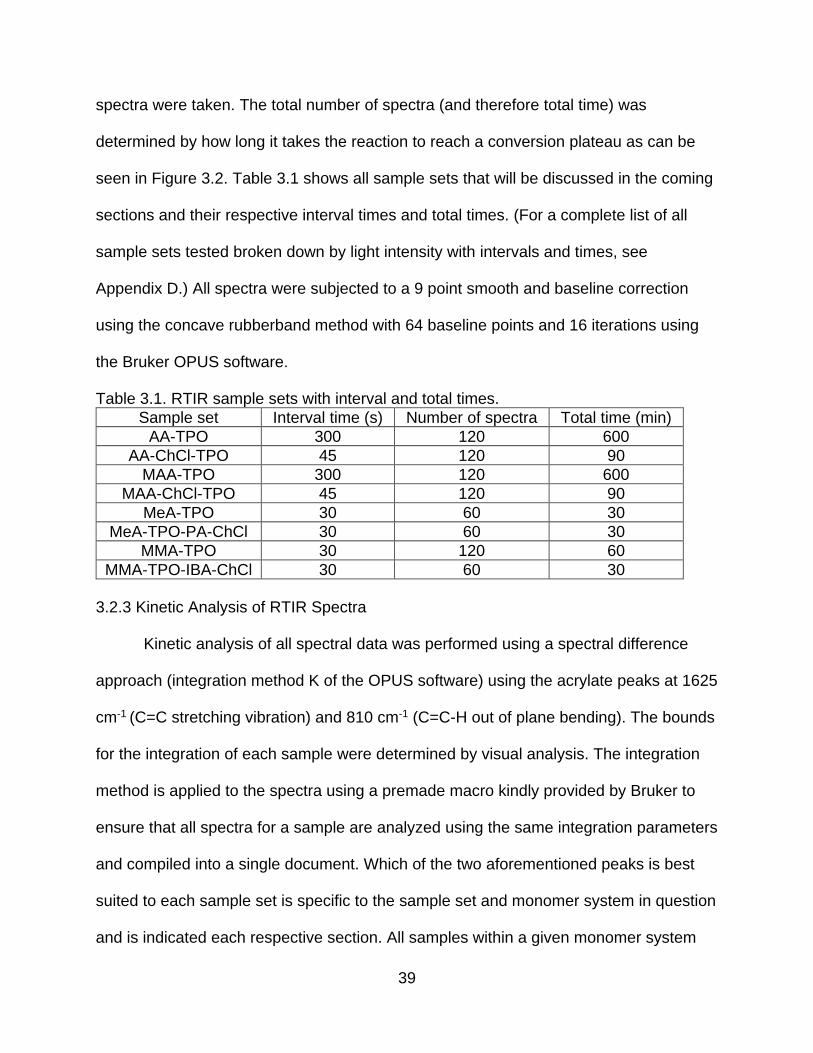
39
spectra were taken. The total number of spectra (and therefore total time) was
determined by how long it takes the reaction to reach a conversion plateau as can be
seen in Figure 3.2. Table 3.1 shows all sample sets that will be discussed in the coming
sections and their respective interval times and total times. (For a complete list of all
sample sets tested broken down by light intensity with intervals and times, see
Appendix D.) All spectra were subjected to a 9 point smooth and baseline correction
using the concave rubberband method with 64 baseline points and 16 iterations using
the Bruker OPUS software.
Table 3.1. RTIR sample sets with interval and total times.
Sample set Interval time (s) Number of spectra Total time (min)
AA-TPO 300 120 600
AA-ChCl-TPO 45 120 90
MAA-TPO 300 120 600
MAA-ChCl-TPO 45 120 90
MeA-TPO 30 60 30
MeA-TPO-PA-ChCl 30 60 30
MMA-TPO 30 120 60
MMA-TPO-IBA-ChCl 30 60 30
3.2.3 Kinetic Analysis of RTIR Spectra
Kinetic analysis of all spectral data was performed using a spectral difference
approach (integration method K of the OPUS software) using the acrylate peaks at 1625
cm-1 (C=C stretching vibration) and 810 cm-1 (C=C-H out of plane bending). The bounds
for the integration of each sample were determined by visual analysis. The integration
method is applied to the spectra using a premade macro kindly provided by Bruker to
ensure that all spectra for a sample are analyzed using the same integration parameters
and compiled into a single document. Which of the two aforementioned peaks is best
suited to each sample set is specific to the sample set and monomer system in question
and is indicated each respective section. All samples within a given monomer system
40
are analyzed using the same peak. The spectral differences were used to calculate
conversion data for the polymerization using equation 3.11. M0 is the initial monomer
concentration at time = 0 (before irradiation), and Mt is the monomer concentration at
time = t as determined by the spectral difference analysis.
(3.11) % 𝐶𝑜𝑛𝑣𝑒𝑟𝑠𝑖𝑜𝑛 =𝑀0−𝑀𝑡
𝑀0∗ 100
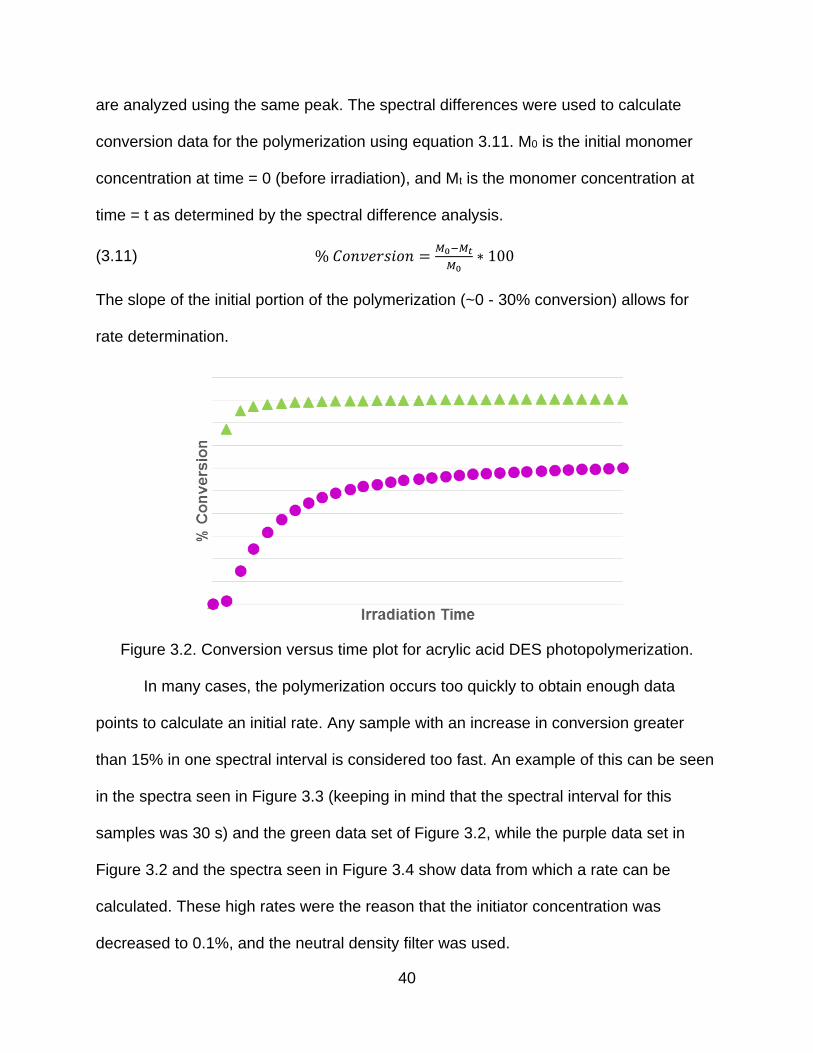
The slope of the initial portion of the polymerization (~0 - 30% conversion) allows for
rate determination.
Figure 3.2. Conversion versus time plot for acrylic acid DES photopolymerization.
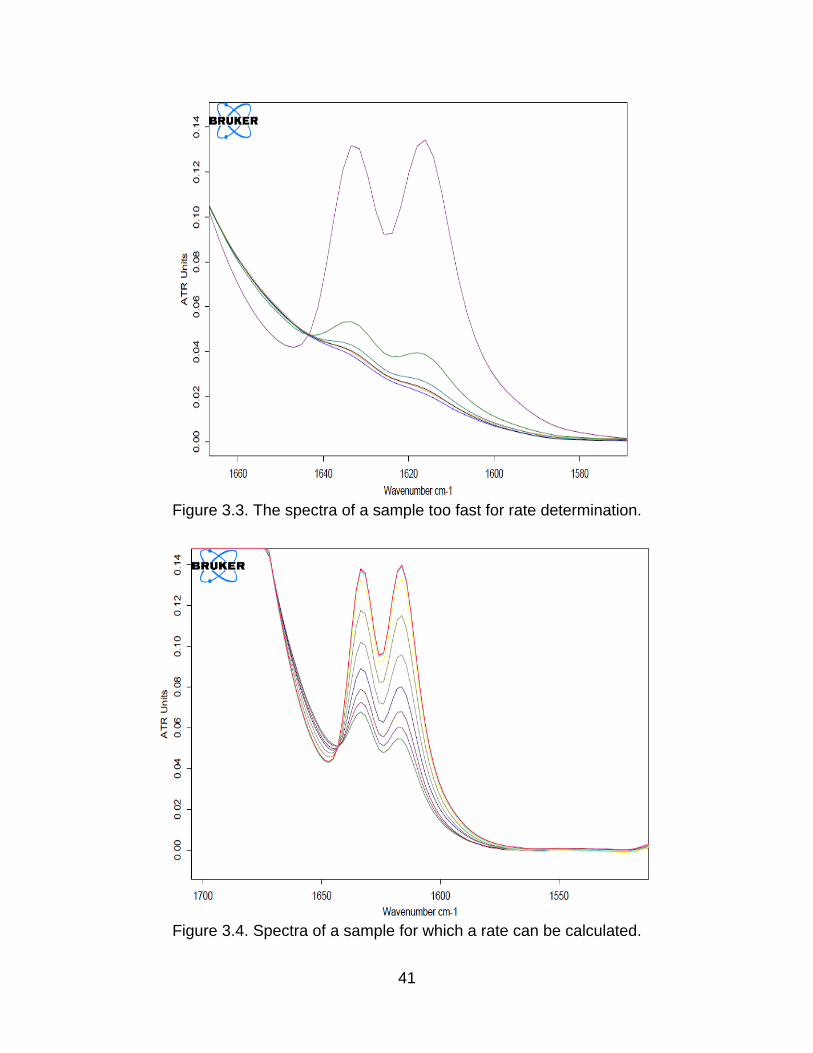
In many cases, the polymerization occurs too quickly to obtain enough data
points to calculate an initial rate. Any sample with an increase in conversion greater
than 15% in one spectral interval is considered too fast. An example of this can be seen
in the spectra seen in Figure 3.3 (keeping in mind that the spectral interval for this
samples was 30 s) and the green data set of Figure 3.2, while the purple data set in
Figure 3.2 and the spectra seen in Figure 3.4 show data from which a rate can be
calculated. These high rates were the reason that the initiator concentration was
decreased to 0.1%, and the neutral density filter was used.
41
Figure 3.3. The spectra of a sample too fast for rate determination.
Figure 3.4. Spectra of a sample for which a rate can be calculated.

42
3.2.4 Photopolymerization of DESs
In order to ensure measurable polymerization on the ATR cell, a room-
temperature photopolymerization was used. Initially, camphorquinone (CQ, Figure 1.1)
was chosen as the radical photoinitiator but was found to be too inefficient to initiate
some of the polymerizations within a reasonable time frame for RTIR measurement.
Typically, CQ is used in conjunction with an amine activator to increase the initiation
efficiency. This was attempted using trimethylamine, but acid-base reactions between
the amine and the HBD of the DES eliminated any activation of the CQ. Ultimately, the
photopolymerization was performed using diphenyl(2,4,6-trimethylbenzoyl) phosphine
oxide (TPO, Figure 3.5) as the photoinitiator. In all samples, the concentration of TPO
relative to monomer double bonds is 0.1 mol% for the HDB monomer systems and 1%
for the methyl ester monomer systems. Initially, a concentration of 1% was used for the
HBD monomers as well, but all samples polymerized too quickly—even at the low limit
of light intensity produced by the light source—to obtain a quantifiable rate.
Figure 3.5.The α-cleavage initiation mechanism of TPO.

43
Figures 3.6 and 3.7 shows the coupling of the Thor Labs Broadband Halogen
Fiber Optic Illuminator (also called the light source) and the FTIR instrument. The light
source emits across the visible light spectrum using a 150 W high-output halogen lamp
coupled with a variable intensity controller and fiber bundle that allows for the direction
of the light onto the sample and ATR crystal. The fiber is mounted directly above the
ATR crystal at a height of 1.2 cm giving an illumination area of 1.9 cm2. By using an
optical power meter also supplied by Thor Labs, the intensity of light emitted through the
fiber bundle can be measured at a specified wavelength—light intensities for this work
were measured at either 365 nm (methyl ester monomers) or 400 nm (HBD monomers).
Figure 3.6. The light source fiber mounted above the ATR crystal while irradiating a sample.

44
Figure 3.7. The photopolymerization-FTIR setup cross-section.

45
The sample was applied to the ATR crystal while the room was darkened using a
plastic sample applicator and covered with a glass slide cover to minimize oxygen
inhibition and, in the case of the pure monomers, sample evaporation. As can be seen
in Figures 3.6 and 3.7, a black polyethylene cover was placed on the fiber and used to
cover the sample cell and ensure that no outside light would interfere with the
photopolymerization. The lighting of the room was not seen to have a significant impact
on the photopolymerization as long as the blackout cover was properly in place.
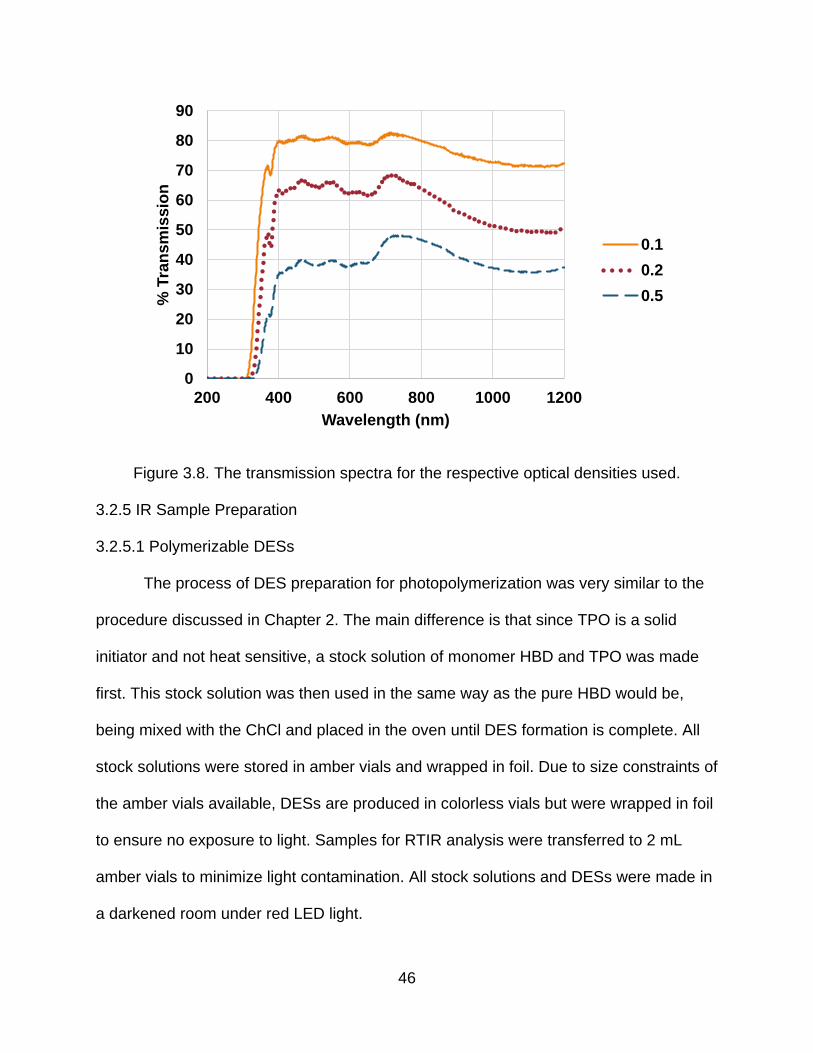
In order to further decrease the intensity of the light beyond the low limit of the
light source, a neutral density filter (NDF) was employed for the AA-ChCl and MAA-
ChCl DESs. The NDF obtained from Thor Labs is a variable optical density filter with a
spectral range of 240 nm – 1200 nm and contains stepped, distinct optical densities of
0.04, 0.1, 0.2, 0.3, 0.4, 0.5, 0.6, and 1.0. The formula for optical density can be seen in
equation 3.12 where OD is the optical density, and T is the % transmission of the light at
a specified wavelength. Thor Labs reports all ODs at 633 nm.
(3.12) 𝑂𝐷 = log10 (1
𝑇)
Figure 3.8 shows the transmission spectra of the optical densities used. The reported
optical densities used for this work were 0.1, 0.2, and 0.4 which correspond to
decreases in 400 nm light of 21%, 37%, and 65% or ODs of 0.1, 0.2, and 0.5,
respectively, at 400 nm.
46
Figure 3.8. The transmission spectra for the respective optical densities used.
3.2.5 IR Sample Preparation
3.2.5.1 Polymerizable DESs
The process of DES preparation for photopolymerization was very similar to the
procedure discussed in Chapter 2. The main difference is that since TPO is a solid
initiator and not heat sensitive, a stock solution of monomer HBD and TPO was made
first. This stock solution was then used in the same way as the pure HBD would be,
being mixed with the ChCl and placed in the oven until DES formation is complete. All
stock solutions were stored in amber vials and wrapped in foil. Due to size constraints of
the amber vials available, DESs are produced in colorless vials but were wrapped in foil
to ensure no exposure to light. Samples for RTIR analysis were transferred to 2 mL
amber vials to minimize light contamination. All stock solutions and DESs were made in
a darkened room under red LED light.
0
10
20
30
40
50
60
70
80
90
200 400 600 800 1000 1200
% T
ran
sm
issio
n
Wavelength (nm)
0.1
0.2
0.5

47
3.2.5.2 Nonpolymerizable DESs
In the case of the DESs used for the methyl ester monomer polymerization, the
DESs were made using analogs of the HBD monomers without the C=C bond: propionic
acid in the place of acrylic acid and isobutyric acid in the place of methacrylic acid
(Figure 3.9). The DESs were made first and then a stock solution of methyl ester
monomer containing 1 mol% TPO was added to the DES and mixed in. When not in
use, the stock solutions and DES-methyl ester monomer systems were stored in a
freezer in amber vials.
Figure 3.9. Nonpolymerizable DES systems containing methyl ester monomers.
3.3 PHOTOPOLYMERIZATION OF ACID-MONOMER-CONTAINING DESS
The photopolymerization of the DESs and the pure monomers were polymerized
and rates determined. Initially samples were polymerized at measured intensities of 14
mW*cm-2, 35 mW*cm-2, 70 mW*cm-2, 105 mW*cm-2, and 140 mW*cm-2, but due to the
fact that only the 14 mW*cm-2 (measured at 400 nm) exhibited a slow enough
polymerization to calculate a rate, the neutral density filter was employed for the DESs.
For both AA and MAA DESs, the 810 cm-1 peak was used as the analysis peak

48
because in these samples, the 1625 cm-1 peak tends to overlap with (and eventually
disappear underneath) the carbonyl peak at ~1700 cm-1 making the spectral difference
and therefore conversion artificially inflated.
3.3.1 Photopolymerization of Acrylic Acid DESs
3.3.1.1 AA-ChCl DES Photopolymerization at Varying Light Intensities
Table 3.2 shows the rates of polymerization for the acrylic acid DESs and pure
acrylic acid polymerization. It is clear that the increase in rate seen in Chapter 2 is
reflected in a photopolymerization system as well as an FP system. An important note is
that the conversions listed in Table 3.2 are the maximum conversions achieved during
the polymerization. Should the conversion at 90 min (the final time for the DES
samples) be compared between DES and pure monomer (80% and 4%, respectively)
the difference is much larger.
Table 3.2. Rate and conversion data for AA-TPO and AA-ChCl-TPO.
Sample Set Intensity
(mW*cm-2) Initial Rate
(min-1) Maximum
conversion (%)
AA-TPO 14 0.03 ± 0.06 41 ± 29
AA-ChCl-TPO 14 13.0 ± 6.0 79 ± 7
AA-ChCl-TPO 11 9.5 ± 1.3 71 ± 4
AA-ChCl-TPO 9 5.4 ± 2.2 69 ± 5
AA-ChCl-TPO 5 2.0 ± 1.0 43 ± 11
There is a difference in viscosity between pure AA (1.2 cP116) and the AA-ChCl
DES (171 cP, measured using a Brookfield viscometer), but this does not solely account
for the increase in rate. This viscosity increase may increase rate somewhat, but the
increase is not significant enough to cause gel effect like autoacceleration. Based on
Kuroda’s36 statement regarding heterogeneities within DES systems, it is possible that
heterogeneous domains exist in the DES where the monomer concentration is higher
which could lead to an increased localized rate. Such a heterogeneous system would

49
lead one to compare these systems to emulsion polymerizations during which polymers
grow inside a particle that is monomer rich, and the polymer is typically insoluble in the
solution outside the particle. Because of this, emulsion has very distinct intervals during
the polymerization during which the rate behavior is very predictable. Interval I
corresponds to rapid increase in rate followed by a much slower increase or a plateau in
rate in interval II, and finally during interval III the rate quickly decreases due to
decreasing monomer concentration at the end of the reaction. Figure 3.10 shows rate
versus conversion plots for all of the AA-ChCl samples. In the case of the AA-ChCl
samples, some broadening at the maximum of the plot occurs but not enough and not
consistently enough to conclude that this system polymerizes in the same way as an
emulsion. The 5 mW*cm-2 samples do seem to broaden more than the others with the
slowing of the polymerization. With a further decrease in polymerization rate (by
decreasing light intensity), interval II behavior might be observable, but it is doubtful.

50
Figure 3.10. Rate versus time plots for AA-ChCl samples measured at intensities of 14 mW*cm-2 (A), 11 mW*cm-2 (B), 9
mW*cm-2 (C), 5 mW*cm-2 (D).

51
Another factor that is seen in polymerization in ILs (and within acrylate bulk
polymerizations when comparing various monomer structures117) is the hydrogen
bonding within the system. It is known that hydrogen bonding can cause
preorganization that increases polymerization rate.117 With the increased hydrogen
bonding network seen in DESs, this is most likely the main factor that increases the
rate.
3.3.1.2 Other HBAs for AA DES Photopolymerization
In order to test the idea of heterogeneous domains within the DES, a different
HBA was desired for the polymerization. Three HBAs were attempted, but none were
successful. Figure 3.11 shows the structures of the three.
Figure 3.11. Top left: choline bromide, top right: tetramethylammonium chloride,
Bottom: choline bitartrate.
ChBr was the only HBA of the three to form a DES under the standard DES formation
conditions at the 1.6:1 ratio, and the AA-ChBr samples all crystallized almost
instantaneously after removal from the oven and formed a semi-solid material that could
not be melted back to a pure liquid state.

52
3.3.2 Photopolymerization of Methacrylic Acid DESs
Just as is the case for the AA samples, the MAA samples show orders of
magnitude increase in rate between the DES and pure monomer. Also, the 90 minute
conversion between the two—55% and 4%— is larger, though not as drastic a
difference as seen in the AA.
Table 3.3. Rate and conversion data for MAA-TPO and MAA-ChCl-TPO.
Sample Set Intensity
(mW*cm-2) Initial Rate
(min-1) Maximum
conversion (%)
MAA-TPO 14 0.02 ± 0.02 11 ± 8
MAA-ChCl-TPO 14 3.9 ± 1.1 55 ± 5
MAA-ChCl-TPO 11 1.4 ± 0.6 46 ± 17
MAA-ChCl-TPO 9 1.5 ± 0.4 55 ± 10
MAA-ChCl-TPO 5 0.7 ± 0.3 33 ± 12
The slower rates and lower conversions are to be expected with the less reactive
MAA monomer. Again, it seems that viscosity plays some role in the rate enhancement
of these samples with the MAA DES viscosity measuring 73 cP, and the pure MAA’s
viscosity being 1.3 cP,118 but as was the case with the AA samples as well, it is likely
that viscosity is not the main factor to play a role in the rate enhancement. By plotting
the rate versus time (Figure 3.12), we can see that the MAA samples do have broader
and slightly more emulsion like plots—which is reasonable because of the slightly more
hydrophobic nature of MAA compared to AA—but still do not exhibit enough of an
interval II behavior to be considered emulsion like. This leads to the conclusion that
once again, the increased hydrogen bonding network around the monomer cause the
increase in rate.

53
Figure 3.12. Rate versus time plots for MAA-ChCl samples measured at intensities of 14 mW*cm-2 (A), 11 mW*cm-2 (B), 9
mW*cm-2 (C), 5 mW*cm-2 (D).

54
3.4 PHOTOPOLYMERIZATION OF ACID DESS CONTAINING METHYL ESTER MONOMERS
In order to determine if the monomer has to be part of the DES to see the rate
enhancement, DESs were made using nonreactive analogs of AA and MAA (see Figure
3.9) and the corresponding methyl ester monomer was polymerized, MeA and MMA,
respectively. In most MeA samples (both pure and DES), the increases in conversion
exceeded the aforementioned limit. The few samples at the lowest measured light
intensity (measured at 365 nm) that potentially would exhibit measurable rates with pure
MeA evaporated before polymerization was complete enough to calculate a rate—even
after use of the glass slide covers. Because of this, slowing the rate further to study the
MeA system with the NDF did not seem plausible.
The MMA-TPO and MMA-TPO-IBA-ChCl systems (Figures 3.13 and 3.14),
however, gave consistent results to what was seen in the AA and MAA DESs. There is
a definite rate enhancement in the samples that contain DES even though the monomer
is not part of the DES. This indicates that the environment of the DES, even without the
additional hydrogen bonding between the monomer and the HBA, is conducive to
increased polymerization rate. Viscosity almost certainly does play some role, here, but
the increased polarity of the DES versus bulk MMA cannot be ignored. As was shown
for the ILs mentioned in section 3.2.2, the polarity of the system can play a role as well.
The IBA-ChCl DES is much more polar than MMA, which almost certainly leads an
increase in the kp. The intensity of light and initiator concentration used for these
samples is higher than those used for the original DES polymerizations. Because of
these higher input values, the rates are approaching what is essentially a maximum for
the system. Lower intensities should trend similarly to the monomer-containing DESs.

55
Figure 3.13. Initial rates for pure MMA and MMA in an IBA-ChCl DES.
Figure 3.14. Final conversions for MMA and MMA in an IBA-ChCl DES.
0.0
2.0
4.0
6.0
8.0
10.0
12.0
14.0
14 35 70 105 140
Rate
(m
in-1
)
Irradiation Intensity (mW*cm-2)
MMA-TPO-IBA-ChCl MMA-TPO
0
20
40
60
80
100
120
14 35 70 105 140
Fin
al C
on
vers
ion
(%
)
Irradiation Intensity (mW*cm-2)
MMA-TPO-IBA-ChCl MMA-TPO

56
3.5 CONCLUSIONS
In order to determine if DESs cause polymerization rate enhancements similar to
those seen in ILs, photopolymerizations of polymerizable DESs and DESs with
monomer incorporated into them were performed and monitored via RTIR. Conversion
and rate data obtained from the RTIR experiments indicate that rate enhancement
occurs regardless of whether or not the monomer is a component of the DES. Viscosity
measurements indicate that the enhanced rate is in part due to the increased viscosity
found in the DES, but rate data indicates that even though DESs are known to be
heterogeneous, the polymerization does not behave in an emulsion-like manner. This
leaves the hydrogen bonding and polarity of the DESs versus their pure monomer
states as the main factor that increases the rate.

57
IV. SUMMARY AND CONCLUSIONS
Deep eutectic solvents have a large presence and an even larger future in
polymerization. In this work, deep eutectic solvents were synthesized using
(meth)acrylic acid and choline chloride as the hydrogen bond donor and hydrogen bond
acceptor, respectively. Unlike previous work which used crosslinkers in conjunction with
the monomer HBD, the DESs in this work were polymerized using only the acid
monomer HBD. The DESs were able to be polymerized using a range of initiator
concentrations and exhibited frontal behavior that was unexpected. Due to this unusual
behavior, a more in-depth study of these systems was performed by replacing the ChCl
with inert analogs. These analogs were meant to impart typical phenomena that will
alter the behavior of a frontal polymerization and included talc as a heat sink, stearic
acid as an inert phase change material, lauric acid as a hydrogen bond capable diluent,
and DMSO as an inert diluent. None of the analog systems produced results similar to
the DESs, and methacrylic acid would not sustain a front with any of the analogs. This
lead to the conclusion that the presence of a DES has a direct impact on the rate of a
free-radical polymerization. To elucidate more about this rate enhancement, a step
away from the complexity of frontal polymerization had to be taken.
In order to study the DES rate enhancement, DESs were photopolymerized while
being monitored using real-time FTIR. The rates of the DES samples were much higher
than those of the pure monomer due to the increased hydrogen bond complexation
around the monomer. To study whether or not the monomer had to be part of the DES
in order to experience rate enhancement, molecularly similar systems were employed in
which the HBD was a nonpolymerizable analog to the monomer HBDs used previously:
propionic acid in the place of acrylic acid and isobutyric acid in the place of methacrylic
58
acid. The monomers for these systems are methyl ester equivalents to the
aforementioned monomers, methyl acrylate and methyl methacrylate, respectively. The
rates from the methyl ester monomer-DES systems were also increased compared to
their pure monomer counterparts. Placing a monomer that has no hydrogens to
hydrogen bond into a DES still causes an increase in rate indicating that polarity as well
as hydrogen bonding plays a role in rate enhancement by a DES.
If this work were to be pursued further, the next step would be to use one
monomer in multiple DESs with the same HBD but differing HBAs to determine if DES
heterogeneity has an impact on the polymerization. The polymer produced would be
characterized by gel permeation chromatography so that molecular weight can be
correlated to the polymerization data. Methyl methacrylate and
hydroxyethylmethacrylate would both be desirable choices for these experiments.
Another line of experimentation to pursue would be to test other hydrogen bond capable
monomers such as hydroxyethylmethacrylate and carboxyethylacrylate to determine if
monomer DES components with different dipole moments would experience rate
enhancement to varying degrees. Dilution studies in which the monomer concentration
is held constant and different nonreactive HBDs are used to tune viscosity would also
be advantatgeous for understanding the impact of viscosity on polymerization kinetics.

59
REFERENCES
1. Moad, G.; Solomon, D. H., The Chemistry of Radical Polymerization. Pergamon: Oxford, 1995.
2. Odian, G., Principles of Polymerization, 4th Ed. 3rd ed. ed.; Wiley: New York, 2004.
3. Delaittre, G.; Rieger, J.; Charleux, B. Macromolecules 2011, 44, (3), 462-470.
4. Matyjaszewski, K. Atom Transfer Radical Polymerization (ATRP). https://www.cmu.edu/maty/chem/fundamentals-atrp/atrp.html (2 February),
5. Perrier, S. Macromolecules 2017, 50, 7433-7447.
6. Kubisa, P. Prog. Polym. Sci. 2009, 34, (12), 1333-1347.
7. Gorke, J.; Srienc, F.; Kazlauskas, R. Biotechnol Bioproc E 2010, 15, (1), 40-53.
8. Abbott, A. P.; Capper, G.; Davies, D. L.; Rasheed, R. K.; Tambyrajah, V. Chem. Comm. 2003, (1), 70-71.
9. Smith, E. L.; Abbott, A. P.; Ryder, K. S. Chemical Reviews 2014, 114, 11060-11082.
10. Carriazo, D.; Serrano, M. C.; Gutierrez, M. C.; Ferrer, M. L.; del Monte, F. Chemical Society Reviews 2012, 41, (14), 4996-5014.
11. Zhang, Q.; De Oliveira Vigier, K.; Royer, S.; Jerome, F. Chemical Society Reviews 2012, 41, (21), 7108-7146.
12. Mota-Morales, J. D.; Sánchez-Leija, R. J.; Carranza, A.; Pojman, J. A.; del Monte, F.; Luna-Bárcenas, G. Progress in Polymer Science 2018, 78, 139-153.
13. Shishov, A.; Bulatov, A.; Locatelli, M.; Carradori, S.; Andruch, V. Microchemical Journal 2017, 135, 33-38.
14. Paiva, A.; Craveiro, R.; Aroso, I.; Martins, M.; Reis, R. L.; Duarte, A. R. C. ACS Sustainable Chemistry & Engineering 2014, 2, (5), 1063-1071.
15. Zainal-Abidin, M. H.; Hayyan, M.; Hayyan, A.; Jayakumar, N. S. Analytica Chimica Acta 2017, 979, 1-23.
16. Qin, H.; Panzer, M. J. ChemElectroChem 2017, 4, (10), 2556-2562.
17. Maugeri, Z.; Marıa, P. D. d. RSC Advances 2012, 2, 421-425.
18. Abbott, A. P.; Boothby, D.; Capper, G.; Davies, D. L.; Rasheed, R. K. J. Amer. Chem. Soc. 2004, 126, (29), 9142-9147.

60
19. Florindo, C.; Oliveira, F. S.; Rebelo, L. P. N.; Fernandes, A. M.; Marrucho, I. M. ACS Sustainable Chemistry & Engineering 2014, 2, (10), 2416-2425.
20. Ribeiro, B. D.; Florindo, C.; Iff, L. C.; Coelho, M. A. Z.; Marrucho, I. M. ACS Sustainable Chemistry & Engineering 2015, 3, (10), 2469-2477.
21. Isik, M.; Ruiperez, F.; Sardon, H.; Gonzalez, A.; Zulfiqar, S.; Mecerreyes, D. Macromolecular Rapid Communications 2016, 37, (14), 1135-1142.
22. Isik, M.; Zulfiqar, S.; Edhaim, F.; Ruiperez, F.; Rothenberger, A.; Mecerreyes, D. ACS Sustainable Chemistry & Engineering 2016, 4, (12), 7200-7208.
23. Sze, L. L.; Pandey, S.; Ravula, S.; Pandey, S.; Zhao, H.; Baker, G. A.; Baker, S. N. ACS Sustainable Chemistry & Engineering 2014, 2, (9), 2117-2123.
24. Sanchez-Leija, R. J.; Pojman, J. A.; Luna-Barcenas, G.; Mota-Morales, J. D. J. Mater. Chem. B 2014, 2, (43), 7495-7501.
25. Serrano, M. C.; Gutierrez, M. C.; Jimenez, R.; Ferrer, M. L.; Monte, F. d. Chemical Communications 2012, 48, (4), 579-581.
26. Mukesh, C.; Upadhyay, K. K.; Devkar, R. V.; Chudasama, N. A.; Raol, G. G.; Prasad, K. Macromolecular Chemistry and Physics 2016, 217, (17), 1899-1906.
27. Abbott, A. P.; Bell, T. J.; Handa, S.; Stoddart, B. Green Chemistry 2006, 8, (9), 784-786.
28. Hong, S.; Lian, H.; Sun, X.; Pan, D.; Carranza, A.; Pojman, J. A.; Mota-Morales, J. D. RSC Advances 2016, 6, (92), 89599-89608.
29. Lian, H.; Hong, S.; Carranza, A.; Mota-Morales, J. D.; Pojman, J. A. RSC Adv. 2015, 5, (36), 28778-28785.
30. Sharma, M.; Mukesh, C.; Mondal, D.; Prasad, K. RSC Advances 2013, 3, (39), 18149-18155.
31. Liu, Y.; Guo, B.; Xia, Q.; Meng, J.; Chen, W.; Liu, S.; Wang, Q.; Liu, Y.; Li, J.; Yu, H. ACS Sustainable Chemistry & Engineering 2017, 5, (9), 7623-7631.
32. Cui, Y.; Li, M.-C.; Wu, Q.; Pojman, J. A.; Kuroda, D. G. ACS Appl. Mater. Interfaces 2017, 9, (39), 33549-33553.
33. Warrag, S. E. E.; Peters, C. J.; Kroon, M. C. Current Opinion in Green and Sustainable Chemistry 2017, 5, 55-60.
34. Bednarz, S.; Fluder, M.; Galica, M.; Bogdal, D.; Maciejaszek, I. Journal of Applied Polymer Science 2014, 131, (16), 40608.

61
35. Zahn, S.; Kirchner, B.; Mollenhauer, D. ChemPhysChem 2016, 17, (21), 3354-3358.
36. Cui, Y.; Kuroda, D. G. The Journal of Physical Chemistry A 2018, 122, (5), 1185-1193.
37. Hammond, O. S.; Bowron, D. T.; Edler, K. J. Green Chemistry 2016, 18, (9), 2736-2744.
38. Hammond, O. S.; Bowron, D. T.; Edler, K. J. Angewandte Chemie International Edition 2017, 56, (33), 9782-9785.
39. D'Agostino, C.; Harris, R. C.; Abbott, A. P.; Gladden, L. F.; Mantle, M. D. Physical Chemistry Chemical Physics 2011, 13, (48), 21383-21391.
40. Perkins, S. L.; Painter, P.; Colina, C. M. Journal of Chemical & Engineering Data 2014, 59, (11), 3652-3662.
41. Perez-Garcia, M. G.; Carranza, A.; Puig, J. E.; Pojman, J. A.; del Monte, F.; Luna-Barcenas, G.; Mota-Morales, J. D. RSC Adv. 2015, 5, (30), 23255-23260.
42. Abbott, A. P.; Boothby, D.; Capper, G.; Davies, D. L.; Rasheed, R. K. Journal of the American Chemical Society 2004, 126, (29), 9142-9147.
43. Carranza, A.; Pojman, J. A.; Mota-Morales, J. D. RSC Advances 2014, 4, (78), 41584-41587.
44. Gutiérrez, M. C.; Carriazo, D.; Tamayo, A.; Jiménez, R.; Picó, F.; Rojo, J. M.; Ferrer, M. L.; del Monte, F. Chemistry – A European Journal 2011, 17, (38), 10533-10537.
45. Mota-Morales, J. D.; Gutierrez, M. C.; Sanchez, I. C.; Luna-Barcenas, G.; del Monte, F. Chem. Comm. 2011, 47, (18), 5328-5330.
46. Mukesh, C.; Gupta, R.; Srivastava, D. N.; Nataraj, S. K.; Prasad, K. RSC Advances 2016, 6, (34), 28586-28592.
47. Wang, J.; Han, J.; Khan, M. Y.; He, D.; Peng, H.; Chen, D.; Xie, X.; Xue, Z. Polymer Chemistry 2017, 8, (10), 1616-1627.
48. Mendonça, P. V.; Lima, M. S.; Guliashvili, T.; Serra, A. C.; Coelho, J. F. J. Polymer 2017, 132, 114-121.
49. Maximiano, P.; Mendonça, P. V.; Santos, M. R. E.; Costa, J. R. C.; Guliashvili, T.; Serra, A. C.; Coelho, J. F. J. Journal of Polymer Science Part A: Polymer Chemistry 2017, 55, (3), 371-381.

62
50. Sanchez-Leija, R. J.; Torres-Lubian, J. R.; Resendiz-Rubio, A.; Luna-Barcenas, G.; Mota-Morales, J. D. RSC Advances 2016, 6, (16), 13072-13079.
51. Carranza, A.; Pérez-García, M. G.; Song, K.; Jeha, G. M.; Diao, Z.; Jin, R.; Bogdanchikova, N.; Soltero, A. F.; Terrones, M.; Wu, Q.; Pojman, J. A.; Mota-Morales, J. D. ACS Appl. Mater. Interfaces 2016, 8, (45), 31295-31303.
52. Carranza, A.; Romero-Perez, D.; Almanza-Reyes, H.; Bogdanchikova, N.; Juarez-Moreno, K.; Pojman, J. A.; Velasquillo, C.; Mota-Morales, J. D. Adv. Mater. Interfaces 2017, 1700094-n/a.
53. Gutiérrez, M. C.; Rubio, F.; del Monte, F. Chemistry of Materials 2010, 22, (9), 2711-2719.
54. Carriazo, D.; Gutiérrez, M. C.; Ferrer, M. L.; del Monte, F. Chemistry of Materials 2010, 22, (22), 6146-6152.
55. Gutierrez, M. C.; Carriazo, D.; Ania, C. O.; Parra, J. B.; Ferrer, M. L.; del Monte, F. Energy & Environmental Science 2011, 4, (9), 3535-3544.
56. García-Argüelles, S.; Serrano, M. C.; Gutiérrez, M. C.; Ferrer, M. L.; Yuste, L.; Rojo, F.; del Monte, F. Langmuir 2013, 29, (30), 9525-9534.
57. Li, R. a.; Chen, G.; He, M.; Tian, J.; Su, B. Journal of Materials Chemistry C 2017, 5, (33), 8475-8481.
58. Mota-Morales, J. D.; Gutiérrez, M. C.; Ferrer, M. L.; Sanchez, I. C.; Elizalde-Peña, E. A.; Pojman, J. A.; Monte, F. D.; Luna-Bárcenas, G. J. Polym. Sci. Part A: Polym. Chem. 2013, 51, 1767–1773.
59. Mota-Morales, J. D.; Gutierrez, M. C.; Ferrer, M. L.; Jimenez, R.; Santiago, P.; Sanchez, I. C.; Terrones, M.; Del Monte, F.; Luna-Barcenas, G. J. Mater. Chem. A, 2013, 1, (12), 3970-3976.
60. Azizi, N.; Batebia, E. Catalysis Science & Technology 2012, 2, 2445-2448.
61. Bednarz, S.; Błaszczyk, A.; Błazejewska, D.; Bogdał, D. Catalysis Today 2014.
62. Pojman, J. A., Frontal Polymerization. In Polymer Science: A Comprehensive Reference, Matyjaszewski, K.; Möller, M., Eds. Elsevier BV: Amsterdam, 2012; Vol. 4, pp 957–980.
63. Trommsdorff, E.; Köhle, H.; Lagally, P. Makromol. Chem. 1948, 1, 169-198.
64. Norrish, R. G. W.; Smith, R. R. Nature 1942, 150, 336-337.
65. Jee, E.; Bánsági, T.; Taylor, A. F.; Pojman, J. A. Angew. Chem. 2016, 128, (6), 2167-2171.

63
66. Terrones, G.; Pearlstein, A. J. Macromolecules 2001, 34, 3195-3204.
67. Terrones, G.; Pearlstein, A. J. Macromoleules 2004, 37, 1565-1575.
68. Chechilo, N. M.; Khvilivitskii, R. J.; Enikolopyan, N. S. Dokl. Akad. Nauk SSSR 1972, 204, (N5), 1180-1181.
69. Chechilo, N. M.; Enikolopyan, N. S. Dokl. Phys. Chem. 1976, 230, 840-843.
70. Holt, T.; Fazende, K.; Jee, E.; Wu, Q.; Pojman, J. A. J. Appl. Polym. Sci. 2016, 133, (40), 44064.
71. Totaro, N. P.; Murphy, Z. D.; Burcham, A. E.; King, C. T.; Scherr, T. F.; Bounds, C. O.; Dasa, V.; Pojman, J. A.; Hayes, D. J. J. Biomed. Mater. Res. Part A: Appl. Biomater. 2016, 104, 1152–1160.
72. Alzari, V.; Monticelli, O.; Nuvoli, D.; Kenny, J. M.; Mariani, A. Biomacromolecules 2009, 10, (9), 2672-2677.
73. Scognamillo, S.; Alzari, V.; Nuvoli, D.; Illescas, J.; Marceddu, S.; Mariani, A. J. Polym. Sci. Part A: Polym. Chem. 2011, 49, (5), 1228-1234.
74. Sanna, R.; Alzari, V.; Nuvoli, D.; Scognamillo, S.; Marceddu, S.; Mariani, A. J. Polym. Sci. Part A: Polym. Chem. 2012, 50, (8), 1515-1520.
75. Nuvoli, L.; Sanna, D.; Alzari, V.; Nuvoli, D.; Sanna, V.; Malfatti, L.; Mariani, A. J. Polym. Sci. A Polym. Chem. 2016, 54, (14), 2166-2170.
76. Tang, W.-Q.; Mao, L.-H.; Zhou, Z.-F.; Wang, C.-F.; Chen, Q.-L.; Chen, S. Colloid Polym. Sci. 2014, 292, 2529-2537.
77. Tu, J.; Chen, L.; Fang, Y.; Wang, C.; Chen, S. Journal of Polymer Science Part A: Polymer Chemistry 2010, 48, (4), 823-831.
78. Du, X.-Y.; Liu, S.-S.; Wang, C.-F.; Wu, G.; Chen, S. Journal of Polymer Science Part A: Polymer Chemistry 2017, n/a-n/a.
79. Chekanov, Y. A.; Pojman, J. A. J. Appl. Polym. Sci. 2000, 78, 2398-2404.
80. Masere, J.; Lewis, L. L.; Pojman, J. A. J. Appl. Polym. Sci. 2001, 80, 686-691.
81. Nuvoli, D.; Alzari, V.; Pojman, J.; Sanna, V.; Ruiu, A.; Sanna, D.; Malucelli, G.; Mariani, A. ACS Appl. Mater. Interfaces 2015, 7, 3600−3606.
82. Scognamillo, S.; Bounds, C.; Luger, M.; Mariani, A.; Pojman, J. A. J. Polym. Sci. Part A: Polym. Chem. 2010, 48, (9), 2000-2005.
83. Scognamillo, S.; Bounds, C.; Thakuri, S.; Mariani, A.; Wu, Q.; Pojman, J. A. J. Appl. Polym. Sci. 2014, 131, 40339-40349.

64
84. Bomze, D.; Knaack, P.; Liska, R. Polym. Chem. 2015, 6, 8161-8167.
85. Mariani, A.; Bidali, S.; Fiori, S.; Sangermano, M.; Malucelli, G.; Bongiovanni, R.; Priola, A. J. Poly. Sci. Part A. Polym. Chem. 2004, 42, 2066-2072.
86. Chen, S.; Sui, J.; Chen, L.; Pojman, J. A. J. Polym. Sci. Part A Polym. Chem. 2005, 43, 1670-1680.
87. Z. Chen, P. L., L. Shi, Z. X. Huang, B. Y. Jiang. Applied Mechanics and Materials 2014, 692, 416-419.
88. Li, S.; Huang, H.; Tao, M.; Liu, X.; Cheng, T. J. Appl. Poly. Sci. 2013, 129, (6), 3737-3745.
89. Alzari, V.; Nuvoli, D.; Scognamillo, S.; Piccinini, M.; Gioffredi, E.; Malucelli, G.; Marceddu, S.; Sechi, M.; Sanna, V.; Mariani, A. J. Mater. Chem. 2011, 21, (24), 8727-8733.
90. Crivello, J. V.; Bulut, U. Designed Monomers & Polymers 2005, 8, 517-531.
91. Crivello, J. V.; Bulut, U. J. Polym. Sci. Part A: Polym. Chem. 2006, 44, 6750-6764.
92. Crivello, J. V.; Falk, B.; Zonca Jr., M. R. J. Poly. Sci. Part A. Polym. Chem. 2004, 42, 1630-1646.
93. Falk, B.; Zonca, M. R.; Crivello, J. V. Macromolecular Symposia 2005, 226, 97-108.
94. Mariani, A.; Fiori, S.; Chekanov, Y.; Pojman, J. A. Macromolecules 2001, 34, 6539-6541.
95. Ruiu, A.; Sanna, D.; Alzari, V.; Nuvoli, D.; Mariani, A. J. Poly. Sci. Part A. Poly. Chem. 2014, 52, (19), 2776-2780.
96. Bidali, S.; Fiori, S.; Malucelli, G.; Mariani, A. e-Polymers 2003, 060, 1-12.
97. Pojman, J. A.; Varisli, B.; Perryman, A.; Edwards, C.; Hoyle, C. Macromolecules 2004, 37, 691-693.
98. Hoyle, C. E.; Lee, T. Y.; Roper, T. J. Poly. Sci. Part A. Polym. Chem. 2004, 52, 5301-5338.
99. Viner, V.; Pojman, J. A. J. Polym. Sci. Part A: Polym. Chem. 2011, 49, 4556–4561.
100. Viner, V.; Viner, G. J. Phys. Chem. B 2011, 115, 6862–6867.
101. Crivello, J. V. J. Polym. Sci. Part A Polym. Chem. 2007, 45, 4331–4340.

65
102. Carranza, A.; Gewin, M.; Pojman, J. A. Chaos 2014, 24, 023118.
103. Washington, R. P.; Steinbock, O. J. Am. Chem. Soc. 2001, 123, 7933-7934.
104. Pojman, J. A.; Curtis, G.; Ilyashenko, V. M. J. Am. Chem. Soc. 1996, 118, 3783-3784.
105. Fortenberry, D. I.; Pojman, J. A. Journal of Polymer Science Part A: Polymer Chemistry 2000, 38, (7), 1129-1135.
106. Asakura, K.; Nihei, E.; Harasawa, H.; Ikumo, A.; Osanai, S., Spontaneous Frontal Polymerization: Propagating Front Spontaneously Generated by Locally Autoaccelerated Free-Radical Polymerization. In Nonlinear Dynamics in Polymeric Systems, ACS Symposium Series No. 869, Pojman, J. A.; Tran-Cong-Miyata, Q., Eds. American Chemical Society: American Chemical Society, 2003; pp 135-146.
107. Wasserscheid, P.; Keim, W. Angew. Chem Int. Ed. Engl. 2000, 39, 3772-3789.
108. Yan, T.; Burnham, C. J.; Popolo, M. G. D.; Voth, G. A. Journal of Physical Chemistry B 2004, 108, (32), 11877-11881.
109. Abbott, A. P.; Capper, G.; Davies, D. L.; Rasheed, R. Inorganic Chemistry 2004, 43, (11), 3447-3452.
110. Pojman, J. A.; Ilyashenko, V. M.; Khan, A. M. J. Chem. Soc. Faraday Trans. 1996, 92, 2825-2837.
111. Pojman, J. A.; Willis, J. R.; Khan , A. M.; West, W. W. J. Polym. Sci. Part A: Polym Chem. 1996, 34, 991-995.
112. Viner, V. G.; Pojman, J. A.; Golovaty, D. Physica D: Nonlinear Phenomena 2010, 239, 838-847.
113. Strehmel, V.; Laschewsky, A.; Wetzel, H.; Gornitz, E. Macromolecules 2006, 39, 923-930.
114. Woecht, I.; Schmidt-Naake, G.; Beuermann, S.; Buback, M.; García, N. Journal of Polymer Science Part A: Polymer Chemistry 2008, 46, (4), 1460-1469.
115. Jeličić, A.; Köhler, F.; Winter, A.; Beuermann, S. Journal of Polymer Science Part A: Polymer Chemistry 2010, 48, (14), 3188-3199.
116. DOW Acrylic Acid, Glacial. http://msdssearch.dow.com/PublishedLiteratureDOWCOM/dh_099c/0901b8038099c42d.pdf?filepath=acrylates/pdfs/noreg/745-00106.pdf&fromPage=GetDoc (25 February),

66
117. Jansen, J.; Dias, A.; Dorschu, M.; Coussens, B. Macromolecules 2003, 36, 3861-3873.
118. Chemical, M. G. Methacrylic Acid. http://www.mgc.co.jp/eng/products/lm/08.html (25 February),

67
APPENDIX A. PERMISSION FOR REPRODUCTION OF CHAPTER 2
JOHN WILEY AND SONS LICENSE TERMS AND CONDITIONS
Apr 04, 2018
License Number 4322010794094
License date Apr 04, 2018
Licensed Content Publisher John Wiley and Sons
Licensed Content Publication Journal of Polymer Science Part A: Polymer
Chemistry
Licensed Content Title Frontal Polymerization of Deep Eutectic Solvents
Composed of Acrylic and Methacrylic Acids
Licensed Content Author Kylee F. Fazende, Manysa Phachansitthi, Josué D.
Mota‐Morales, John A. Pojman
Licensed Content Date Oct 12, 2017
Licensed Content Pages 5
Type of use Dissertation/Thesis
Requestor type Author of this Wiley article
Format Electronic
Portion Full article
Will you be translating? No

68
Title of your thesis / dissertation Free-Radical Polymerization of Acid-Containing Deep
Eutectic Solvents
Expected completion date Aug 2018
Expected size (number of
pages)
100
Requestor Location Kylee Fazende
213 Choppin Hall
BATON ROUGE, LA 70803
United States
Attn: Kylee Fazende
Publisher Tax ID EU826007151
Total 0.00 USD
TERMS AND CONDITIONS
This copyrighted material is owned by or exclusively licensed to John Wiley & Sons, Inc.
or one of its group companies (each a"Wiley Company") or handled on behalf of a
society with which a Wiley Company has exclusive publishing rights in relation to a
particular work (collectively "WILEY"). By clicking "accept" in connection with completing
this licensing transaction, you agree that the following terms and conditions apply to this
transaction (along with the billing and payment terms and conditions established by the
Copyright Clearance Center Inc., ("CCC's Billing and Payment terms and conditions"),

69
at the time that you opened your RightsLink account (these are available at any time at
http://myaccount.copyright.com).
Terms and Conditions
The materials you have requested permission to reproduce or reuse (the "Wiley
Materials") are protected by copyright.
You are hereby granted a personal, non-exclusive, non-sub licensable (on a stand-
alone basis), non-transferable, worldwide, limited license to reproduce the Wiley
Materials for the purpose specified in the licensing process. This license, and any
CONTENT (PDF or image file) purchased as part of your order, is for a one-time use
only and limited to any maximum distribution number specified in the license. The first
instance of republication or reuse granted by this license must be completed within two
years of the date of the grant of this license (although copies prepared before the end
date may be distributed thereafter). The Wiley Materials shall not be used in any other
manner or for any other purpose, beyond what is granted in the license. Permission is
granted subject to an appropriate acknowledgement given to the author, title of the
material/book/journal and the publisher. You shall also duplicate the copyright notice
that appears in the Wiley publication in your use of the Wiley Material. Permission is
also granted on the understanding that nowhere in the text is a previously published
source acknowledged for all or part of this Wiley Material. Any third party content is
expressly excluded from this permission.
With respect to the Wiley Materials, all rights are reserved. Except as expressly granted
by the terms of the license, no part of the Wiley Materials may be copied, modified,
adapted (except for minor reformatting required by the new Publication), translated,
70
reproduced, transferred or distributed, in any form or by any means, and no derivative
works may be made based on the Wiley Materials without the prior permission of the
respective copyright owner.For STM Signatory Publishers clearing permission under the
terms of the STM Permissions Guidelines only, the terms of the license are extended to
include subsequent editions and for editions in other languages, provided such editions
are for the work as a whole in situ and does not involve the separate exploitation of the
permitted figures or extracts, You may not alter, remove or suppress in any manner any
copyright, trademark or other notices displayed by the Wiley Materials. You may not
license, rent, sell, loan, lease, pledge, offer as security, transfer or assign the Wiley
Materials on a stand-alone basis, or any of the rights granted to you hereunder to any
other person.
The Wiley Materials and all of the intellectual property rights therein shall at all times
remain the exclusive property of John Wiley & Sons Inc, the Wiley Companies, or their
respective licensors, and your interest therein is only that of having possession of and
the right to reproduce the Wiley Materials pursuant to Section 2 herein during the
continuance of this Agreement. You agree that you own no right, title or interest in or to
the Wiley Materials or any of the intellectual property rights therein. You shall have no
rights hereunder other than the license as provided for above in Section 2. No right,
license or interest to any trademark, trade name, service mark or other branding
("Marks") of WILEY or its licensors is granted hereunder, and you agree that you shall
not assert any such right, license or interest with respect thereto
NEITHER WILEY NOR ITS LICENSORS MAKES ANY WARRANTY OR
REPRESENTATION OF ANY KIND TO YOU OR ANY THIRD PARTY, EXPRESS,

71
IMPLIED OR STATUTORY, WITH RESPECT TO THE MATERIALS OR THE
ACCURACY OF ANY INFORMATION CONTAINED IN THE MATERIALS, INCLUDING,
WITHOUT LIMITATION, ANY IMPLIED WARRANTY OF MERCHANTABILITY,
ACCURACY, SATISFACTORY QUALITY, FITNESS FOR A PARTICULAR PURPOSE,
USABILITY, INTEGRATION OR NON-INFRINGEMENT AND ALL SUCH
WARRANTIES ARE HEREBY EXCLUDED BY WILEY AND ITS LICENSORS AND
WAIVED BY YOU.
WILEY shall have the right to terminate this Agreement immediately upon breach of this
Agreement by you.
You shall indemnify, defend and hold harmless WILEY, its Licensors and their
respective directors, officers, agents and employees, from and against any actual or
threatened claims, demands, causes of action or proceedings arising from any breach
of this Agreement by you.
IN NO EVENT SHALL WILEY OR ITS LICENSORS BE LIABLE TO YOU OR ANY
OTHER PARTY OR ANY OTHER PERSON OR ENTITY FOR ANY SPECIAL,
CONSEQUENTIAL, INCIDENTAL, INDIRECT, EXEMPLARY OR PUNITIVE
DAMAGES, HOWEVER CAUSED, ARISING OUT OF OR IN CONNECTION WITH
THE DOWNLOADING, PROVISIONING, VIEWING OR USE OF THE MATERIALS
REGARDLESS OF THE FORM OF ACTION, WHETHER FOR BREACH OF
CONTRACT, BREACH OF WARRANTY, TORT, NEGLIGENCE, INFRINGEMENT OR
OTHERWISE (INCLUDING, WITHOUT LIMITATION, DAMAGES BASED ON LOSS OF
PROFITS, DATA, FILES, USE, BUSINESS OPPORTUNITY OR CLAIMS OF THIRD
PARTIES), AND WHETHER OR NOT THE PARTY HAS BEEN ADVISED OF THE

72
POSSIBILITY OF SUCH DAMAGES. THIS LIMITATION SHALL APPLY
NOTWITHSTANDING ANY FAILURE OF ESSENTIAL PURPOSE OF ANY LIMITED
REMEDY PROVIDED HEREIN.
Should any provision of this Agreement be held by a court of competent jurisdiction to
be illegal, invalid, or unenforceable, that provision shall be deemed amended to achieve
as nearly as possible the same economic effect as the original provision, and the
legality, validity and enforceability of the remaining provisions of this Agreement shall
not be affected or impaired thereby.
The failure of either party to enforce any term or condition of this Agreement shall not
constitute a waiver of either party's right to enforce each and every term and condition
of this Agreement. No breach under this agreement shall be deemed waived or excused
by either party unless such waiver or consent is in writing signed by the party granting
such waiver or consent. The waiver by or consent of a party to a breach of any provision
of this Agreement shall not operate or be construed as a waiver of or consent to any
other or subsequent breach by such other party.
This Agreement may not be assigned (including by operation of law or otherwise) by
you without WILEY's prior written consent.
Any fee required for this permission shall be non-refundable after thirty (30) days from
receipt by the CCC.
These terms and conditions together with CCC's Billing and Payment terms and
conditions (which are incorporated herein) form the entire agreement between you and
WILEY concerning this licensing transaction and (in the absence of fraud) supersedes
73
all prior agreements and representations of the parties, oral or written. This Agreement
may not be amended except in writing signed by both parties. This Agreement shall be
binding upon and inure to the benefit of the parties' successors, legal representatives,
and authorized assigns.
In the event of any conflict between your obligations established by these terms and
conditions and those established by CCC's Billing and Payment terms and conditions,
these terms and conditions shall prevail.
WILEY expressly reserves all rights not specifically granted in the combination of (i) the
license details provided by you and accepted in the course of this licensing transaction,
(ii) these terms and conditions and (iii) CCC's Billing and Payment terms and conditions.
This Agreement will be void if the Type of Use, Format, Circulation, or Requestor Type
was misrepresented during the licensing process.
This Agreement shall be governed by and construed in accordance with the laws of the
State of New York, USA, without regards to such state's conflict of law rules. Any legal
action, suit or proceeding arising out of or relating to these Terms and Conditions or the
breach thereof shall be instituted in a court of competent jurisdiction in New York
County in the State of New York in the United States of America and each party hereby
consents and submits to the personal jurisdiction of such court, waives any objection to
venue in such court and consents to service of process by registered or certified mail,
return receipt requested, at the last known address of such party.
Other Terms and Conditions:
v1.10 Last updated September 2015


75
APPENDIX B. FRONT TEMPERATURE PROFILES
This appendix gives all front temperature profiles for the experiments in Chapter
2. Figures B.1 – B.6 are AA-ChCl, and Figures B.7 – B.12 are MAA-ChCl. Figures B.13
– B.15 are the AA-Analog samples. MAA-Analog and stearic acid in general have no
profiles as no fronts were successful.
B.1 FT PROFILES FOR AA-CHCL VARIED INITIATOR SAMPLES
Figure B.1. FT profiles for 0.2% L231 AA-ChCl FP.
0
50
100
150
200
0 200 400 600 800
Tem
pera
ture
(°C
)
Time (s)
2-69-2 2-69-4 2-69-5

76
Figure B.2. FT profiles for 0.3% L231 AA-ChCl FP.
Figure B.3. FT profiles for 0.8% L231 AA-ChCl FP.
0
20
40
60
80
100
120
140
160
180
200
0 100 200 300 400 500 600
Tem
pera
ture
(°C
)
Time (s)
FT-AA-CCl-1 FT-AA-CCl-2
FT-AA-CCl-3 FT-AA-CCl-4
0
50
100
150
200
250
0 100 200 300 400 500
Tem
pera
ture
(°C
)
Time (s)
2-35-1 2-35-7 2-35-10

77
Figure B.4. FT profiles for 1.7% L231 AA-ChCl FP.
Figure B.5. FT profiles for 2.5% L231 AA-ChCl FP.
0
50
100
150
200
250
0 50 100 150 200 250
Tem
pera
ture
(°C
)
Time (s)
2-41-1 2-41-3 2-41-7 2-41-10 2-41-11
0
50
100
150
200
250
100 150 200 250 300
Tem
pera
ture
(ºC
)
Time (s)
2-41-2 2-41-5 2-41-8 2-41-13 2-41-14

78
Figure B.6. FT profiles for 3.3% L231 AA-ChCl FP.
B.2 FT PROFILES FOR MAA-CHCL VARIED INITIATOR SAMPLES
Figure B.7. FT profiles for 0.2% L231 MAA-ChCl FP.
0
50
100
150
200
250
0 50 100 150 200 250
Tem
patu
re (°C
)
Time (s)
2-51-1 2-51-2 2-51-3 2-51-4
0
20
40
60
80
100
120
140
0 200 400 600 800 1000 1200
Tem
pera
ture
(°C
)
Time (s)
2-28-5 2-28-7 2-28-9 2-34-4

79
Figure B.8. FT profiles for 0.3% L231 MAA-ChCl FP.
Figure B.9. FT profiles for 0.8% L231 MAA-ChCl FP.
0
20
40
60
80
100
120
140
160
0 100 200 300 400 500 600
Tem
pera
ture
(°C
)
Time (s)
2-162-5 2-162-6 2-162-8
0
20
40
60
80
100
120
140
160
0 200 400 600 800 1000
Tem
pera
ture
(°C
)
Time (s)
2-28-4 2-34-1 2-34-2 2-34-3 2-34-5

80
Figure B.10. FT profiles for 1.7% L231 MAA-ChCl FP.
Figure B.11. FT profiles for 2.5% L231 MAA-ChCl FP.
0
20
40
60
80
100
120
140
160
180
0 200 400 600 800
Tem
pera
ture
(ºC
)
Time (s)
2-19-2 2-19-7 2-19-8 2-19-12 2-19-13
0
20
40
60
80
100
120
140
160
180
0 100 200 300 400 500 600 700
Tem
pera
ture
(°C
)
Time (s)
2-19-10 2-19-15 2-19-16 2-19-17 2-19-18
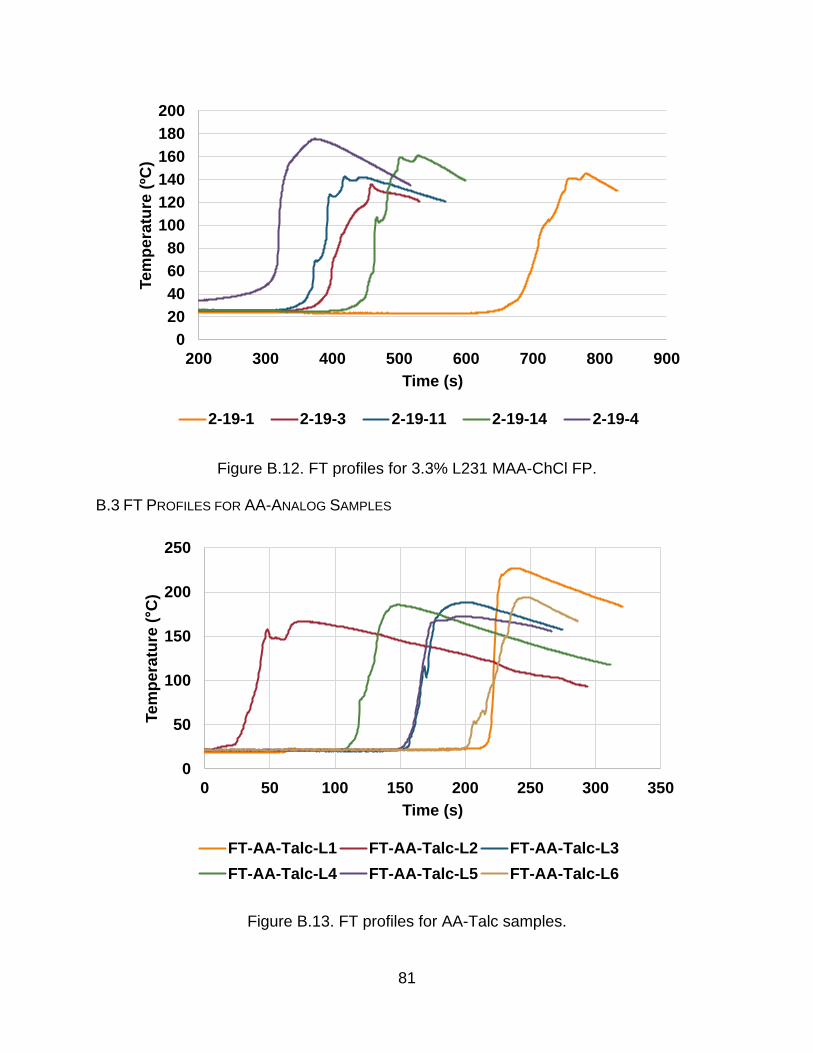
81
Figure B.12. FT profiles for 3.3% L231 MAA-ChCl FP.
B.3 FT PROFILES FOR AA-ANALOG SAMPLES
Figure B.13. FT profiles for AA-Talc samples.
0
20
40
60
80
100
120
140
160
180
200
200 300 400 500 600 700 800 900
Tem
pera
ture
(ºC
)
Time (s)
2-19-1 2-19-3 2-19-11 2-19-14 2-19-4
0
50
100
150
200
250
0 50 100 150 200 250 300 350
Te
mp
era
ture
(°C
)
Time (s)
FT-AA-Talc-L1 FT-AA-Talc-L2 FT-AA-Talc-L3
FT-AA-Talc-L4 FT-AA-Talc-L5 FT-AA-Talc-L6

82
Figure B.14. FT profiles for AA-DMSO samples with increased silica.
Figure B.15. FT profiles for AA-LA with increased silica.
0
20
40
60
80
100
120
140
160
180
200
0 100 200 300 400 500 600 700
Tem
pera
ture
(°C
)
Time (s)
2-91-4 2-91-5 2-91-6
0
50
100
150
0 200 400 600 800 1000
Tem
pera
ture
(°C
)
Time (s)
2-91-1 2-91-2 2-91-3

83
APPENDIX C. FRONT VELOCITY POSITION VERSUS TIME PLOTS
For all front velocity plots, the unit of time plotted is seconds due to the method of
data recording from the video. The conversion to the reported units of cm*min-1 is
performed after the FV is calculated from the slope of the line. Figures C.1 – C.6 are
AA-ChCl at the various monomer concentrations, and Figures C.7 – C.12 are MAA-
ChCl. Figures C.13 – C.15 are the AA-Analog samples. Again, MAA-Analog and stearic
acid in general have no plots as no fronts were successful.
C.1 FV PROFILES FOR AA-CHCL VARIED INITIATOR SAMPLES
Figure C.1. Position versus time plots for 0.2% L231 AA-ChCl FP.
y = 0.0279x + 13.722
y = 0.0259x + 13.229
y = 0.0245x + 14.716
y = 0.027x + 13.551
0
5
10
15
20
25
0 50 100 150 200 250 300 350 400
Po
sit
ion
(cm
)
Time (s)
2-48-10 2-48-9 2-48-7
2-48-5 Linear (2-48-10) Linear (2-48-9)
Linear (2-48-7) Linear (2-48-5)

84
Figure C.2. Position versus time plots for 0.3% L231 AA-ChCl FP.
Figure C.3. Position versus time plots for 0.8% L231 AA-ChCl FP.
y = 0.0271x + 20.592
y = 0.0327x + 20.445
y = 0.0302x + 17.383
y = 0.0238x + 17.42917
19
21
23
25
27
29
31
50 150 250 350 450
Po
sit
ion
(cm
)
Time (s)
FV-AA-CCl-3L FV-AA-CCl-2L
FV-AA-CCl-5L FV-AA-CCl-4L
Linear (FV-AA-CCl-3L) Linear (FV-AA-CCl-2L)
Linear (FV-AA-CCl-5L) Linear (FV-AA-CCl-4L)
y = 0.0335x + 13.726 y = 0.0317x + 13.293
y = 0.0314x + 13.863
y = 0.0329x + 8.724
0
5
10
15
20
25
0 50 100 150 200 250 300
Po
sit
ion
(cm
)
Time (s)
2-48-12 2-48-8 2-48-6
2-48-3 Linear (2-48-12) Linear (2-48-8)
Linear (2-48-6) Linear (2-48-3)

85
Figure C.4. Position versus time plots for 1.7% L231 AA-ChCl FP.
Figure C.5. Position versus time plots for 2.5% L231 AA-ChCl FP.
y = 0.0353x + 8.4547
y = 0.0286x + 8.5042
y = 0.0249x + 8.2576
y = 0.0185x + 6.24960
2
4
6
8
10
12
14
16
18
0 100 200 300 400 500
Po
sit
ion
(cm
)
Time (s)
2-48-13 2-45-11 2-45-9
2-48-2 Linear (2-48-13) Linear (2-45-11)
Linear (2-45-9) Linear (2-48-2)
y = 0.0344x + 7.5163
y = 0.0414x + 7.1084
y = 0.0246x + 7.3024
y = 0.0338x + 7.222
7
9
11
13
15
17
19
0 100 200 300 400 500
Po
sit
ion
(cm
)
Time (s)
2-48-15 2-48-14 2-45-10
2-48-1 Linear (2-48-15) Linear (2-48-14)
Linear (2-45-10) Linear (2-48-1)

86
Figure C.6. Position versus time plots for 3.3% L231 AA-ChCl FP.
C.2 FV PROFILES FOR MAA-CHCL VARIES INITIATOR SAMPLES
Figure C.7. Position versus time plots for 0.2% L231 MAA-ChCl FP.
y = 0.0294x + 11.774
y = 0.0233x + 10.955
y = 0.028x + 12.572
y = 0.0323x + 12.363
0
5
10
15
20
25
0 100 200 300 400 500
Po
sit
ion
(cm
)
Time (s)
2-45-14 2-45-13 2-45-12
2-48-11 Linear (2-45-14) Linear (2-45-13)
Linear (2-45-12) Linear (2-48-11)
y = 0.0104x + 13.415
y = 0.0104x + 13.114
y = 0.0111x + 12.543
10
12
14
16
18
20
22
24
0 200 400 600 800 1000
Po
sit
ion
(cm
)
Time (s)
2-66-1 2-66-4 2-66-7
Linear (2-66-1) Linear (2-66-4) Linear (2-66-7)

87
Figure C.8. Position versus time plots for 0.3% L231 MAA-ChCl FP.
Figure C.9. Position versus time plots for 0.8% L231 MAA-ChCl FP.
y = 0.0132x + 14.19
y = 0.0129x + 15.085
y = 0.0138x + 14.291
7
9
11
13
15
17
19
21
0 100 200 300 400 500 600 700
Po
sit
ion
(cm
)
Time (s)
2.162.3 2.162.5 2.162.6
Linear (2.162.3) Linear (2.162.5) Linear (2.162.6)
y = 0.0136x + 12.895
y = 0.0129x + 14.093
y = 0.0158x + 13.206
10
12
14
16
18
20
22
24
0 200 400 600 800
Po
sit
ion
(cm
)
Time (s)
2-66-5 2-66-9 2-69-11
Linear (2-66-5) Linear (2-66-9) Linear (2-69-11)

88
Figure C.10. Position versus time plots for 1.7% L231 MAA-ChCl FP.
Figure C.11. Position versus time plots for 2.5% L231 MAA-ChCl FP.
y = 0.013x + 14.526
y = 0.0144x + 13.373
y = 0.0134x + 13.527
10
12
14
16
18
20
22
24
0 100 200 300 400 500 600 700
Po
sit
ion
(cm
)
Time (s)
MP MAA 3_5 MP MAA 4_5
MP MAA 5_5 Linear (MP MAA 3_5)
Linear (MP MAA 4_5) Linear (MP MAA 5_5)
y = 0.0151x + 12.523
y = 0.0142x + 12.699
y = 0.015x + 12.438
10
12
14
16
18
20
22
24
0 100 200 300 400 500 600 700
Po
sit
ion
(cm
)
Time (s)
2-66-6 2-66-8 2-69-10
Linear (2-66-6) Linear (2-66-8) Linear (2-69-10)

89
Figure C.12. Position versus time plots for 3.3% L231 MAA-ChCl FP.
C.3 FV PROFILES FOR AA-ANALOG SAMPLES
Figure C.13. Position versus time plots for AA-Talc samples.
y = 0.0161x + 13.787
y = 0.0124x + 13.114 y = 0.0128x + 12.456
y = 0.0129x + 13.695
10
12
14
16
18
20
22
24
26
0 200 400 600 800 1000
Po
sit
ion
(cm
)
Time (s)
2.56.1 2-65-2 2-65-3
2-65-4 Linear (2.56.1) Linear (2-65-2)
Linear (2-65-3) Linear (2-65-4)
y = 0.0333x + 12.997
y = 0.0358x + 12.561
y = 0.0366x + 12.09 y = 0.0373x + 11.111
y = 0.0292x + 11.891
14
16
18
20
22
25 75 125 175 225 275
Po
sit
ion
(cm
)
Time (s)
FV-AA-Talc-1L FV-AA-Talc-2L
FV-AA-Talc-3L FV-AA-Talc-4L
FV-AA-Talc-5L Linear (FV-AA-Talc-1L)
Linear (FV-AA-Talc-2L) Linear (FV-AA-Talc-3L)
Linear (FV-AA-Talc-4L) Linear (FV-AA-Talc-5L)

90
Figure C.14. FV plots for AA-DMSO samples with increased silica.
Figure C.15. FV plots for AA-LA with increased silica.
y = 0.0151x + 11.028
y = 0.0154x + 10.522
y = 0.0145x + 10.428
10
12
14
16
18
20
22
24
0 100 200 300 400 500 600 700 800
Po
sit
ion
(cm
)
Time (s)
2-86-1 2-86-2 2-86-3
Linear (2-86-1) Linear (2-86-2) Linear (2-86-3)
y = 0.0118x + 11.148
y = 0.012x + 11.152
y = 0.0071x + 10.732
10
12
14
16
18
20
22
24
0 500 1000 1500 2000
Po
sit
ion
(cm
)
Time (s)
MP-AA-LA HS 1 MP-AA-LA HS 2
MP-AA-LA-HS 3 Linear (MP-AA-LA HS 1)
Linear (MP-AA-LA HS 2) Linear (MP-AA-LA-HS 3)
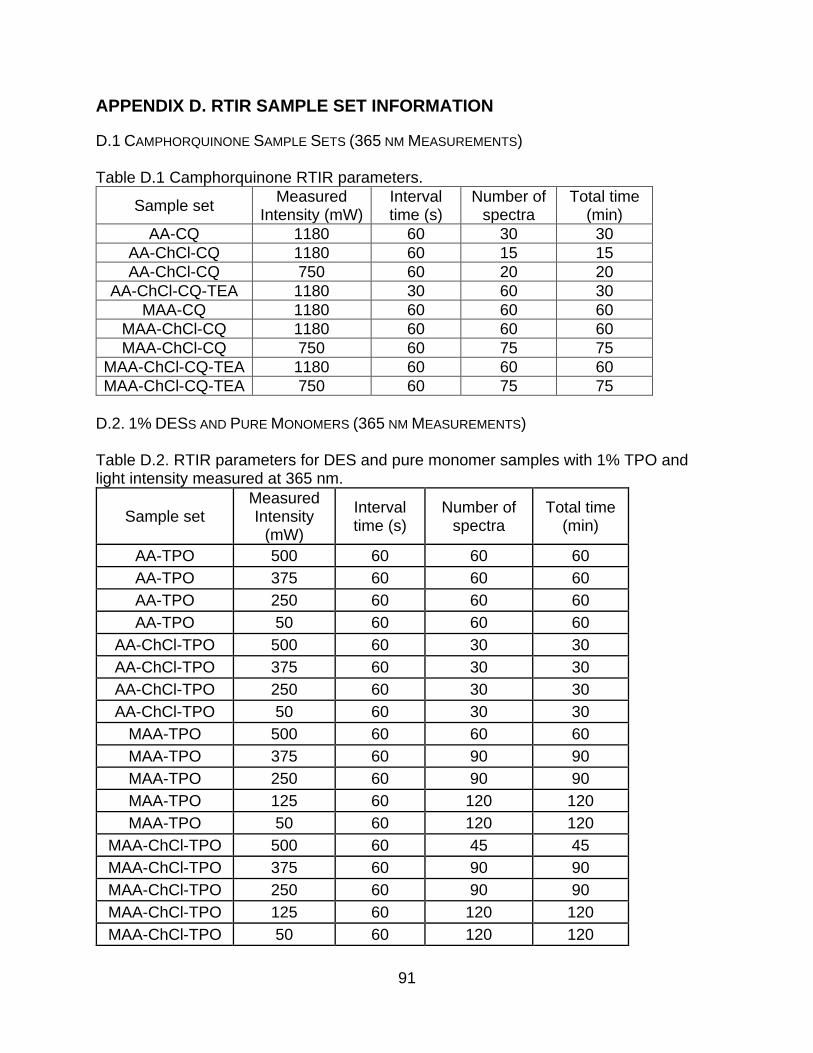
91
APPENDIX D. RTIR SAMPLE SET INFORMATION
D.1 CAMPHORQUINONE SAMPLE SETS (365 NM MEASUREMENTS)
Table D.1 Camphorquinone RTIR parameters.
Sample set Measured
Intensity (mW) Interval time (s)
Number of spectra
Total time (min)
AA-CQ 1180 60 30 30
AA-ChCl-CQ 1180 60 15 15
AA-ChCl-CQ 750 60 20 20
AA-ChCl-CQ-TEA 1180 30 60 30
MAA-CQ 1180 60 60 60
MAA-ChCl-CQ 1180 60 60 60
MAA-ChCl-CQ 750 60 75 75
MAA-ChCl-CQ-TEA 1180 60 60 60
MAA-ChCl-CQ-TEA 750 60 75 75
D.2. 1% DESS AND PURE MONOMERS (365 NM MEASUREMENTS)
Table D.2. RTIR parameters for DES and pure monomer samples with 1% TPO and light intensity measured at 365 nm.
Sample set Measured Intensity
(mW)
Interval time (s)
Number of spectra
Total time (min)
AA-TPO 500 60 60 60
AA-TPO 375 60 60 60
AA-TPO 250 60 60 60
AA-TPO 50 60 60 60
AA-ChCl-TPO 500 60 30 30
AA-ChCl-TPO 375 60 30 30
AA-ChCl-TPO 250 60 30 30
AA-ChCl-TPO 50 60 30 30
MAA-TPO 500 60 60 60
MAA-TPO 375 60 90 90
MAA-TPO 250 60 90 90
MAA-TPO 125 60 120 120
MAA-TPO 50 60 120 120
MAA-ChCl-TPO 500 60 45 45
MAA-ChCl-TPO 375 60 90 90
MAA-ChCl-TPO 250 60 90 90
MAA-ChCl-TPO 125 60 120 120
MAA-ChCl-TPO 50 60 120 120

92
D.3. 0.1% DESS AND PURE MONOMERS (365 NM MEASUREMENTS)
Table D.3. RTIR parameters for DES and pure monomer samples with 0.1% TPO and light intensity measured at 365 nm.
Sample set Measured
Intensity (mW) Interval time (s)
Number of spectra
Total time (min)
AA-TPO 500 30 40 20
AA-TPO 375 30 60 30
AA-TPO 250 30 120 60
AA-TPO 125 30 120 60
AA-TPO 50 30 120 60
AA-ChCl-TPO 500 30 30 15
AA-ChCl-TPO 375 30 30 15
AA-ChCl-TPO 250 30 30 15
AA-ChCl-TPO 125 30 30 15
AA-ChCl-TPO 50 30 40 20
MAA-TPO 500 30 60 30
MAA-TPO 375 30 120 60
MAA-TPO 250 30 120 60
MAA-TPO 125 30 120 60
MAA-TPO 50 30 120 60
MAA-ChCl-TPO 500 30 30 15
MAA-ChCl-TPO 375 30 30 15
MAA-ChCl-TPO 250 30 30 15
MAA-ChCl-TPO 125 30 30 15
MAA-ChCl-TPO 50 30 60 30
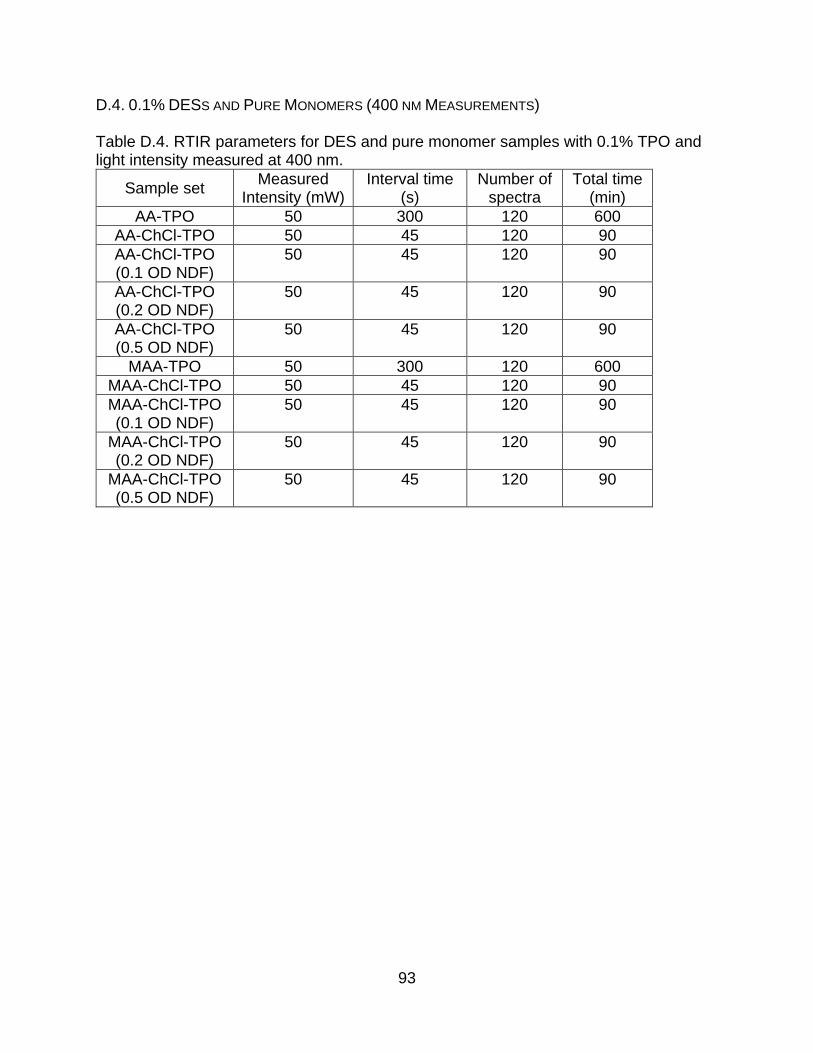
93
D.4. 0.1% DESS AND PURE MONOMERS (400 NM MEASUREMENTS)
Table D.4. RTIR parameters for DES and pure monomer samples with 0.1% TPO and light intensity measured at 400 nm.
Sample set Measured
Intensity (mW) Interval time
(s) Number of
spectra Total time
(min)
AA-TPO 50 300 120 600
AA-ChCl-TPO 50 45 120 90
AA-ChCl-TPO (0.1 OD NDF)
50 45 120 90
AA-ChCl-TPO (0.2 OD NDF)
50 45 120 90
AA-ChCl-TPO (0.5 OD NDF)
50 45 120 90
MAA-TPO 50 300 120 600
MAA-ChCl-TPO 50 45 120 90
MAA-ChCl-TPO (0.1 OD NDF)
50 45 120 90
MAA-ChCl-TPO (0.2 OD NDF)
50 45 120 90
MAA-ChCl-TPO (0.5 OD NDF)
50 45 120 90

94
D.5. METHYL ESTER MONOMER SAMPLE SETS (365 NM MEASUREMENTS)
Table D.5. RTIR parameters for DES and pure monomer methyl ester samples with 1% TPO and light intensity measured at 365 nm.
Sample set Measured
Intensity (mW) Interval time (s)
Number of spectra
Total time (min)
MeA-TPO 500 30 60 30
MeA-TPO 375 30 60 30
MeA-TPO 250 30 120 60
MeA-TPO 125 30 120 60
MeA-TPO 50 30 120 60
MeA-TPO-PA-ChCl 500 30 30 15
MeA-TPO-PA-ChCl 375 30 30 15
MeA-TPO-PA-ChCl 250 30 30 15
MeA-TPO-PA-ChCl 125 30 30 15
MeA-TPO-PA-ChCl 50 30 30 15
MMA-TPO 500 30 60 30
MMA-TPO 375 30 120 60
MMA-TPO 250 30 120 60
MMA-TPO 125 30 120 60
MMA-TPO 50 30 120 60
MMA-TPO-IBA-ChCl 500 30 60 30
MMA-TPO-IBA-ChCl 375 30 60 30
MMA-TPO-IBA-ChCl 250 30 60 30
MMA-TPO-IBA-ChCl 125 30 60 30
MMA-TPO-IBA-ChCl 50 30 60 30

95
VITA
Kylee Fazende is a native of South Louisiana. After graduating valedictorian from
Hammond High School, she attended the University of Southern Mississippi to obtain
her Bachelor’s degree in Polymer Science, graduating Summa Cum Laude. Upon
completing her studies at Southern Miss, she decided to return home to Louisiana to
pursue her doctorate at Louisiana State University. In 2014, she joined the Pojman
Research Team with an initial intent to study frontal polymerizations in thin layers, but
after becoming a PhD candidate, she changed her focus to the kinetics of
polymerizations of deep eutectic solvents. She has presented her research at several
conferences including two American Chemical Society National Meetings. She has also
served as a conference coordinator for two conferences, the 2014 National Graduate
Research Polymer Conference and the 2016 APTEC Annual Meeting. After five years of
study in the LSU Chemistry Department, she is pleased to be completing her doctoral
studies with two publications and a third currently being written. Kylee anticipates
graduating in August of 2018