free network measurement for adaptive virtualized distributed computing
DESCRIPTION
Free Network Measurement for Adaptive Virtualized Distributed Computing. Ashish Gupta, Marcia Zangrilli , Ananth Sundararaj, Anne Huang, Peter A. Dinda, Bruce B. Lowekamp. Overview. Benefits of VMs: transparent portability, adaptation, security. Virtual Machines. Contributions: - PowerPoint PPT PresentationTRANSCRIPT
Free Network Measurement for Adaptive Virtualized Distributed Computing
Ashish Gupta, Marcia Zangrilli, Ananth Sundararaj, Anne Huang, Peter A. Dinda, Bruce B. Lowekamp
2
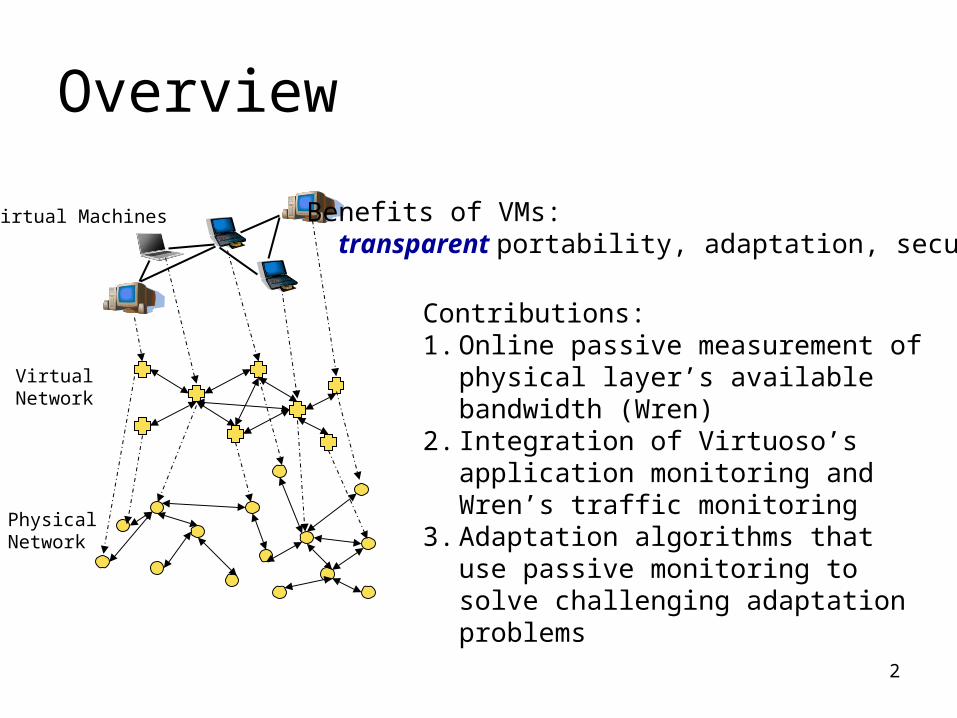
Overview
Benefits of VMs: transparent portability, adaptation, security
Contributions:1. Online passive measurement of
physical layer’s available bandwidth (Wren)
2. Integration of Virtuoso’s application monitoring and Wren’s traffic monitoring
3. Adaptation algorithms that use passive monitoring to solve challenging adaptation problems
Virtual Machines
Virtual Network
PhysicalNetwork
3
Adaptive Virtualized Distributed Computing• How can we efficiently utilize resources in a
virtual machine distributed system?– Accurately monitor resource availability– Transparently adapt to changing conditions– Keep application portability simple
4
Claim• Virtualization enables the broad application of
dream techniques…– Adaptation– Resource reservation
• … using existing, unmodified applications and operating systems– So everyone can use the techniques
5
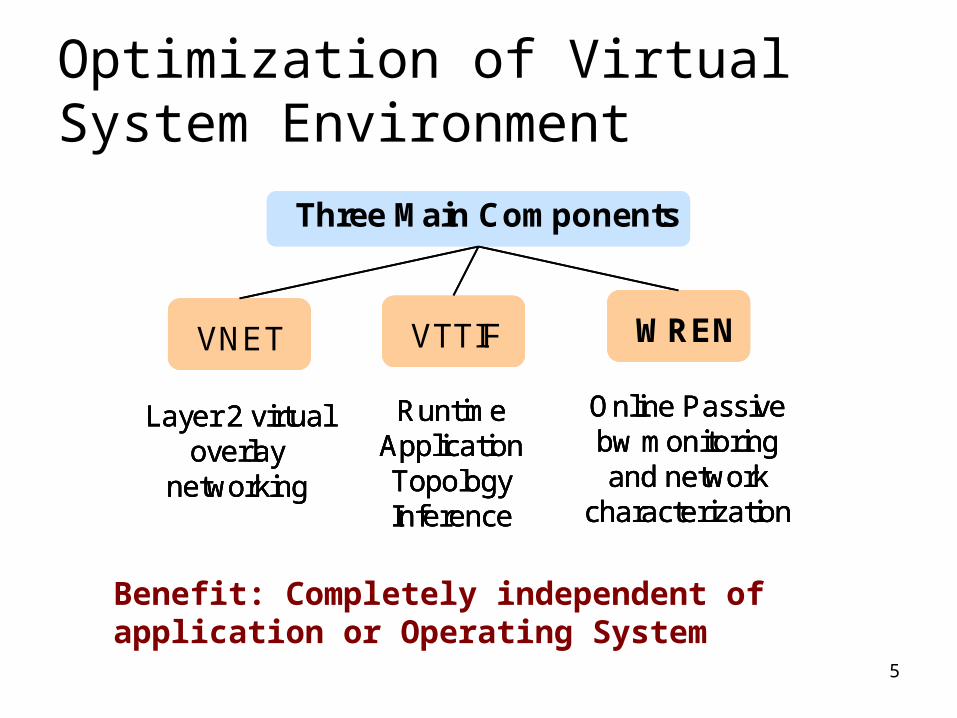
Optimization of Virtual System Environment
Three Main Components
VNET VTTIF WREN
Layer 2 virtual overlay
networking
Runtime Application Topology Inference
Online Passive bw monitoring and network
characterization
Three Main Components
VNET VTTIF WREN
Layer 2 virtual overlay
networking
Runtime Application Topology Inference
Online Passive bw monitoring and network
characterization
Three Main Components
VNET VTTIF WREN
Layer 2 virtual overlay
networking
Runtime Application Topology Inference
Online Passive bw monitoring and network
characterization
Benefit: Completely independent of application or Operating System
6
Outline
• Virtuoso– Overview of distributed VM system– VTTIF– VNET
• Wren– Online Wren overview– Wren performance
• Integration of Virtuoso and Wren• Adaptation
– Algorithms– Results
7
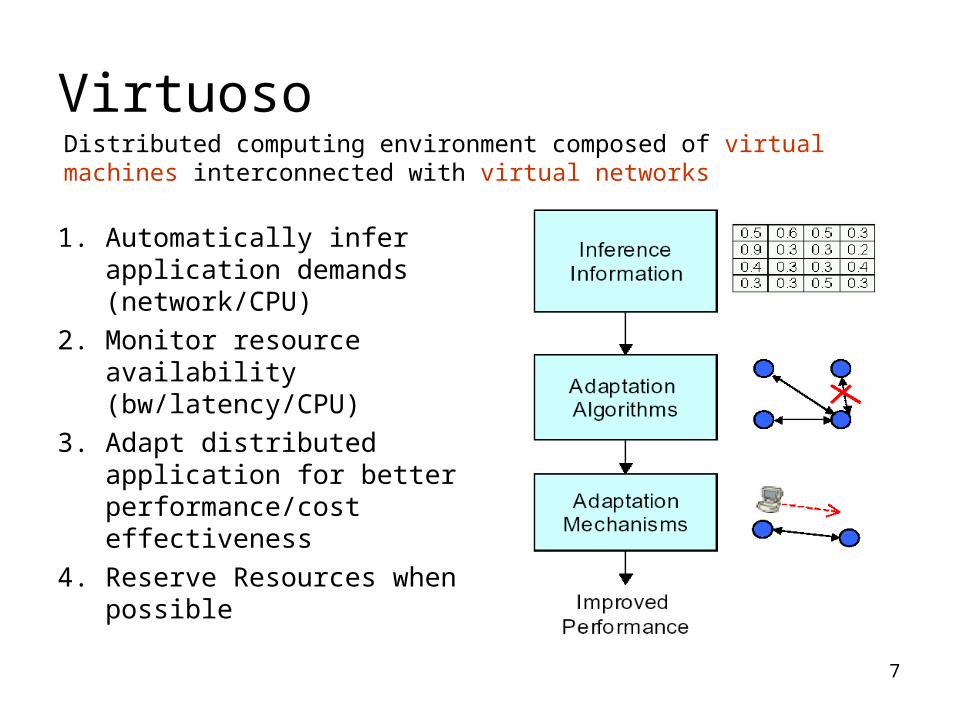
Virtuoso
1. Automatically infer application demands (network/CPU)
2. Monitor resource availability (bw/latency/CPU)
3. Adapt distributed application for better performance/cost effectiveness
4. Reserve Resources when possible
Distributed computing environment composed of virtual machines interconnected with virtual networks
8
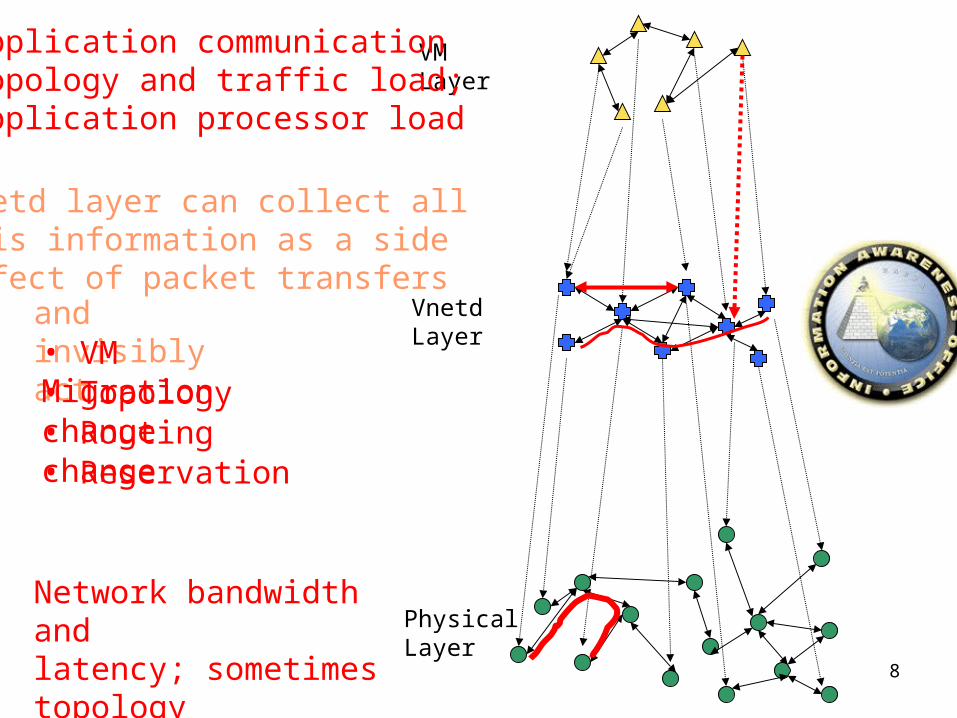
VMLayer
VnetdLayer
PhysicalLayer
Application communicationtopology and traffic load;application processor load
Network bandwidth andlatency; sometimes topology
Vnetd layer can collect all this information as a sideeffect of packet transfersand invisibly act• VM Migration• Topology change• Routing change• Reservation
9
Virtual Topology and Traffic Inference Framework (VTTIF) Operation
• Infers application topology and traffic load at runtime
• Resistant to rapid fluctuations and provides damped network view
• All local views aggregated to central proxy to give global view of distributed application
10
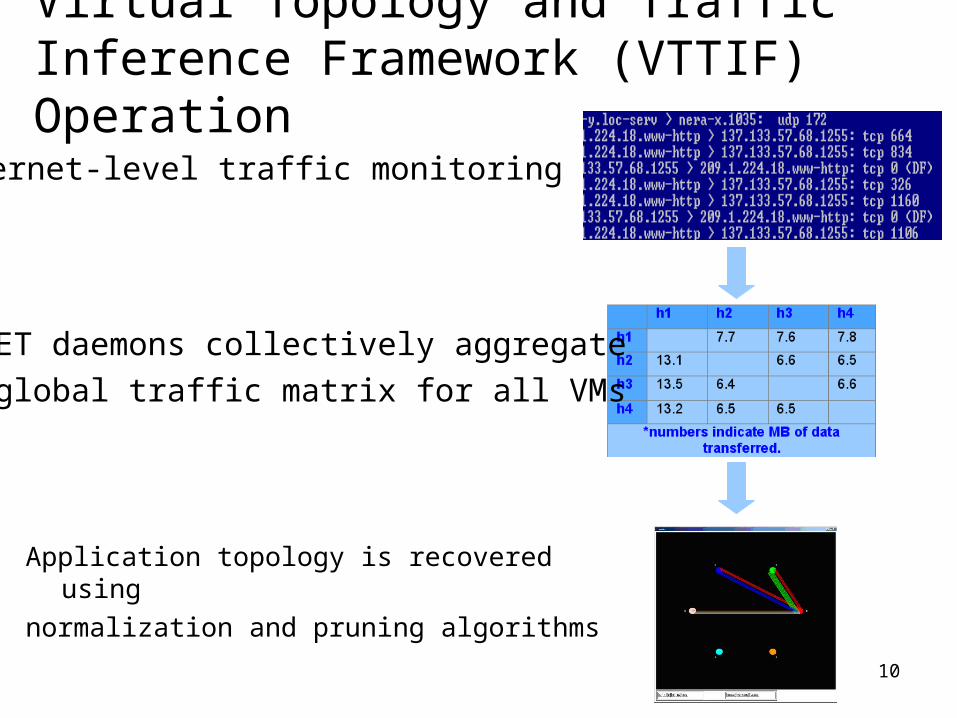
Virtual Topology and Traffic Inference Framework (VTTIF) Operation
Application topology is recovered using
normalization and pruning algorithms
Ethernet-level traffic monitoring
VNET daemons collectively aggregate
a global traffic matrix for all VMs
11
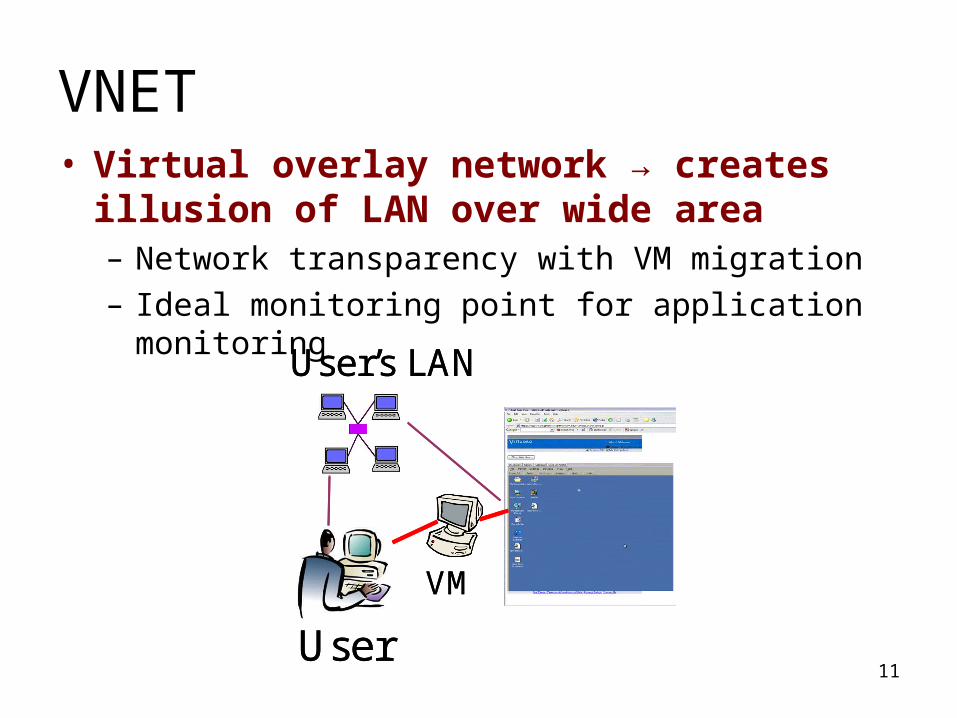
VNET• Virtual overlay network → creates illusion of
LAN over wide area– Network transparency with VM migration– Ideal monitoring point for application monitoring
User
User’s LAN
VM
User
User’s LAN
VM
12
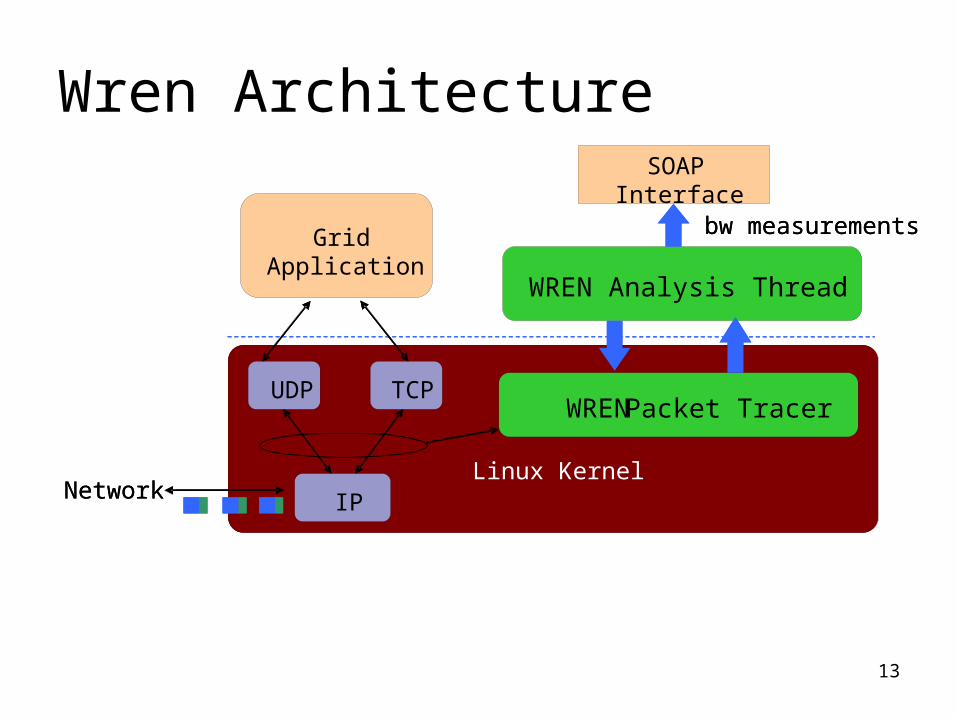
Watching Resources from the Edge of the Network (Wren): A Hybrid Monitoring Approach
Wren Design:– Kernel-level instrumentation to collect traces of application traffic.
– Analysis and management of traces handled in user-level.
Wren capabilities:
1. Observes incoming/outgoing packets
2. Online analysis to derive latency/bandwidth information for all host pair connections
3. Answers network queries for any pair of hosts
13
Wren Architecture
Linux Kernel
WREN Packet Tracer
WREN Analysis Thread
Grid Application
SOAP Interface
IP
UDP TCP
bw measurements
NetworkLinux Kernel
WREN Packet Tracer
WREN Analysis Thread
Grid Application
SOAP Interface
IP
UDP TCP
bw measurements
Network
14
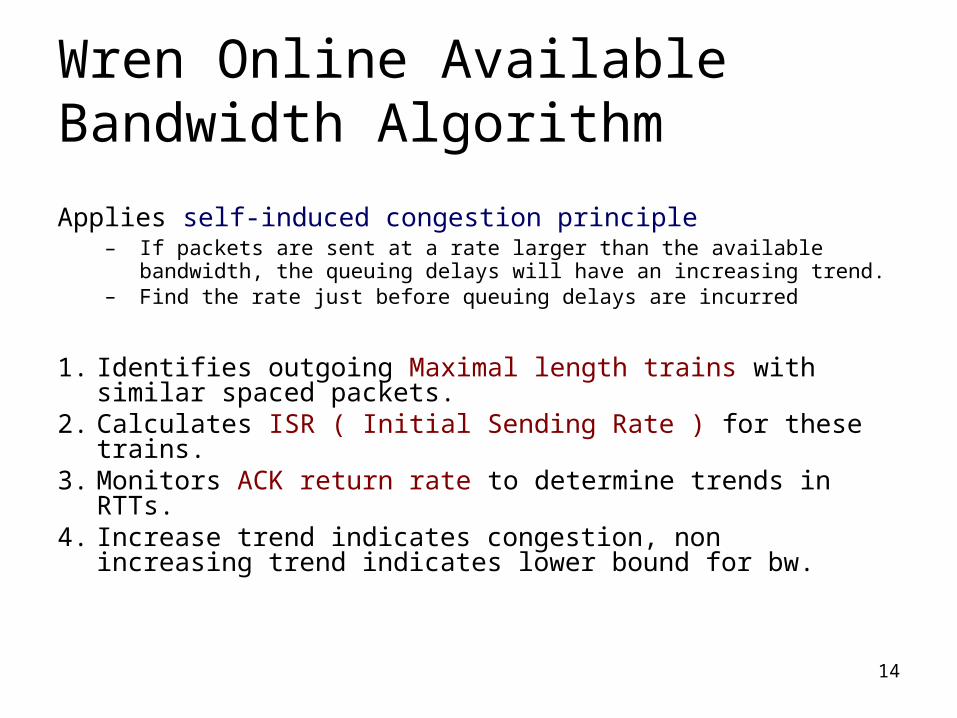
Wren Online Available Bandwidth Algorithm
Applies self-induced congestion principle – If packets are sent at a rate larger than the available bandwidth, the queuing
delays will have an increasing trend.– Find the rate just before queuing delays are incurred
1. Identifies outgoing Maximal length trains with similar spaced packets.
2. Calculates ISR ( Initial Sending Rate ) for these trains.3. Monitors ACK return rate to determine trends in RTTs.4. Increase trend indicates congestion, non increasing trend indicates
lower bound for bw.
15
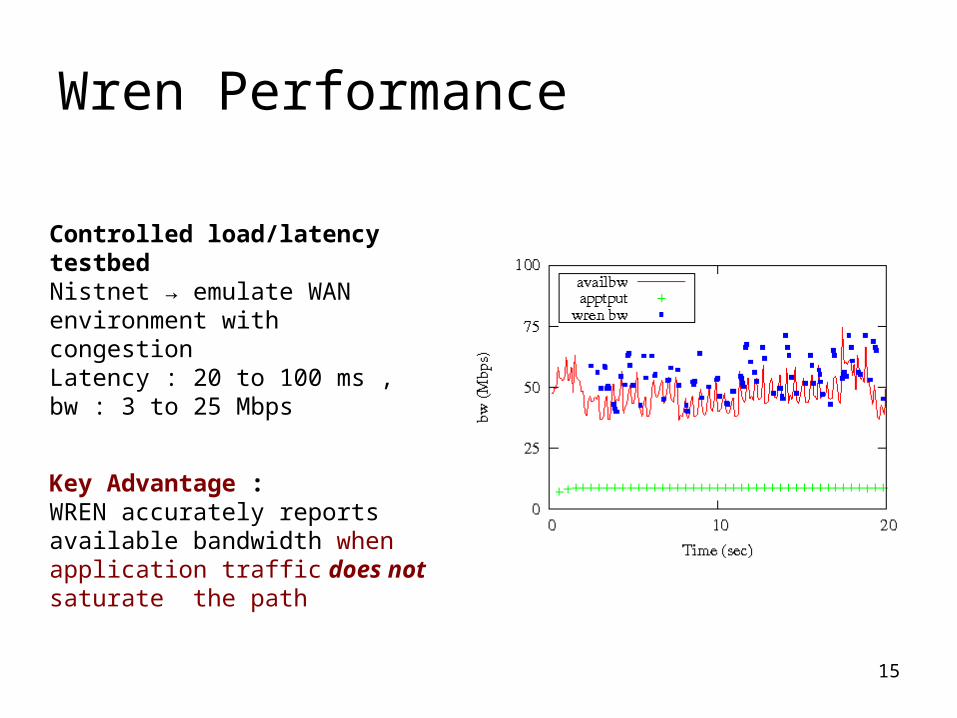
Wren Performance
Key Advantage : WREN accurately reports available bandwidth when application traffic does not saturate the path
Controlled load/latency testbedNistnet → emulate WAN environment with congestionLatency : 20 to 100 ms , bw : 3 to 25 Mbps
16
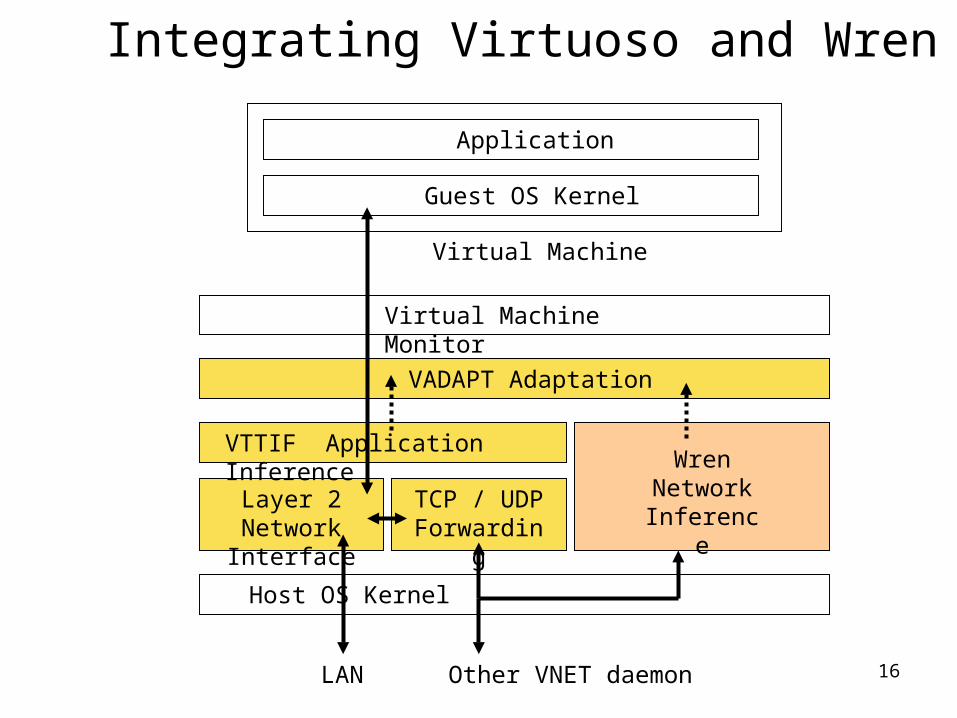
WrenNetworkInference
Host OS Kernel
TCP / UDP Forwarding
Layer 2 Network Interface
VTTIF Application Inference
VADAPT Adaptation
Virtual Machine Monitor
Guest OS Kernel
Application
Virtual Machine
LAN Other VNET daemon
Integrating Virtuoso and Wren
17
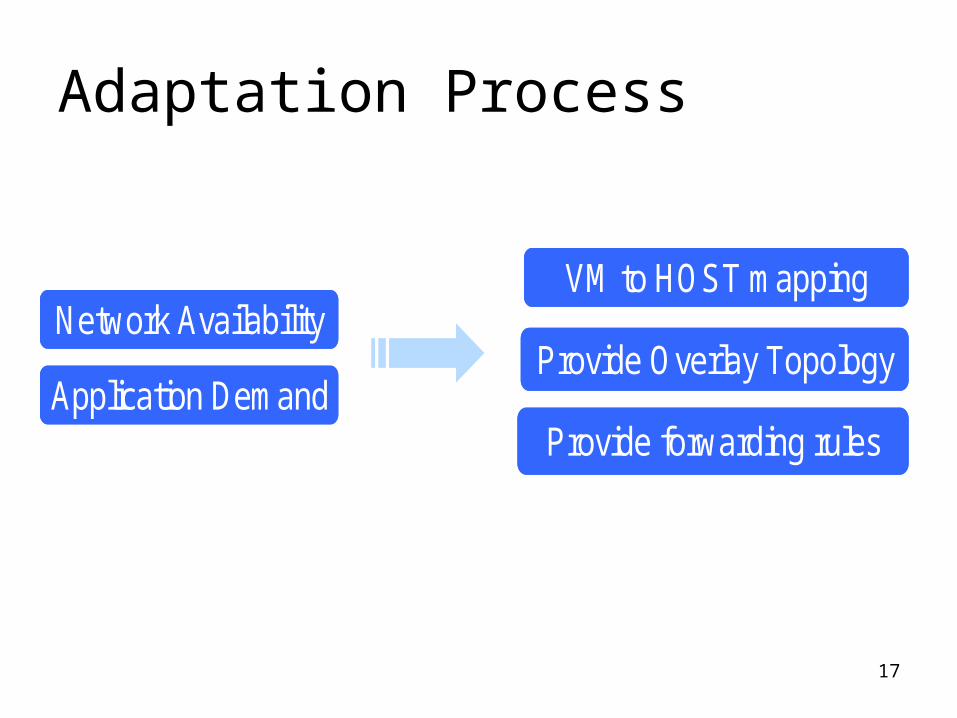
Adaptation Process
Network Availability
Application Demand
VM to HOST mapping
Provide Overlay Topology
Provide forwarding rules
Network Availability
Application Demand
VM to HOST mapping
Provide Overlay Topology
Provide forwarding rules
18
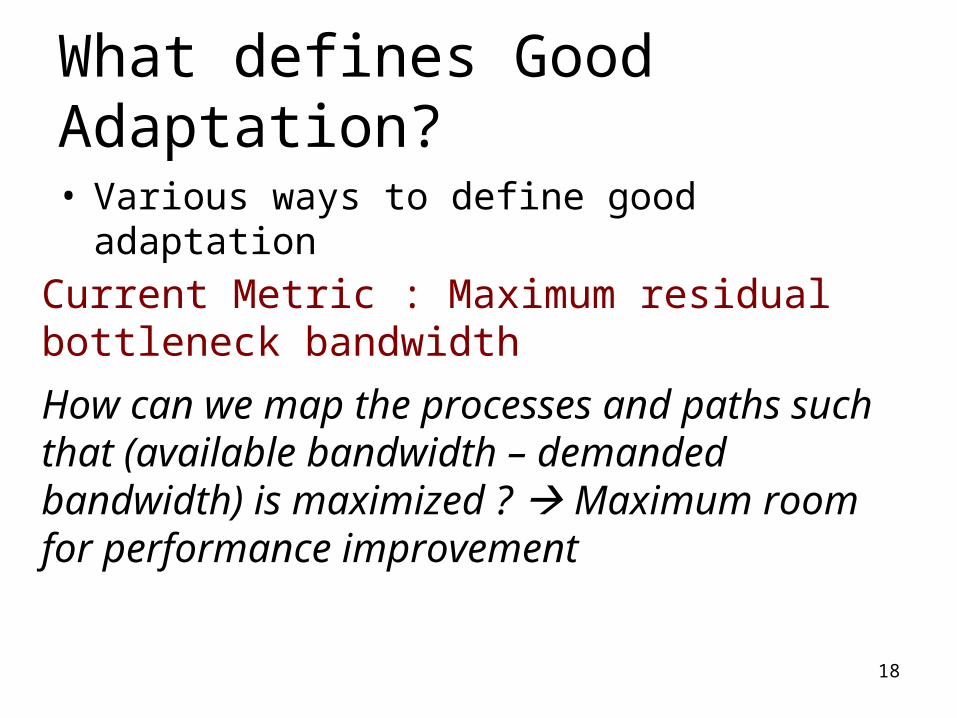
What defines Good Adaptation?
• Various ways to define good adaptation
Current Metric : Maximum residual bottleneck bandwidth
How can we map the processes and paths such that (available bandwidth – demanded bandwidth) is maximized ? Maximum room for performance improvement
19
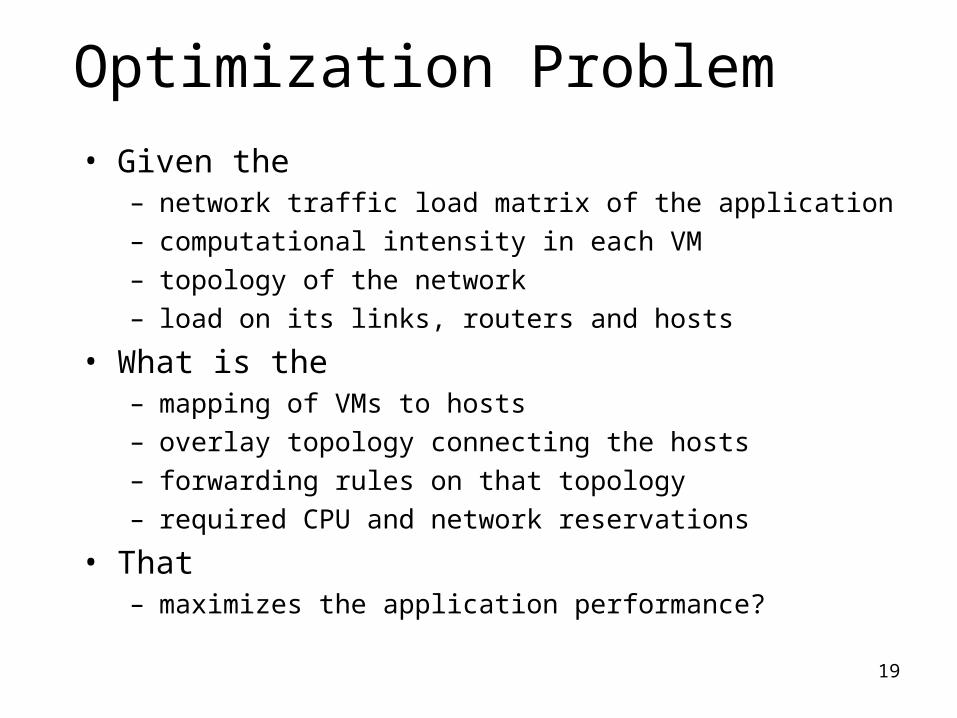
Optimization Problem
• Given the– network traffic load matrix of the application – computational intensity in each VM– topology of the network– load on its links, routers and hosts
• What is the – mapping of VMs to hosts– overlay topology connecting the hosts– forwarding rules on that topology– required CPU and network reservations
• That – maximizes the application performance?
20
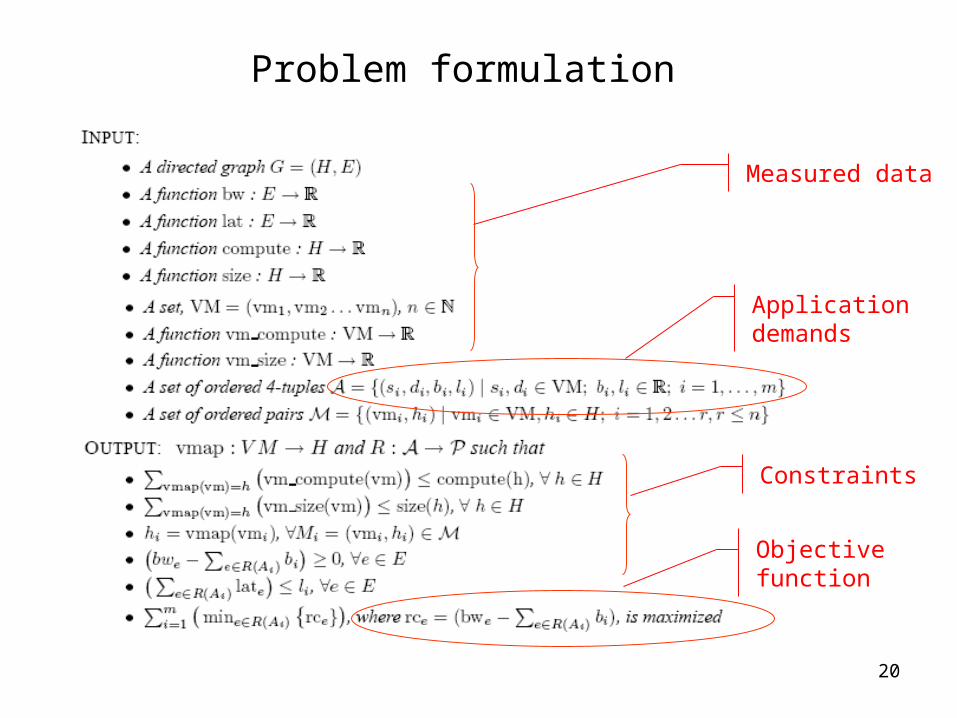
Problem formulation
Objective function
Application demands
Measured data
Constraints
21
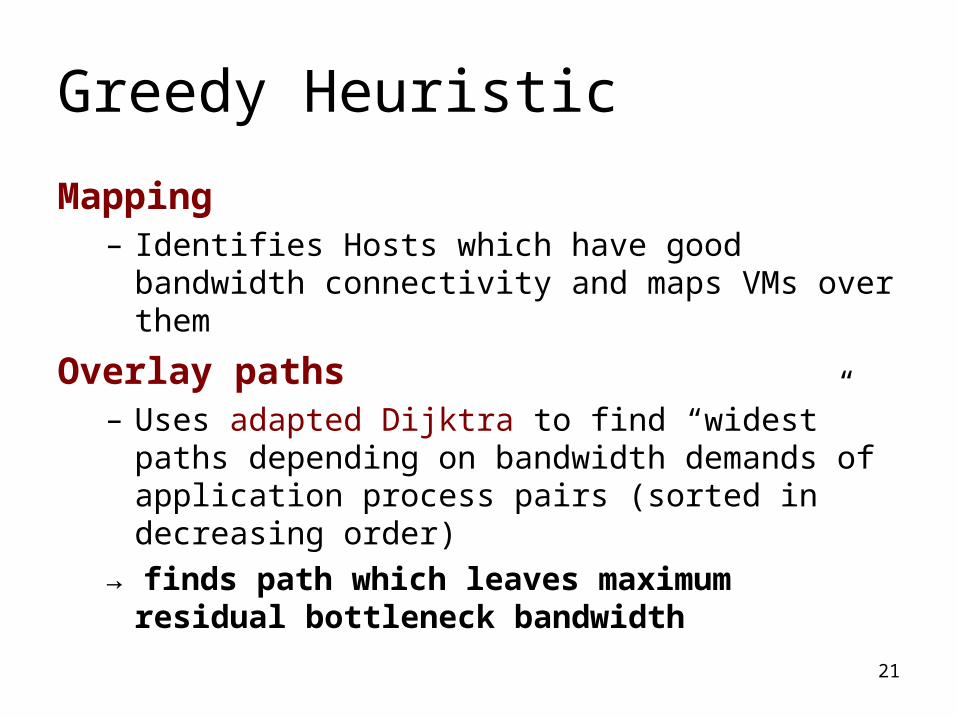
Greedy Heuristic
Mapping– Identifies Hosts which have good bandwidth
connectivity and maps VMs over them
Overlay paths– Uses adapted Dijktra to find “widest” paths depending
on bandwidth demands of application process pairs (sorted in decreasing order)
→ finds path which leaves maximum residual bottleneck bandwidth
22
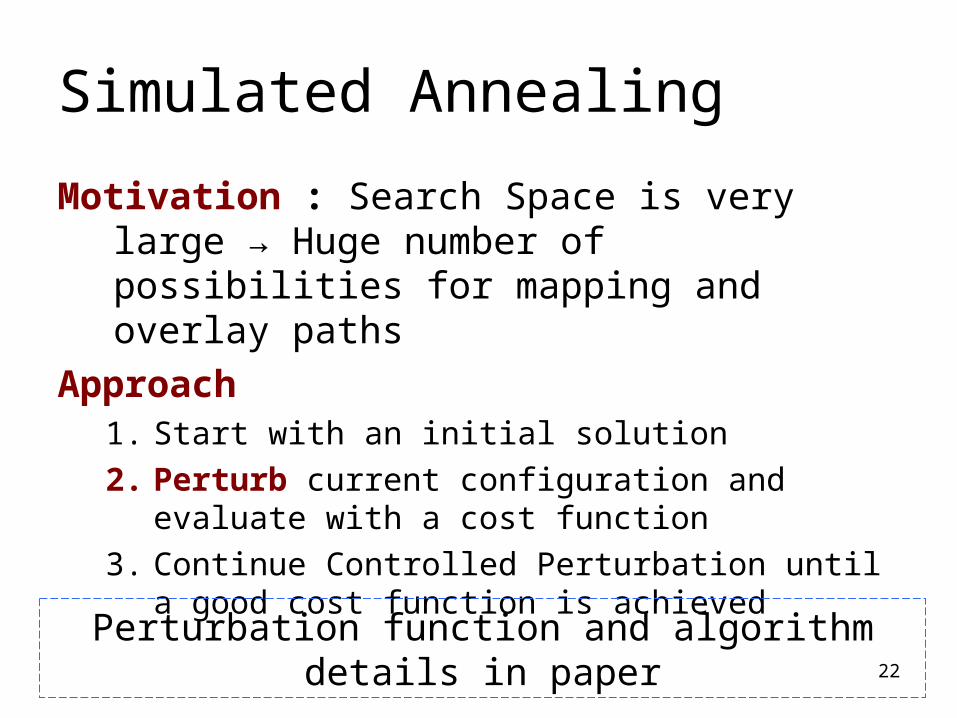
Simulated Annealing
Motivation : Search Space is very large → Huge number of possibilities for mapping and overlay paths
Approach1. Start with an initial solution
2. Perturb current configuration and evaluate with a cost function
3. Continue Controlled Perturbation until a good cost function is achieved
Perturbation function and algorithm details in paper
23
Experimental Setup• Evaluation conducted in simulation• In each scenario the goal is
– to generate a configuration consisting of VM to Host mappings
– paths between the communicating VMs – Such that the total residual bottleneck bandwidth is
maximized
• We compare – greedy heuristic (GH)– simulated annealing approach (SA) – SA with the GH solution as the starting point (SA+GH). – Additionally we also maintain the best solution found so
far with (SA+GH), i.e. (SA+GH+B), where ’B’ indicates the best solution so far.
24
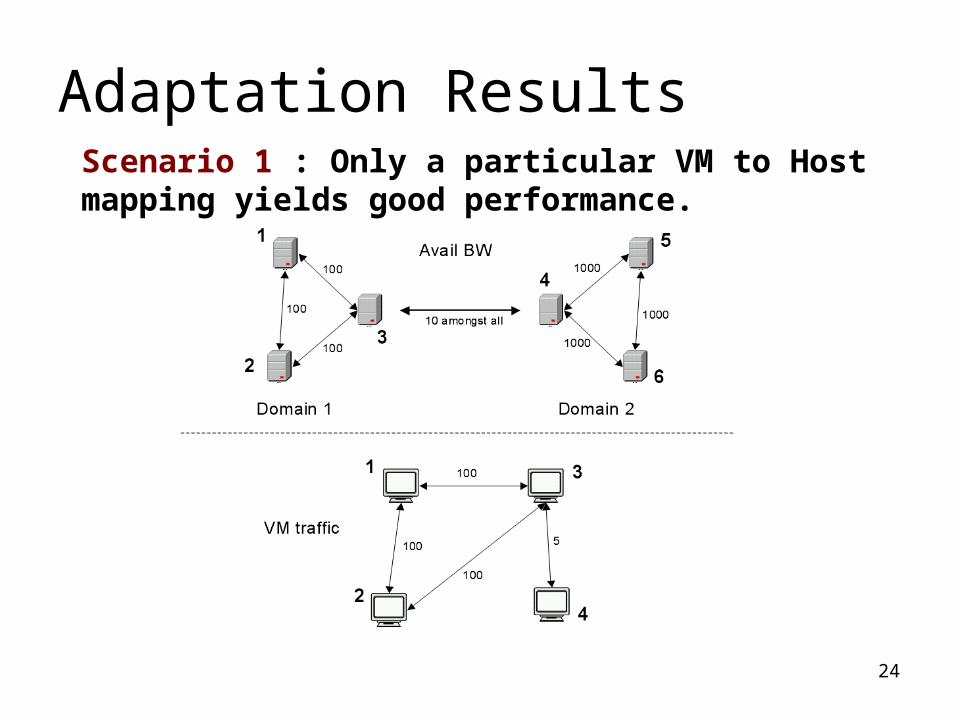
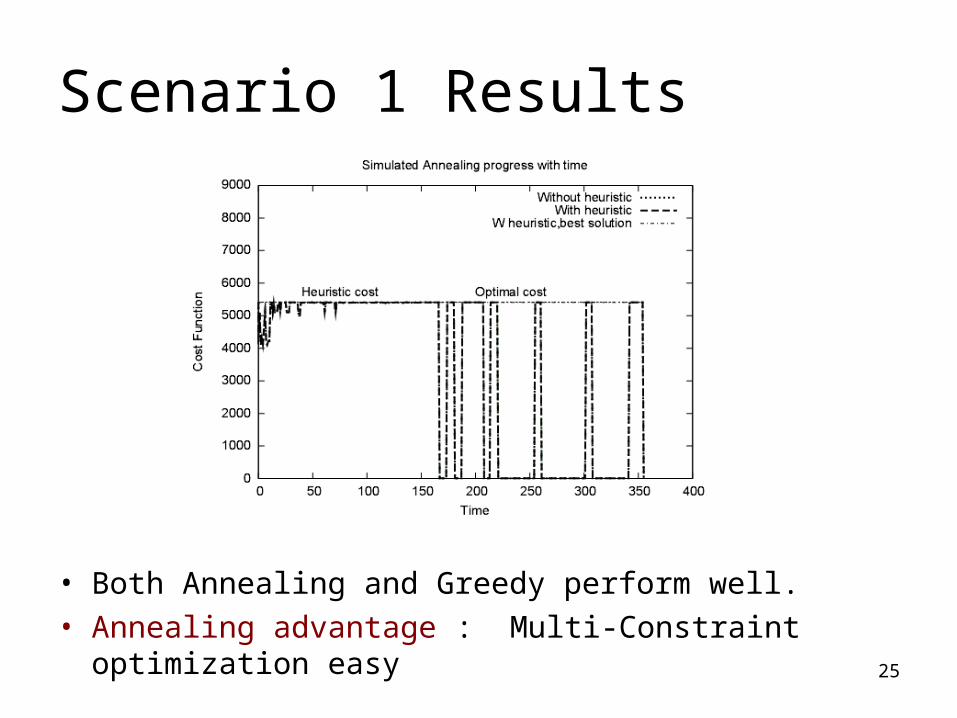
Adaptation ResultsScenario 1 : Only a particular VM to Host mapping yields good performance.
25
Scenario 1 Results
• Both Annealing and Greedy perform well.• Annealing advantage : Multi-Constraint optimization
easy
26
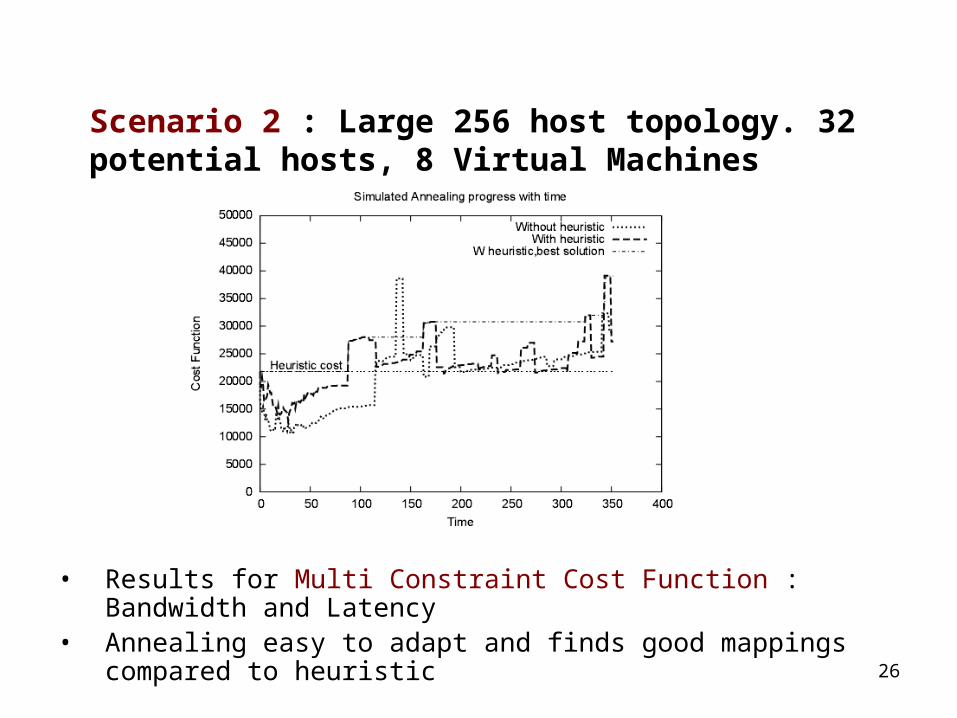
• Results for Multi Constraint Cost Function : Bandwidth and Latency• Annealing easy to adapt and finds good mappings compared to
heuristic
Scenario 2 : Large 256 host topology. 32 potential hosts, 8 Virtual Machines
27
Conclusion
• Network measurements can be provided for free!• These measurements can be used to improve
application performance through adaptation• Virtuoso and Wren Integrated system
– Low overhead – Provides application and resource measurements– Allows transparent optimization of application performance
• Adaptation Strategies– Greedy heuristic and simulated annealing approaches are able
to find good mappings/configurations
28
• Please visit– Prescience Lab (Northwestern University)
• http://plab.cs.northwestern.edu
– Wren: Watching Resources fro the Edge of the Network (William and Mary)• http://www.cs.wm.edu/~lowekamp/wren.html
– Virtuoso: Resource Management and Prediction for Distributed Computing using Virtual Machines
• http://virtuoso.cs.northwestern.edu• VNET is publicly available from above URL
For More Information