frbny policy review
TRANSCRIPT

8/9/2019 FRBNY Policy Review
http://slidepdf.com/reader/full/frbny-policy-review 1/31
FRBNY Economic Policy Review / August 2010 101
1. Introduction
he present crisis is the bottom of a leverage cycle.
Understanding that tells us what to do, in what order,
and with what sense of urgency. Public authorities have acted
aggressively, but because their actions were not rooted in (or
explained with reference to) a solid understanding of the causes
of our present distress, we have started in the wrong place and
paid insufficient attention and devoted insufficient resources
to matters—most notably, the still-growing tidal wave of
foreclosures and the sudden deleveraging of the financial
system—that should have been first on the agenda.
In short and simple terms, by leverage cycle I mean this.There are times when leverage is so high that people and
institutions can buy many assets with very little money down
and times when leverage is so low that buyers must have all or
nearly all of the money in hand to purchase those very same
assets. When leverage is loose, asset prices go up because buyers
can get easy credit and spend more. Similarly, when leverage is
highly constrained, that is, when credit is very difficult to
obtain, prices plummet. This is what happened in real estate
and what happened in the financial markets. Governments
have long monitored and adjusted interest rates in an attempt
to ensure that credit did not freeze up and thereby threaten
the economic stability of a nation. However, leverage
(equivalently, collateral rates) must also be monitored and
adjusted if we are to avoid the destruction that the tail end of an
outsized leverage cycle can bring.
Economists and the public have often spoken of tight credit
markets, meaning something more than high interest rates, but
without precisely specifying or quantifying exactly what they
meant. A decade ago, I showed that the collateral rate, or
leverage, is an equilibrium variable distinct from the interest
rate.1 The collateral rate is the value of collateral that must be
pledged to guarantee one dollar of loan. Today, many
businesses and ordinary people are willing to agree to pay bank
interest rates, but they cannot get loans because they do not
have the collateral to put down to convince the banks their loanwill be safe.
Huge moves in collateral rates, which I have called “the
leverage cycle,” are a recurring phenomenon in American
financial history.2 The steps we must take at the end of the
current cycle emerge from understanding what makes a
leverage cycle swing up, sometimes to dizzying extremes,
and then come crashing down, often with devastating
consequences.
1 Geanakoplos (1997, 2003).2 The history of leverage is still being written, because until recently it was
not a variable that was explicitly monitored. But work by Adrian and Shin
(forthcoming) and others is helping to restore the historical record.
John Geanakoplos
On October 3, 2008, the author presented to Ben Bernanke and the Federal
Reserve Board of Governors the substance of this paper’s proposal. The author
is grateful to Susan Koniak for very helpful and detailed comments and advice,
as well as for allowing him to use material from their two New York Times
editorials. He is also appreciative of the very fine comments received from
Asani Sarkar and two referees, and is deeply indebted to Joseph Tracy for
editorial advice far beyond the call of duty, encompassing tone, style, and
content. Needless to say, neither he nor anyone else is responsible for, or even
necessarily in agreement with, the views expressed here. The views expressed
are those of the author and do not necessarily reflect the position of the
Federal Reserve Bank of New York or the Federal Reserve System.
Solving the PresentCrisis and Managing
the Leverage Cycle
John Geanakoplos is the James Tobin Professor of Economics at Yale
University, an external professor at the Santa Fe Institute, and a partner in
Ellington Capital Management, which trades primarily in mortgage securities.
T

8/9/2019 FRBNY Policy Review
http://slidepdf.com/reader/full/frbny-policy-review 2/31
102 Solving the Present Crisis and Managing the Leverage Cycle
All leverage cycles end with: 1) bad news that creates
uncertainty and disagreement, 2) sharply increasing collateral
rates, and 3) losses and bankruptcies among the leveraged
optimists. These three factors reinforce and feed back on each
other. In particular, what begins as uncertainty about
exogenous events creates uncertainty about endogenous
events, like how far prices will fall or who will go bankrupt,
which leads to further tightening of collateral, and thus furtherprice declines and so on. In the aftermath of the crisis, we
always see depressed asset prices, reduced economic activity,
and a collection of agents that are not yet bankrupt but
hovering near insolvency. How long the aftermath persists
depends on how deep the crisis was and how effective
government intervention is.
Once the crisis has started, the thematic solution is to
reverse the three symptoms of the crisis: contain the bad news,
intervene to bring down margins, and carefully inject
“optimistic” equity back into the system. As with most difficult
problems, a multi-pronged approach is generally the most
successful. To be successful, any government plan must respect
all three remedial prongs, and their order. The unusual
government interventions in this cycle have in many respects
been quite successful in averting a disaster—precisely, I would
argue, because they embodied some of the novel leverage cycle
principles I describe here. The effectiveness of the interventions
could be increased even further by respecting the priorities of
the problem.
In what follows, I explain what happens in the leverage cycle
and why it is so bad for the economy that it must be monitored
and controlled by the government. I show how this last cycle
fits the pattern and I further explain why this leverage cycle isworse than all the others since the Depression. I point out that
the now-famous counterparty risk problem, which has
received so much attention of late, is also a matter of collateral.
Next, I present details on how to intervene to pull out of a
leverage cycle crisis like the one we are passing through now;
this discussion is divided into three sections, corresponding to
the three symptoms of every leverage cycle crisis. I advocate a
permanent lending facility that will stand ready, should
another crisis arise, to give loans with less collateral than the
market demands. In another section, I suggest that principal
reduction (partial debt forgiveness) by private lenders is a key
tool in dealing with the many agents, like homeowners today,
that fall underwater at the bottom of a deep leverage crisis. In
the third section, I assemble the many pitfalls the government
must be watchful of if it feels obliged to rescue drowning firms
or it is tempted to buy assets at “fire-sale” prices in the darkest
days of the crisis. I conclude with a list of recommendations
for managing the leverage cycle in its ebullient period that
might prevent the next cycle from reaching such a devastating
crisis stage.
2. Margins, the Leverage Cycle,and Asset Prices
Traditionally, governments, economists, as well as the general
public and the press, have regarded the interest rate as the most
important policy variable in the economy. Whenever the
economy slows, the press clamors for lower interest rates from
the Federal Reserve, and the Fed often obliges. But sometimes,especially in times of crisis, collateral rates (equivalently,
margins or leverage) are far more important than interest rates.
The Fed could be managing collateral rates all through the
leverage cycle, but especially in the ebullient and the crisis
stages.
The use of collateral and leverage is widespread. A home-
owner (or a big investment bank or hedge fund) can often
spend $20 of his own cash to buy an asset like a house for $100
by taking out a loan for the remaining $80 using the house as
collateral. In that case, we say that the margin or haircut or
down payment is 20 percent, the loan to value is $80/$100 =
80 percent, and the collateral rate is $100/$80 or 125 percent.
The leverage is the reciprocal of the margin, namely, the
ratio of the asset value to the cash needed to purchase it, or
$100/$20 = 5. All of these ratios are different ways of saying
the same thing.
In standard economic theory, the equilibrium of supply and
demand determines the interest rate on loans. But in real life,
when somebody takes out a secured loan, he must negotiate
two things: the interest rate and the collateral rate. A proper
theory of economic equilibrium must explain both. Standard
economic theory has not really come to grips with this problem
for the simple reason that it seems intractable: how can one
supply-equals-demand equation for a loan determine two
variables—the interest rate and the collateral rate? There is not
enough space to explain the resolution of this puzzle here, but
suffice it to say that ten years ago I showed that supply and
demand do indeed determine both. Moreover, the two
variables are influenced in the equilibration of supply and
demand mainly by two different factors: the interest rate
reflects the underlying impatience of borrowers, and the
collateral rate reflects the perceived volatility of asset prices and
the resulting uncertainty of lenders.3 Another factor
influencing leverage in the long run is the degree of financial
innovation. Since scarce collateral is often an importantlimiting factor, the economy will gradually devise ways of
stretching the collateral, by tranching (so the same collateral
backs several loans) and pyramiding loans (so the same
3 In Geanakoplos (1997), I show how supply and demand can indeed
simultaneously determine the interest rate and the collateral rate. In
Geanakoplos (2003), I show how intertemporal changes in volatility lead to
changes in the equilibrium leverage over time as part of what I call a leverage
cycle. In Geanakoplos (1997) and Geanakoplos and Zame (2009), I emphasize
the scarcity of collateral and the role of tranching and pyramiding.

8/9/2019 FRBNY Policy Review
http://slidepdf.com/reader/full/frbny-policy-review 3/31
FRBNY Economic Policy Review / August 2010 103
Natural Buyers Theory of Price
Natural buyers
Marginal buyer
Public
collateral can be used over and over to back loans backed by
loans).
Practitioners, if not economists, have long recognized the
importance of collateral and leverage. For a Wall Street trader,
leverage is important for two reasons. The first is that if he is
leveraged times, then a 1 percent change in the value of the
collateral means a percent change in the value of his capital.
(If the house in our example goes from $100 to $101, then afterselling the house at $101 and repaying the $80 loan, the investor
is left with $21 of cash on his $20 investment, a 5 percent return.)
Leverage thus makes returns riskier, either for better or for
worse. Second, a borrower knows that if there is no-recourse
collateral, so that he can walk away from his loan after giving up
the collateral without further penalty, then his downside is
limited. The most the borrower can lose on the house loan is his
$20 of cash, even if the house falls in value all the way to $0 and
the lender loses $80. No-recourse collateral thus effectively gives
the borrower a put option (to “sell” the house for the loan
amount). Recently, several commentators have linked leverage
to the crisis, arguing that if banks were not so leveraged in their
borrowing they would not have lost so much money when prices
went down, and that if homeowners were not so leveraged, they
would not be so far underwater now and so tempted to exercise
their put option by walking away from their house. Of course,
these two points are central to my own leverage cycle theory; I
discuss them in more detail later. But there is another, deeper
point to my theory that has so far not received as much attention,
which I think is the real story of leverage.
The main implication of my leverage cycle theory is that
when leverage goes up, asset prices go up, and when leverage
goes down, asset prices go down.
4
For many assets, there is aclass of natural buyers or optimists who are willing to pay much
more for the asset than the rest of the public. They may be more
risk-tolerant. Or they may simply be more optimistic. Or they
may like the collateral (for example, housing) more.5 If they
can get their hands on more money through borrowing, they
will spend it on the assets and drive those asset prices up. If they
lose wealth, or lose the ability to borrow, they will be able to buy
less of the asset, and the asset will fall into more pessimistic
hands and be valued less.
It is useful to think of the potential investors arrayed on a
vertical continuum, in descending order according to their
willingness to buy, with the most enthusiastic buyers at the top(see exhibit). Whatever the price, those at the top of the
continuum above a threshold will value the asset more and
become buyers, while those below will value it less and sell. The
4 Leverage is like more money in making prices go up, but, unlike money, it
affects only prices of goods that can serve as collateral; printing more money
tends to increase all prices, including those of food and other perishables.5 Two additional sources of heterogeneity are that some investors are more
expert at hedging assets, and that some investors can more easily obtain the
information (like loan-level data) and expertise needed to evaluate the assets.
λ
λ
marginal buyer is the agent at the threshold on the cusp of
selling or buying and it is his opinion that determines the price.
The higher the leverage, the smaller the number of buyers at the
top required to purchase all the available assets. As a result, the
marginal buyer will be higher in the continuum and therefore
the price will be higher.
It is well known that a reduction in interest rates will
increase the prices of assets such as houses. It is less
appreciated, but more obviously true, that a reduction in
margins will raise asset prices. Conversely, if margins go up,
asset prices will fall. A potential homeowner who in 2006 could
buy a house by putting 3 percent cash down might find it
unaffordable to buy now that he has to put 30 percent cash
down, even if the Fed managed to reduce mortgage interest
rates by 1 percent or 2 percent. This has diminished the
demand for housing, and therefore housing prices. What
applies to housing applies much more to the esoteric assets
traded on Wall Street (such as mortgage-backed investments),
where the margins (that is, leverage) can vary much more
radically. In 2006, the $2.5 trillion of so-called toxic mortgage
securities could be bought by putting $150 billion down and
borrowing the other $2.35 trillion.6 In early 2009, those same
securities might collectively have been worth half as much, yet
a buyer might have had to put nearly the whole amount down
in cash. In Section 3.1, I illustrate the connection between
leverage and asset prices over the current cycle.
Economists and the Federal Reserve ask themselves every
day whether the economy is picking the right interest rates. But
one can also ask the question whether the economy is pickingthe right equilibrium margins. At both ends of the leverage
cycle, it does not. In ebullient times, the equilibrium collateral
rate is too loose; that is, equilibrium leverage is too high. In bad
times, equilibrium leverage is too low. As a result, in ebullient
times asset prices are too high, and in crisis times they plummet
too low. This is the leverage cycle.
6 This number is calculated by applying the bank regulatory capital
requirement (based on bond credit rating) to each security in 2006 at its
2006 credit rating.

8/9/2019 FRBNY Policy Review
http://slidepdf.com/reader/full/frbny-policy-review 4/31
104 Solving the Present Crisis and Managing the Leverage Cycle
The policy implication of the leverage cycle is that the Fed
could manage systemwide leverage, seeking to maintain it
within reasonable limits in normal times, stepping in to curtail
it in times of ebullience, and propping it up as market actors
become anxious, and especially in a crisis. To carry out this
task, of course, the Fed must first monitor leverage. The Fed
must collect data from a broad spectrum of investors, including
hitherto secretive hedge funds, on how much leverage is beingused to buy various classes of assets. Moreover, the amount of
leverage being employed must be transparent. The accounting
and legal rules that govern devices, such as structured
investment vehicles, that were used to mask leverage levels
must be reformed to ensure that leverage levels can be more
readily and reliably discerned by the market and regulators
alike. As we shall see, the best way to monitor leverage is to do
it at the security level by keeping track of haircuts on all the
different kinds of assets used as collateral, including in the repo
market and in the housing market. Also very useful, but less
important, is monitoring the investor leverage (or the debt-
equity ratio) of big firms.
The leverage cycle is no accident, but a self-reinforcing
dynamic. Declining margins, or, equivalently, increasing
leverage, are a consequence of the happy coincidence of
universal good news and the absence of danger on the horizon.
With markets stable and the horizon looking clear, lenders are
happy to reduce margins and provide more cash. Good, safe
news events by themselves tend to make asset prices rise. But
they also encourage declining margins, which in turn cause the
massive borrowing that inflates asset prices still more.
Similarly, when the news is bad, asset prices tend to fall on the
news alone. But the prices often fall further if the margins aretightened. Sudden and dramatic increases in margins are relatively
rare. They seem to happen once or twice a decade. Bad news
arrives much more often than that, so it is not bad or even very bad
news alone that drastically raises margins. Bad news lowers
expectations, and, like all news, usually clarifies the situation.
Every now and then, bad news, instead of clarifying matters,
increases uncertainty and disagreement about the future. It is
this particular kind of “scary bad” news that increases margins.
For example, when an airline announces the plane will be ten
minutes late, the passengers start to worry the delay might be
an hour. When a bank announces a $5 billion loss, investors
worry that more losses might be on the way. In 2006, peopledisagreed about whether losses from defaults on prime
mortgages would be 1/4 percent or 1/2 percent, and whether
losses on subprime mortgages would be 1 percent or 5 percent.
By contrast, after the scary news of 2007, people disagreed
about whether some subprime losses would be 30 percent or
80 percent. Even from their low, many lenders were afraid
many assets could lose even more value, maybe all their value.
The present became worse, and the future more uncertain.
The upshot of increased uncertainty and disagreement is
that margins go up drastically. Lenders are typically more
pessimistic than buyers. Otherwise, they too would be buying,
instead of lending. Even if the optimists are not worried much
about more losses, the lenders are, and they will demand high
margins. When the lenders are worried about 80 percent losses
from current levels, they will lend only if margins are at least
90 percent, or not lend at all.
As we have just witnessed, the rapid increase in margins
always comes at the worst possible time. Buyers who were
allowed to massively leverage their purchases with borrowed
money are forced to sell when bad news drives asset prices
lower. But when margins rise dramatically, more modestly
leveraged buyers are also forced to sell. Tightening margins
turn willing buyers into forced sellers, driving prices further
down. We enter the crisis stage I discuss below.
The dynamic of the leverage cycle cannot be stopped by
a tongue lashing of greedy Wall Street investors or overly
ambitious homeowners in the ebullient stage of the cycle, norby exhortations not to panic in the crisis stage. The cycle
emerges even if (in fact, precisely because) every agent is acting
rationally from his individual point of view. It is analogous to
a prisoner’s dilemma, where individual rationality leads to
collective disaster. The government must intervene.
The intervention becomes all the more necessary if agents
are irrationally exuberant and then irrationally panicked, or are
prone to short-sighted greed, or to the “keeping up with the
Jones” syndrome. If greedy investors want higher expected
returns, no matter what the risk, competition will force even
conservative fund managers to leverage more. For example, an
investor comes to a hedge fund and says, “the fund down the
block is getting higher returns.” The fund manager counters
that the competitor is just using more leverage. The investor
responds, “well whatever he’s doing, he’s getting higher
returns.” Pretty soon, both funds are leveraging more. Housing
prices can rise in the same way. When some families borrow a
lot of money to buy their houses, housing prices rise and even
conservative homeowners are forced to borrow and leverage so
they too can live in comparable houses, if keeping up with their
peers is important to them. At the bottom end, nervous
investors might withdraw their money, forcing hedge fund
managers to sell just when they think the opportunities aregreatest. However, of all the irrationalities that exacerbated this
leverage cycle, I would not point to these or to homeowners
who took out loans they could not really afford, but rather to
lenders who underestimated the put option and failed to ask
for enough collateral.
The observation that collateral rates are even more
important outcomes of supply and demand than interest rates,
and even more in need of regulation, was made over 400 years
8/9/2019 FRBNY Policy Review
http://slidepdf.com/reader/full/frbny-policy-review 5/31
FRBNY Economic Policy Review / August 2010 105
ago. In The Merchant of Venice, Shakespeare depicted
accurately how lending works: one has to negotiate not just an
interest rate but the collateral level too. And it is clear which of
the two Shakespeare thought was the more important. Who
can remember the interest rate Shylock charged Antonio? But
everybody remembers the “pound of flesh” that Shylock and
Antonio agreed on as collateral. The upshot of the play,
moreover, is that the regulatory authority (the court)intervenes and decrees a new collateral level—very different
from what Shylock and Antonio had freely contracted—
“a pound of flesh, but not a drop of blood.” The Fed, too, could
sometimes decree different collateral levels (before the fact, not
after, as in Shakespeare).
The modern study of collateral seems to have begun with
Kiyotaki and Moore (1997), Bernanke, Gertler, and Gilchrist
(1996, 1999), Holmstrom and Tirole (1997), Geanakoplos
(1997, 2003), and Geanakoplos and Zame (2009).7 Bernanke,
Gertler, and Gilchrist and Holmstrom and Tirole emphasize
the asymmetric information between borrowers and lenders as
the source of limits on borrowing. For example, Holmstrom
and Tirole argue that the managers of a firm would not be able
to borrow all the inputs necessary to build a project, because
lenders would like to see them bear risk, by putting their own
money down, to guarantee that they exert maximal effort.
Kiyotaki and Moore (1997) and Geanakoplos (1997) study the
case where the collateral is an asset such as a mortgage security,
where the buyer/borrower using the asset as collateral has no
role in managing the asset, and asymmetric information is
therefore not important. The key difference between Kiyotaki
and Moore and Geanakoplos (1997) is that in Kiyotaki and
Moore, there is no uncertainty, and so the issue of leverage as aratio of loan to value does not play a central role; to the extent
it does vary, leverage in Kiyotaki and Moore goes in the wrong
direction, getting higher after bad news, and dampening the
cycle. In Geanakoplos (1997, 2003), I introduce uncertainty
and solve for equilibrium leverage and equilibrium default
rates; I show how leverage could be determined by supply and
demand, and how under some conditions, volatility (or more
precisely, the tail of the asset return distribution) pins down
leverage. In Geanakoplos (2003), I introduce the leverage cycle
in which changes in the volatility of news lead to changes in
leverage, which in turn lead to changes in asset prices. This line
of research has been pursued by Gromb and Vayanos (2002),Fostel and Geanakoplos (2008), Brunnermeier and Pedersen
(2009), and Adrian and Shin (forthcoming), among others.
7 Minsky (1986) was a modern pioneer in calling attention to the dangers of
leverage. But to the best of my knowledge, he did not provide a model or formal
theory. Tobin and Golub (1998) devote a few pages to leverage and the
beginnings of a model.
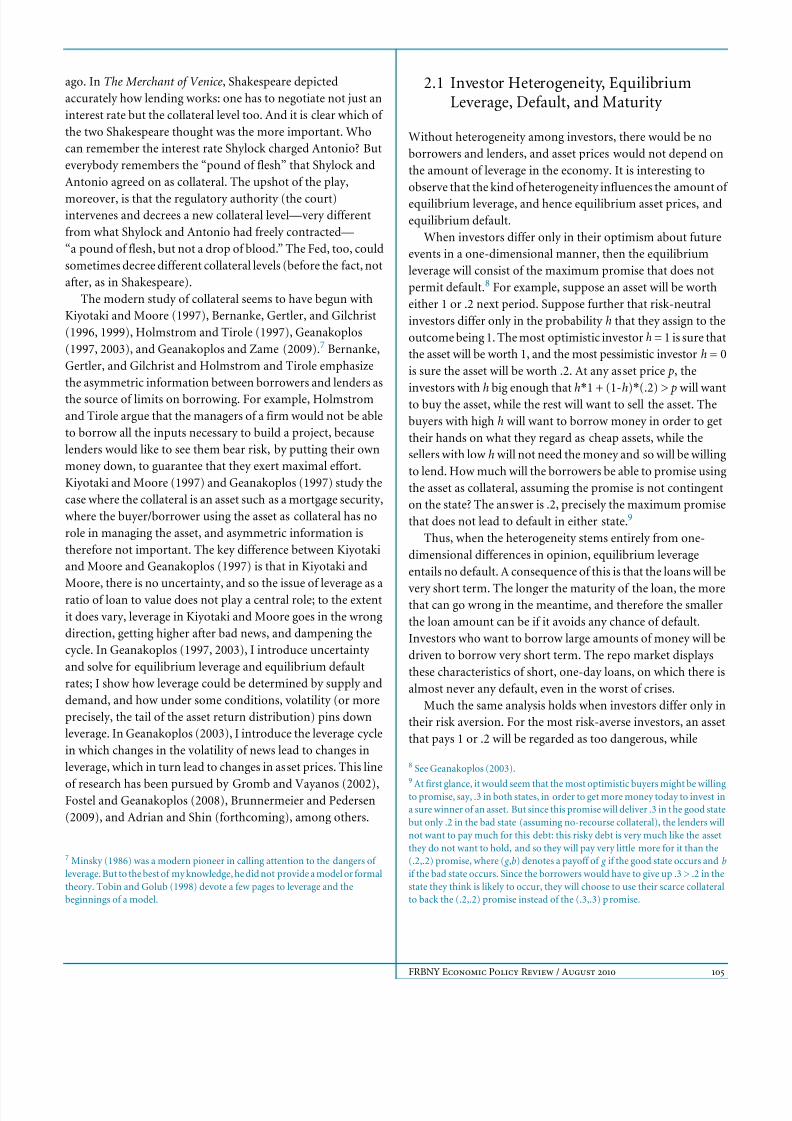
2.1 Investor Heterogeneity, EquilibriumLeverage, Default, and Maturity
Without heterogeneity among investors, there would be no
borrowers and lenders, and asset prices would not depend on
the amount of leverage in the economy. It is interesting to
observe that the kind of heterogeneity influences the amount of
equilibrium leverage, and hence equilibrium asset prices, and
equilibrium default.
When investors differ only in their optimism about future
events in a one-dimensional manner, then the equilibrium
leverage will consist of the maximum promise that does not
permit default.8 For example, suppose an asset will be worth
either 1 or .2 next period. Suppose further that risk-neutral
investors differ only in the probability h that they assign to the
outcome being 1. The most optimistic investor h = 1 is sure that
the asset will be worth 1, and the most pessimistic investor h = 0
is sure the asset will be worth .2. At any asset price p, the
investors with h big enough that h*
1 + (1-h)*
(.2) > p will wantto buy the asset, while the rest will want to sell the asset. The
buyers with high h will want to borrow money in order to get
their hands on what they regard as cheap assets, while the
sellers with low h will not need the money and so will be willing
to lend. How much will the borrowers be able to promise using
the asset as collateral, assuming the promise is not contingent
on the state? The answer is .2, precisely the maximum promise
that does not lead to default in either state.9
Thus, when the heterogeneity stems entirely from one-
dimensional differences in opinion, equilibrium leverage
entails no default. A consequence of this is that the loans will be
very short term. The longer the maturity of the loan, the morethat can go wrong in the meantime, and therefore the smaller
the loan amount can be if it avoids any chance of default.
Investors who want to borrow large amounts of money will be
driven to borrow very short term. The repo market displays
these characteristics of short, one-day loans, on which there is
almost never any default, even in the worst of crises.
Much the same analysis holds when investors differ only in
their risk aversion. For the most risk-averse investors, an asset
that pays 1 or .2 will be regarded as too dangerous, while
8 See Geanakoplos (2003).9
At first glance, it would seem that the most optimistic buyers might be willingto promise, say, .3 in both states, in order to get more money today to invest in
a sure winner of an asset. But since this promise will deliver .3 in the good state
but only .2 in the bad state (assuming no-recourse collateral), the lenders will
not want to pay much for this debt: this risky debt is very much like the asset
they do not want to hold, and so they will pay very little more for it than the
(.2,.2) promise, where ( g ,b) denotes a payoff of g if the good state occurs and b
if the bad state occurs. Since the borrowers would have to give up .3 > .2 in the
state they think is likely to occur, they will choose to use their scarce collateral
to back the (.2,.2) promise instead of the (.3,.3) promise.

8/9/2019 FRBNY Policy Review
http://slidepdf.com/reader/full/frbny-policy-review 6/31
106 Solving the Present Crisis and Managing the Leverage Cycle
investors with greater risk tolerance will find it attractive at the
right price. These risk-tolerant investors will leverage their
purchases, by borrowing money to buy the asset, using it as
collateral for their loan. Once again, the equilibrium leverage
will rise to the point that the promises made will be (.2,.2) but
no more (see footnote 9 for an explanation of notation). To be
more concrete, suppose contrary to the previous case, that all
the agents regard the outcomes 1 and .2 as equally likely. Butsuppose that untraded endowments rise and fall together with
the asset payoffs. Then risk-averse agents on the margin will
regard an extra penny when the asset pays 1 as less valuable
than an extra penny when the asset pays .2; on the margin, they
would prefer a penny when the asset pays .2. Hence, they will
behave as if they regarded the payoff of 1 as less likely, exactly
the same way the pessimists behaved, despite having the same
beliefs as the risk-tolerant agents. Equilibrium leverage with
heterogeneous risk aversion becomes the same as with
heterogeneous beliefs.
The situation changes when some investors simply like
owning the asset for its own sake in the period they buy it, such
as when a homeowner likes living in the house. A similar
situation arises if a producer can get more output from the
asset than can be recovered if the lender takes it over.
Somewhat surprisingly, in these cases the equilibrium leverage
might be to promise (1,1) even when the asset will only deliver
(1,.2) with probabilities everyone agrees on. If there are
multiple states, and a cost of seizing the collateral, then the
equilibrium promise will be somewhere between the
maximum and minimum delivery. Contrary to the previous
two cases, equilibrium leverage will involve a distinctly positive
probability of default. Furthermore, in order to avoid thedefault costs of seizing the collateral, the equilibrium loans will
be longer term, as in the mortgage market, where we see
defaults and long-maturity loans.
2.2 The Crisis Stage
The crisis stage of the leverage cycle always seems to unfold in
the same way. First there is bad news. That news causes asset
prices to fall based on worse fundamentals. Those price
declines create losses for the most optimistic buyers, precisely
because they are typically the most leveraged. They are forced
to sell off assets to meet their margin restrictions, even when
the margins stay the same. Those forced sales cause asset prices
to fall further, which makes leveraged buyers lose more. Some
of them go bankrupt. And then typically things shift: the loss
spiral seems to stabilize—a moment of calm in the hurricane’s
eye. But that calm typically gives way when the bad news is the
scary kind that does not clarify but obscures the situation and
produces widespread uncertainty and disagreement about
what will happen next. Suddenly, lenders increase the margins
and thus deliver the fatal blow. At that point, even modestly
leveraged buyers are forced to sell. Prices plummet. The assets
eventually make their way into hands that will take them only
at rock-bottom prices.
During a crisis, margins can increase 50 percent overnight,and 100 percent or more over a few days or months. New
homeowners might be unable to buy, and old homeowners
might similarly be unable to refinance even if the interest rates
are lowered. But, holding long-term mortgages, at least they do
not have to put up more cash. For Wall Street firms, the
situation is more dire. They often borrow for one day at a time
in the repo market. If the margins double the next day, then
they immediately have to double the amount of cash they hold
for the same assets. If they do not have all that cash on hand,
they will have to sell the assets. This is called deleveraging.
All this would happen even if traders were completely
rational, processing information dispassionately. When we add
the possibility of panic and the turmoil created by more and
more bankruptcies, it is not surprising to see lending
completely dry up.
2.3 The Aftermath of the Crisis
After the crisis ends, many businesses and individuals will be
broke and unemployed. Parts of the economy will be disrupted,
and some markets may be on the verge of shutting down. Thegovernment will then face the choice of who to assist, and at
what cost. This assistance will typically be very inefficient,
causing further losses to economic productivity. Doubts about
which firms will survive will create more uncertainty,
contributing to a difficult lending environment.
2.4 What Is So Bad about the Leverage Cycle?
The crisis stage is obviously bad for the economy. But the
leverage that brings it on stimulates the economy in good
times. Why should we think the bad outweighs the good? After
all, we are taught in conventional complete-markets economics
that the market decides best on these types of trade-offs. In
Geanakoplos (2010), I discuss eight reasons why the leverage
cycle may nevertheless be bad for the economy. The first three
are caused by the large debts and numerous bankruptcies that
occur in big leverage cycles.

8/9/2019 FRBNY Policy Review
http://slidepdf.com/reader/full/frbny-policy-review 7/31
FRBNY Economic Policy Review / August 2010 107
First, optimistic investors can impose an externality on the
economy if they internalize only their private loss from a
bankruptcy in calculating how much leverage to take on. For
example, managers of a firm calculate their own loss in profits
in the down states, but sometimes neglect to take into their
calculations the disruption to the lives of their workers when
they are laid off in bankruptcy. If, in addition, the bankruptcy
of one optimist makes it more likely in the short run that otheroptimists (who are also ignoring externalities) will go
bankrupt, perhaps starting a chain of defaults, then the
externality can become so big that simply curtailing leverage
can make everybody better off.
Second, debt overhang destroys productivity, even before
bankruptcy, and even in cases when bankruptcy is ultimately
avoided. Banks and homeowners and others who are
underwater often forgo socially efficient and profitable
activities. A homeowner who is underwater loses much of the
incentive to repair a house, even if the cost of the repairs is less
than the gain in value to the house, since increases in the value
of the house will not help him if he thinks he will likely beforeclosed eventually anyway.10
Third, seizing collateral often destroys a significant part of
its value in the process. The average foreclosure of a subprime
loan leads to recovery of only 25 percent of the loan, after all
expenses and the destruction of the house are taken into
account, as I discuss later. Auction sales of foreclosed houses
usually bring 30 percent less than comparable houses sold by
their owners.
The next four reasons stem from the swings in asset prices
that characterize leverage cycles. A key externality that
borrowers and lenders in both the mortgage and repo markets
do not recognize is that if leverage were curtailed at the high
end of the leverage cycle, prices would fall much less in the
crisis. Foreclosure losses would then be less, as would
inefficiencies caused by agents being so far underwater. One
might argue that foreclosure losses and underwater
inefficiencies should be taken into account by a rational
borrower and lender and be internalized: it may be so
important to get the borrower the money, and the crisis might
ex ante be so unlikely, that it is “second best” to go ahead with
the big leverage and bear the cost of the unlikely foreclosure.
But that overlooks the pecuniary externality: by going into
foreclosure, a borrower lowers housing prices and makes it
more likely that his neighbor will do the same.
Fifth, asset prices can have a profound effect on economic
activity. As James Tobin argues with his concept of Q, when the
prices of old assets are high, new productive activity, which often
involves issuing financial assets that are close substitutes for the
old assets, is stimulated. When asset prices are low, new activity
might grind to a halt.11 When asset prices are well above the
10 See Myers (1977) and Gyourko and Saiz (2004).
complete-markets price, because of the expectation by the
leveraged few that good times are coming, a huge wave of
overbuilding usually results. In the bad state, this overbuilding
needs to be dismantled at great cost and, more importantly, new
building nearly stops. To make the point a bit more dramatically,
very high leverage means that the asset prices are set by a small
group of investors. If agent beliefs are heterogeneous, why
should the prices be determined entirely by the highest outliers?In the current crisis, as I observed earlier, the $2.5 trillion of toxic
mortgage securities were purchased with about $150 billion in
cash and $2.35 trillion in loans. As of 2006, just two men, Warren
Buffet and Bill Gates, between them had almost enough money
to purchase every single toxic mortgage security in the whole
country. Leverage allows the few to wield great influence on
prices and therefore on what is produced.12
Sixth, a large group of small businesspeople who cannot buy
insurance against downturns in the leverage cycle can easily sell
loans to run their businesses or pay for their consumption in
good times at the height of the leverage cycle, but have a hard
time at the bottom. Government policy may well have the goal of
protecting these people by smoothing out the leverage cycle.13
Seventh, the large fluctuations in asset prices over the
leverage cycle lead to massive redistributions of wealth and
changes in inequality. When leverage = 30, there can be wild
swings in returns and losses. In the ebullient stage, the
optimists become rich as their bets pay off, while in the down
states, they might go broke. Inequality becomes extreme in
both kinds of states.14
The eighth problem with the leverage cycle is caused by the
inevitable government responses to the crisis stage. In an effort
to mitigate the crisis, the government often intervenes ininefficient ways. In the current crisis, the government is
supporting the financial sector by holding the federal funds rate
near zero. The government’s foreclosure prevention efforts
have created financial subsidies for households that opt not to
move, which can create inefficiencies in labor market
adjustment.15 Government bailouts, even if they were all for
the public good, cause resentment from those who are not
bailed out. The agents in the economy do not take into account
that by leveraging more and putting the economy at greater
11 See Tobin and Golub (1998).12 Standard economics does not really pay any attention to the case where
agents have different beliefs, and median beliefs are closer to the truth thanextreme outliers.13 Here I rely on Tobin’s Q and the absence of insurance markets. The small
businessmen cannot insure themselves against the crisis stage of the leverage
cycle. In conventional complete-markets economics, they would be able to
buy insurance for any such event. Geanakoplos and Polemarchakis (1986)
offer a proof that when insurance markets are missing, there is almost always
a government intervention in the existing markets that will make everyone
better off.14 This is a purely paternalistic reason for curtailing leverage.15 See Ferreira et al. (forthcoming).
λ

8/9/2019 FRBNY Policy Review
http://slidepdf.com/reader/full/frbny-policy-review 8/31
108 Solving the Present Crisis and Managing the Leverage Cycle
Chart 1
Housing Leverage CycleMargins Offered (Down Payments Required) and Home Prices
Sources: First American CoreLogic LoanPerformance Data Base;Ellington Capital Management.
Notes: The down payment axis has been reversed, because lower downpayment requirements are correlated with higher home prices. For ever y alt-A or subprime first-lien loan origination f rom 2000:1 to 2008:1, thedown payment percentage was calculated as appraised value (or sale price,if available) minus total mortgage debt, divided by appraised value. For each quarter, the down payment percentages were ranked f rom highestto lowest, and the average of the bottom half is shown. This number isan indicator of the down payment required; clearly, many homeownersput down more than they had to, which is why the top half is droppedf rom the average. A 13 percent down payment in 2000:1 correspondsto leverage of about 7.7, and a 2.7 percent down payment in 2006:2corresponds to leverage of about 37. Subprime/alt-A issuance endedin 2008:1.
Down paymentfor mortgage (percent)
20
15
10
5
0
09080604022000
100
120
140
160
180
200
Case-Shillernational HPI
Average down paymentfor 50 percent lowest
down payment, subprime/ alt-A borrowers
(Left scale)
Case-Shiller nationalhome price index (HPI)
(Right scale)
risk, they create more inefficient government interventions.
And of course, the expectation of being assisted by the
government, should things go wrong, causes many agents to
be more reckless in the first place.16
3. The Leverage Cycle of 2000-09Fits the Pattern
3.1 Leverage and Prices
By now, it is obvious to everybody that asset prices soared from
1999 (or at least after the disaster period that began September 11,
2001) to 2006, and then collapsed from 2007 to 2009. My thesis
is that this rise in prices was accompanied by drastic changes in
leverage, and was therefore just part of the 1999-2006 upswing
in the leverage cycle after the crisis stage in 1997-98 at the endof the last leverage cycle. I do not dispute that irrational
exuberance and then panic played a role in the evolution of
prices over this period, but I suggest that they may not be as
important as leverage; certainly, it is harder to regulate animal
spirits than it is leverage.
Let us begin with the housing bubble, famously documented
by Robert Shiller. In Chart 1, I display the Case-Shiller national
housing index for 2000-09. It begins at 100 in 2000:1, reaches
190 in 2006:2, and falls to 130 by 2009:1, as measured on the
right vertical axis. But I superimpose on that graph a graph of
leverage available to homeowners each month. This is
measured on the left vertical axis and labeled “Down payment
for mortgage,” which is 100 percent minus the loan-to-value
(LTV) ratio. To compute this, I begin by looking house by
house each month from 2000-09 at the ratio of all the
outstanding mortgage loans (usually a first and sometimes a
second lien) to the appraised value of the house at the moment
a first mortgage was issued for every subprime and alt-A house
available in the First American CoreLogic LoanPerformance
Data Base. I then average over the 50 percent houses with the
highest LTV levels.17 In this way, I obtain a robust estimate of
leverage offered to homeowners. By leaving out the bottom
50 percent, I ignore homeowners who clearly chose to leverageless than they could have, and by including all homes in the top
50 percent, I ensure that the leverage measure was really
available and not just a special deal for a few outliers. If
anything, my numbers underestimate the offered leverage.18
16 This mechanism has been formalized in Farhi and Tirole (2009).17 These data were compiled and analyzed by the research team at the hedge
fund Ellington Capital Management.
It is striking how correlated prices and leverage are, rising
and then falling together. Especially noteworthy is that leverage
peaks in 2006:2, with 2.7 percent down, exactly when housing
prices peak, and heads down much faster than housing prices.
In Chart 2, I present the history of the J.P. Morgan AAA
prime floater mortgage index from about 2000 to 2009. The
index is measured on the right vertical axis. The prime
mortgages underlying the bonds in the index were taken out by
investors with pristine credit ratings, and the bonds are also
protected by some equity in their deals. For most of its history,
this index stays near 100, but starting in early 2008, it falls
rapidly, plummeting to 60 in early 2009. The cumulative losses
on these prime loans even today are still in the single digits; it is
hard to imagine them ever reaching 40 percent (which would
mean something like 80 percent foreclosures with only 50 percent recoveries). It is of course impossible to know what
people were thinking about potential future losses when the
index fell to 60 in late 2008 and early 2009. My hypothesis is
that leverage played a big role in the price collapse.
18 At the peak of nonprime lending in mid-2005, these loans represented
45 percent of the flow of new mortgage borrowing (correspondence with
editors).
8/9/2019 FRBNY Policy Review
http://slidepdf.com/reader/full/frbny-policy-review 9/31
FRBNY Economic Policy Review / August 2010 109
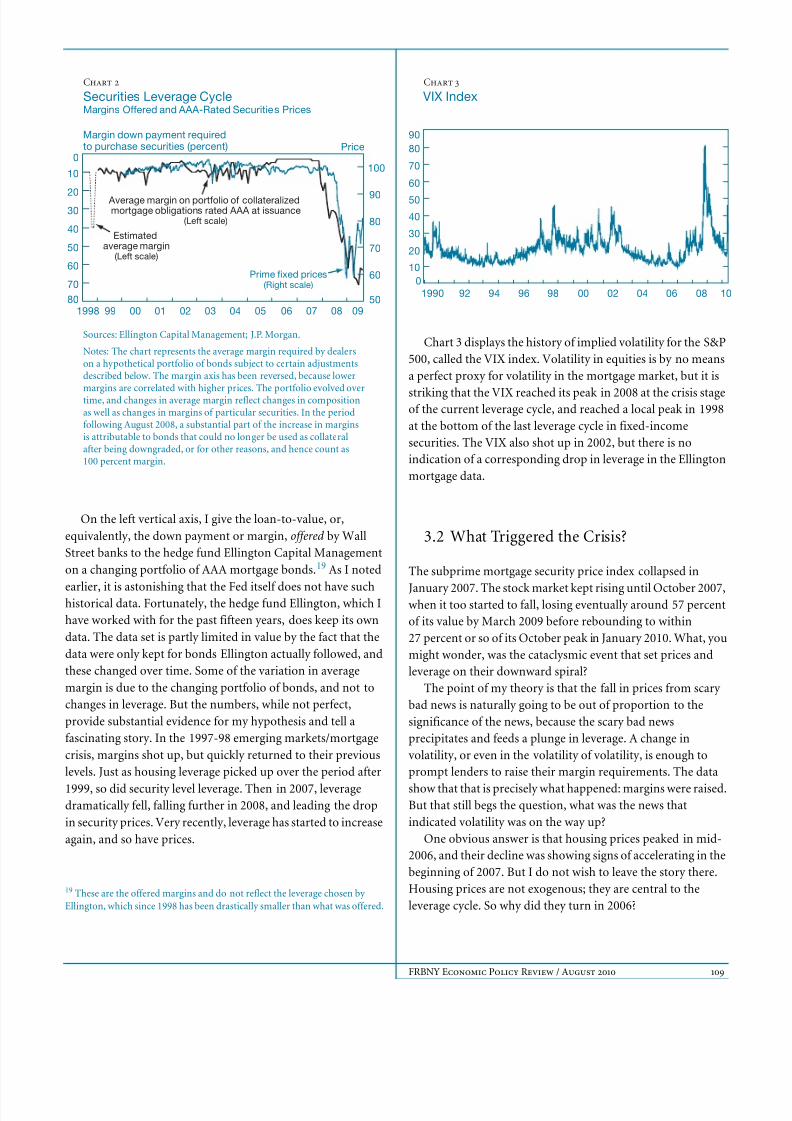
Chart 2
Securities Leverage CycleMargins Offered and AAA-Rated Securities Prices
Sources: Ellington Capital Management; J.P. Morgan.
Notes: The chart represents the average margin required by dealerson a hy pothetical portfolio of bonds subject to certain adjustmentsdescribed below. The margin axis has been reversed, because lower
margins are correlated with higher prices. The portfolio evolved over time, and changes in average margin reflect changes in compositionas well as changes in margins of particular securities. In the periodfollowing August 2008, a substantial part of the increase in marginsis attributable to bonds that could no longer be used as collateralafter being downgraded, or for other reasons, and hence count as100 percent margin.
Margin down payment requiredto purchase securities (percent) Price
80
70
60
50
40
30
20
10
0
09080706050403020100991998
Average margin on portfolio of collateralizedmortgage obligations rated AAA at issuance
(Left scale)
Estimatedaverage margin
(Left scale)
Prime fixed prices(Right scale)
50
60
70
80
90
100
Chart 3
VIX Index
10
20
30
40
50
60
70
80
90
989694921990
0
06040200 1008
On the left vertical axis, I give the loan-to-value, or,
equivalently, the down payment or margin, offered by Wall
Street banks to the hedge fund Ellington Capital Management
on a changing portfolio of AAA mortgage bonds.19 As I noted
earlier, it is astonishing that the Fed itself does not have suchhistorical data. Fortunately, the hedge fund Ellington, which I
have worked with for the past fifteen years, does keep its own
data. The data set is partly limited in value by the fact that the
data were only kept for bonds Ellington actually followed, and
these changed over time. Some of the variation in average
margin is due to the changing portfolio of bonds, and not to
changes in leverage. But the numbers, while not perfect,
provide substantial evidence for my hypothesis and tell a
fascinating story. In the 1997-98 emerging markets/mortgage
crisis, margins shot up, but quickly returned to their previous
levels. Just as housing leverage picked up over the period after
1999, so did security level leverage. Then in 2007, leveragedramatically fell, falling further in 2008, and leading the drop
in security prices. Very recently, leverage has started to increase
again, and so have prices.
19 These are the offered margins and do not reflect the leverage chosen by
Ellington, which since 1998 has been drastically smaller than what was offered.
Chart 3 displays the history of implied volatility for the S&P
500, called the VIX index. Volatility in equities is by no means
a perfect proxy for volatility in the mortgage market, but it is
striking that the VIX reached its peak in 2008 at the crisis stageof the current leverage cycle, and reached a local peak in 1998
at the bottom of the last leverage cycle in fixed-income
securities. The VIX also shot up in 2002, but there is no
indication of a corresponding drop in leverage in the Ellington
mortgage data.
3.2 What Triggered the Crisis?
The subprime mortgage security price index collapsed in
January 2007. The stock market kept rising until October 2007,when it too started to fall, losing eventually around 57 percent
of its value by March 2009 before rebounding to within
27 percent or so of its October peak in January 2010. What, you
might wonder, was the cataclysmic event that set prices and
leverage on their downward spiral?
The point of my theory is that the fall in prices from scary
bad news is naturally going to be out of proportion to the
significance of the news, because the scary bad news
precipitates and feeds a plunge in leverage. A change in
volatility, or even in the volatility of volatility, is enough to
prompt lenders to raise their margin requirements. The data
show that that is precisely what happened: margins were raised.But that still begs the question, what was the news that
indicated volatility was on the way up?
One obvious answer is that housing prices peaked in mid-
2006, and their decline was showing signs of accelerating in the
beginning of 2007. But I do not wish to leave the story there.
Housing prices are not exogenous; they are central to the
leverage cycle. So why did they turn in 2006?

8/9/2019 FRBNY Policy Review
http://slidepdf.com/reader/full/frbny-policy-review 10/31
110 Solving the Present Crisis and Managing the Leverage Cycle
Chart 4
Cumulative Loss of Original Balance
Source: Ellington Capital Management.
Cumulative loss (percent)
0
0.1
0.2
0.3
0.4
0.5
0.6
0.7
0.8
0.9
1.0
070605042003
Beginning of subprime crisis
2003
2004
2005 2006
2007
Chart 5
Delinquencies on Original Balance
Source: Ellington Capital Management.
OTS delinquent 90+ (percent)
0
2
4
6
8
10
12
14
16
070605042003
Beginning of subprime crisis
2003
2004
2005
2006
2007
3.3 Why Did Housing Prices Start to Fall?
Many commentators have traced the beginning of the
subprime mortgage crisis to falling housing prices. But they
have not asked why housing prices started to fall. Instead, they
have assumed that housing prices themselves, fueled on the
way up by irrational exuberance and on the way down by a
belated recognition of reality, were the driving force behind the
economic collapse.
I see the causality going in the other direction, starting with
the turnaround in the leverage cycle. The leverage cycle was of
course greatly exacerbated by the terrible consequences of
falling housing prices, which then fed back to cause further
housing declines.
As I hope I have made clear, in my view housing prices
soared because of the expansion of leverage. Greater leverage
enabled traditional buyers to put less money down on a bigger
house, and therefore pushed up housing prices. It also enabled
people to buy houses who previously did not have enough cash
to enter the market, pushing housing prices up even further.
There is, however, a limit on how much leverage can
increase, and on how many new people can enter the market.
Though negative amortizing loans pushed the envelope, no
money down is a natural threshold beyond which it is hard to
move. And as more and more households entered the market
with less and less money down, lenders began to become
apprehensive that these people were less reliable and more
inclined to exercise their put option to walk away from the
house if housing prices fell. The rapidly expanding supply of
new housing demand, fueled by access to easy mortgages,
began to slow for completely rational reasons, not because of asudden pricking of irrational exuberance. This naturally led to
a peak in housing prices by 2006:2. But this does not explain
why housing prices should steeply decline. Indeed, over the
next two quarters, prices and leverage waffled, both moving
slightly in a negative direction: During the last half of 2006,
housing down payment requirements rose slightly, from
2.7 percent to 3.2 percent, and prices fell slightly, by
1.8 percent.
At that point, bad news appeared in the securities market in
the form of rising delinquencies. Charts 4 and 5 show losses
and delinquencies of Countrywide deals by vintage.20 (These
deals are fairly representative of the whole subprime market.)One can see in Chart 4 that by January 2007, losses for the
2005 vintage were just 0.2 percent and losses for the 2006
vintage were nonexistent. But the 2005 and 2006 delinquencies
displayed in Chart 5 were already approaching 5 percent, more
than double those of previous vintages. More disturbing, they
showed no signs of leveling off. This is precisely the kind of
scary news that creates wide uncertainty about what might
20 Data were provided by Ellington Capital Management.
happen next. With that new information, how much
extrapolation should a buyer from 2006 have made in his
expectations of losses and delinquencies going forward?
The ABX index for 2006 vintage subprime bonds began to
fall in November 2006 with the smallest trickle of bad news
about homeowner delinquencies, then spiked downward in
January 2007 after the year-end delinquency report (Chart 6).
This price drop of 2006 BBB bonds to below 80 implied that the
market was suddenly anticipating huge losses on subprimedeals on the order of 10 percent. Recall that for a pool of
mortgages to lose 9 percent or 10 percent of its value, the
market must anticipate that something like 30 percent of the
homeowners will be thrown out of their houses, with 30 per-
cent losses on the mortgage on each home sold (30 percent x
30 percent = 10 percent). This expectation turned out to be not
pessimistic enough, but at that time it was a heroic
extrapolation from the observed delinquencies of less than
5 percent.21
8/9/2019 FRBNY Policy Review
http://slidepdf.com/reader/full/frbny-policy-review 11/31
FRBNY Economic Policy Review / August 2010 111
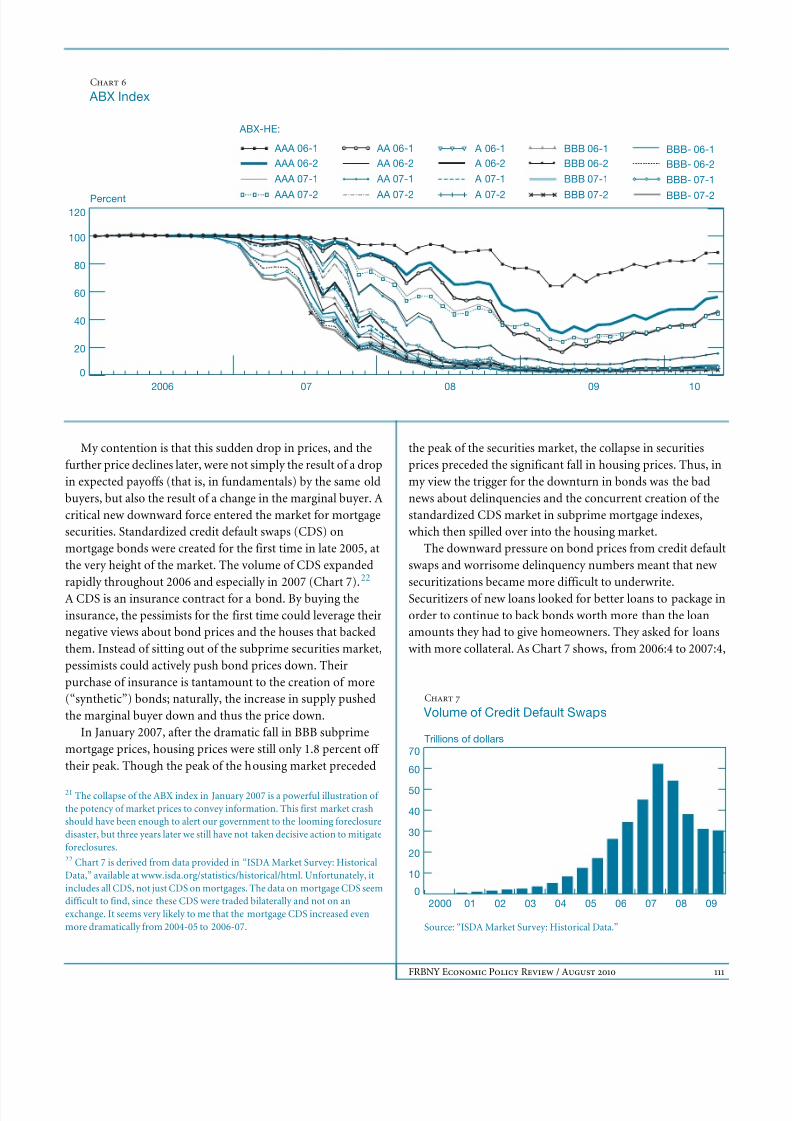
Chart 6
ABX Index
Percent
0
20
40
60
80
100
120
100908072006
ABX-HE:
AAA 06-1
AAA 06-2
AAA 07-1
AAA 07-2
AA 06-1
AA 06-2
AA 07-1
AA 07-2
A 06-1
A 06-2
A 07-1
A 07-2
BBB 06-1
BBB 06-2
BBB 07-1
BBB 07-2
BBB- 06-1
BBB- 06-2
BBB- 07-1
BBB- 07-2
Chart 7
Volume of Credit Default Swaps
Source: “ISDA Market Survey: Historical Data.”
Trillions of dollars
0
10
20
30
40
50
60
70
0908070605040302012000
My contention is that this sudden drop in prices, and the
further price declines later, were not simply the result of a drop
in expected payoffs (that is, in fundamentals) by the same old
buyers, but also the result of a change in the marginal buyer. A
critical new downward force entered the market for mortgage
securities. Standardized credit default swaps (CDS) on
mortgage bonds were created for the first time in late 2005, at
the very height of the market. The volume of CDS expanded
rapidly throughout 2006 and especially in 2007 (Chart 7).22
A CDS is an insurance contract for a bond. By buying the
insurance, the pessimists for the first time could leverage their
negative views about bond prices and the houses that backed
them. Instead of sitting out of the subprime securities market,
pessimists could actively push bond prices down. Their
purchase of insurance is tantamount to the creation of more
(“synthetic”) bonds; naturally, the increase in supply pushed
the marginal buyer down and thus the price down.
In January 2007, after the dramatic fall in BBB subprime
mortgage prices, housing prices were still only 1.8 percent off
their peak. Though the peak of the housing market preceded
21 The collapse of the ABX index in January 2007 is a powerful illustration of
the potency of market prices to convey information. This first market crash
should have been enough to alert our government to the looming foreclosure
disaster, but three years later we still have not taken decisive action to mitigate
foreclosures.22 Chart 7 is derived from data provided in “ISDA Market Survey: Historical
Data,” available at www.isda.org/statistics/historical/html. Unfortunately, it
includes all CDS, not just CDS on mortgages. The data on mortgage CDS seem
difficult to find, since these CDS were traded bilaterally and not on an
exchange. It seems very likely to me that the mortgage CDS increased even
more dramatically from 2004-05 to 2006-07.
the peak of the securities market, the collapse in securities
prices preceded the significant fall in housing prices. Thus, in
my view the trigger for the downturn in bonds was the bad
news about delinquencies and the concurrent creation of the
standardized CDS market in subprime mortgage indexes,
which then spilled over into the housing market.
The downward pressure on bond prices from credit default
swaps and worrisome delinquency numbers meant that new
securitizations became more difficult to underwrite.
Securitizers of new loans looked for better loans to package in
order to continue to back bonds worth more than the loan
amounts they had to give homeowners. They asked for loans
with more collateral. As Chart 7 shows, from 2006:4 to 2007:4,

8/9/2019 FRBNY Policy Review
http://slidepdf.com/reader/full/frbny-policy-review 12/31
112 Solving the Present Crisis and Managing the Leverage Cycle
the required down payment on houses rose dramatically from
3.2 percent to 15.9 percent (equivalently, LTV fell from 96.8
percent to 84.1 percent). This meant that potential new
homeowners began to be closed out of the market, which of
course reduced home prices. In that same period, housing
prices began to fall rapidly, declining by 8.5 percent.
But more insidiously, the desire by lenders to have more
collateral for each dollar loaned kept homeowners fromrefinancing because they simply did not have the cash: given
the drop in the permissible LTV ratio, and the fall in housing
prices, they suddenly needed to put down 25 percent of their
original loan in cash to refinance. Refinancing virtually stopped
overnight. Until 2007, subprime bondholders could count on
70 percent or so of subprime borrowers refinancing by the end
of their third year.23 These homeowners began in pools that
paid a very high rate of interest because of their low credit
rating. But after two years of reliable mortgage payments, they
would become eligible for new loans at better rates, which they
traditionally took in vast numbers. Of course, a prepayment
means a full payment to the bondholder. Once refinancingplummeted and this sure source of cash disappeared, the bonds
became much more at risk and their prices fell more. Margins
on bonds began to tighten.
Mortgagees who had anticipated being able to refinance
were trapped in their original loans at high rates; many
subsequently became delinquent and entered foreclosure.
Foreclosures obviously lead to forced sales and downward
pressure on housing prices. And falling home prices are a
powerful force for further price reductions, because when
house values fall below the loan amount, homeowners lose the
incentive to repay their loans, leading to more defaults,
foreclosures, and forced selling. All this leads back to fallingsecurity prices and tighter margins on securities.
The feedback from falling security prices to higher margins
on housing loans to lower house prices and then back to tougher
margins on securities and to lower security prices and then back
again to housing is what I call “the double leverage cycle.”
4. Why this Leverage Cycle Is theWorst since the Great Depression
Every leverage cycle has the same broad features. The crisis
stage of every leverage cycle is bad. But the current crisis is far
worse than the crises we saw in the two previous leverage cycles.
There are a number of reasons why this cycle is worse than all
previous cycles since the Depression, but the unifying theme
23 Seventy-four percent of all subprime loans issued in or before 2004 had
refinanced by the end of their third year, according to the First American
CoreLogic LoanPerformance Data Base.
behind all of them is a failure to put up enough collateral to
back promises.
4.1 Securities Leverage Got Higher thenFell Farther than Ever Before
In this cycle, leverage on traditional collateralizable assets
increased to more than the highs from the previous cycle. That
can be seen in the history of one mortgage hedge fund’s
margins (haircuts) over the last eleven years (Chart 2). Note in
the chart that before the crisis of 1997-98 that ended the last
leverage cycle, leverage was about 10 to 1 (margins were about
10 percent). During the 1998 crisis, margins jumped to
40 percent, staying there about two months, before returning
to their previous levels of 10 percent. In the “great moderation”
in the nine years afterward, when volatility got very low,
leverage increased from about 10 to 1 to about 20 to 1 (the
margins fell from 10 percent to 5 percent).Beginning in 2007 (after reaching its peak in 2006), leverage
collapsed, with margins going from 5 percent to 70 percent on
average. Two years after the collapse, leverage was still low,
whereas in 1998 the crisis was all over in two months.
The most dramatic change in margins has come from assets
that were rated AAA, and that have been, or are about to be,
downgraded. Previously, one could borrow 90 or even 98.4 cents
on a dollar’s worth of AAA assets, and now one cannot borrow
anything at all with these assets as collateral. According to
Moody’s, AAAs are supposed to have a 1 in 100 risk of default
over a ten-year period.24 We are now seeing over 50 percent of all
alt-A and subprime AAA bonds partially defaulting, and we will
see virtually 100 percent of all AAA collateralized debt
obligations (CDOs) partially default. Even when some assets
have little or no chance of losing more than a few percent of their
value, the market no longer trusts the AAA rating, and lenders
will not lend anything on them.
In the run-up to the present crisis, financial innovation
enabled many new kinds of assets to become usable as
collateral. Thus, even if margins had not declined on old
collateral, the leverage of the economy as a whole would have
increased because there was new borrowing backed by
previously unusable collateral, which brings us to pooling andsecuritization.
The process of pooling and securitization has been a crucial
source of new collateral and increased leverage. Imagine a
single subprime mortgage loan. Even in the days when it was
believed that the expected loss from such a mortgage was
between 1 percent and 4 percent, people still recognized that
24 See Backman and O’Connor (1995).
8/9/2019 FRBNY Policy Review
http://slidepdf.com/reader/full/frbny-policy-review 13/31
FRBNY Economic Policy Review / August 2010 113
there was a nontrivial chance of a much bigger loss on a single
loan. Lenders, inherent pessimists, would not have considered
lending using a single subprime mortgage as collateral. But
now consider a pool of subprime mortgages from around the
country. If one believed that the loans were independent, so
that a housing price decline in Detroit did not imply a housing
price decline in California, then on a big enough pool of loans,
the chance for more than 30 percent default might beconsidered less than 1 in 10,000. Even a very pessimistic lender
who believed in a 4 percent expected loss per loan would be
willing to lend 70 percent of the value of the entire pool,
provided that he got paid before anyone else. Thus, a buyer of
the pool of mortgages could imagine borrowing 70 percent of
their collective value, when it would have been impossible to
borrow anything on the individual loans.
Securitization took this borrowing on pools one step further
by converting the loans into long-term loans. The underwriter
of the pool typically issued different bonds, whose payments
depended on the homeowners’ payments on their loans.
Consider, for example, a bond structure with just two
“tranches” of bonds. The senior tranche might pay interest
slightly above the riskless government rate on the best
70 percent of the loans. As long as losses on the pool are below
30 percent, the senior tranche holder continues to get paid his
interest and eventually his principal. The junior bondholder
receives what is left from the pool after the senior bondholder
is paid. The whole securitized structure can be interpreted as if
the buyer of the junior piece actually bought the whole pool,
using a long-term loan from the buyer of the senior piece,
collateralized by the whole pool. Once one understands the
juniors as effectively borrowing from the seniors, it becomesclear how the rapid spread of securitization over the last thirty
years, but especially over the last ten years, dramatically
increased the leverage in the system.
Another factor that dramatically increased overall leverage
in the system is the credit default swap, which I discuss shortly.
4.2 Housing and the Double Leverage Cycle
Leverage on houses got to be much higher in this leverage cycle.
In the recent leverage cycles, ending in 1994 and 1998,
homeowner leverage did not get remotely as high as it did in the
recent cycle. In 2006, many homeowners were borrowing with
basically no money down, or as little as 3 percent, as we saw in
Chart 1.25 New mortgages like option arms were invented,
which abetted this mad rush to loan homeowners all or nearly
all of the purchase price. Whereas previous cycles’ leverage
25 See Haughwout, Peach, and Tracy (2008) for details on leverage used for
nonprime borrowers from 2001 to 2007.
involved many financial institutions, it never involved such a
large fraction of the general population. When housing prices
and securities prices fell, millions of homeowners as well as
many of the most venerable financial institutions in America
found themselves underwater, owing more money than the
value of their assets.
Thus, the current cycle is really a double leverage cycle: not
only are the mortgage securities subject to the leverage cycle,but their “fundamental” cash flows (namely, homeowner
mortgage payments) are also subject to the leverage cycle.
These two cycles feed off each other. When margins are raised
on homeowners, it becomes more difficult to get a new
mortgage and home prices fall, jeopardizing mortgage
securities backed by houses. But more importantly, it becomes
more difficult for homeowners to refinance their old loans,
putting these loans and the securities they back in much more
jeopardy of defaulting. Similarly, when margins on securities
are raised and their prices fall, then in order to sell the securities
for higher prices, underwriters demand better underlying
mortgages, that is, more money down from home buyers.
4.3 Credit Default Swaps
The current cycle has been more violent because of the
standardization/creation of the derivative credit default swap
market for mortgages in 2005, just at the top of the leverage
cycle. One reason for the abruptness of the fall is that CDS
allowed pessimists to leverage at just the worst time. Once CDS
emerged, they were bound to put downward pressure onprices, because they allowed pessimists to express their views
for the first time and indeed leverage those views. Had the CDS
market for mortgages been around from the beginning, asset
prices might never have gotten so high. But their appearance at
the very top of the cycle guaranteed that there would be a fall.
Not only did CDS allow pessimists to leverage for the first
time, it also allowed them to leverage more than optimists.
When a bond trades near 100, but there is a perceptible chance
of a big drop in price, then in a rational world the writer of
insurance is almost always going to be asked to put up much
more collateral than the buyer of insurance, because his
potential liability is so high. A small group of pessimists cantherefore have an outsized negative impact on prices by
leveraging their CDS positions, since traders on the other side
will need far more capital to offset those positions.
A second reason why CDS made the fall much worse is that
in practice they allowed optimists to leverage even more than
they had before. To the extent that CDS did not lower prices
before any bad news, it was because leveraged optimists
increased their leverage by taking the other side of the CDS, on
8/9/2019 FRBNY Policy Review
http://slidepdf.com/reader/full/frbny-policy-review 14/31
114 Solving the Present Crisis and Managing the Leverage Cycle
top of their leveraged purchases of the underlying assets. But
this made the crash much bigger once the bad news hit. CDS is
a kind of insurance market for bond defaults, but instead of
cushioning losses, it made them much worse because often the
buyers of the bonds did not buy the insurance, they sold it. 26
One might mistakenly think that CDS should just wash out.
In other words, for every dollar lost on the insurance, there
should be a dollar gained by the recipient. But the optimisticwriters of insurance are very different from the pessimistic
buyers of insurance. When the bad news hits, the former lose
and must reduce their purchases of assets; the latter gain, but
still will not buy the assets. Writers of CDS insurance expose
the economy to the same problems of excessive leverage I
described earlier.
This brings us to the question of just how much leverage one
could actually obtain via the CDS market. Imagine a bond with
$100 face value that is trading for $98, and imagine a CDS
insurance contract promising $1 for every $1 the bond defaults.
The $98 price suggests expected losses to the insurance writer of
$2. If the bond rises to $99, the seller of insurance effectively
makes a dollar and if the bond price falls to $97, the insurance
writer effectively loses $1. Thus, writing insurance is tantamount
to owning the bond. One can therefore compare the collateral a
writer of CDS insurance had to put up with the down payment a
buyer of the bond would have had to make to see where leverage
was higher. It now appears that leverage was higher with CDS.
Many firms, like AIG, were allowed to write CDS insurance with
little or no initial margin. If enough collateral had been put up by
AIG, there would have been no reason to bail it (or more to the
point, all its counterparties) out.
The failure of some buyers of CDS insurance to insist onproper collateral from the writers of the insurance was made far
worse because the gains and losses from CDS are not netted.
A Firm B that was neutral, betting one way against Firm A on
tranche BBB, and betting the opposite way on the same tranche
against Firm C, could come out a loser anyway. If Firm A
defaults on its insurance payment, then B will be unpaid by A
but still on the hook for paying C. So instead of just one Firm A
going bankrupt and another Firm C going unpaid in the
absence of collateral, as would happen with netting, another
Firm B might also go bankrupt, closing shop, firing workers,
and creating other social costs.
Losses by leveraged buyers of assets can cause a chainreaction when a margin call forces a leveraged buyer to sell,
which might lower the price and force another leveraged buyer
to sell and so on. But with uncollateralized CDS, the chain
26 Of course, there were undoubtedly some hedge funds that bought bonds they
thought were undervalued, and bought insurance on similar bonds in order to
hedge their position against the risk of a market downturn. These are the
leveraged buyers that survived the crisis without a bailout. AIG is a classic
example of a writer of CDS insurance on mortgages that also held mortgage
securities (see Congressional Oversight Panel Report, June 10, 2010).
reaction is more direct: Firm B loses the money irrespective
of market prices. The implication I draw later is that there are
benefits from CDS being traded on an exchange instead of
in bilateral contracts, both to ensure that collateral is always
posted by the writer of the insurance and to make sure losses
are netted.
Another benefit of putting CDS on an exchange would be
the ease with which size and leverage could be monitored by regulators. In traditional insurance law, as I understand it,
there is a prohibition against overinsuring by taking out
insurance for more than the underlying asset, precisely because
of the moral hazard such practices entail. Similar prohibitions
could be adopted for CDS.27
4.4 Counterparty Risk
In bilateral CDS contracts, it was often the case that the insurer
did not post enough initial margin collateral to guaranteepayment after a big move in default probabilities. This CDS
problem illustrates a more general flaw in the whole system of
contracting on Wall Street. These contracts to a great degree
were written in such a way that only one side of every
transaction was presumed liable to default, so that only the
other side needed protecting. For example, in the repo market,
a hedge fund borrower gets a loan from an investment bank,
and puts up collateral at the bank worth more than the loan.
The investment bank is protected against the potential default
of the hedge fund, because in that event the collateral can be
sold to recover the loan amount. But the contract does not
contemplate the bankruptcy of the investment bank. What
recourse does the hedge fund have if the investment bank goes
out of business, shutting its doors and swallowing the collateral
security? Following the Lehman bankruptcy, traders who never
before had to give a second thought to these counterparty risk
questions suddenly had to reevaluate all their contracts, with
disastrous effects on liquidity and price discovery.
Now, this unplanned-for counterparty risk has become the
primary rationale for the government’s seemingly unending
commitment to inject capital into “too-big-to-fail” institutions.
“We can’t afford another Lehman,” is the common refrain;
we had to intervene with AIG not because it was so vital, but
because if it defaulted a chain reaction might ensue.
The prospective solution to the counterparty risk problem
is to ensure that both sides put up enough collateral. Of
course, people are now more alert to their counterparty
vulnerability than they were before, and thus pressure will
grow, for example, on repo lenders to warehouse the
27 See “A Daring Trade Has Wall Street Seething,” Wall Street Journal , June 12,
2009, about a writer of CDS insurance who found a way to make the bond pay
off to avoid paying the overinsurance.
8/9/2019 FRBNY Policy Review
http://slidepdf.com/reader/full/frbny-policy-review 15/31
FRBNY Economic Policy Review / August 2010 115
collateral at a third site that would not be compromised by the
bankruptcy of the lender. This raises questions about whether
there is enough collateral in the economy to back all the
promises people want to make, which I discuss at length in
Geanakoplos (1997) and Geanakoplos and Zame (2009). But
I believe there could be a government initiative to move as
many bilateral contracts onto exchanges as possible; agents
trading with the exchange will be required to put up
collateral, and the netting through the exchange will
economize on the collateral. As for any finance-related
bilateral contracting so particular that it could not be moved
to an exchange, the parties could either accept strict
disclosure requirements and limits on how much of this
contracting they could engage in or accept doing without the
instruments altogether.
4.5 Government Laxity, Deregulation, andImplicit Guarantees Increased Leverage
The mildness and shortness of the crisis stage of the last two
leverage cycles, in 1994 and 1998, may have led many people,
perhaps including the regulators, to ignore leverage altogether.
The abrupt tightening of margins in 1998 was explained by the
supposed irrationality of lenders, who it was said reacted by
raising margins after the fact, that is, after the fall in prices had
already occurred. It appears that virtually no lenders lost
money on loans against mortgage securities in that crisis. The
run-up in asset prices and home prices during the current cycle
was attributed mostly to irrational exuberance, instead of beingunderstood, first and foremost, as an inevitable consequence of
the increase in leverage. Partly as a result of this faulty narrative,
government authorities did nothing to curtail the dramatic
growth in homeowner leverage, or consumer leverage more
generally, or corporate leverage, or securities leverage. Banks
were allowed to move assets off their balance sheets and thus
avoid capital requirements, further increasing their leverage.
Not only did the Fed (and everyone else) react passively to
the rising leverage pervading the system, it encouraged the
deregulation that unleashed the leverage inherent in outsized
credit default swaps. As I mentioned earlier, outsized CDS
contracts seem on their face to be either gambling or writinginsurance in excess of the value of the property being insured.
Under either interpretation, they would have run afoul of state
laws prohibiting gambling or overinsurance. Thus, it took a
positive act of Congress to pass legislation in the Commodity
Futures Modernization Act of 2000 exempting CDS from those
limitations.
Perhaps the most important and unwitting government
stimulus to the increased leverage was the implicit government
guarantees for entities that were considered too-big-to-fail.
Fannie Mae and Freddie Mac grew bigger and bigger. The
presumed government guarantee on their promises enabled
them to leverage their assets to 30 or more, and still issue debt
just above Treasury rates. Without this implicit government
backing, they would never have been able to borrow so much
with such little capital.
Many investment banks were allowed to write CDS withoutcollateralizing their implicit promises, as I observed before. It
seems virtually inexplicable that Wall Street overlooked this
counterparty risk; more likely, many counterparties assumed
that these firms were implicitly backstopped by the Fed or the
Treasury. And indeed, despite some doubts when Lehman
collapsed, that expectation proved correct.28
4.6 The Rating Agencies Effectively Increased Leverage
The expansion of the mortgage market into less creditworthy
households made it more likely that a shock would someday be
“big and bad and scary,” creating more uncertainty and more
disagreement. The anticipation of that, however remote the
possibility seemed, should have made lenders nervous and
caused them to put a brake on leverage. This rational concern
was dramatically reduced by a faith many investors had in the
rating agencies and their default models, which were widely
relied upon by market participants (and the rating agencies
themselves), but which failed to account adequately for the
probability that defaults in certain circumstances would be
highly correlated. Some investors forgot the incentives of the
rating agencies and the incentives of many market actors to
downplay seriously the probability of highly correlated
defaults. In the face of a long history of low defaults and with
billions of dollars of deals waiting on the blessing of a small
handful of rating agency actors, it would have been astonishing
if ratings had been as tough as they should have been. The same
lesson applies to the mortgage brokers who were able to collect
fees for signing up borrowers without facing any losses
themselves if the borrowers defaulted.
4.7 Global Imbalances Increased Leverage
Caballero, Farhi, and Gourinchas (2008), Caballero (2010),
and others have suggested that the enormous savings glut
28Bear Stearns was sold to J.P. Morgan, which took on Bear’s obligations, but
only after the government guaranteed $29 billion of Bear’s assets. Many other
investment banks, like Goldman Sachs, were given emergency injections of
$10 billion of Troubled Asset Relief Program (TARP) money.

8/9/2019 FRBNY Policy Review
http://slidepdf.com/reader/full/frbny-policy-review 16/31
116 Solving the Present Crisis and Managing the Leverage Cycle
coming from Asia increased the demand for safe assets. This
presented a profit opportunity to American financiers, who
were thus stimulated to engineer the securitizations that
created apparently safe bonds out of risky assets. It is hard to
assess how important this factor is, but surely a gigantic
demand for safe bonds would indeed give a big incentive to
create those bonds and thus inevitably to concentrate more risk
in other bonds. However, that leaves unexplained why investors were willing to buy those other bonds, or why
investors bought so much of the new, “safe” AAA-rated bonds
even when their yields revealed that the market did not think
they were perfectly safe. The Chinese, for example, did not buy
these bonds and they did not lose money when they
subsequently defaulted. The global-imbalances hypothesis
relies on an additional mechanism for its power: global
imbalances created lower, truly safe rates, which led American
investors pursuing absolute yields to leverage more, for
example, by buying the new, “safe” bonds with borrowed
money to leverage their tiny excess spreads. Thus, we come
back to leverage.
4.8 All Upside Down
The upshot of the huge credit boom and the plunging prices
was that an extraordinary number of households, businesses,
and banks ended up upside down or underwater, that is, with
debt exceeding their assets. According to First American
CoreLogic, about 13 million of the 55 million mortgage holders
were underwater in early 2010. According to Lender Processing
Services, about 2 million families have lost their homes since
2007, 2.5 million more are in foreclosure, and another 3 million
are not currently paying their mortgages.
The government has assumed trillions of dollars of
mortgage debt through its guarantee of Fannie Mae and
Freddie Mac and through its Federal Housing Authority (FHA)
loans, and has invested hundreds of billions of dollars
supporting banks and firms like AIG; in addition, on account
of the huge number of failing banks, the Federal Deposit
Insurance Corporation is on the verge of borrowing from the
Treasury. A problem of too much private debt has morphed
into a problem of too much government debt.
4.9 Why Didn’t Wall Street Risk ManagersAnticipate the Collapse?
Having discussed many of the factors that exacerbated the crisis
of 2007-09, I am now in a position to assess the widely held
view that nobody saw it coming.
Nobody doubts that Wall Street understood that there was
considerable risk in subprime mortgage pools. That is why they
were tranched into different tiers, called AAA, AA, and down to
BBB. And these bonds were all senior to residual pieces and
overcollateralization, which together provided another 8 per-
cent of protection. So, the question is really not whether Wall
Street overlooked the risk, but rather how did it come to be that
Wall Street so badly underestimated the size of the risk?The answer, I believe, is that it was nearly impossible to
foresee the devastating consequences of the multiple feedbacks
between securities and houses embodied in the double leverage
cycle. Complex adaptive systems are notoriously hard to
predict. Contrary to the myth that nobody imagined that
housing prices could go down as well as up, I suspect that
virtually every large bank and hedge fund considered a scenario
in which housing prices went down at least 10 percent. Recall
that if 25 percent of the loans result in homeowners being
thrown out of their houses, with 25 percent losses on each
foreclosed home, that amounts to losses of just 6.25 percent =
.25 x .25 for the pool as a whole, which would leave the ratedbonds unscathed. Better still, if 70 percent of the homeowners
refinanced according to historical patterns, then even with
50 percent defaults and 50 percent losses on the remaining
30 percent of the loans, losses would come only to 6.75 percent
= 30 percent x .5 x .5. But how many anticipated that at the
same time as housing prices went down mortgage down
payments would rise to the point that subprime refinancing
virtually stopped, dropping from 70 percent to zero? Or that
subprime mortgage originations would cease, causing further
house declines? And that at the same time servicers and banks
would refuse to write down principal, leading to more
foreclosures and further house declines? And that in the face of
so much homeowner misery and the destruction of so much
property, the government would wait until March 2009—more
than two years after the crash of the subprime ABX index in
January 2007—to launch its Home Affordable Modification
Program (HAMP)?
5. The Solution to the Crisis:A Multi-Pronged Approach
Once the economy is plunged into circumstances as dangerous
as we saw last year, the government has no choice but to act
boldly. The correct course of action is to reverse the final stages
of the crisis and thus stop the panic. At the outset of this crisis,
I recommended the three-pronged approach I present here—
a thematic solution to the crisis that addresses in order of
importance all aspects of the final stages of the leverage.29
29 See Geanakoplos (2008).
8/9/2019 FRBNY Policy Review
http://slidepdf.com/reader/full/frbny-policy-review 17/31
FRBNY Economic Policy Review / August 2010 117
As I explained above, all leverage cycles end with 1) bad
news creating uncertainty and disagreement, 2) sharply
increasing collateral rates, and 3) losses and bankruptcies
among the leveraged optimists. These three factors reinforce
and feed back on each other. In particular, what begins as
uncertainty about exogenous events creates uncertainty about
endogenous events, like how far prices will fall or who will go
bankrupt, which leads to further tightening of collateral, andthus further price declines and so on. In the aftermath of the
crisis, we always see depressed asset prices, reduced economic
activity, and a collection of agents that are not yet bankrupt but
hovering near insolvency. How long the aftermath persists
depends on the depth of the crisis and the quality of the
government’s response. Whether we find ourselves in a similar
crisis in the future depends on whether, understanding how
leverage got us here, we adopt reforms that require supervisors
to monitor and regulate leverage in good times. First, I take up
what government actions could have been taken, and in what
order, to address the final stage of the double leverage cycle that
the government was called on to address in 2007.
The thematic solution once the crisis has started is to reverse
the three symptoms of the crisis: contain the bad news,
intervene to bring down margins, and carefully inject
“optimistic” equity back into the system. To be successful, any
government plan must respect all three remedial prongs, and
should be explainable and explained to the public in terms that
it can understand. Without public confidence, which can only
flow from public understanding, any federal government
(hereafter, “government”) plan undermines its own objectives
and limits its prospects for success. The government’s actions
thus far have not addressed all three prongs adequately andpolicymakers have thus far largely failed to explain how their
various solutions are tied to the roots of the crisis we face.
Unfortunately, the TARP, the government’s first
intervention plan to buy distressed assets, was not clearly
thought through and neither it, the ostensible solution, nor
the problem that required a solution were clearly explained.
After its announcement, asset prices fell further. But even now,
after the panic has subsided, we must ask who or what is the
government trying to save? Many in the public have come to
believe it is merely trying to save banks, or some big banks,
from failure because somehow their failure would signal a
catastrophe for the American brand, to be prevented at allcosts.30 The confusion about the government’s goals has
created its own set of problems, which we can ill afford.
Clarifying the government’s goals will be harder now, but it
remains an indispensible step.
30 “Sixty-seven percent (67 percent) of adults believe Wall Street will benefit
more from the new bank bailout plan than the average U.S. taxpayer.”
Rasmussen Reports, February 2009/56.
5.1 Step One—Addressing the PrecipitatingCause of the Crisis: “Scary Bad” News(Massive Uncertainty) about Housingand the Assets Built on Housing
To foster recovery from the dramatic final stage of a leverage
cycle as large as the one we have just experienced, thegovernment must address the cause of the uncertainty that
triggered the end stage. Without that, the efforts taken thus far
to bring margins down and recapitalize banks, even had they
been perfectly implemented, would not be enough to reverse
the cycle and restore the economy to health. In this crisis, with
its roots in housing, that means doing something for housing
prices and homeowners. This makes undeniable sense in this
crisis, not just because addressing the cause of the uncertainty
and disagreement (the scary bad news) is critical to reverse any
leverage cycle, but because the biggest social losses will
probably come from the displaced homeowners. And, of
course, the biggest reason for the tumbling mortgage security prices, and the resulting insolvency of the banking sector, is
fear that housing prices will keep falling.
Saving the Homeowners: Stemming the Tsunamiof Foreclosures to Come
One of the saddest stories in this financial meltdown is that
millions of homeowners are being thrown out of their homes
for defaulting on their mortgages. Throwing somebody out of
his home is tragic for the homeowner, but also very expensive
for the lender. One of the shocking aspects of the foreclosure
crisis is how low the recoveries have become on foreclosed
properties, after expenses. (Interestingly, the mortgage bond
index markets anticipated these bad recoveries.) Nobody gains
when the homeowners are thrown out and the banks and/or
investors collect pennies on the dollar for the money they
loaned. Yet, as we saw, 2 million homeowners have already
been evicted, another 2.5 million are seriously delinquent and
almost surely will be evicted in the near future, and at least
another 3 million will eventually default and be evicted if trends
continue. Without much bolder action than has thus far been
taken by the government, the stream of evictions and bad
recoveries for lenders will continue and accelerate, becoming a
torrent that will further depress housing prices and impede
economic recovery.
Negative equity is a key driver of mortgage defaults. When
faced with an income shock, borrowers who are in positive
equity have the option to sell the house rather than default.
Borrowers who are underwater (in negative equity) may
choose to default even in the absence of an income shock.

8/9/2019 FRBNY Policy Review
http://slidepdf.com/reader/full/frbny-policy-review 18/31
118 Solving the Present Crisis and Managing the Leverage Cycle
Chart 8
Monthly Net Flow (Excluding Modifications ) from
Less than Sixty Days to Sixty or More Days DelinquentBased on Performance from November 2008 to January 2009
for All Deals Issued in 2006
Note: Circles indicate median combined-loan-to-value (CLTV) ratiosby product.
Monthly default rate (percent)
BHPA-adjusted CLTV (percent)
Subprime
0
1
2
3
4
5
6
7
8
250200150100500
Option
adjus
table-ratemortgage
alt-A
Prime
The connection between LTV and default is illustrated in
Chart 8. For each mortgage in the First American CoreLogic
LoanPerformance Data Base, the current LTV is estimated by
taking the appraisal value of the house at the moment the first
loan was given, and then assuming thereafter that the house
changed in value according to the Case-Shiller index for houses
with the same Zip code.
As the chart shows, homeowners who have positive equity in their homes default infrequently. But for homeowners with
negative equity, the rate of default is staggering. For subprime
borrowers with a 160 percent loan-to-value ratio (that is, the
ratio of all the mortgages on the home divided by the current
home price), the default rate is 8 percent per month.
These findings seemed surprising when I first presented
them in a New York Times editorial written with Susan Koniak
on March 5, 2009 (Geanakoplos and Koniak 2009). But
nowadays, many other researchers are reaching the same
conclusion.31 The conclusion is an inescapable matter of
incentives. It may not be economically rational for a
homeowner to continue to pay off a $160,000 loan when his
house is only worth $100,000.32 Mortgage loans have turned
out to be no-recourse—after seizing the house, the lender
almost never comes after the borrower for more payments.
Besides the ability to live in the house, the only other thing the
homeowner loses by defaulting is his credit rating, but
especially for a nonprime borrower with a low credit rating to
begin with, how much can that be worth? Finally, a choice
today by a negative equity borrower to default may be moving
up in time a necessity to default at some point in the future. In
this case, the borrower’s credit rating will likely be damaged
anyway.
31 Haughwout, Peach, and Tracy (2008) stress the importance of negative
equity as a determinant of early defaults among nonprime borrowers. The
Congressional Oversight Panel cited negative equity as the single greatest
predictor of default in its report of March 6, 2009. It included the data I provide
here as evidence of this fact, data that I supplied to the Panel in advance of its
report, as well as data from an array of government agencies, all of which
corroborated the Ellington Capital Management data presented here. That is
not to say that joblessness is not now having a significant effect on default rates.
It is. But even now, negative equity is the best predictor of default and many
Americans with jobs are defaulting, and will continue to default, not just the
unemployed. See generally the Congressional Oversight Panel’s Report of
October 9, 2009, on the continuing foreclosure problem and the unimpressive
results from government foreclosure prevention efforts taken thus far. Finally,to the extent that job loss has become (it was not at the start of this crisis) a
significant cause of defaults, strong effective measures to eliminate the scary
bad news—that is, efforts to stabilize the housing market—will help the
economy recover faster and thus help the employment rate.32 The implication of this statement is that the HAMP plan of reducing interest
rates to lower mortgage payments to homeowners who are underwater is, at
least for those seriously underwater, an invitation or encouragement to act in a
manner that may make no or little economic sense, that is, stretching to make
mortgage payments, albeit lowered from their highs, on homes those people
will never own when many of them might be able to rent more cheaply.
Foreclosures are horribly expensive for the lender. At the
present time, subprime lenders collect about 25 cents per dollar
of loan when they foreclose. For example, if the loan is for
$160,000 and the house has fallen in value to $100,000 and the
homeowner defaults and is evicted, the lender can expect to get
back $40,000. It takes eighteen months on average to evict a
homeowner, and during that time he does not pay his mortgage
or his taxes, the house is often left empty and vandalized, a
realtor must be hired to sell the house, and so on. Of course, the
main reason the average recoveries are so low is that thedefaulters are the homeowners who are furthest underwater
(see Chart 8).
In a rational world, many foreclosure losses would never
happen. The lenders would renegotiate the loans by reducing
the principal so the homeowners could pay less and stay in their
homes, and the lenders would actually get more by avoiding the
losses from legal fees and bad home price sales. If the above
loan were written down to $80,000, the homeowner would
likely find a way to pay it, or else fix up the house and sell it for
$100,000. Either way, the lender would get $80,000 instead of
$40,000. That would have the further benefit of keeping many
homes off the market and thereby aid in the stabilization of home prices.
The Home Affordable Modification Program pays servicers
to temporarily reduce interest payments and to extend the term
of the mortgage in order to reduce the monthly payments on
the mortgage, but does not incentivize servicers to cut princi-
pal. Cutting monthly payments by half will temporarily reduce
the homeowner’s payments by the same amount that cutting
principal by half would. But under the government’s plan, the
8/9/2019 FRBNY Policy Review
http://slidepdf.com/reader/full/frbny-policy-review 19/31
FRBNY Economic Policy Review / August 2010 119
cut is temporary, not permanent, and thus is likely to lead to
many more defaults in the long run than cutting principal
would as soon as the interest rate goes back up.33 In fact, since
the homeowner will still be underwater, he will not in any
meaningful sense own his house. He will be less likely to make
repairs, he will not be able to give the house to his children, he
will not be able to sell it if he gets a job in another city.34 In
short, there is every reason to think he will likely default evenbefore the interest rate goes back up. For loan modifications
where there is no principal reduction, the redefault rate is
above 50 percent within nine months.35 Indeed, because the
government’s present plan allows servicers to increase
principal while cutting interest by adding fees and other costs
to the old principal amount, the plan is likely to leave more
homeowners underwater than there would be absent the plan
and others more deeply underwater—that is, with even less
chance of ever owning their homes and thus less incentive to
keep up with mortgage payments—than they would have
without this government “rescue” plan.
HAMP started off slowly and only recently is beginning to be
able to process a larger flow of mortgages. In the first six months
of the plan, according to the Congressional Oversight Panel’s
October 2009 report, only 85,000 mortgages had been modified,
and of those only 1,711 were “permanent” modifications (that is,
permanent/temporary, since interest rate reductions under the
plan are designed to end in a few years), and of those only 5
involved principal reductions.36 As of May 2010, HAMP had
started trial modifications on 1,244,184 loans, of which 429,696
had been canceled and 340,459 had been converted into
permanent modifications. Again, virtually none of the
permanent modifications involved principal reduction. Of the5.7 million loans that were delinquent sixty or more days in May,
only 1.7 million were eligible for HAMP modifications.
33 Haughwout, Okah, and Tracy (2009) find in a sample of pre-HAMP
subprime mortgage modifications that reducing principal is twice as effective
as cutting the interest rate in terms of reducing the post-modification redefault
rate.34 See Gyourko and Saiz (2004).35 See “OCC/OTS Mortgage Metrics Report,” 2Q 2009.36 To be clear, my criticism of HAMP is not based on the number of the t ime-
limited “permanent” modifications completed, but rather is centered on the
near-exclusive concentration on interest reduction and, as I explain in the text
below, on leaving the servicers in charge of the modification decision. I could
find no updated information in the report on how many, if any, of the trial orpermanent modifications involved principal reduction as opposed to interest
reduction, and I have no reason to assume that the percentage of modifications
with principal reductions has increased. It is also worth noting that in the
Congressional Oversight Panel’s Report of October 2009 (p. 127), the Panel
notes that the apparent rise in modifications due to the administration’s plan
might be overstated, as there was some evidence of a “substitution effect,” that
is, the number of “voluntary” modifications by servicers (or modifications
made outside of the administration’s plan) went down in the first six months
of the plan, suggesting that the gross number of modifications attributable to
the plan itself might be exaggerated. The new report by the government does
not provide data from which one can assess any substitution effect.
The design of any modification program must recognize
that the servicers have incentives that at times put them at odds
with bondholders and homeowners, so that they may actually
prevent modifications that would help lenders and home-
owners but hurt servicers. In the case of many nonprime
borrowers, the loans have been pooled in a trust, and their
principal has been tranched into many different bonds, each
held by a different investor. The lenders are the bondholders,
but they are numerous and dispersed and by contract have
given up the legal right to renegotiate with homeowners,
delegating that right to an agent.37 That agent is the servicer,
who has a fiduciary responsibility to act in the interests of the
bondholders in the trust.38 In “normal” times, this
arrangement worked tolerably enough. But in this crisis, with
so many mortgages in or near default, it has failed miserably for
at least four reasons, all traceable to a misalignment of interests
between servicers and those whose interests they are supposed
to protect, which has now ruptured with terrible effects.
First, modifying loans is a time-consuming and expensiveoperation. The servicers who have the legal right to make
modifications do not get paid directly for improving the cash
flows to loans. It is generally cheaper for them to move into
foreclosure. In particular, they have no incentive to set up the
huge infrastructure and to hire and train the extra staff
required to make sensible modifications on a grand scale.
Second, modifying the loans has different effects on different
bondholders. It has proved difficult to modify loans in a way that
pleases everyone. The servicers say they are terrified of lawsuits
from the bondholders if their modifications help most
bondholders but hurt others. For example, writing down
principal immediately may make more money for the trust as a
whole, but it would immediately wipe out the BBB bonds and
possibly other lower level bondholders. Letting the borrowers
remain in their houses without paying during the foreclosure
process means that during all that time all the bondholders,
including the BBB, get their coupons paid in full from servicer
advances. The servicers then recoup their advances, at the expense
of the trust, when the house is finally sold.39 In reality, servicers
37 It should be noted that this right was given up to avoid the collective action
problems inherent when the lenders are numerous and dispersed, and thus was
given to a third party (the servicer) to be exercised on the lender’s behalf, the
servicer acting as a fiduciary for the lenders. It was not given to the servicer tobe used to benefit the servicer’s interests at the expense of the principals (the
lenders), and using the discretion to modify or foreclose that way is self-dealing
on the part of servicers and a breach of their obligation to the lenders.38 See Alan Kronovet, “An Overview of Commercial Mortgage Backed
Securitization: The Devil Is in the Details,” 1 N.C. Banking Inst. 288, 311
(1997), explaining fiduciary duties of servicers. Section 1403 of the new
housing bill that was signed into law on July 30, 2008 (HR 3221, the Housing
and Economic Recovery Act of 2008, P.L. 110-289), lays out the f iduciary
responsibilities of servicers of pooled mortgages.39 This requires that the servicers have access to capital to f inance the coupon
payments until the foreclosure process is concluded.
8/9/2019 FRBNY Policy Review
http://slidepdf.com/reader/full/frbny-policy-review 20/31
120 Solving the Present Crisis and Managing the Leverage Cycle
were not deterred only by potential lawsuits. That was revealed
when Congress passed legislation that freed servicers from
lawsuits by bondholders.40 Principal reduction modifications
did not follow. To put it all another way, there is a complex
negotiation that is not taking place, and the government needs
to intervene to break an impasse for the public good.
Third, now that HAMP, which is based on interest
reductions, has given the servicers cover to reduce interest
instead of principal, they can be counted on to do the former
and eschew the latter. Cutting the principal by half, for
example, immediately reduces the servicer’s fee by half (since
the fee is computed as a percentage of principal), while cutting
interest does not. Moreover, cutting principal increases the
likelihood that the homeowner will sell or refinance, which
would cause the servicer to lose his fee entirely.
Fourth, the biggest servicers happen to be owned by the
biggest banks, which in turn own a huge number of second-lien
loans. Cutting principal on first loans almost implies cutting the
principal drastically, if not to zero, on second loans. But that
would mean that the banks could no longer hold the second-
liens on their books at potentially inflated prices. The banks want
desperately to postpone the write-down of those second-liens,
which is to say, they have yet another powerful motive not to do
what is in the interest of lenders, homeowners, and the economy
as a whole: reduce principal on the first-lien loans they are
servicing. By contrast, cutting interest on first-lien loans makes it
easier to justify carrying the second-liens on bank balance sheets
at higher values for the near term (which is what matters to the
banks), as homeowners are more likely to be able to make the
lower monthly payments (from lower interest rates) than their
original payments, at least in the short run.41 Another indication that servicers have bad incentives is that
when the big banks hold the same kind of loans in their private
portfolios, they do reduce principal. During the second quarter
of 2009, 30 percent of all modifications done to loans directly
held in bank portfolios involved some principal reduction.
During that same quarter, the servicers reduced principal on
0 percent of their loan modifications, as did the government-
owned agencies Fannie Mae and Freddie Mac.42
Loans that have not been securitized and are held entirely
by banks (whole loans) are also not being written down fast or
40 See Section 201 of the Helping Families Save Their Homes Act of 2009,preventing lenders/bondholders from suing servicers who modify mortgages
under a qualified mortgage modification plan, which is defined in the Act
broadly enough to include all economically sensible modifications, that is,
those with a reasonable prospect of returning more money to the lenders than
a foreclosure.41 Cutting the monthly payments will also push the likely default further into
the future. Under current accounting rules, this reduces the loss reserves that
the banks have to hold against these loans.42 See OCC/OTS Mortgage Metrics Report, Q2 2009.
far enough.43 The pathology this time is, if anything, more
distressing. It appears that the banks, abetted by the suspension
of mark-to-market rules, are unwilling to fully recognize the
losses that have occurred on their residential mortgages.44 They
may prefer to keep a mortgage on their books at $160,000, even
though it will eventually bring them only $40,000, than to
reduce the principal to $80,000 and mark the loan at this value
today. The suspension of mark-to-market rules has also fed thepathology discussed above on second-liens. Perpetuating a
conflict between the economic value and the accounting value
of an asset is bad government policy when it leads to actions
that further reduce the asset’s value. This conflict is also
obscuring the value of bank assets, many of which are being
guaranteed by the government, and thus in turn obscuring the
value of mortgage assets now owned by the government. In my
terms, this only ensures the continuation of “scary bad” news
(uncertainty), when the goal should be for government plans to
clarify the situation (the value of assets) that keeps leverage
severely constricted.
Insuring that economically efficient mortgage
modifications are made for borrowers can be greatly facilitated
by placing the decisions with impartial agents. In October 2008,
Susan Koniak and I urged the government to take the
reworking process out of the hands of the servicers and put the
decision into the hands of government-hired trustees. In our
approach, the government-hired trustees would be told only
about the homeowners, and would be blind to the bonds built
atop the loans. Their job would be to choose modifications or
foreclosure, whichever they judged would lead to the greatest
recovery for the lenders on the original loan. They would thus
be carrying out the duties of the servicers exactly as they were
intended, but free from the conflicts of interest and perverse
incentives that have prevented the servicers from carrying out
their mission.45
If there is a second-lien loan, the government trustees would
make the same calculation, deciding what modification, if any,
would maximize total revenue. If this involved reducing
principal, then the second-loan principal would be reduced to
43 At first, it appeared that they were not being written down at any greater rate
than securitized loans, although the data are not perfect on this. Foote et al.
(2009) argue that this showed there was no real incentive to write down loans.
Now, again based on imperfect data, there seems to be some evidence that
principal on whole loans, at least at some banks, is being written down more
often than principal on securitized loans (which effectively never see
reductions in principal), although reductions in principal on whole loans are
still much less frequent and much less widespread than one would expect to see
given the economics of the situation, that is, that reducing principal for many
underwater homeowners will yield much more money than foreclosure or
(over the long term) interest reductions.44 Banks may also still be holding out for some more direct government subsidy
for their failing whole loans, either through government assumption of the
mortgage risk or some other form of direct payment for anticipated whole loan
losses.
8/9/2019 FRBNY Policy Review
http://slidepdf.com/reader/full/frbny-policy-review 21/31
FRBNY Economic Policy Review / August 2010 121
zero. The second-loan holder could still receive some cash,
however. I would recommend distributing the same percentage
of the monthly payments to the second loan as it was getting
before principal was reduced for a period of, say, two years.
After that, the second loan would be completely extinguished
and all cash flows would flow to the first-loan holder.
For a vast number of homeowners now upside-down in
their mortgages, that is, owing more than their home ispresently worth, this process would likely result in a reduction
of principal. Why? Because reducing principal rather than
cutting interest rates would be more effective at preventing
defaults and would yield investors/lenders more money than
foreclosing, as we have seen.46
If the government handled this correctly, most homeowners
who were unable to pay the original loan but were willing and able
to pay a modestly lesser amount would get to stay in their homes,
the bondholders collectively would get more payments than they
are currently expecting (though some tranches would be hurt),
and the government would not have to invest any capital.
This plan is not the same as “cramdown” in bankruptcy,
which Congress has thus far rejected and which entails costs
and creates some perverse incentives that my plan avoids.
Giving reductions in principal through bankruptcy (assuming
the law were changed to allow that) would encourage
homeowners now current on their mortgages but underwater
and thus likely to default sometime in the future to default
immediately to support their petition for bankruptcy relief.
However, my plan, as originally conceived, does not build in
any incentives for the borrower to default in order to increase
the chance that the mortgage will be modified. Principal
reductions would be done first for homeowners who have notdefaulted yet, and only later for homeowners who have
defaulted under some special hardship. It would give
underwater homeowners now holding on for the short term a
continued incentive to keep paying until the government
trustees could evaluate their loans and circumstances for a
reduction in principal. Second, my plan differs from
bankruptcy in that it does not subject homeowners to the
shame and devastating harm to future credit and thus to their
economic circumstance that a bankruptcy proceeding entails.
Third, my plan contemplates putting local housing market
45
See Geanakoplos and Koniak (2008). Under this plan, the servicers wouldstill collect the servicing fees they do now. They would continue their duties of
sending letters to homeowners, collecting the monthly payments and
distributing them to bondholders, evicting homeowners who did not pay,
selling their homes, and so on. The only change is that the mortgage loan
modification would be taken out of their hands and put into the hands of the
government trustees. This reassignment of a particular duty in the contract is
not a “takings” from the servicer, among other reasons because the servicers
have failed to carry out their fiduciary obligations to the bondholders who
employ them to get the most possible value out of the loans. See Dana
(forthcoming).46 See Haughwout et al. (2009) for evidence based on subprime modifications.
experts and community bankers in place as government
trustees, not bankruptcy judges who are neither numerous
enough to handle the number of defaulting homeowners who
should justifiably qualify for principal reduction nor as
knowledgeable as the personnel I would put in charge.47 If my
plan were indeed up and running, bankruptcy might be
something worth considering as a true last resort for those
already deeply in default. Finally, bankruptcy involves all kindsof hidden costs, like lawyer fees and trustee expenses (on top of
the costs associated with the experts required to advise the
bankruptcy judges) that are unnecessary and wasteful for the
vast majority of homeowners and lenders who should be able
to make a win-win deal without incurring those costs.48
My original plan called for legislation to cut through the
agency-problem mess in securitized pools of mortgages by
eliminating contract provisions in pooling arrangements that
now enable servicers to act contrary to the interests of the
investors that the provisions were originally designed to
protect. Thus, I envisioned that the government trustees would
only be empowered to modify securitized mortgages. This
would leave unsolved the problem of whole loans that banks
are still refusing to modify sensibly, by writing down principal
for underwater homeowners.
I believe, however, that once a government program of
modifications for securitized loans proved its worth by
resulting in more recovery for investors, banks would be likely
to adopt similar standards to modify whole loans. Nonetheless,
a solid government plan to force sensible principal reductions
for securitized loans would, I believe, go a long way toward
convincing the banks that no better deal from the government
was forthcoming, particularly if the government clearly
articulated that this was so, and would exert discipline on the
valuation of the whole loans and second loans on the banks’
balance sheets. Obliging the banks to mark to market would, of
course, also push them to get the most value out of their loans
by writing down principal for underwater homes.
Finally, what if home prices vastly appreciate by the time the
homeowner sells his home? To prevent unwarranted windfall
profits to homeowners, the government plan could easily
require the homeowner to share 50/50 with the lenders any
appreciation in home price up to the full amortized value of the
original mortgage, and the plan might even provide that, for
houses sold for more than the original loan price, lendersreceive a greater percentage of the appreciation.
47 Indeed, it is highly doubtful that our bankruptcy courts could handle the job
Congress would be giving them if so-called cramdown legislation were
adopted, at least not if it were adopted without first having a plan like the one
I propose up and running to handle the vast majority of underwater
homeowners.48 My plan envisions the government paying for the trustees (community
bankers) to decide on whether principal modification would bring in more for
bondholders than foreclosure, but I estimate that government expenditure
should come to less than $5 billion.
8/9/2019 FRBNY Policy Review
http://slidepdf.com/reader/full/frbny-policy-review 22/31
122 Solving the Present Crisis and Managing the Leverage Cycle
A Floor to Housing Prices and Restarting PrivateLending on Mortgages: Government Equity Stakein Homes
There are at least four reasons to support housing prices
directly, in addition to doing so through effective foreclosure
relief. First, if housing prices held firm, fewer homeowners
would be underwater; thus, more would have an incentive tomake their payments. That would keep them in their homes.
Second, firm housing prices would staunch the losses on
mortgage securities even if there were foreclosures. Third, once
there is a floor to housing prices, pessimistic lenders would be
relieved of the disaster scenario for many mortgage securities,
and margins on mortgage securities would come down
significantly, enabling optimistic buyers to purchase them
using leverage, pushing up the price of mortgage securities.49
Fourth, the leverage cycle is less severe for housing than
for mortgage securities, so it can be fixed more easily by
government intervention, because home buyers generally lock
in their loans and leverage for the duration of time they live inthe house. Only new buyers of homes, and those who want to
change homes, need to confront the tougher margins. Existing
homeowners cannot be forced to put more money down,
whereas mortgage security holders who borrowed on one-day
repos have found that they now face tougher margin require-
ments that involve putting more money down. Thus, there are
fewer homes in play than there are mortgage securities.
The government has recognized the need to try and support
housing prices. A concern is that the measures taken will
expose the government to the risk of billions of dollars of future
losses, in addition to substantial current costs, while leaving
private mortgage lending dead in the water. We simply cannot
sustain a situation where all mortgage lending is done by the
government. The plan I propose helps to stabilize housing
prices and to reinvigorate private lending. And in the long run,
it may cost the government much less, possibly even making
money.
Current government FHA policy is to make mortgage loans
with as little as 3.5 percent down. In addition, borrowers can
finance some of their closing costs as well as the up-front
mortgage insurance premium. As a result, the effective LTV on
new FHA mortgages can exceed 100. These homeowners start
with little incentive to continue making payments, particularly in rough economic times. Given the transaction costs of selling
a house, absent a rise in housing prices these borrowers will
remain underwater and thus create a new source of future
defaults. This policy is a repetition (albeit on a smaller scale) of
49 As I discuss below, margins must in the future be monitored by the Federal
Reserve to assure that they do not once again get excessively low, precipitating
another massive and dangerous leverage cycle.
the low down payment lending practices that got us here. It
exposes the government to a huge risk of default, and does
nothing to stimulate private mortgage lending.50
The government has also tried to stabilize housing prices
through its efforts to keep mortgage interest rates low and
thereby encourage purchases and refinancing. To this end, the
Federal Reserve’s Large-Scale Asset Purchase program has
purchased $1.25 trillion of agency mortgage securities. Like theHAMP modification program, this choice reflects once again
a concentration on interest rates rather than on the collateral
(leverage) effects that are at the core of my argument. The
Large-Scale Asset Purchase program appears to have lowered
mortgage interest rates, but surprisingly few homeowners were
able to take advantage of the lower rates by refinancing because
they could not come up with a down payment and/or their
credit had deteriorated.51 One might worry that as the
purchases wind down, mortgage rates may go back up.
A third government initiative is to give an $8,000 tax credit
to buyers of homes. This tax credit does appear to have been
more successful at stimulating home purchases. But the tax
credit has no upside for taxpayers and it does nothing to
reinvigorate private lending since most of the new mortgages
were guaranteed by the FHA. If $8,000 were spent on 7 million
homes, the cost to taxpayers would come to $56 billion. By
contrast, the equity stake plan I propose below is a purchase of
value for value; in the long run, it may cost nothing and actually
have upside for taxpayers. It should also stimulate demand, and
it would reinvigorate private mortgage lending.
As I observed earlier, toughening margins have affected
housing prices, because many homeowners can no longer put
up the cash payment needed to buy new homes. Newhomeowners are being asked to put as much as 30 to 40 percent
down if they cannot get a government loan. The government
could stimulate demand for new purchases, and also mitigate
the margin problem, by offering to buy a 20 percent equity
stake in any new home purchase (under some maximum price,
as with agency conforming loans). Thus, suppose a house is
purchased for $100. The government pays $20 and gets a
20 percent equity piece, which it collects whenever the
homeowner sells. If down the line, the house sells for $200,
the government gets $40. The government is thus earning the
home price appreciation on its piece, without having to bear
the expense of maintaining the house. The homeowner gains
50 For more on FHA risk, see Aragon et al. (2010).51 See Caplin, Freeman, and Tracy (1997) for a discussion of down payment
constraints on refinancing and Peristiani et al. (1997) for a discussion of credit
constraints. To address this concern, the administration started the Home
Affordable Refinance Program, which allows borrowers with prime mortgages
to refinance with current LTVs as high as 125. In addition, the FHA introduced
a “streamline refinance” program for borrowers with high-LTV FHA loans to
refinance to a new FHA loan.

8/9/2019 FRBNY Policy Review
http://slidepdf.com/reader/full/frbny-policy-review 23/31
FRBNY Economic Policy Review / August 2010 123
because he gets to live in the whole house while paying for only
80 percent of it. If the home buyer needs a loan to get the house,
the government equity piece reduces the down payment the
buyer must make, and the ongoing mortgage payments he
must make. And if we make the government’s equity piece
the second loss piece, it leaves the lenders in a very, very safe
position, encouraging lending. In effect, it lowers the margin
to the borrower, and raises the margin of safety to the lender.Here is how it works.52
Under the plan, the home buyer who wanted a loan to
purchase the house would be allowed to borrow at most
80 percent of the $80 of the house he bought, or $64. He would
have to put up 20 percent x $80 = $16 of his own cash. The
homeowner would then have a big incentive to make his
payments. If he walks away from his debt, he can save $64, but
he has to give up living in a $100 house on which he had an $80
ownership share. But if the borrower does default, and if the
lender has to foreclose, the lender would be able to collect his
debt out of the house sale proceeds ahead of the government
equity piece. The government would collect next, and lastly the
buyer would get any leftover cash. If the house sold in
foreclosure (net of expenses) for $82, the lender would get his
$64, the government would get $18, and the homeowner
nothing. The effective margin for the homeowner is thus
16 percent on the asset price of $100, but the margin of safety
for the lender is 36 percent. This should make the lender feel
very safe and encourage private lending on mortgages. The
homeowner’s down payment of 16 percent on the total home
price is about half the down payment many nongovernment
lenders are demanding now. On top of that, the new buyer’s
mortgage payments would be 20 percent lower than before,
because he would be paying on a loan of $64 instead of $80.
What about the costs of my plan? Last year, there were
5.5 million new home purchases, down from a high of 7 mil-
lion. Even if the government had to buy the equity in the entire
7 million, at an average home price of $200,000, it would cost
$280 billion. But the government would own equity, and be
protected by the homeowner’s down payment. Housing prices
would need to fall another 16 percent before the government
lost equity value. As housing prices stabilized, the government
would gradually phase out the program, in all likelihood in a
year, at most two, after adoption. To lower the government’s
overall equity investment, the program could be limited tofirst-time home buyers.
52 Equity sharing arrangements could also form with private investors. For a
discussion, see Caplin et al. (1997).
5.2 Step Two—A Fed Lending Facility to Help Restore Reasonable Leverage
The most easily implementable step and the second priority,
after addressing the source of the uncertainty (the scary bad
news), in responding to the final stage of any leverage cycle
could be government action to decrease astronomical collateral
rates. Thus, in October 2008 I suggested that the most
immediate step the Federal Reserve could take was to lend
money using the so-called troubled assets (those that suddenly
became nearly impossible to use as collateral, as I explained
earlier) as no-recourse collateral. I suggested 50 percent
margins on average, a reasonable halfway level between the
5 percent margins required at the peak of the leverage bubble
and the 70-90 percent margin rate demanded in 2008. The
Asset-Backed Securities Loan Facility (TALF) and the Public-
Private Investment Program (PPIP), announced in early 2009
at what turned out to be the bottom of the price cycle, embody
the spirit of my recommendation. Indeed, the PPIP did lend onthese bonds at exactly 50 percent margins. The turnaround of
prime mortgage security prices (displayed in Chart 2) after
these programs were announced seems to me to be some
evidence for the wisdom of the intervention. But in terms of
some important details, those programs did not go as I would
have recommended. In any case, it now appears that having
achieved their purpose, they have been drastically attenuated.
Lending with smaller margins (haircuts) than the market is
willing to offer to borrowers who might not repay is a great
departure from the traditional role of the Federal Reserve. The
orthodox view is that the Fed injects liquidity into the system
by lending money to banks and others with impeccablereputations for repaying so as to reduce the riskless rate of
interest on very short-term loans. The banks would then
presumably turn around and relend that money to investors, at
a lower interest rate than would have obtained absent the Fed’s
intervention. However, the great bulk of lending in the
investment world is not based on the reputation of the
borrower but based instead on the value of the collateral. The
lesson of the leverage cycle is that when lenders demand too
much collateral for their loans, liquidity dries up. The Fed
cannot undo this by making riskless loans at a lower interest
rate than the market, because in liquidity crises it is not the
interest rate the banks charge that impedes investor borrowingbut rather the amount of collateral they require. The Fed needs
to step around the banks and make risky loans directly to
investors with smaller haircuts than the market demands, if
it is to have the desired effect.
The mechanics of such a massive lending program require
some careful thought, but nothing compared with the

8/9/2019 FRBNY Policy Review
http://slidepdf.com/reader/full/frbny-policy-review 24/31
124 Solving the Present Crisis and Managing the Leverage Cycle
difficulties of directly buying. The Fed could simply announce
that any arm’s-length buyer of any designated security could, at
the moment of purchase, take that security to the Fed and
receive a five-year loan of 50 percent of the price in exchange
for putting the security up as collateral. The Fed would not
need to price the security itself. The market would have just
done the pricing. With a 50 percent margin, the government
money is still quite safe. Remember, the 50 percent loan isagainst the price the securities will be traded at, not against the
original price when issued. The government could thereafter
monitor prices, periodically demanding more cash from the
borrower to maintain its 50 percent margin, which would make
the government lending safer and more responsible.53
Monitoring the collateral price is a much easier job than
deciding the price to buy, since there is a 50 percent margin of
error: the price monitoring only has to be half right. And the
government could consider charging a slightly higher interest
rate than the fed funds rate or discount rate, thereby potentially
making a profit for taxpayers. That would also make the
program easier for the public and politicians to accept.
Needless to say, the 50 percent margin cannot be applied
to all bonds. Some bonds have such high volatility in their
cash flows that even a 50 percent margin is unsafe. Other
bonds can safely be leveraged much more. The Fed must
exercise its own expertise in setting these margins, as I discuss
later. But in a crisis, they should be set at levels substantially
more generous than the market is offering, and significantly
less generous than the market had been offering in the
ebullient stage before the crisis.
The five-year term can also be chosen flexibly. But it is
important that there is a longish term commitment toborrowers that the loan will not be pulled from under them.
The last thing a buyer wants to do in a crisis is leverage to buy
and then have his financing pulled, or his margins increased. Of
course, the Fed needs to worry about its exit strategy; if it lends
too much money long term, it will not be able to reel it all back
in should inflation pick up. However, by lending at margins
and interest rates that are favorable in the crisis but that
borrowers will find onerous once markets pick up, and by
making margin calls, the Fed can count on most borrowers
refinancing their loans privately once the market heats up.
The government might even arrange all this lending without
having to come up with the money. Under this alternative, thegovernment could loan slightly less, say, 40 percent, and give
up the right to make margin calls. The loan could then be
securitized, guaranteed by the government, and sold off to the
private sector. With the government guarantee, the money
would easily be raised. Or even more directly, for some bonds
where this makes sense, the government could simply
53 Even if the securities gradually lost all their value, the Fed would still not lose
any money if it made frequent margin calls.
guarantee a certain percentage of the principal payments.
Private lenders could then lend this much without any risk of
default. Of course, on some securities the government might be
able to lend much more than 40 percent and still regard the
money as safe.
At 50 percent margins, buyers would be able to purchase
securities using only half the cash they need to put up at the
bottom of a cycle when margins might become 100 percent.Aside from allowing investors’ own cash to go further, this
borrowing allows investors to earn leveraged returns. If they
think the security trading for 60 might only rise to 66 in the near
future, they can buy it with 30 down and earn a return of
20 percent when it rises to 66 instead of a return of 10 percent.
Buying will be stimulated and the depressed prices at the
bottom of the leverage cycle will be pushed back up. Again, with
this potential for private profit, the program would make more
political sense if a somewhat higher interest rate for the loans
were charged, thus building in a real chance for taxpayer profit.
Lending is better than the government’s first (and quickly
shelved) idea, as proposed by former Treasury Secretary Henry
Paulson, of buying up the “troubled assets.” As I explained in
October 2008, lending against collateral does not require the
government to choose what prices to pay, as it would have to if
the Treasury directly bought securities. Moreover, lending,
unlike buying, is direct action to restore leverage and restoring
leverage is the thematic solution to the leverage cycle crisis. It is
not some stop-gap band-aid invented only under the pressures
of the moment.
Further, lending puts taxpayer money at far less risk than
buying does. Assuming the Fed lends at 50 percent margins,
every dollar the government lends using the targeted assets ascollateral will necessarily be matched by money the investor
spends on those assets. The government can say its money is
being leveraged. The investors who avail themselves of the
government lending will still have their money at risk. Because
these investors, and not the government, will do the buying,
there is little, if any, chance that this action will push prices
to outrageous levels and enrich undeserving sellers.
The Fed has boldly gone a long way in this direction, further
than any previous Fed. Through the TALF and the PPIP, the
Fed and the Treasury, respectively, have indeed embodied
many of these ideas. The PPIP lends at 50 percent margins
on troubled mortgage securities, just as I recommended. Its
announcement, I believe, played a pivotal role in starting what
is now more than a year-long rebound in security prices. Given
the condition of the asset markets in early 2009, the rebound in
prices seems almost miraculous, and in many ways one must
judge the TALF/PPIP a resounding success.
Nevertheless, I believe that the Fed-Treasury leverage
intervention would have been better if it had been
implemented somewhat differently. This difference is
8/9/2019 FRBNY Policy Review
http://slidepdf.com/reader/full/frbny-policy-review 25/31
FRBNY Economic Policy Review / August 2010 125
important to bear in mind not just for this crisis, but also in
case there is another crisis in which prices do not rebound as
quickly after a leverage intervention. In my opinion, the two
programs did not encompass a wide enough set of assets or a
wide enough set of borrowers, they took too long to get going,
and in some cases TALF actually took leverage up almost to the
crazy levels it had been before. Had TALF started earlier, and
had it lent on more assets, it would not have been forced to givesuch high leverage on the narrow band of assets it did lend
against.
In the emergency stages of the leverage cycle, the Fed should
have extended lending on more kinds of collateral. TALF
restricted leverage mostly to new securities, or to securities that
were still AAA-rated. As more and more mortgage securities
get downgraded below investment-grade status, they lose their
ability to be used as collateral even in the private sector.
Lending against the most toxic securities is actually necessary to
maintain their value.54
The TALF program made government loans on new credit
cards, auto loans, college loans, and other securitizations at 20
to 1 leverage. In my opinion, this repeats the error of the FHA
mortgage program, lending at the same inflated leverage that
got us into trouble in the first place. The Fed has rightly
observed that propping up new security values is more
important than propping up legacy security values, because
new securities represent new activities. When new prices go
down, new securities are not issued and the underlying activity
for which the securities would be issued (students going to
school, cars being purchased, new houses being built,
consumers buying with credit cards) stops. However, as I argue
more formally in Geanakoplos (2010), in the depths of theleverage cycle, the Fed could raise the price of new securities
further by leveraging them less, if it would also leverage the
legacy securities to modest levels. The reason is that potential
buyers of these new securities are tempted instead to put all
their capital into the depressed legacy assets where they are
nearly sure of a high return. This indeed is one of the main
reasons banks stop lending to businesses or homeowners: they
can get better returns by buying depressed legacy assets. Given
the depressed legacy security prices, the only way TALF could
redirect this private money into new securities was by giving
54 Again, such lending would be much less risky if the government had adopteda sensible plan to staunch foreclosures and stabilize housing prices, such as I
have just outlined, because such a plan would reduce the toxicity of the
securities at issue. And the quicker the government moves to do that, the less
risky such lending will become, not to mention the good it would do for the
value of the toxic securities the government now owns through one program
or another or now guarantees, representing continuing and enormous
government money still at considerable risk. This point is why I stress the
importance of understanding the nature of the crisis in crafting sensible
solutions and how failing to address one part of the problem, in our case the
failure to adequately address housing, limits the good that otherwise sensible
programs might make.
leverage on the new securities at astronomical 20:1 ratios. If
instead the Fed would give much lower and safer 2 to 1 leverage
on the legacy assets, it would raise the legacy asset prices, and
thus even the new security prices, because it would remove the
bargains investors are seeking in the legacy assets.55 The new
assets would not need so much leverage, and the risk to the
taxpayers would be reduced. This would also go a long way to
solving the bank lending problem. As I show again inGeanakoplos (2010) (in a stylized example, to be sure), despite
lending on a much larger scale, by allowing leverage at 2 to 1 on
a wide array of assets rather than at 20 to 1 on a narrow set of
assets, the Fed could actually reduce its expected defaults while
increasing the prices of all the securities. A year later, it now
appears that the Fed will not face significant losses on these
TALF loans, and private leverage is also returning. But had
things gone worse, the Fed might have been stuck with some
dangerous loans.
In the crisis stage, the Fed needs to go around the banks and
lend directly to more investors. In theory, the Fed could make
no-recourse loans only to a few banks, who would turn around
and relend to everyone else. But the banks are nervous about
showing too much lending on their books, they ask for too
much collateral, and now the Fed is giving them more
profitable ways to make money than by lending; so the Fed
must reach out directly to more borrowers. Curiously, the PPIP
has been restricted to ten potential borrowers/investors,
making its scope and size in the end less than what was
anticipated. Also, with only ten investors taking government
money, the potential for conflicts of interest seems very high,
as I discuss later.
The TALF and PPIP programs took too long to get up andrunning. Hopefully, at the bottom of the next leverage cycle, or
even earlier, similar programs could be implemented sooner.
I recommend that the Fed keep a standing, permanent lending
facility up and running. In normal times, it would lend a little
bit across a wide range of assets, to be ready to spring into
action if private collateral rates became too high. This facility
could be administered directly by the Fed, by people it hired, or
it could be run through the repo desks of the Wall Street banks.
In the latter case, it would be wise to insist that the banks put
some of their capital at risk along with the Fed money. The
advantage of using repo desks is that they are already staffed
with trained personnel, who have great expertise in makingmargin calls. Duplicating that expertise would be expensive.56
The advantage of a permanent facility is that the Fed would be
ready to quickly lend on a grand scale, on many securities, and
to many lenders, in the next crisis.
55 Another reason why it actually could raise new security prices is that by
leveraging the legacy securities at 2 to 1, it will free some investor equity to put
into the new securities.56 I presented this proposal for a lending facility to the Liquidity Working
Group at the Federal Reserve Bank of New York in early 2009.
8/9/2019 FRBNY Policy Review
http://slidepdf.com/reader/full/frbny-policy-review 26/31
126 Solving the Present Crisis and Managing the Leverage Cycle
5.3 Step Three—Restoring “Optimistic”Capital
Lending will not by itself bring the prices of assets to their old
levels (which is okay, given that “old” values were inflated by
excessive leverage, as I have explained). But that means that the
most optimistic buyers, unfortunately including some of the
biggest and most prominent financial institutions in America,
have irretrievably lost a huge amount of capital. Not only is
their capital no longer available to spend on these securities,
but similarly the money they borrowed to spend on these
securities has also disappeared.
The most obvious thing the government could do, it did:
inject money into financial firms. The idea was that then the
firms would continue to function as optimistic buyers and their
workers would not join the ranks of the unemployed. But the
main problem with the way the government injected capital is
that this injection of capital was not coordinated with vigorous
programs to address the two other prongs of the end of any leverage cycle: the source of the scary bad news (here, housing)
and the precipitous drop in leverage, which I have just
addressed in my discussion of Fed lending.
In the absence of vigorous programs to address the first two
prongs of any leverage crisis, injecting capital does nothing but
push an ultimate reckoning down the road. Without steps one
and two, the true financial status of our financial institutions
is unknown and unknowable because there is no reliable way
to price many of the assets they hold. The danger is that the
injection of new capital keeps the banks from failing immedi-
ately, but it is not enough to restore their previous activities,
leaving them in a kind of limbo and actually creating moreuncertainty in the system about whether they will survive. As
long as no one knows whether and to what extent our biggest
financial institutions are sound, our economy cannot recover.
Bailouts with Punishment
After a double leverage cycle as outsized as we have just been
through, it is likely that even with a lending facility established,
and capital injected properly into the system, some, maybe
many, firms would still fail. In general, that is what we should
want. The government cannot afford to make goodeverybody’s debt. Some debtholders must lose when a financial
system is allowed to become bloated by artificially high prices
maintained by excess leverage from the ebullient stage of the
leverage cycle. In the ebullient phase of this cycle, too many
people were drawn into the financial sector by the resultant
artificial profits. Failures will remove many of these excesses.
But what if those institutions are seen by the government as,
in current jargon, systemically important? For those firms, the
Treasury might want to intervene, as the Fed did last year, on a
case-by-case basis. But, if that approach is used, important
issues are the degree to which the shareholders have to give up
their shares and the bondholders lose their value, and whether
new management should be put in place. Even in cases where
old management is not that old, that is, cannot be reasonably
charged with responsibility for all the excess, replacing
management may be wise, if only to help bolster public supportfor the government’s actions and expenditures of taxpayer
funds. It is also imperative that the government decide as
quickly as possible after a crisis presents itself (and on grounds
that can be explained as fair and objective), who it will let fail,
and then coordinate an orderly liquidation. Quite possibly the
biggest public relations risk the government runs in the bottom
of the leverage cycle is to appear to be bailing out ailing firms
on too generous terms.
If instead of injecting funds into an ailing firm the
government takes it over, it must quickly decide what it will do
with the creditors. Once it guarantees their debts, there is no
turning back when the full extent of the firm’s asset value
becomes clarified. In the case of AIG, it now appears that the
government will lose much less money than was initially feared.
But in the case of Fannie Mae and Freddie Mac, where the
stakes are orders of magnitude bigger, we still do not know
what the government losses will be. It is conceivable they may
approach $1 trillion, though that does not seem likely at the
moment. This is another reason why steps one and two are
urgently needed at the very outset of the crisis to clarify prices.
Government Purchases of Assets
The government could replace the lost optimistic capital by
buying distressed securities directly. In effect, the Treasury
would take conservative and pessimistic taxpayers’ money that
would never be invested in these securities, and invest it there,
assuming, of course, that it did so with the expertise necessary
to make reasonably sound judgments on which securities to
buy and how much to pay for them. This was the plan that
Secretary Paulson originally proposed.
Government buying plans are a risky approach—riskier
than the steps I have laid out above—and thus, if ever used,
must be implemented with extreme care. An argument that isoften blithely made for government buying is that when
security prices are terribly depressed in “fire sales,” the
government might make some good investments. It is likely,
the argument goes, that the general taxpayer is too
conservative, and by transforming pessimistic capital into
optimistic capital, the government might even be directly
helping the taxpayer, while at the same time staunching the
collapse of security prices.
8/9/2019 FRBNY Policy Review
http://slidepdf.com/reader/full/frbny-policy-review 27/31

8/9/2019 FRBNY Policy Review
http://slidepdf.com/reader/full/frbny-policy-review 28/31
128 Solving the Present Crisis and Managing the Leverage Cycle
One observation, which appeared in Geanakoplos and
Kubler (2005), is that general systemwide interventions, like
restoring sane leverage, in the crisis do not always create
deleterious incentives in the long run. Surviving a crisis means
tremendous profit opportunities in the good phase of the next
cycle. If a systemic intervention gives prudent firms a chance to
survive, rather than everyone going under, those firms will
have an increased incentive to be prudent. Bailouts that rescuefirms, no matter how imprudent they have been (in fact,
precisely because they in particular were imprudent), are the
source of moral hazard.
Some have suggested that writing down principal on
mortgage loans will also cause moral hazard. They say it will
encourage homeowners to behave badly, and the government
to intervene in too many markets, and threaten the sanctity of
contracts. I disagree, because the writing down of principal
could be done as a function of the decline in some index of
housing prices. The index is beyond the control of the
homeowner, so it does not distort homeowner incentives.
Moreover, it could be done first for homeowners who have not
defaulted yet, and only later for homeowners who have
defaulted under some special hardship. It could only be done,
as I have said, if it promises to bring more money to the lenders.
A good test of whether it is a good idea is whether it would be
written into the contract in the first place if people had thought
of the possibility of this much home price decline. I agree with
Shiller (2008), who suggests that just these kinds of mortgages,
with principal automatically reduced if some housing index
falls enough, could and will likely become the standard
mortgages of the future.
7. Managing the Ebullient Stageof the Leverage Cycle
After this crisis passes, we must prepare for the next leverage
cycle. The first step is to constantly monitor leverage at the
securities level, at the investor level, and at the CDS level.
Every newspaper prints the interest rates every day, but
none of them mentions what margins are. The Federal Reserve
needs to settle on a menu of different security classes, monitor
their haircuts daily by talking to all the big lenders andborrowers, and then make averages public on a regular
schedule, say every month or quarter.
The leverage of money managers could also be public.
Moreover, legislation and regulations could contain strong and
clear prohibitions against misleading the public or regulators
on the degree of leverage.
I discussed at great length in Sections 3 and 4 how CDS
contracts provide an opportunity to leverage, so these must
be monitored as well. Putting them on an exchange would
facilitate monitoring, as well as netting and ensuring enough
collateral is posted. All too often CDS insurance buyers allowed
the writers of insurance to get away without actually putting up
the collateral. Repo lending too must be reorganized so that
borrowers are protected in case the lenders go bankrupt andswallow up the borrower’s collateral.
Transparency about actual leverage could bring a great deal
of discipline to the market, and warn investors of impending
trouble. In my earlier leverage charts, one can see the
tremendous spikes in margins during the crisis stages of the last
two cycles. One can also see a drift down in haircuts in the
ebullient stage of the last cycle.
But transparency alone is not enough. Some investors will
not curtail their leverage, no matter how much scrutiny by the
public, and how far out of line with recent practice they
become. Put bluntly, the market alone will not take care of
outsized leverage. It is thus imperative that the Fed put outside
limits on leverage. It will still be necessary to regulate leverage.
The lesson of the leverage cycle is that there are many
externalities (eight that I listed), and we should always expect
cycles of too much leverage followed by too little leverage.
The most direct way to regulate leverage might be by
empowering a “leverage supervisor” who could simply forbid
loans at too high leverage in ebullient times, setting different
leverage limits for different security classes. Banks would
simply not be allowed to lend 97 percent of the value of the
house, and repo lenders would not be allowed to reduce
haircuts too far.Many people have argued that setting margin limits is
difficult because securities are so heterogeneous. But I believe
this problem will eventually be solved once the haircut data
history becomes more public. It was not obvious how to
manage interest rates either. But little by little, the Fed has
gotten better at it. The same will be true with leverage. The
combination of security leverage data, investor leverage data,
CDS leverage data, and asset price data could give the Fed
tremendous information for managing future leverage cycles
that it did not have, or chose to ignore, in this and in past
leverage cycles. The critical thing is that with the data in hand,
the Fed will be able to monitor dramatic changes in leverageand asset prices, and therefore will easily recognize when we are
reaching either end of the cycle.
Another way of controlling leverage is to tax firms that
borrow excessively, or that borrow excessively on their
collateral, or that lend excessively on collateral. (The tax rate
again would have to differ depending on the kind of

8/9/2019 FRBNY Policy Review
http://slidepdf.com/reader/full/frbny-policy-review 29/31
FRBNY Economic Policy Review / August 2010 129
borrowing.) A very small tax might go a long way to discourage
excessive leverage, and might also change the maturity
structure, inducing longer term loans, if it were designed
properly. Another advantage of the leverage tax is that revenues
from it could be used to finance the lending facility the Fed
would need to keep at the ready in anticipation of the downside
of future leverage cycles.
Yet another way of controlling leverage is by mandating thatlenders can only tighten their security margins very slowly.
Knowing they cannot immediately adapt if conditions get more
dangerous, lenders will be led to keep tighter margins in good,
safe times.
Leverage constraints have been proposed at the investor
level for selected financial firms. Congress is considering a hard
cap on bank leverage of 15. There are six potential advantages,
however, to limiting leverage at the securities level instead of at
the investor level. The first is that many people can leverage;
limiting leverage at banks or at a few other financial institutions
might just induce leveraged purchases to move somewhere
else. Second, the leverage of an investor is often a meaningless
number, at least as an indicator of credit tightness, since just
when things are getting bad, and margins on securities are
tightening and the whole economy is being forced to
deleverage, many firms will appear to be more leveraged
because their equity will be disappearing. (It has become
fashionable nowadays to say that leverage regulation should be
countercyclical, by which people mean that investor leverage
should be allowed to go up in bad times and down in good
times. Enforcing a hard cap on investor leverage would
paradoxically exacerbate the leverage cycle by forcing firms to
sell at the bottom of the cycle, even if they had long-term loansthat did not require rolling over.) Third, different securities
include different amounts of “embedded leverage.” Thus, it
makes sense to mandate different leverage numbers for
different securities. Setting an absolute leverage limit like 15,
independent of the portfolio mix, might induce banks to shift
their investments into securities with higher embedded
leverage. Fourth, a focus on securities leverage would lead to
derivatives such as CDS becoming part of the leverage
numbers. As we saw, writing CDS insurance is like owning the
underlying bond, so taking the ratio of the collateral required
on the CDS to the cash price of the bond gives a good measureof the CDS leverage. Fifth, it is harder to hide securities leverage
than investor leverage; for one thing, there is a counterparty to
each security transaction reporting the same number that can
be used by regulators as a check on reported numbers. Finally,
a leverage supervisor managing securities leverage numbers
might be less vulnerable to political pressure because his
mandate would be more technical.
8. Conclusion
The leverage cycle brought us to the edge of a cliff. We have
moved back from the precipice, but unless we understand the
features of the leverage cycle and design our responses to
address the specific problems that characterize the end stage
of an outsized leverage cycle, we are left hoping for a miracle
to restore our financial prosperity. Marking time and waiting
for the miracle of things getting better appear to be part of the
current government policy, at least as it relates to housing and
foreclosures. That miracle, if it comes, will be nothing more
than the start of another cycle, maybe one even worse than
the one we have just experienced. My recommendations forsolving the present crisis and managing the leverage cycle
in its ebullient stage might prevent such an outcome.

8/9/2019 FRBNY Policy Review
http://slidepdf.com/reader/full/frbny-policy-review 30/31
References
130 Solving the Present Crisis and Managing the Leverage Cycle
Adrian, T., and H. Shin. Forthcoming. “Liquidity and Leverage.”
Journal of Financial Intermediation.
Aragon, D., A. Caplin, S. Chopra, J. V. Leahy, Y. LeCun, M. Scoffier, and
J. Tracy . 2010. “Reassessing FHA Risk.” NBER Working Paper
no. 15802, March.
Backman, A., and G. O’Connor . 1995. “Rating Cash Flow Transactions
Backed by Corporate Debt: 1995 Update.” Moody’s.
Bernanke, B., M. Gertler, and S. Gilchrist . 1996. “The Financial
Accelerator and the Flight to Quality.” Review of Economics and
Statistics 78, no. 1 (February): 1-15.
———. 1999. “The Financial Accelerator in a Quantitative Business
Cycle Framework.” In J. B. Taylor and M. Woodford, eds.,
Handbook of Macroeconomics, vol. 1C, 1341-93. Elsevier.
Brunnermeier, M. K., and L. H. Pedersen. 2009. “Market Liquidity and
Funding Liquidity.” Review of Financial Studies 22, no. 6
(June): 2201-38.
Caballero, R. 2010. “The ‘Other’ Imbalance and the Financial Crisis.”
VOX , January 14.
Caballero, R., E. Farhi, and P.-O. Gourinchas. 2008. “An Equilibrium
Model of ‘Global Imbalances’ and Low Interest Rates.” AmericanEconomic Review 98, no. 1 (March): 358-93.
Caplin, A., S. Chan, C. Freeman, and J. Tracy . 1997. Housing
Partnerships: A New Approach to a Market at a
Crossroads. Cambridge, Mass.: MIT Press.
Caplin, A., C. Freeman, and J. Tracy . 1997. “Collateral Damage:
Refinancing Constraints and Regional Recessions.” Journal
of Money, Credit, and Banking 29, no. 4, part 1 (November):
496-516.
Dana, D. Forthcoming. “The Foreclosure Crisis and the Anti-Fragmentation Principle in State Property Law.” University of
Chicago Law Review.
Farhi, E., and J. Tirole. 2009. “Collective Moral Hazard, Maturity
Mismatch, and Systemic Bailouts.” NBER Working Paper
no. 15138, July.
Ferreira, F., J. Gyourko, and J. Tracy . Forthcoming. “Housing Busts
and Household Mobility.” Journal of Urban Economics.
Foote, C. L., K. S. Gerardi, L. Goette, and P. S. Willen. 2009. “Reducing
Foreclosures.” Federal Reserve Bank of Boston Public Policy
Discussion Papers, no. 09-02.
Fostel, A., and J. Geanakoplos. 2008. “Leverage Cycles and the Anxious
Economy.” American Economic Review 98, no. 4 (September):
1211-44.
Geanakoplos, J . 1997. “Promises, Promises.” In W. B. Arthur,
S. Durlauf, and D. Lane, eds., The Economy as an Evolving
Complex System, vol. 2, 285-320. Reading, Mass.: Addison-
Wesley.
———. 2003. “Liquidity, Default, and Crashes: Endogenous
Contracts in General Equilibrium.” In M. Dewatripont, L. P.
Hansen, and S. J. Turnovsky, eds., Advances in Economics and
Econometrics: Theory and Applications, vol. 2, 170-205.
Econometric Society Monographs: Eighth World Congress.
Cambridge University Press.
———. 2008. “Solving the Present Crisis and Managing the Leverage
Cycle.” Remarks delivered at the Board of Governors of the Federal
Reserve System, Washington, D.C., October 3.
———. 2010. “The Leverage Cycle.” In D. Acemoglu, K. Rogoff, and
M. Woodford, eds., NBER Macroeconomics Annual 2009,
vol. 24, 1-65. Chicago: University of Chicago Press.
Geanakoplos, J., and S. Koniak. 2008. “Mortgage Justice Is Blind.”
Editorial. New York Times, October 30.
———. 2009. “Principal Matters.” Editorial. New York Times,
March 5.
Geanakoplos, J., and F. Kubler . 2005. “Leverage, Incomplete Markets,
and Pareto Improving Regulation.” Unpublished paper.
Geanakoplos, J., and H. Polemarchakis. 1986. “Existence, Regularity,
and Constrained Suboptimality of Competitive Allocations when
the Asset Market Is Incomplete.” In W. P. Heller, R. M. Starr, and
D. A. Starrett, eds., Social Choice and Public Decision
Making: Essays in Honor of Kenneth J. Arrow, 65-96.
Cambridge University Press.
8/9/2019 FRBNY Policy Review
http://slidepdf.com/reader/full/frbny-policy-review 31/31
References (Continued)
Geanakoplos, J., and W. Zame. 2009. “Collateralized Security
Markets.” Unpublished paper.
Gromb, D., and D. Vayanos. 2002. “Equilibrium and Welfare in
Markets with Financially Constrained Arbitrageurs.” Journal
of Financial Economics 66, nos. 2-3 (November-December):
361-407.
Gyourko, J., and A. Saiz . 2004. “Reinvestment in the Housing Stock:
The Role of Construction Costs and the Supply Side.” Journal
of Urban Economics 55, no. 2 (March): 238-56.
Haughwout, A., E. Okah, and J. Tracy . 2009. “Second Chances:
Subprime Mortgage Modification and Re-Default.” Federal
Reserve Bank of New York Staff Reports, no. 417, December.
Haughwout, A., R. Peach, and J. Tracy . 2008. “Juvenile Delinquent
Mortgages: Bad Credit or Bad Economy?” Journal of Urban
Economics 64, no. 2 (September): 246-57.
Holmstrom, B., and J. Tirole. 1997. “Financial Intermediation,
Loanable Funds, and the Real Sector.” Quarterly Journal
of Economics 112, no. 3 (August): 663-91.
Kiyotaki, N., and J. Moore. 1997. “Credit Cycles.” Journal of
Political Economy 105, no. 2 (April): 211-48.
Minsky, H. P . 1986. Stabilizing an Unstable Economy.
New Haven, Conn.: Yale University Press.
Myers, S. C . 1977. “Determinants of Corporate Borrowing.” Journal
of Financial Economics 5, no. 2 (November): 147-75.
Peristiani, S., P. Bennett, G. Monsen, R. Peach, and J. Raiff . 1997.
“Effects of Household Creditworthiness on Mortgage
Refinancing.” Journal of Fixed Income 7, no. 3
(December): 7-21.
Shiller, R. 2008. The Subprime Solution: How Today’s Global
Financial Crisis Happened and What to Do About It.
Princeton, N.J.: Princeton University Press.
Tobin, J., and S. S. Golub. 1998. Money, Credit, and Capital.
New York: McGraw-Hill/Irwin.
The views expressed are those of the author and do not necessarily reflect the position of the Federal Reserve Bank of New York
or the Federal Reserve System. The Federal Reserve Bank of New York provides no warranty, express or implied, as to the
accuracy timeliness completeness merchantability or fitness for any particular purpose of any information contained in