franklintempletoninvestmentfunds franklinincomefund-a(mdis)usd€¦ ·...
TRANSCRIPT

Franklin Templeton Investment Funds
Franklin Income Fund - A (Mdis) USD
Franklin Templeton Multi-Asset Solutions
Data as of 31 March 2018
For professional investor use only. Not for distribution to retail investors.

Franklin Income Fund
2
For professional investor use only. Not for distribution to retail investors.
Table of Contents
Investment Capabilities Overview............................................................................................3
Who Is Franklin Templeton Investments?................................................................................4
Fund Overview....................................................................................................................... 5
Experienced Fund Management Team.................................................................................... 6
Leveraging Firm-Wide Resources...........................................................................................7
Investment Process................................................................................................................8
Investment Criteria................................................................................................................. 9
Tactical Shifts Between Equity and Fixed Income in Pursuit of Opportunities.......................... 10
Risk Management.................................................................................................................11
Investment Risk Management at Franklin Templeton.............................................................12
Summary..............................................................................................................................13
What are the Key Risks?......................................................................................................14
Historical Asset Allocation.....................................................................................................15
Historical Sector Allocation—Equity.......................................................................................16
Historical Sector Allocation—Fixed Income............................................................................17
Historical Quality Allocation—Fixed Income...........................................................................18
Sector Allocation—Equity......................................................................................................19
Quality Allocation—Fixed Income..........................................................................................20
Geographic Allocation—Total................................................................................................21
Top Ten Holdings..................................................................................................................22
Portfolio Characteristics—Total............................................................................................. 23
Discrete Performance........................................................................................................... 24
Historical Performance..........................................................................................................25
Calendar Year Returns......................................................................................................... 26
Performance Risk Statistics.................................................................................................. 27
Management Profile..............................................................................................................28
Glossary...............................................................................................................................32
Important Disclosures...........................................................................................................34

Source: Franklin Templeton Investments (FTI), as of 31 March 2018, based on latest available data. Total combined Assets Under Management (Total AUM) combines U.S. and non-U.S. AUM of the investment management subsidiaries of the parent
company, Franklin Resources, Inc. (FRI) [NYSE: BEN], a global investment management organisation operating as FTI. Only selected business entities within FTI claim compliance with the GIPS standards as described in the table of contents if
applicable. Total and platform AUM includes discretionary and non-discretionary accounts, including pooled investment vehicles, separate accounts and other vehicles. Total and platform AUM may also include advisory accounts with or without trading
authority. In addition, assets for which certain FTI advisers provide limited asset allocation advisory services, and assets that are not allocated to FTI products are not included in the AUM figures shown. Franklin Templeton Multi-Asset Solutions may
invest in various investment platforms advised by a number of investment advisory entities within FTI. Platform AUM reported for FT Multi-Asset Solutions therefore may include certain AUM separately reported under each utilised investment platform.
Total AUM also includes assets managed by certain FTI advisers that do not form part of the selected investment platforms shown. As a result, the combined platform AUMs may not equal Total AUM and may be calculated and reported separately for
regulatory or other purposes under each investment adviser. Each local asset manager may be considered as an entity affiliated with or associated to FTI by virtue of being a direct or indirect wholly-owned subsidiary of FRI, an entity or joint venture in
which FRI owns a partial interest, which may be a minority interest, or a third party asset management company to which investment advisory services have been delegated by an FTI adviser.
For professional investor use only. Not for distribution to retail investors.
3
Franklin Income Fund
Investment Capabilities Overview
FRANKLIN TEMPLETON INVESTMENTS
Total Combined Assets Under Management : US$737.5 Billion
2
Equity
5
Fixed Income
8
Multi-Asset Solutions
11
Alternatives
AUM
US$315.0 Billion US$290.0 Billion US$124.0 Billion US$16.2 Billion
CAPABILITIES
•
Value
•
Government
•
Income
•
Commodities
•
Deep Value
•
Municipals
•
Real Return
•
Infrastructure
•
Core Value
•
Corporate Credit
•
Balanced/Hybrid
•
Real Estate
•
Blend
•
Bank Loans
•
Total Return
•
Hedge Funds
•
GARP
•
Securitised
•
Target Date/Risk
•
Private Equity
•
Growth
•
Multi-Sector
•
Absolute Return
•
Convertibles
•
Currencies
•
Tactical Asset Allocation
•
Sector
•
Sukuk
•
Managed Volatility
•
Shariah
•
Smart Beta
INVESTMENT
•
Templeton Global Equity Group (1940)
•
Franklin Templeton Fixed Income Group (1970)
•
Franklin Templeton Multi-Asset Solutions (1996)
•
Franklin Real Asset Advisors (1984)
TEAMS
•
Franklin Equity Group (1947)
•
Templeton Global Macro (1986)
•
Franklin SystematiQ (2011)
•
Darby Overseas Investments (1994)
•
Franklin Mutual Series (1949)
•
Franklin LAM-Fixed Income (1993)
•
K2 Advisors (1994)
•
Franklin Templeton Emerging Markets Equity
(1987)
•
Pelagos Capital Management (2005)

Who Is Franklin Templeton Investments?
An Investment Management Organisation• Focusing on research and investment management with more than 600
investment professionals covering all major asset classes
• Serving the needs of investors worldwide with a dedicated team of investment professionals
• Providing the resources, expertise, experience and commitment to ensure outstanding service to our clients
• Offering a broad range of investment strategies and vehicles
Franklin Templeton Investments total firm assetsUS$737.5 billion as of 31 March 20182018
Bissett Investment Management joins Franklin Templeton Investments2000
Franklin Resources, Inc. (BEN), stock is added to S&P 500 Index1998
Mutual Series joins Franklin Templeton Investments1996
Templeton joins Franklin Templeton Investments1992
Franklin Resources, Inc., stock listed and begins trading on New York Stock Exchange1986
Franklin Resources, Inc., moves offices from New York to California1973
Franklin Resources, Inc., formed as a holding company going public as BEN1971
Franklin Distributors, Inc., introduces its first mutual funds1947
Fiduciary Trust Company International joinsFranklin Templeton Investments2001
0718
Franklin Income Fund
4
Investment professionals include portfolio managers, analysts and traders.
As of 31 March 2018.
For professional investor use only. Not for distribution to retail investors.
Who Is Franklin Templeton Investments?

Fund Overview
The information provided is an example of some of the types of securities that may be considered but is not intended to be a complete list. For product-specific investment guidelines, please consult each portfolio’s legal offering and/orother documents.
To maximise income while maintaining prospects for capital appreciation.
Equities
• Common• Preferred
Fixed Income
• High Yield Corporates
• Investment Grade Corporates
• Other (Municipals, MBS, Treasuries)
Convertible Securities
Equity-Linked Notes (ELNs)
Broad Opportunity Set
Seek relative value opportunities across the capital structure:
Opportunistic Across Capital Structure
Take advantage of investment opportunities where our fundamental views may differ from the market consensus
Focus on Income & Relative Value
Search for undervalued or out-of-favour securities that offer attractive income and strong long-term capital appreciation potential
Investment Goal
Investment Approach
5727
Franklin Income Fund
5
For professional investor use only. Not for distribution to retail investors.
Fund Overview

Portfolio Management Team
Data as of 31 March 2018. Effective 1 March 2017, Todd Brighton and Richard Hsu joined the portfolio management team.Investment professionals include portfolio managers, analysts and traders.CFA® and Chartered Financial Analyst® are trademarks owned by CFA Institute.
Experienced Fund Management Team
5728
Franklin Equity Group Franklin Templeton Fixed Income Group®
Investment Professionals 57 (Including 42 CFA® charter holders) 181 (Including 59 CFA® charter holders)
Average Experience 18 Years 17 Years
Average Firm Tenure 13 Years 12 Years
Edward D. Perks, CFA Matthew Quinlan Todd Brighton, CFA Richard Hsu, CFA
Title
Lead Portfolio ManagerExecutive Vice PresidentChief Investment Officer—Multi-Asset Solutions
Vice PresidentPortfolio Manager/Research Analyst
Vice President Portfolio Manager/Research Analyst
Vice President Portfolio Manager/Research Analyst
Experience 25 Years 23 Years 18 Years 22 Years
Firm Tenure 25 Years 12 Years 17 Years 21 Years
Education BA, Yale UniversityMBA, The Anderson School at UCLABA, UCLA
BS, University of California, Davis
MA, Stanford UniversityBA, Stanford University
Research Teams
Franklin Income Fund
6
For professional investor use only. Not for distribution to retail investors.
Experienced Fund Management Team

Leveraging Firm-Wide Resources
As of 31 March 2018.Franklin Equity Group professionals include portfolio managers and analysts, some of whom cover more than one sector. Franklin Templeton Fixed Income Group professionals include portfolio managers, analysts and traders.
Consumer5 Professionals
Convertible Bonds3 Professionals
Financial and Business Services6 Professionals
Health Care5 Professionals
Industrials5 Professionals
Natural Resources7 Professionals
Technology and Communications8 Professionals
Utilities2 Professionals
Bank Loans18 Professionals
Corporate Credit33 Professionals
Global Fixed Income32 Professionals
Mortgages 9 Professionals
Municipals 31 Professionals
Local Asset Management 45 Professionals
Quantitative Analysis 7 Professionals
Trading Desks57 Professionals in 12 global locations
Independent Risk Team100 Professionals
Franklin Equity Group
Franklin Templeton Fixed Income Group
Franklin Income Strategy
Portfolio Management Team
5729
Franklin Income Fund
7
For professional investor use only. Not for distribution to retail investors.
Leveraging Firm-Wide Resources

Fundamental Research Drives Portfolio Construction
Investment Process
CollaborativeIdea Generation
In-depth Fundamental Research
Portfolio Construction with a Focus
on Income
Search for Relative Value Across Capital Structure
Collaborative Idea Generation
• Proprietary equity and fixed income research in combination with team discussion and debate lead to new ideas for income and total return generation
• Process includes an evaluation of “market consensus” expectations vs. our fundamental view
In-depth Fundamental Research
• Thorough company analysis is conducted, with a focus on valuation, financial strength, market opportunity, competitive position, and management experience
Search for Relative Value Across Capital Structure
• Risk vs. reward scenarios are analysed at the security level to determine the optimal opportunity for income and capital appreciation potential within the capital structure
Portfolio Construction with a Focus on Income
• Portfolio managers leverage inputs from the research process to develop a portfolio that is diversified and carries an appropriate level of risk while seeking to maximise income consistent with the fund’s objective
5730
Franklin Income Fund
8
For professional investor use only. Not for distribution to retail investors.
Investment Process

Investment Criteria
The information provided is an example of some of the types of securities that may be considered but is not intended to be a complete list. For product-specific investment guidelines, please consult each portfolio’s legal offering and/or other documents.
Corporate Bonds • Asset and cash flow coverage of debt and fixed costs• Likelihood of underlying credit profile improvement• Upside potential from credit enhancement
Convertible Securities • Upside potential from common stock appreciation• Downside protection potential from income stream
Common Stocks• Attractive dividend yield and valuation• Earnings and dividend growth potential
Equity Linked Notes (ELNs)• Opportunity to participate in stock price appreciation • Attractiveness of underlying terms (exercise price & yield)• Potential for higher yield to offset short-term price volatility
Additional investment considerations across the capital structure:
• Attractive income potential
• Positive industry outlook
• Management strength and integrity
• Financial strength and profitability
• Solid cash flow generation
• Compelling market opportunity
• Competitive position
• Upside potential relative to market expectations (based on our differentiated view)
Companies that we favour typically share the following characteristics:
5731
Franklin Income Fund
9
For professional investor use only. Not for distribution to retail investors.
Investment Criteria

Franklin Income Fund
10
Tactical Shifts Between Equity and Fixed Income in Pursuit of Opportunities
Franklin Income Fund
As of 31 March 2018
Equity
Fixed Income
03/2009-09/2009 05/2012-10/2012 10/2015-12/2016
Global Financial Crisis Created Significant
Dislocation in High Yield Markets
· Took advantage of market volatility to invest in high
yield securities trading at significant discounts to par
value
· Focused on companies with solid cash flow metrics
and the ability to meet obligations, determined through
rigorous bottom-up analysis
Recovery in Fixed Income Markets & Greater
Opportunity in Dividend-Paying Equities
· Fixed income markets recovered; U.S. Federal
Reserve Board policy was supportive of lower interest
rates; U.S. corporate and consumer balance sheets
showed signs of fundamental strengthening
· Equity valuations were attractive relative to fixed
income, offering income and capital appreciation
potential
Volatility in Capital Markets Create Opportunity
Across Asset Classes
· Market volatility throughout the period led to pricing
dislocations in segments of the fixed income market,
creating opportunities to add to positions on weakness
and later scale back on strength
· In equities, we identified issuers in areas like IT,
financials and health care, as future growth potential for
some companies looked attractive
Portfolio holdings are subject to change without notice and may not represent current or future portfolio composition. The equity allocation includes convertible securities; the fixed income allocation does not include cash and cash equivalents.
For professional investor use only. Not for distribution to retail investors.
06/08 03/09 03/10 03/11 03/12 03/13 03/14 03/15 03/16 03/17 03/18
0%
20%
40%
60%
80%
100%

Risk Management
The exposures described above are subject to certain exceptions, and may be different based on vehicle and/or client specific guidelines. For product-specific investment guidelines, please consult each portfolio’s legal offering and/or other documents.
PORTFOLIO DIVERSIFICATION
• Typical number of issuers: over 100
• Maximum exposures at the time of purchase:
– Issuer: 5%
– Industry: 25%
– Equity-Linked Notes: 15%
– Foreign (non-U.S.) Securities: 25%
– Illiquid Securities: 10%
RISK-AWARE SECURITY SELECTION
• Buy/sell decisions based on assessments of upside potential vs. downside risk
• Ongoing monitoring to ensure risk/reward profiles remain reasonable
• Seek to take risk that is adequately compensated
• An independent investment risk team offers an alternative perspective on absolute and relative risks within the portfolio
• Discussion allows for pressure testing of conviction levels and a greater understanding of potential unintended risks
INDEPENDENT RISK EVALUATION
5733
Franklin Income Fund
11
For professional investor use only. Not for distribution to retail investors.
Risk Management

As investors and stewards of our clients’ capital, we are constantly searching for greater transparency into the drivers of investment risk in our strategies and assuring alignment with investment team convictions and client expectations.
Investment risk management at Franklin Templeton:
As of 31 March 2018.
Investment Risk Management at Franklin Templeton
• Begins with the portfolio
management team’s research
process and the assessment of
market and active risk
• Is supported by integrated risk
analytics for the portfolio
management team’s use
• Is strengthened by the independent
Investment Risk Management
Group that reports directly to
the CEO
• Serves multiple stakeholders
including investors, portfolio
managers, fund boards and
regulators
• Is powered by actionable insights
from 20+ risk consultants with an
average of 10 years experience and
75+ risk analysts located around
the globe
• Combines a mosaic of analytics,
oversight protocols and
collaborative consultation with
portfolio managers
Integrated Independent Insightful
6215
Franklin Income Fund
12
For professional investor use only. Not for distribution to retail investors.
Investment Risk Management at Franklin Templeton
Franklin Income Fund
13
Fund Identifiers
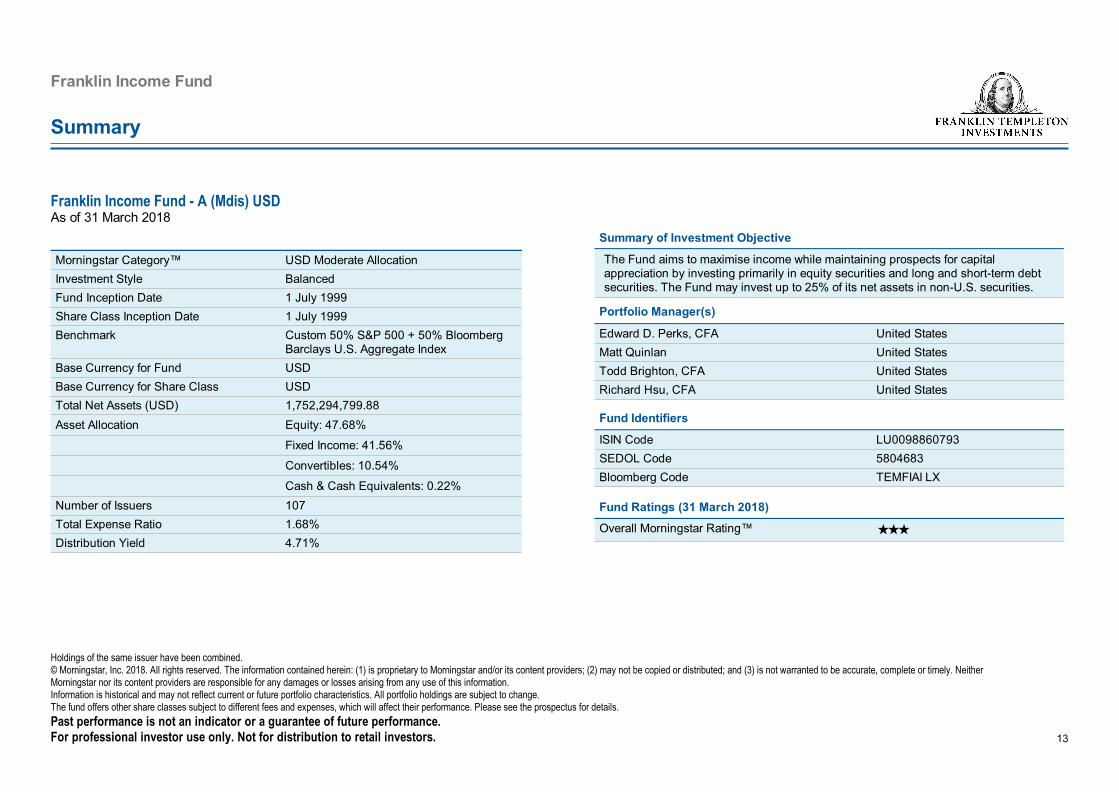
ISIN Code LU0098860793
SEDOL Code 5804683
Bloomberg Code TEMFIAI LX
Franklin Income Fund - A (Mdis) USD
As of 31 March 2018
Summary
Portfolio Manager(s)
Edward D. Perks, CFA United States
Matt Quinlan United States
Todd Brighton, CFA United States
Richard Hsu, CFA United States
Fund Ratings (31 March 2018)
Overall Morningstar Rating™
«««
Summary of Investment Objective
The Fund aims to maximise income while maintaining prospects for capital
appreciation by investing primarily in equity securities and long and short-term debt
securities. The Fund may invest up to 25% of its net assets in non-U.S. securities.
Morningstar Category™ USD Moderate Allocation
Investment Style Balanced
Fund Inception Date 1 July 1999
Share Class Inception Date 1 July 1999
Benchmark Custom 50% S&P 500 + 50% Bloomberg
Barclays U.S. Aggregate Index
Base Currency for Fund USD
Base Currency for Share Class USD
Total Net Assets (USD) 1,752,294,799.88
Asset Allocation Equity: 47.68%
Fixed Income: 41.56%
Convertibles: 10.54%
Cash & Cash Equivalents: 0.22%
Number of Issuers 107
Total Expense Ratio 1.68%
Distribution Yield 4.71%
Holdings of the same issuer have been combined.
© Morningstar, Inc. 2018. All rights reserved. The information contained herein: (1) is proprietary to Morningstar and/or its content providers; (2) may not be copied or distributed; and (3) is not warranted to be accurate, complete or timely. Neither
Morningstar nor its content providers are responsible for any damages or losses arising from any use of this information.
Information is historical and may not reflect current or future portfolio characteristics. All portfolio holdings are subject to change.
The fund offers other share classes subject to different fees and expenses, which will affect their performance. Please see the prospectus for details.
Past performance is not an indicator or a guarantee of future performance.
For professional investor use only. Not for distribution to retail investors.

Franklin Income Fund
14
The value of shares in the Fund and income received from it can go down as well as up and investors may not get back the full amount invested.
Performance may also be affected by currency fluctuations. Currency fluctuations may affect the value of overseas investments.
The Fund invests mainly in a diversified portfolio of U.S. equity, equity-related and debt securities. Such securities have historically been subject to price movements
that may occur suddenly due to equity market- and bond market-specific factors. As a result, the performance of the Fund can fluctuate over time.
The Fund may distribute income gross of expenses. Whilst this might allow more income to be distributed, it may also have the effect of reducing capital.
Other significant risks include: credit risk, currency risk, derivatives risk, liquidity risk.
For full details of all of the risks applicable to this Fund, please refer to the “Risk Considerations” section of the Fund in the current prospectus of Franklin Templeton
Investment Funds.
What are the Key Risks?
For professional investor use only. Not for distribution to retail investors.
Franklin Income Fund
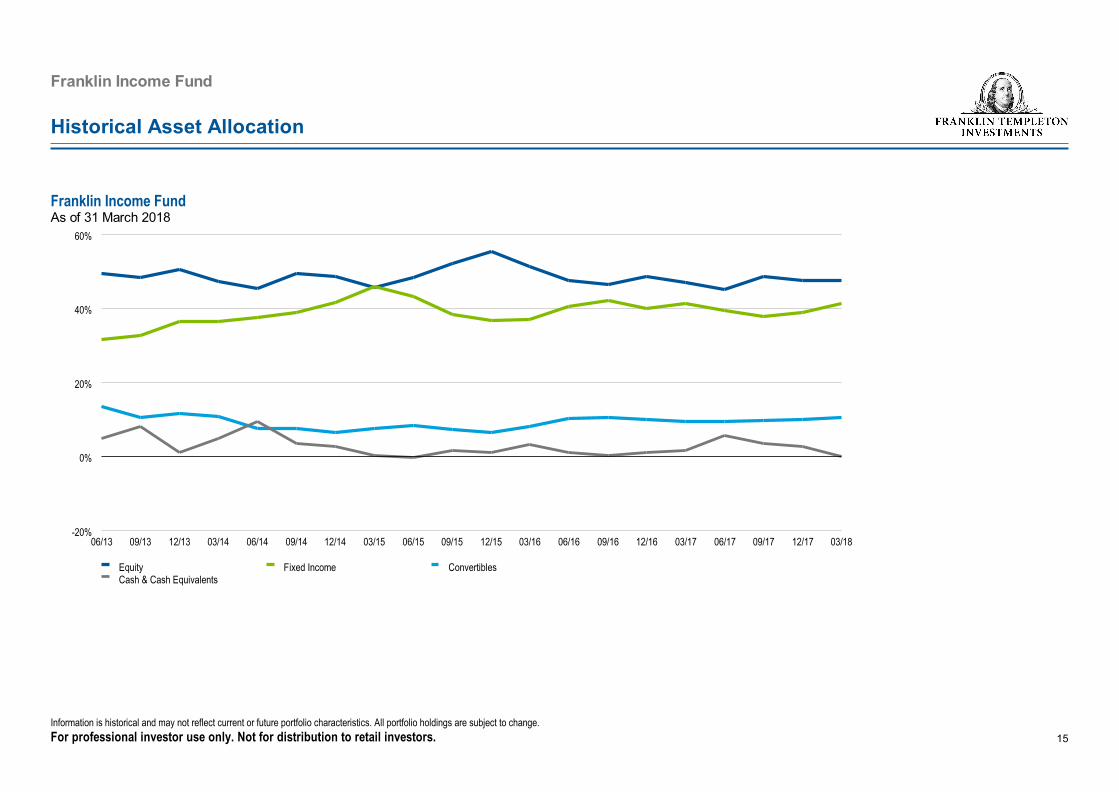
15
Historical Asset Allocation
Franklin Income Fund
As of 31 March 2018
Information is historical and may not reflect current or future portfolio characteristics. All portfolio holdings are subject to change.
For professional investor use only. Not for distribution to retail investors.
06/13 09/13 12/13 03/14 06/14 09/14 12/14 03/15 06/15 09/15 12/15 03/16 06/16 09/16 12/16 03/17 06/17 09/17 12/17 03/18
-20%
0%
20%
40%
60%
Equity Fixed Income Convertibles
Cash & Cash Equivalents
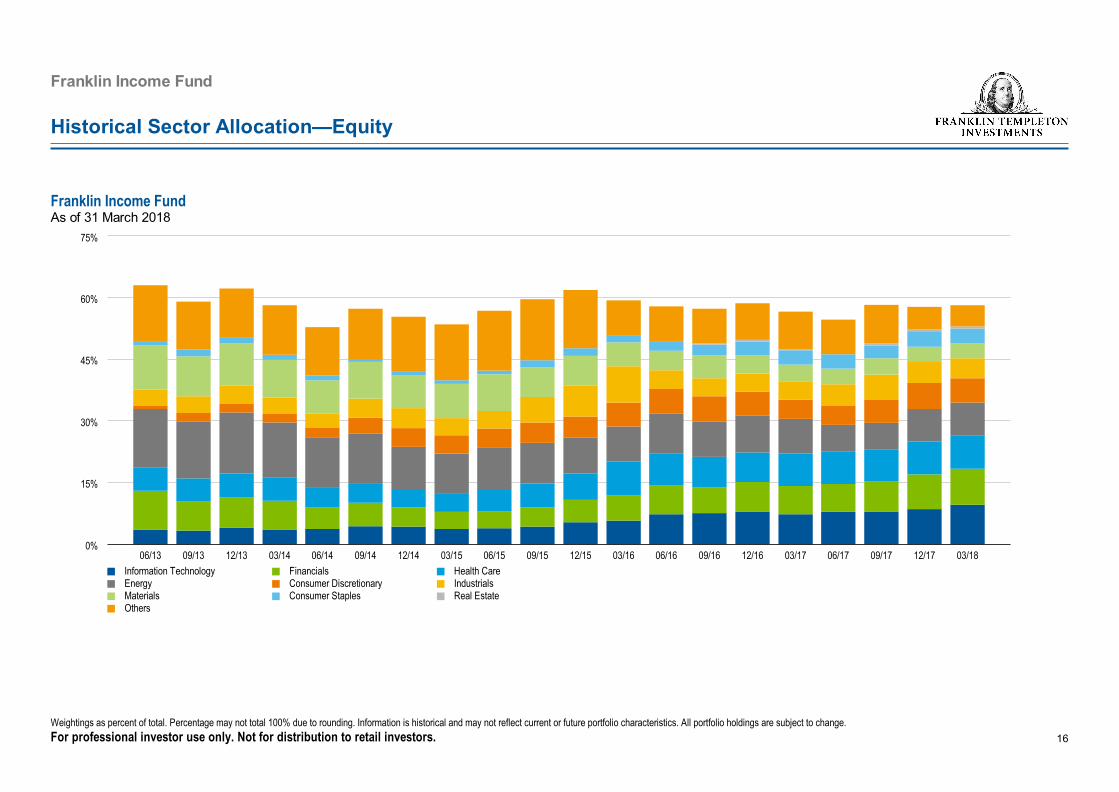
Franklin Income Fund
16
Weightings as percent of total. Percentage may not total 100% due to rounding. Information is historical and may not reflect current or future portfolio characteristics. All portfolio holdings are subject to change.
For professional investor use only. Not for distribution to retail investors.
Historical Sector Allocation—Equity
06/13 09/13 12/13 03/14 06/14 09/14 12/14 03/15 06/15 09/15 12/15 03/16 06/16 09/16 12/16 03/17 06/17 09/17 12/17 03/18
0%
15%
30%
45%
60%
75%
Information Technology Financials Health Care
Energy Consumer Discretionary Industrials
Materials Consumer Staples Real Estate
Others
Franklin Income Fund
As of 31 March 2018

Franklin Income Fund
17
06/13 09/13 12/13 03/14 06/14 09/14 12/14 03/15 06/15 09/15 12/15 03/16 06/16 09/16 12/16 03/17 09/17 12/17 03/18
0%
10%
20%
30%
40%
50%
Corporate Government/Agency Cash & Cash Equivalents
Franklin Income Fund
As of 31 March 2018
Historical Sector Allocation—Fixed Income
Weightings as percent of total. Percentage may not total 100% due to rounding. Information is historical and may not reflect current or future portfolio characteristics. All portfolio holdings are subject to change.
For professional investor use only. Not for distribution to retail investors.

Franklin Income Fund
18
Franklin Income Fund
As of 31 March 2018
06/13 09/13 12/13 03/14 06/14 09/14 12/14 03/15 06/15 09/15 12/15 03/16 06/16 09/16 12/16 03/17 06/17 09/17 12/17 03/18
0%
10%
20%
30%
40%
50%
Non-Investment Grade Investment Grade
The information only pertains to the fixed income component of the portfolio.
Weightings as percent of total. Percentage may not total 100% due to rounding. Information is historical and may not reflect current or future portfolio characteristics. All portfolio holdings are subject to change.
Ratings shown are assigned by one or more Nationally Recognized Statistical Rating Organizations ('NRSRO'), such as Standard & Poor's, Moody's and Fitch. The ratings are an indication of an issuer's creditworthiness and typically range from AAA or
Aaa (highest) to D (lowest). When ratings from all three agencies are available, the middle rating is used; when two are available, the lowest rating is used; and when only one is available, that rating is used. Foreign government bonds without a specific
rating are assigned the country rating provided by an NRSRO, if available. Cash and equivalents as well as derivatives are excluded from this breakdown. As a result, the chart does not reflect the fund's total net assets.
Investment Grade securities are those rated BBB- or higher; and non-investment grade securities are rated BB+ or lower.
For professional investor use only. Not for distribution to retail investors.
Historical Quality Allocation—Fixed Income
Franklin Income Fund
19
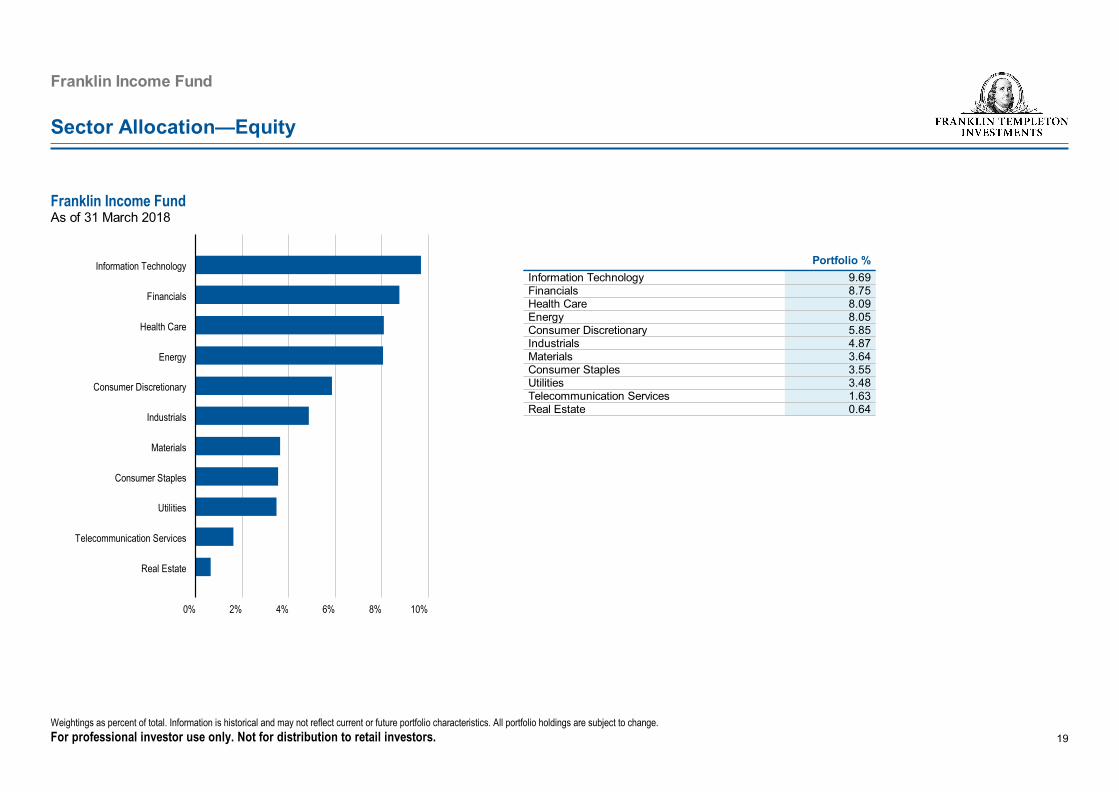
Weightings as percent of total. Information is historical and may not reflect current or future portfolio characteristics. All portfolio holdings are subject to change.
For professional investor use only. Not for distribution to retail investors.
Real Estate
Telecommunication Services
Utilities
Consumer Staples
Materials
Industrials
Consumer Discretionary
Energy
Health Care
Financials
Information Technology
0% 2% 4% 6% 8% 10%
Sector Allocation—Equity
Franklin Income Fund
As of 31 March 2018
Portfolio %
Information Technology 9.69
Financials 8.75
Health Care 8.09
Energy 8.05
Consumer Discretionary 5.85
Industrials 4.87
Materials 3.64
Consumer Staples 3.55
Utilities 3.48
Telecommunication Services 1.63
Real Estate 0.64

NR
CC
CCC-
CCC
CCC+
B-
B
B+
BB-
BB
BB+
BBB-
BBB
0% 3% 6% 9% 12%
Franklin Income Fund
20
The information only pertains to the fixed income component of the portfolio.
Weightings as percent of total. Percentage may not total 100% due to rounding.
Ratings shown are assigned by one or more Nationally Recognized Statistical Rating Organizations ('NRSRO'), such as Standard & Poor's, Moody's and Fitch. The ratings are an indication of an issuer's creditworthiness and typically range from AAA or
Aaa (highest) to D (lowest). When ratings from all three agencies are available, the middle rating is used; when two are available, the lowest rating is used; and when only one is available, that rating is used. Foreign government bonds without a specific
rating are assigned the country rating provided by an NRSRO, if available. The NR category consists of rateable securities that have not been rated by an NRSRO. Cash and equivalents as well as derivatives are excluded from this breakdown. As a
result, the chart does not reflect the fund's total net assets.
For professional investor use only. Not for distribution to retail investors.
Franklin Income Fund
As of 31 March 2018
Quality Allocation—Fixed Income
Portfolio %
BBB 0.70
BBB- 3.15
BB+ 4.25
BB 1.06
BB- 3.14
B+ 3.08
B 7.13
B- 4.63
CCC+ 8.12
CCC 2.64
CCC- 2.92
CC 0.45
NR 0.29
Investment Grade
3.86
Non-Investment Grade
37.70

21
Franklin Income Fund
Weightings as percent of total. Percentage may not equal 100% due to rounding. Information is historical and may not reflect current or future portfolio characteristics. All portfolio holdings are subject to change.
For professional investor use only. Not for distribution to retail investors.
Cash & Cash Equivalents
Australia / New Zealand
Latin America / Caribbean
Europe
North America
0% 15% 30% 45% 60% 75% 90%
Franklin Income Fund
As of 31 March 2018
Geographic Allocation—Total
Portfolio %
North America 86.45
United States 85.49
Canada 0.54
Bermuda 0.42
Europe 12.40
United Kingdom 5.14
Germany 3.19
France 1.80
Switzerland 0.92
Belgium 0.78
Netherlands 0.58
Latin America / Caribbean 0.54
Mexico 0.54
Australia / New Zealand 0.39
Australia 0.39
Cash & Cash Equivalents 0.22
Franklin Income Fund
22
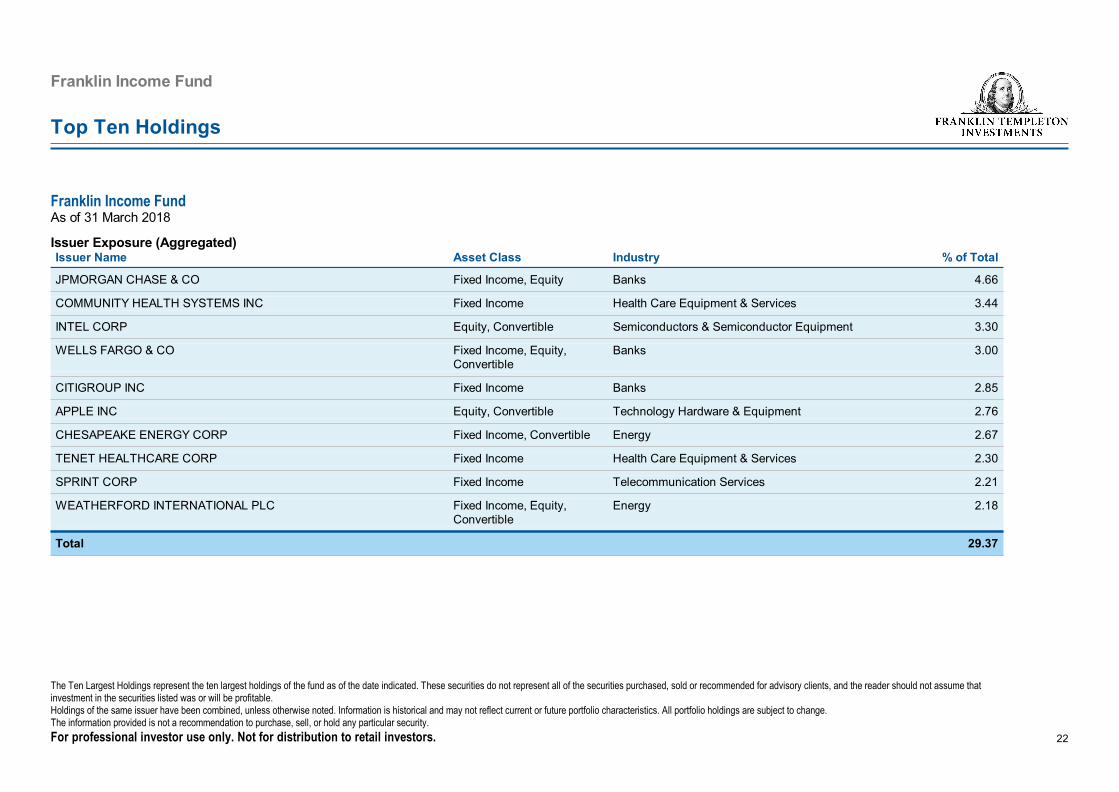
Top Ten Holdings
Franklin Income Fund
As of 31 March 2018
The Ten Largest Holdings represent the ten largest holdings of the fund as of the date indicated. These securities do not represent all of the securities purchased, sold or recommended for advisory clients, and the reader should not assume that
investment in the securities listed was or will be profitable.
Holdings of the same issuer have been combined, unless otherwise noted. Information is historical and may not reflect current or future portfolio characteristics. All portfolio holdings are subject to change.
The information provided is not a recommendation to purchase, sell, or hold any particular security.
For professional investor use only. Not for distribution to retail investors.
Issuer Exposure (Aggregated)
Issuer Name Asset Class Industry % of Total
JPMORGAN CHASE & CO Fixed Income, Equity Banks 4.66
COMMUNITY HEALTH SYSTEMS INC Fixed Income Health Care Equipment & Services 3.44
INTEL CORP Equity, Convertible Semiconductors & Semiconductor Equipment 3.30
WELLS FARGO & CO Fixed Income, Equity,
Convertible
Banks 3.00
CITIGROUP INC Fixed Income Banks 2.85
APPLE INC Equity, Convertible Technology Hardware & Equipment 2.76
CHESAPEAKE ENERGY CORP Fixed Income, Convertible Energy 2.67
TENET HEALTHCARE CORP Fixed Income Health Care Equipment & Services 2.30
SPRINT CORP Fixed Income Telecommunication Services 2.21
WEATHERFORD INTERNATIONAL PLC Fixed Income, Equity,
Convertible
Energy 2.18
Total 29.37
23
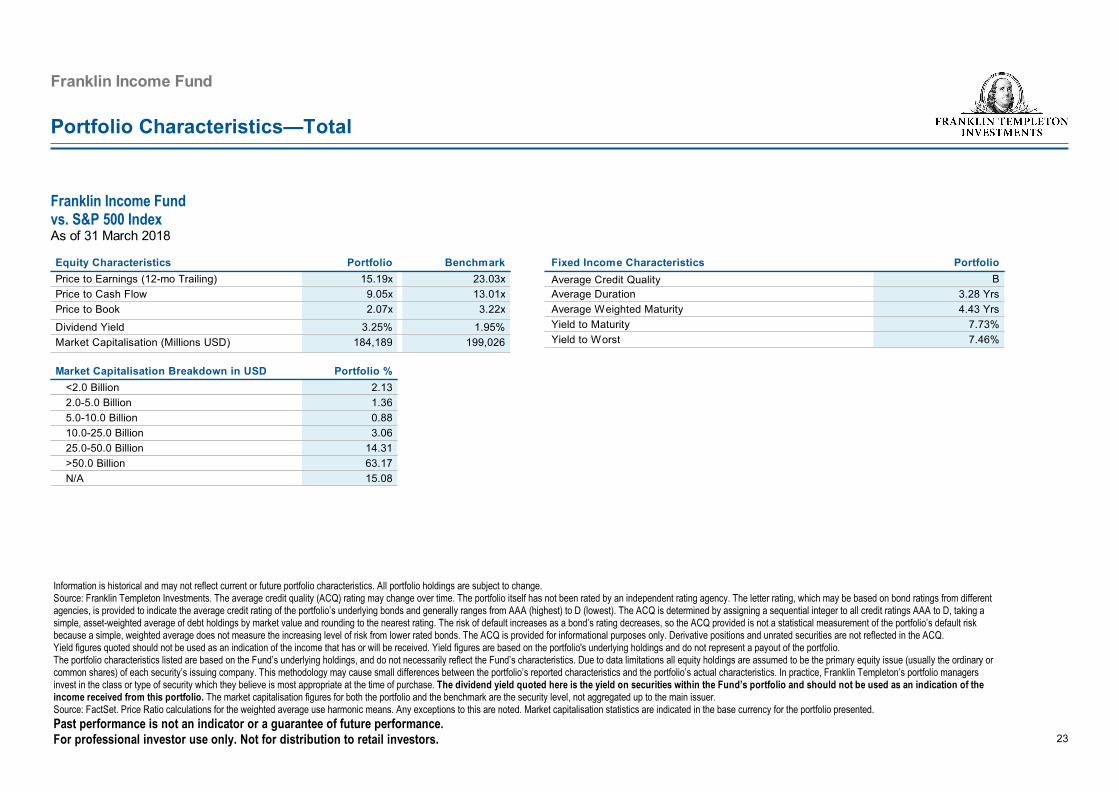
Portfolio Characteristics—Total
Franklin Income Fund
vs. S&P 500 Index
As of 31 March 2018
Franklin Income Fund
Fixed Income Characteristics Portfolio
Average Credit Quality
B
Average Duration 3.28 Yrs
Average Weighted Maturity 4.43 Yrs
Yield to Maturity 7.73%
Yield to Worst 7.46%
Equity Characteristics Portfolio Benchmark
Price to Earnings (12-mo Trailing) 15.19x 23.03x
Price to Cash Flow 9.05x 13.01x
Price to Book 2.07x 3.22x
Dividend Yield 3.25% 1.95%
Market Capitalisation (Millions USD) 184,189 199,026
Market Capitalisation Breakdown in USD Portfolio %
<2.0 Billion 2.13
2.0-5.0 Billion 1.36
5.0-10.0 Billion 0.88
10.0-25.0 Billion 3.06
25.0-50.0 Billion 14.31
>50.0 Billion 63.17
N/A 15.08
Information is historical and may not reflect current or future portfolio characteristics. All portfolio holdings are subject to change.
Source: Franklin Templeton Investments. The average credit quality (ACQ) rating may change over time. The portfolio itself has not been rated by an independent rating agency. The letter rating, which may be based on bond ratings from different
agencies, is provided to indicate the average credit rating of the portfolio’s underlying bonds and generally ranges from AAA (highest) to D (lowest). The ACQ is determined by assigning a sequential integer to all credit ratings AAA to D, taking a
simple, asset-weighted average of debt holdings by market value and rounding to the nearest rating. The risk of default increases as a bond’s rating decreases, so the ACQ provided is not a statistical measurement of the portfolio’s default risk
because a simple, weighted average does not measure the increasing level of risk from lower rated bonds. The ACQ is provided for informational purposes only. Derivative positions and unrated securities are not reflected in the ACQ.
Yield figures quoted should not be used as an indication of the income that has or will be received. Yield figures are based on the portfolio's underlying holdings and do not represent a payout of the portfolio.
The portfolio characteristics listed are based on the Fund’s underlying holdings, and do not necessarily reflect the Fund’s characteristics. Due to data limitations all equity holdings are assumed to be the primary equity issue (usually the ordinary or
common shares) of each security’s issuing company. This methodology may cause small differences between the portfolio’s reported characteristics and the portfolio’s actual characteristics. In practice, Franklin Templeton’s portfolio managers
invest in the class or type of security which they believe is most appropriate at the time of purchase. The dividend yield quoted here is the yield on securities within the Fund’s portfolio and should not be used as an indication of the
income received from this portfolio. The market capitalisation figures for both the portfolio and the benchmark are the security level, not aggregated up to the main issuer.
Source: FactSet. Price Ratio calculations for the weighted average use harmonic means. Any exceptions to this are noted. Market capitalisation statistics are indicated in the base currency for the portfolio presented.
Past performance is not an indicator or a guarantee of future performance.
For professional investor use only. Not for distribution to retail investors.
Franklin Income Fund
24
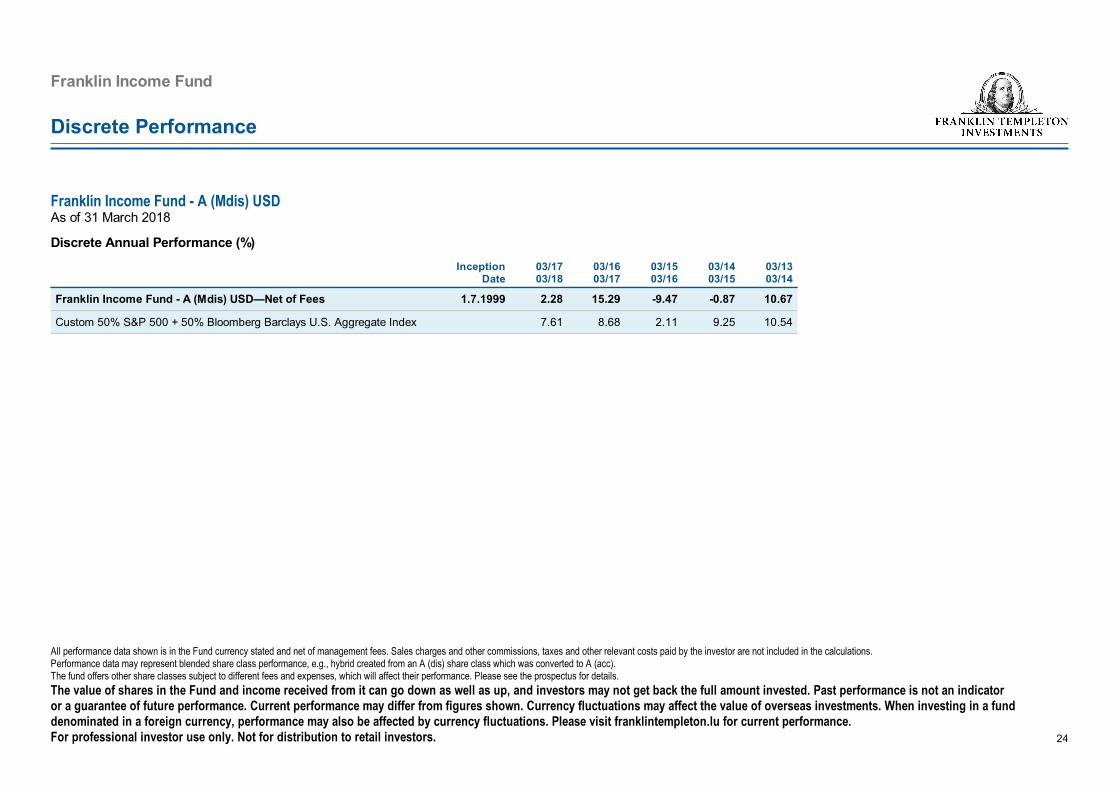
Discrete Performance
Discrete Annual Performance (%)
Inception
Date
03/17
03/18
03/16
03/17
03/15
03/16
03/14
03/15
03/13
03/14
Franklin Income Fund - A (Mdis) USD—Net of Fees 1.7.1999 2.28 15.29 -9.47 -0.87 10.67
Custom 50% S&P 500 + 50% Bloomberg Barclays U.S. Aggregate Index 7.61 8.68 2.11 9.25 10.54
All performance data shown is in the Fund currency stated and net of management fees. Sales charges and other commissions, taxes and other relevant costs paid by the investor are not included in the calculations.
Performance data may represent blended share class performance, e.g., hybrid created from an A (dis) share class which was converted to A (acc).
The fund offers other share classes subject to different fees and expenses, which will affect their performance. Please see the prospectus for details.
The value of shares in the Fund and income received from it can go down as well as up, and investors may not get back the full amount invested. Past performance is not an indicator
or a guarantee of future performance. Current performance may differ from figures shown. Currency fluctuations may affect the value of overseas investments. When investing in a fund
denominated in a foreign currency, performance may also be affected by currency fluctuations. Please visit franklintempleton.lu for current performance.
For professional investor use only. Not for distribution to retail investors.
Franklin Income Fund - A (Mdis) USD
As of 31 March 2018
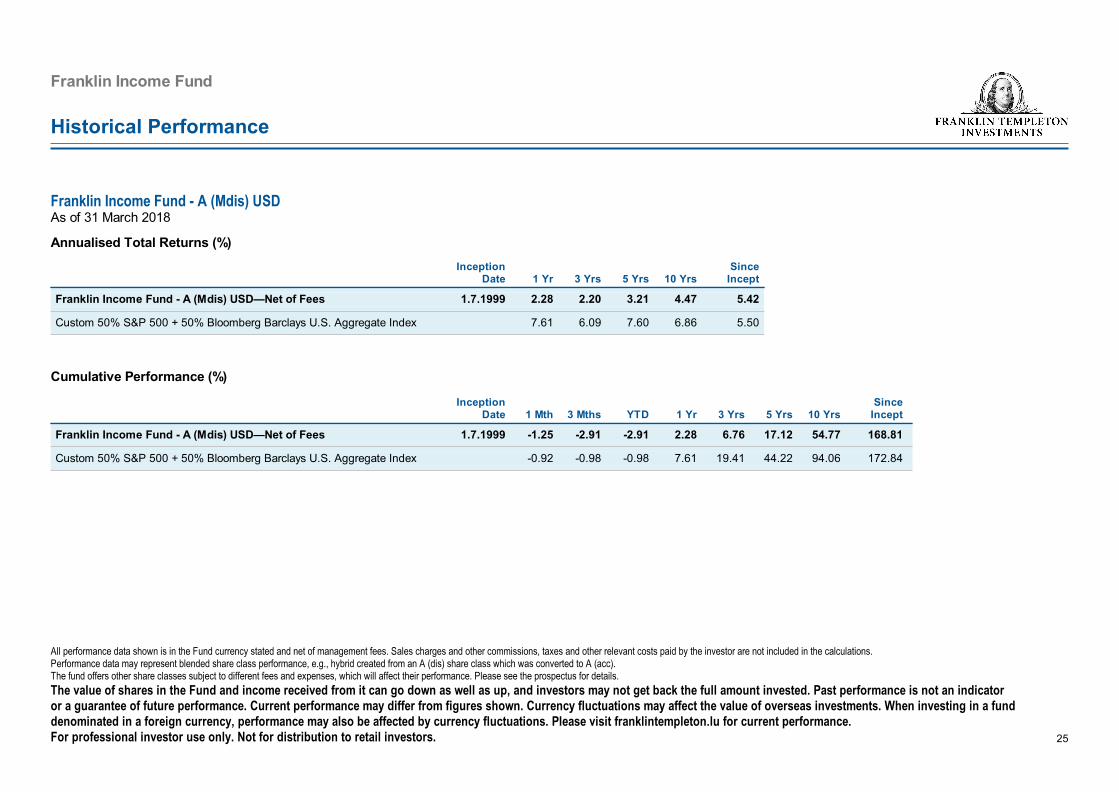
Annualised Total Returns (%)
Inception
Date 1 Yr 3 Yrs 5 Yrs 10 Yrs
Since
Incept
Franklin Income Fund - A (Mdis) USD—Net of Fees 1.7.1999 2.28 2.20 3.21 4.47 5.42
Custom 50% S&P 500 + 50% Bloomberg Barclays U.S. Aggregate Index 7.61 6.09 7.60 6.86 5.50
Franklin Income Fund
Historical Performance
Franklin Income Fund - A (Mdis) USD
As of 31 March 2018
All performance data shown is in the Fund currency stated and net of management fees. Sales charges and other commissions, taxes and other relevant costs paid by the investor are not included in the calculations.
Performance data may represent blended share class performance, e.g., hybrid created from an A (dis) share class which was converted to A (acc).
The fund offers other share classes subject to different fees and expenses, which will affect their performance. Please see the prospectus for details.
The value of shares in the Fund and income received from it can go down as well as up, and investors may not get back the full amount invested. Past performance is not an indicator
or a guarantee of future performance. Current performance may differ from figures shown. Currency fluctuations may affect the value of overseas investments. When investing in a fund
denominated in a foreign currency, performance may also be affected by currency fluctuations. Please visit franklintempleton.lu for current performance.
For professional investor use only. Not for distribution to retail investors.
25
Cumulative Performance (%)
Inception
Date 1 Mth 3 Mths YTD 1 Yr 3 Yrs 5 Yrs 10 Yrs
Since
Incept
Franklin Income Fund - A (Mdis) USD—Net of Fees 1.7.1999 -1.25 -2.91 -2.91 2.28 6.76 17.12 54.77 168.81
Custom 50% S&P 500 + 50% Bloomberg Barclays U.S. Aggregate Index -0.92 -0.98 -0.98 7.61 19.41 44.22 94.06 172.84

Franklin Income Fund
26
All performance data shown is in the Fund currency stated and net of management fees. Sales charges and other commissions, taxes and other relevant costs paid by the investor are not included in the calculations.
Performance data may represent blended share class performance, e.g., hybrid created from an A (dis) share class which was converted to A (acc).
The fund offers other share classes subject to different fees and expenses, which will affect their performance. Please see the prospectus for details.
The value of shares in the Fund and income received from it can go down as well as up, and investors may not get back the full amount invested. Past performance is not an indicator
or a guarantee of future performance. Current performance may differ from figures shown. Currency fluctuations may affect the value of overseas investments. When investing in a fund
denominated in a foreign currency, performance may also be affected by currency fluctuations. Please visit franklintempleton.lu for current performance.
For professional investor use only. Not for distribution to retail investors.
Calendar Year Returns
Franklin Income Fund - A (Mdis) USD
As of 31 March 2018
YTD 2018 2017 2016 2015 2014 2013 2012 2011 2010 2009 2008
-32%
-15%
2%
19%
36%
-2.91 -0.98
8.70
12.41
13.00
7.46
-10.23
1.31
2.27
9.84
11.39
14.12
11.36
10.13
1.78
5.28
11.72
11.29
34.42
16.34
-30.00 -17.96
Franklin Income Fund - A (Mdis) USD—Net of Fees Custom 50% S&P 500 + 50% Bloomberg Barclays U.S. Aggregate Index

Franklin Income Fund
27
The base currency of a fund determines the risk-free rate index used in calculating certain risk statistics on this page. A fund that is based in USD uses the US T-Bill Index as the risk free rate return, a EUR-based fund uses the Euro 3-Month T-Bill
Index, a GBP-based fund uses the UK Treasury Bills 3 Month Index, a JPY-based fund uses the Japan Financing Bill 3 Month Index, and an AUD-based fund uses the Australia T-Note 3 Month Index.
^^Measured against the Custom 50% S&P 500 + 50% Bloomberg Barclays US Aggregate Index.
*Annualised.
Past performance is not an indicator or a guarantee of future performance.
For professional investor use only. Not for distribution to retail investors.
As of 31 March 2018
Performance Risk Statistics
1 Yr 3 Yrs* 5 Yrs* 10 Yrs* 15 Yrs*
Standard Deviation (%):
Franklin Income Fund - A (Mdis) USD 5.13 8.01 7.64 11.90 10.56
Custom 50% S&P 500 + 50% Bloomberg Barclays US
Aggregate Index
3.90 5.13 5.02 7.74 6.88
Tracking Error (%)^^ 2.57 4.41 4.13 5.99 5.39
Information Ratio^^ -2.07 -0.88 -1.06 -0.40 -0.16
Beta^^ 1.15 1.35 1.32 1.38 1.37
Sharpe Ratio 0.23 0.21 0.38 0.35 0.49
Franklin Income Fund - A (Mdis) USD
Performance Risk Statistics

EDWARD D. PERKS, CFAExecutive Vice PresidentChief Investment Officer, Franklin Templeton Multi-Asset SolutionsFranklin Templeton InvestmentsFranklin Advisers, Inc.San Mateo, California, United States
Edward Perks is executive vice president and chief investment officer of Franklin Templeton Multi-Asset Solutions. In this role, Mr. Perks has oversight of myriad multi-asset investment capabilities designed to meet client needs for specific investment solutions. In addition, he is a member of Franklin Resources' executive committee, a small group of the company's top leaders responsible for shaping the firm's overall strategy.
Mr. Perks is lead portfolio manager of Franklin Income Fund and related portfolios, as well as Franklin Balanced Fund.
Mr. Perks joined Franklin Templeton Investments in 1992. Prior to his current role, he served as the chief investment officer of Franklin Templeton Equity, with oversight of several Franklin Templeton equity teams. He has also served as CIO-Franklin Equity Group (FEG), an evolution from his previous role as director of portfolio management. During his tenure with the firm, his experience has included equity, convertibles and high yield research across a wide range of industries. He has also held lead portfolio manager roles for the Franklin Convertible Securities Fund and Franklin Equity Income Fund. He became portfolio manager of Franklin Income Fund in 2002 and Franklin Balanced Fund in 2006.
Mr. Perks holds a B.A. in economics and political science from Yale University. He is a Chartered Financial Analyst (CFA) charterholder, a member of the CFA Institute, and the Security Analysts of San Francisco (SASF).
Franklin Income Fund
For professional investor use only. Not for distribution to retail investors.
28
Management Profile
MATT QUINLANVice PresidentPortfolio Manager, Research AnalystFranklin Equity GroupFranklin Advisers, Inc.San Mateo, California, United States
Matt Quinlan is a vice president, research analyst and portfolio manager for the Franklin Equity Group. He is the lead manager of the Franklin Equity Income Fund and the Franklin Templeton Variable Insurance Products (FTVIP) Growth and Income Fund. He is also a co-manager of the Franklin Income Fund and the Franklin Convertible Securities Fund. Mr. Quinlan is the leader of the Consumer Research Team and he has research coverage responsibilities for the retail and consumer products sectors. He also analyzes debt and equity investments for the multi-asset solutions team.
Prior to joining Franklin Templeton in 2005, Mr. Quinlan worked in investment banking at Citigroup, where he covered the retail and consumer products industries and worked with private equity firms on acquisitions and financings for their portfolio companies.
Mr. Quinlan holds a B.A. in history from UCLA and an M.B.A. from The Anderson School at UCLA.
Franklin Income Fund
Management Profile
For professional investor use only. Not for distribution to retail investors.
29

TODD BRIGHTON, CFAVice PresidentPortfolio Manager, Research AnalystFranklin Templeton Multi-Asset SolutionsFranklin Advisers, Inc.San Mateo, California, United States
Todd Brighton is a vice president, portfolio manager and research analyst for Franklin Templeton Multi-Asset Solutions. He is the lead manager of the Franklin Liberty US Low Volatility ETF. He is also a co-manager of the Franklin Income Fund, the Franklin Balanced Fund, and the Franklin Equity Income Fund. Mr. Brighton analyzes equity and equity-linked investments for the Core/Hybrid team and specializes in the development of volatility-based strategies.
Mr. Brighton joined Franklin Templeton Investments in 2000. His prior responsibilities included the trading of equities, equity derivatives, convertibles and high yield bonds.
Mr. Brighton earned his B.S. degree in Managerial Economics from the University of California, Davis. He is a Chartered Financial Analyst (CFA) charterholder and a member of the CFA Institute and the CFA Society of San Francisco.
Franklin Income Fund
Management Profile
For professional investor use only. Not for distribution to retail investors.
30

RICHARD HSU, CFAVice PresidentPortfolio Manager, Research AnalystFranklin Templeton Multi-Asset SolutionsFranklin Advisers, Inc.San Mateo, California, United States
Richard Hsu is a vice president, portfolio manager, and research analyst for Franklin Templeton Multi-Asset Solutions. He is a co-portfolio manager of the Franklin Income Fund and related portfolios, specializing in leveraged finance - corporate bank loans and high yield bonds. He is a member of the firm's Fixed Income Policy Committee (FIPC) as well as the FTMAS Investment Strategy & Research Committee.
Mr. Hsu joined the firm in 1996 and helped create the floating rate bank loan group in 1997. Previously, he was the lead portfolio manager of the Franklin Floating Rate Daily Access Fund and two related offshore funds, including the Franklin Floating Rate Fund PLC, for over 10 years.
Mr. Hsu holds both a B.A. with Honors and M.A from Stanford University. He is a Chartered Financial Analyst (CFA) charterholder, as well as a member of theCFA Institute and the CFA Society of San Francisco.
Franklin Income Fund
Management Profile
For professional investor use only. Not for distribution to retail investors.
31
Glossary
Franklin Income Fund
32
For professional investor use only. Not for distribution to retail investors.
Average Credit Quality: The credit rating of a bond is an assessment of the creditworthiness of individuals and corporations. It is based upon the history of borrowing and repayment,
as well as the availability of assets and extent of liabilities. The average credit quality of a fund reflects the holdings of the underlying issues, based on the size of each holding. Usually
we quote the average credit quality as per Standard & Poor's or Moody's credit rating agencies.
Average Duration: A measure of the sensitivity of the price (the value of principal) of a fixed-income investment to a change in interest rates. Duration is expressed as a number of
years.
Average Weighted Maturity: An estimate of the number of years to maturity, taking the possibility of early payments into account, for the underlying holdings.
Beta: A measure of the magnitude of a portfolio's past share-price fluctuations in relation to the ups and downs of the overall market (or appropriate market index). The market (or index)
is assigned a beta of 1.00, so a portfolio with a beta of 1.20 would have seen its share price rise or fall by 12% when the overall market rose or fell by 10%.
Dividend Yield: The annual dividend received on an equity security as a percentage of the price. For a portfolio, the value represents a weighted average of the stocks it holds. It should
not be used as an indication of the income received from this portfolio.
Information Ratio: In investing terminology, the ratio of expected return to risk. Usually, this statistical technique is used to measure a manager's performance against a benchmark.
This measure explicitly relates the degree by which an investment has beaten the benchmark to the consistency by which the investment has beaten the benchmark.
Market Capitalisation: A determination of a company's value, calculated by multiplying the total number of company stock shares outstanding by the price per share.
Price to Book: The price per share of a stock divided by its book value (i.e., net worth) per share. For a portfolio, the value represents a weighted average of the stocks it holds.
Price to Cash Flow: Supplements price/earnings ratio as a measure of relative value for a stock. For a portfolio, the value represents a weighted average of the stocks it holds.
Price to Earnings (12-mo Trailing): The share price of a stock, divided by its per-share earnings over the past year. For a portfolio, the value represents a weighted average of the
stocks it holds.
Sharpe Ratio: To calculate a Sharpe ratio, an asset's excess returns (its return in excess of the return generated by risk-free assets such as Treasury bills) are divided by the asset's
standard deviation.
Standard Deviation: A measure of the degree to which a fund's return varies from the average of its previous returns. The larger the standard deviation, the greater the likelihood (and
risk) that a fund's performance will fluctuate from the average return.
Tracking Error: Measure of the deviation of the return of a fund compared to the return of a benchmark over a fixed period of time. Expressed as a percentage. The more passively the
investment fund is managed, the smaller the tracking error.

Glossary (continued)
Franklin Income Fund
33
For professional investor use only. Not for distribution to retail investors.
Yield to Maturity: Yield to Maturity ('YTM') also known as the 'Gross Redemption Yield' or 'Redemption Yield'. The rate of return anticipated on a bond if it is held until the maturity date.
YTM is considered a long-term bond yield expressed as an annual rate. The calculation of YTM takes into account the current market price, par value, coupon interest rate and time to
maturity. It is also assumed that all coupons are reinvested at the same rate.
Yield to Worst: The yield to maturity if the worst possible bond repayment takes place. If market yields are higher than the coupon, the yield to worst would assume no prepayment. If
market yields are below the coupon, the yield to worst would assume prepayment. In other words, yield to worst assumes that market yields are unchanged. Normally this value is not
aggregated since it varies but if a weighted average value is used for a Fund then the figure will reflect the values of the underlying issues, based on the size of each holding.
Important Disclosures
Franklin Income Fund
For professional investor use only. Not for distribution to retail investors.
34
This document is intended to be of general interest only and does not constitute legal or tax advice nor is it an offer for shares or invitation to apply for shares of the Luxembourg-domiciled
SICAV Franklin Templeton Investment Funds (the “Fund”). Nothing in this document should be construed as investment advice. Given the rapidly changing market environment, Franklin
Templeton Investments disclaim responsibility for updating this material.
Subscriptions to shares of the Fund can only be made on the basis of the current prospectus of the Fund, accompanied by the latest available audited annual report and the latest semi-annual
report if published thereafter. An investment in the Fund entails risks which are described in the Fund's prospectus.
The value of shares in the Fund and income received from it can go down as well as up, and investors may not get back the full amount invested. Past performance is not an indicator or a
guarantee of future performance. Currency fluctuations may affect the value of overseas investments. When investing in a fund denominated in a foreign currency, your performance may also be
affected by currency fluctuations.
In emerging markets, the risks can be greater than in developed markets. Investments in derivative instruments entail specific risks that may increase the risk profile of the fund and are more
fully described in the Fund’s prospectus. If the fund invests in a specific sector or geographical area, the returns may be more volatile than a more diversified fund.
No shares of the Fund may be directly or indirectly offered or sold to residents of the United States of America. Shares of the Fund are not available for distribution in all jurisdictions and
prospective investors should confirm availability with their local Franklin Templeton Investments representative before making any plans to invest.
Opinions expressed are the author’s at publication date and they are subject to change without prior notice. Any research and analysis contained in this document has been procured by Franklin
Templeton Investments for its own purposes and is provided to you only incidentally.
A copy of the latest prospectus, the annual report and semi-annual report, if published thereafter can be found, on our website: www.franklintempletongem.com or can be obtained, free of
charge, from the address below.
Issued by Franklin Templeton Investments (ME) Limited, authorized and regulated by the Dubai Financial Services Authority.
Dubai office: Franklin Templeton Investments, The Gate, East Wing, Level 2, Dubai International Financial Centre, P.O. Box 506613, Dubai, U.A.E., Tel.: +9714-4284100 Fax:+9714-4284140.
References to indices are made for comparative purposes only and are provided to represent the investment environment existing during the time periods shown. An index is unmanaged and
one cannot invest directly in an index. The performance of the index does not include the deduction of expenses and does not represent the performance of any Franklin Templeton fund.
© 2018 Franklin Templeton Investments. All rights reserved.
CFA® and Chartered Financial Analyst® are trademarks owned by CFA Institute.

Important Disclosures (continued)
Franklin Income Fund
For professional investor use only. Not for distribution to retail investors.
35
Indexes are unmanaged, and one cannot invest directly in an index. They do not reflect any fees, expenses or sales charges.
STANDARD & POOR’S®, S&P® and S&P 500® are registered trademarks of Standard & Poor’s Financial Services LLC. Standard & Poor’s does not sponsor, endorse, sell or promote any S&P
index-based product.