france's national council for statistical information ... · cd-25-1 france's national...
TRANSCRIPT

CD-25-1
France's National Council for Statistical Information (CNIS): Origin, missions, and role in improving quality
Michel Blanc and Alain Desrosières, INSEE, France
Nearly thirty years ago, France established a Statistical Council to serve two complementary purposes: (1) to ensure that official statistics provide maximum satisfaction of the needs of a wide range of economic and social players; (2) to minimize the burden on respondents. This paper shows how the present National Council for Statistical Information (CNIS)—in its basic functions and thanks to its changes in recent years—helps guarantee the quality of official statistics. The relevance of statistics remains one of the Council's abiding concerns, but it has also introduced procedures that require all planned surveys to meet a set of quality criteria. The Council plays an important social role: in a manner of speaking, it defines standards for good practices in statistics, and contributes to the legitimacy and credibility of the official statistical system. 1. Origin of CNIS Official statistical agencies are in contact with social actors in several ways. At the data-collection stage, the contacts are with "respondents." But respondents often complain of the paperwork burden—the question forms and schedules that rain down upon them (too generously, in their view) from various government entities, of which the official statistical system is only one. At the other end of the chain, the statistical system deals with "users," who demand ever greater amounts of quantitative information.1 Thus, in a manner of speaking, the official statistical system is subjected to a "paradoxical injunction" (the psychologists' "double bind"), namely, "Don't ask us too many questions, but give us more answers." The desire to resolve this contradiction as best as possible partly explains the emergence in France, in the 1970s, of the notion that the two previously distinct methods of consulting social players should be brought together under the same roof. First, in 1951, France had set up a Committee for the Coordination of Statistical Surveys (COCOES), which sought to coordinate surveys in order to minimize the burden for respondents (actually, these efforts focused more on businesses than on households). Then, in 1964, the authorities had established a "Liaison Committee between INSEE, government economic departments, trade organizations, labor unions, and social institutions" (CLINSOPS), to gather the views of statistics-consuming organizations.
1 The countries that have reorganized their public administrations along market-model lines increasingly refer to the "customer" instead of the more generic "user." In France, some have suggested distinguishing between two terms: utilisateur to denote the "consumer of statistics" and usager in the broader sense of any private individual in contact with government agencies. In the statistical field, usager would thus include both the "respondent" and the "consumer" (utilisateur): this would provide a way of dealing with the "burden" issue. In this paper, however, we will continue to distinguish between the "upstream" and "downstream" functions (data collection vs. statistics consumption) by referring to "respondents" or "persons surveyed" as distinct from "users"—it being understood that "users" include customers who pay for statistical information or analysis.
The International Conference on Quality in Official Statistics – Stockholm, May 14-15, 2001
1/9

CD-25-1
Official statistics continued to focus on the needs of macroeconomic policy-making, and most of its attention was directed towards national accounting. Towards the late 1960s, the notion that official statistics had to meet the needs of a wider range of social players—and not only the government—became increasingly accepted. This enlargement was discussed in many forums, in particular an Economic Information Commission involved in the preparation of France's five-year development plans, and comprising many "social partners" (i.e., management and labor representatives). This collective exploration led, in 1972, to the establishment of a National Statistical Council (Conseil National de la Statistique: CNS), the direct ancestor of the present-day National Council for Statistical Information (Conseil National de l'Information Statistique: CNIS), founded in 1984. The basic purpose of CNIS was to address both issues at the same time and with the same interlocutors: the issue of information needs and the issue of the burden on respondents (particularly enterprises). Its membership and organization were partly modeled on the influential Modernization Commissions that operated under the aegis of the State planning authority (Commissariat au Plan) between the 1950s and 1980s. These Commissions were composed of technical experts from government agencies (in particular, statisticians) and representatives of the "social partners," i.e., the leading organizations of employers, employees, farmers, the self-employed, and other categories. The commissions compared and—whenever possible—harmonized the forecasts and plans of the various players, within the general framework of the national accounts. Statistical information (and thus INSEE in particular) played a central role in this "concerted planning" procedure. This institutional model for consultation and discussion has been partly preserved in CNIS, ensuring a fair degree of "representativeness" and hence a substantial legitimacy. 2. CNIS membership and missions The Council is an assembly of about 170 members (counting permanent members and their alternates). The members are nominated by their respective organizations and appointed by ministerial decision for renewable three-year terms. The CNIS membership quotas by category are as follows: employers' organizations and trade associations, 22%; labor unions, 25%; ministries and public agencies, 25%; community groups and universities, 13%; political bodies (National Assembly, regional and local elected assemblies), 10%. The Council also includes "qualified individuals" (i.e., recognized experts), 5%. CNIS ensures a dialogue between producers and users of statistics, coordinates statistical projects and surveys by official bodies, prepares a medium-term program, and, within this framework, an annual program listing all official surveys. The official statistical bodies—chiefly INSEE and ministerial statistical offices—submit their projects to the economic and social partners represented in CNIS. Such projects include surveys, censuses, directories, and processing of administrative data bases. The Council members assess each proposal on three criteria: purpose, status in the general information system, and priority level. Every stage of the operation is discussed and subject to recommendations—from the preparatory work to the dissemination of results. Innovative and sensitive topics (such as statistics on unemployment, health, and social contributions, or the statistical burden on businesses), as well as issues of statistical methodology, can be debated and clarified at CNIS without political or budgetary pressures. CNIS has an advisory role and its opinions are published. It issues a large selection of material (including reports as well as opinions) on an extremely wide range of topics, particularly on its website www.cnis.fr.
The International Conference on Quality in Official Statistics – Stockholm, May 14-15, 2001
2/9
CD-25-1
3. CNIS organization and operating procedures The Council meets at least once a year in a plenary session chaired by the Minister in charge of the economy (who is the de jure CNIS chairperson) or its Vice-Chairperson elected by the Executive Committee. The Committee comprises 15 members: five from employers' organizations, five from employees' organizations, three government representatives, and two members elected by the Council. The Committee prepares the Council's agenda, steers discussions, coordinates the CNIS units, and sets CNIS operating rules. CNIS conducts most of its work through task forces (formations) and temporary working groups (groupes de travail) to treat selected topics in greater depth. The task forces, set up by the Committee, review the annual and five-year programs in major areas. They submit their opinions on the programs to the Council at the plenary session. There are 13 task forces covering the following fields:
- agriculture - wholesale/retail trade and services - population and living conditions - education and training - employment and income - environment - manufacturing, food industries, and energy - money, finance, and balance of payments - health and welfare - regional and local statistics - production system - transportation and tourism - urban planning, infrastructure, and housing.
Most task-force chairpersons do not belong to the civil service. Meetings are open to all interested persons, with no exceptions. For this purpose, CNIS manages a network of some 3,000 correspondents. In addition to these task forces there are three committees that play a specific role in statistical surveys. The Confidentiality Committee processes requests for access—notably by researchers—to non-nominative data on enterprises. Such access may be granted under very strict conditions. The Litigation Committee issues opinions on fining for refusals to respond to compulsory surveys. The third and most recently established committee (1994) is the Quality Label Committee, to which we shall return later. It gives surveys a "public-interest and statistical-quality label," and recommends that certain surveys be made compulsory. The CNIS secretariat function is handled by INSEE. Six full-time employees organize the work of the task forces, working groups, and committees, circulate information to partners (and to all interested persons, in particular by managing the website), and prepare and implement the decisions of CNIS and its Executive Committee. 4. CNIS and quality Having described the circumstances of the Council's foundation and development, the needs it addresses, its goals, and its operating procedures, we can now examine the role that it can and does play in the field of quality. For this, we shall look both at the quality of the data or statistical results and the quality of the methods and processes. As a reference framework for assessing data quality, we take the criteria defined by Eurostat: relevance, accuracy, timeliness and punctuality, accessibility and clarity, comparability and coherence.
The International Conference on Quality in Official Statistics – Stockholm, May 14-15, 2001
3/9

CD-25-1
In fact, CNIS uses different methods to ensure the quality of statistical operations before they are carried out. We will focus on two of the main methods or procedures employed for this purpose. Section 4.1 emphasizes the relevance of official statistics—"relevance" being understood in its broad meaning of user satisfaction, which assumes that user needs and expectations are properly identified. In section 4.2, we look at the specific role of the Quality Label Committee. One preliminary comment is in order here. In this paper, our analysis is confined to the role of CNIS in the area of statistical quality, i.e., to the examination of quality issues by entities outside the official statistical system. Naturally, however, statistical agencies also have their own internal quality-related procedures. Two notable examples at INSEE are the Investments Committee—which reviews all statistical projects in the early phases of their design and definition—and a specific project-development method. 4.1. Relevance The relevance of statistical operations heads the list of Eurostat criteria: this position underlines its importance, but relevance is also the criterion that is usually the least discussed. As a rule, the only relevance test applied is an ex post evaluation—for example through user-satisfaction surveys. By contrast, little effort is made ex ante to appraise relevance and to make sure that the surveys and operations performed by the official statistical system consistently meet user needs. By "meeting needs" we do not mean satisfying the demands of an individual user, but fulfilling a social demand, which takes many forms: the demands of public policy-making and policy assessment, "civic" demand for the requirements of democratic debate, and so on. CNIS plays a crucial role in this field thanks to (1) the authority that it derives from the broad spectrum of organizations represented in the Council and (2) the broad scope for expression and proposal-making offered to the "authorities" and "social partners" that make up the CNIS membership. The issue of the uses of statistics can be discussed at CNIS, and all statistical operations are examined from their earliest design stages: CNIS members can have their say in an operation's specific definition, implementation procedures, and so on. This examination is conducted during the preparation of the annual statistical program, and therefore through the joint efforts of all the task forces. However, we would like to mention two special forms of this dialogue between producers and users—i.e., of the search for a match between expressed or potential needs and the planning of statistical operations. The first example is the round of consultations conducted during the preparation of the five-year statistical program. The second example is the specific procedure applied to all new surveys to assess their usefulness (opportunité). We will also give an example of a statistical survey initiated by the Council itself. (i) Consultation round for the medium-term statistical program: taking regional and local needs into account The current medium-term program adopted by CNIS in 1998 covers the period 1999-2003. Admittedly, such a program can be prepared within the framework of the Council's standard operating procedures—for example, by taking the evaluation report of the previous program as a starting point, or by asking the task forces or ad hoc working groups to submit proposals. But the Council has sought to broaden the opinion- and proposal-gathering process, in particular because of the ever-growing but ill-defined demand for statistics at the regional and local levels. True, local government bodies are represented in CNIS (albeit necessarily in a small proportion relative to their number), and the Council does include a task force on "regional and local statistics." But a national entity cannot take into account all the needs of local players. Also, these needs have been steadily increasing since the new decentralization laws, which have given greater powers to local decision-makers in a hitherto strongly centralized country.
The International Conference on Quality in Official Statistics – Stockholm, May 14-15, 2001
4/9
CD-25-1
In 1997-98, this issue prompted an extensive round of consultations by the Regional Committees for Economic and Social Information (CRIESs) and all of INSEE's Regional Offices (22 in metropolitan France and two in the overseas départements). (The CRIESs—the local counterparts of CNIS—operate only in some regions.) The INSEE Regional Offices (1) produce statistical information for the national program or to meet local needs, and (2) satisfy the requirements of local players by disseminating statistical results or conducting studies. The Offices carried out many interviews with these local players—including authorities, organizations, and local leaders already in contact with the official statistical system, as well as groups and institutions that had not previously voiced direct demands. The purpose was twofold: to meet CNIS demands for "upward" feedback about local needs that could serve as inputs into the national program, but also to enable the Regional Offices to "tailor" their offerings to their "customers." The outcome was a collection of ideas, proposals, and needs that were compiled in a report and taken into account in the 1999-2003 program. There were also specific demands concerning the availability, timeliness, and even the cost of accessing official statistics. Such demands are, of course, chronic, but the fact that they were expressed in such a massive and insistent manner put official statisticians under a compelling obligation to address them. (ii) Opinion on usefulness To be included in the annual statistical program, a planned survey by a public agency must undergo two reviews by CNIS and obtain two successive favorable opinions. The first is an opinion that recognizes the survey's usefulness (avis d’opportunité), the second (issued by the Quality Label Committee and discussed below) gives a more direct assessment of the survey's statistical quality.
The surveys subjected to this procedure are: new surveys, redesigned surveys, surveys with a periodicity greater than one year, and repetitive surveys that have not been examined by CNIS for at least five years. The usefulness opinion is issued by the appropriate CNIS task force. If the survey is regional, the opinion is issued by the CRIES (regional committee mentioned earlier) if such a committee exists in the region, or by a duly empowered regional institution or ad hoc group if otherwise. The opinion certifies that the survey meets a "public interest" need, that it does not duplicate other sources on the same subject, and that a survey is necessary to collect the desired information. The opinion is determined by the responses to the following questions:
• on purposes - Who requested the survey? - What needs is the survey supposed to meet? - What are the specific aims of the survey? - What kinds of information are to be gathered by the survey? - Is the information collected in another survey or administrative procedure? If so, is this redundancy justified? - Is the survey the only way or the best way to obtain the desired information? • on consultations
- How are partners being consulted on the survey design and use (steering committee, project group, etc.)? • on dissemination
- What results will be disseminated (with what restrictions, if any?), at what geographic level?
The International Conference on Quality in Official Statistics – Stockholm, May 14-15, 2001
5/9

CD-25-1
(iii) Example of survey suggested by CNIS Most statistical projects are submitted by the producer entities, in accordance with the medium-term program and in response to demands received by those entities. Under its terms of reference, CNIS works to improve the projects, set priorities, and—in the final stage—define the annual program. Occasionally, however, the Council helps initiate new information-gathering processes. This reflects the fact that the Council can, at any time, enlarge the discussion to other partners in order to achieve fuller treatment of new social issues. A few years ago, for example, CNIS set up a working group "For a better knowledge of the homeless and housing exclusion," with the participation of non-profit organizations that deal with these problems. The results of this collaborative effort—which even included a pilot survey—were presented at a conference and led to the creation of a national statistical survey of the homeless, using a methodology that was highly innovative by European standards. This survey is being conducted by INSEE in the first half of 2001. 4.2. Quality Label Committee The Quality Label Committee examines the survey projects that have received a favorable "usefulness opinion" and delivers an opinion on their "conformity" (conformité)—i.e., implicitly, their compliance with accepted statistical practices. The Committee issues a "public-interest and statistical-quality label." The Committee works in four configurations depending on whether the survey under examination concerns non-farm enterprises, households, local government, or farm holdings or farm enterprises. Each configuration comprises seven to ten members. Each organization appoints a qualified individual—preferably a CNIS member—to represent it. Significantly, the configuration adopted for statistical surveys on households includes two members appointed by the National Commission on Information Technologies and Civil Liberties (CNIL), who take special care to ensure the project's compliance with privacy-protection rules for the use of computer files. The Committee's mission is to ensure the highest standards of quality for the survey, i.e., the quality of the results provided relative to the defined goals, and the quality of the process leading to those results. Quality is therefore expressed in terms of accuracy and rigor of the results, timeliness, and coherence; it is also measured by burden reduction, attitude to respondents, preservation of confidentiality, and—more generally—the image of the statistical agency conveyed by the survey. The agency in charge of the survey must supply the Committee with comprehensive documentation—that is, including the material already examined by CNIS for the issuance of the usefulness opinion. The package must give the fullest possible details on the following points:
• purpose of survey • field of survey
- population concerned - type of unit - size of total population • sampling plan
- sampling frame - stratification variables - sampling rate - sample size - coordination (minimization of this sample's overlap with samples of other surveys)
The International Conference on Quality in Official Statistics – Stockholm, May 14-15, 2001
6/9

CD-25-1
• collection
- collection method (face-to-face interview, telephone, questionnaire sent by mail) - collection dates - reminder dates - instructions to interviewers • questionnaire
- suitability of questions to purposes - clarity of questions - sensitivity of questions - information available to respondents for their responses - questionnaire tests: . number of units . test reports . gathering of feedback from respondents . changes made as a result of tests . average and maximum response times
• letters to persons or units surveyed
- announcement letter - questionnaire cover letter - reminder letter
• dissemination
- timetable and plan for dissemination of results • survey steering committee(s)
- user committee: . role (drafting of questionnaire, etc.) . participation by representatives of surveyed parties . participation by social partners - technical supervision.
The Committee does not give "scores" to individual criteria or to the application package as a whole, but it issues the Quality Label for the survey on the basis of the entire documentation examined. However, it can issue the label with recommendations or reservations. Any reservations must be addressed to the Committee's satisfaction (usually by supplying additional documents) before the survey can be included in the program published in the Journal Officiel (the French government bulletin of record). 5. Comments and conclusion In addition to the two roles it has played since 1972—which we have discussed above—CNIS ultimately performs what we would describe as a social role. The Council is a forum where the producers of official statistics and the organizations representing social groups—in their dual capacity as users and respondents—reach agreement on what good official statistics should be. These are distinct from "numbers" circulating without a common and articulated consent that embraces (1) "statistical professionalism" criteria and (2) the public-interest and collective-usefulness purpose justifying the allocation of substantial funds. The Council's activity often consists in formulating "good practices" standards and determining whether they are being applied in the specific cases that come under discussion. In a way, therefore, the Council is an organization that produces "standards" or "quasi-law" whose approval by consensus helps ensure the social legitimacy of these costly undertakings.2
2 From this point of view, a sociological study of CNIS—which has yet to be undertaken—could notably compare this role with that of other, more recent bodies such as the Ethics Committee (Comité d’Éthique), the Higher Council for the Audiovisual Sector (Conseil Supérieur de l’Audiovisuel), and the
The International Conference on Quality in Official Statistics – Stockholm, May 14-15, 2001
7/9
CD-25-1
How has CNIS been led to play such a role? At the outset, this "labeling" function was partly a response to the chronic protests by the surveyed entities—in particular, small and medium-sized businesses. The complaints concerned the "mass of questionnaires and forms with which [they] are deluged by a variety of public and private organizations" for equally varied purposes ranging from the public interest to the compilation of increasingly valuable market data bases. In these circumstances, it was imperative that the official statistical surveys should stand out in this indiscriminate mass. They had to be clearly identifiable both for their public-interest objectives and for their professionalism, with the possibility of eliminating any redundant questions. In this case the term of "official statistics" (statistique publique) indeed reflects the dual legitimacy—intellectual and civic—of the National Statistical Institutes. One of the side-effects is that some so-called "light-weight" surveys conducted by government bodies to meet specific urgent needs may be found wanting on both these criteria. This role as producer of standards and quasi-legal enforcer of these standards gives CNIS its strength but also, implicitly, its relative weakness. In truth, the Council has difficulty acting as a totally open forum for reflection and discussion where complex and still problematic issues could be debated without interference from the participants' agendas and vested interests. This is a limitation common to many organizations (elected or not) whose representative membership guarantees their efficiency in terms of legitimacy (which is very important), but partly reduces the openness and spontaneity of their proceedings. Our examination of the French CNIS offers an example of what a Statistical Council can contribute to user satisfaction. Statistical Councils have existed in most European countries, often for many years; at the European Union level, we have the European Advisory Committee on Statistical Information in the Economic and Social Spheres (CEIES). All these institutions were set up to include users in the examination and improvement of official statistics. Of course, the Councils' actual role in ensuring the legitimacy and credibility of official statistics—and particularly in assessing the quality of the products or securing the adoption of quality standards in the processes—differs from country to country, according to the history of these institutions and the national context. Some Councils, as in France, have fairly broad terms of reference or perform a rather wide range of functions, which, elsewhere, may be assigned to other institutions or be dealt with in other consultative forums.
National Commission on Information Technologies and Civil Liberties (CNIL), all of which also produce standards. One of the specific features of CNIS is the prominent role of "social partners" (partenaires sociaux), i.e., business, labor, and community leaders. This, as we have seen, is a legacy of the State planning procedures of the 1950s-1980s.
The International Conference on Quality in Official Statistics – Stockholm, May 14-15, 2001
8/9
CD-25-1
References Cazes, B., 1965: "French Planning," in B.G. Hickman (ed.), Quantitative Planning of Economic Policy, The Brookings Institution, Washington, D.C., pp. 179-211. CNIS, 2001: Rapport d’activité du CNIS 2000, 2 vols., CNIS, nos. 65-66, Paris. Desrosières, A., 2000: "Measurement and its Uses: Harmonization and Quality in Social Statistics," International Statistical Review, 68-2, pp. 173-87. INSEE, 1996: Cinquante ans d’INSEE ou la conquête du chiffre, INSEE, Paris. Vanoli, A., 1989: "Le Conseil national de l’information statistique," Courrier des statistiques, no 52, December 1989, p. 11-18.
The International Conference on Quality in Official Statistics – Stockholm, May 14-15, 2001
9/9

CD-25-2
SOME DATA QUALITY ISSUES IN STATISTICAL PUBLICATIONS IN POLAND
Jan Kordos
Central Statistical Office/ University of Ecology and Management, Warsaw, Poland
ABSTRACT
This paper focuses on the reporting and presentation of information on sources of error in several dissemination media: short-format publications, main report from the surveys, analytic publications, and the Internet.
This review is based on the work of the author conducted for training purposes and in order to help characterise current practices for reporting sources of error in publications. The first study reviewed press releases and short publications of several pages (�short-format reports) issued by six divisions of the Central Statistical Office (CSO): (i) labour, (ii) demography (iii) living conditions, (iv) agriculture, (v) enterprise , and (vi) trade &services. The second study reviewed main reports from the sample surveys published by the same divisions. These are printed reports of methodology of the survey, descriptive analysis , and tables with main results from the survey. The third study reviewed selected �analytic publications� from the same divisions. The fourth review is connected with the Internet which has become one of the media of dissemination of statistical data from the CSO since 1997. Handbooks and articles of methodological nature devoted to some aspects of data quality, e.g. presentation and interpretation of sampling errors, coverage errors, non-response errors, measurement errors are also being considered.
Key words: data quality, sample survey, sampling error, nonsampling error, coverage error, measurement error, processing error, analytic publication, error sources.
1. Introduction
Since 1989 the Central Statistical Office of Poland (CSO) has started adjusting official statistics to international standards, and made the attempts to harmonise it with the European Union statistics. Basic nomenclature and classifications have been adopted, the programme of surveys was considerably changed, new surveys were launched, new methods were applied and the methodology adjusted to the requirements of market economy and European standards. Most of the complete statistical reporting stopped and new sample surveys started, such as labour force survey, agricultural surveys, business surveys, enterprise surveys, and several ad hoc sample surveys connected with living conditions, health care, time use, etc. Household budget survey has been adjusted to new requirements. However, the CSO has not yet developed quality guidelines, like Statistics Sweden (Lyberg, Biemer and Japec, 1998) or Statistics Canada (1998), and quality issues of these surveys are important problems to be solved. Therefore, there are different approaches to quality treatment in the different divisions of the CSO. It is possible to observe these different approaches to quality treatment in the

surveys conducted by the CSO in information on data quality included in the publications for users. It is generally accepted that users of survey data need information about a survey�s quality to assess its results properly. It is a very well known fact that there are many dimensions to survey quality and the measurement and presentation of this information is no easy task. Report formats, dissemination media, agency policy and practices vary. The Polish CSO has not much experience in this field. The previous statistical system was based mainly on complete reporting, simple questionnaires and formal instructions, simplified tables and limited descriptive analysis. In the majority of cases, it did not require modern methods of data collection, designing of sophisticated questionnaires and advanced training of the staff conducting surveys, sophisticated methods of control of in-field operations. Thus it has now become indispensable to organise an extensive training of statistical staff to upgrade their qualifications to make them able to conduct modern statistical surveys. These new skills are acquired gradually. The pressure from users on quality as expressed in users� satisfaction surveys, focuses mainly on timelines and availability, which does not encourage specific investigation in accuracy. Among public statisticians there is also a strong feeling that it is difficult to make quality understandable to non-specialists, and it is the professional responsibility of statisticians to decide on necessary quality levels (Kasprzyk et al, 1999). To help prevent misunderstanding and misuse of data, full information should be available to users about sources, definitions, and methods used in collecting and compiling statistics, as well as their limitations.
The policy of openness in providing full descriptions of data, methods, assumptions, and sources of error is one that is accepted by the CSO (Walczak, 1999) and is connected with the Polish Statistical Law1 . However, as it can be seen from the practice of different divisions, the implementation of the policy can vary in many ways. The sources of error that affect survey data quality - sampling error, coverage error, nonresponse error, measurement error and their measurement are described in a number of handbooks and articles published in Poland (e.g. Bracha,1996a, 1996b, 1998; Kordos, 1985, 1988, 1994, 1995, 1996a, 1996b, 1998; Zasępa, 1969 1972, 1979, 1993). This paper focuses on sources of error in several dissemination media (short-format publications, main reports from the surveys, analytic publications, and Internet). This review is based on the work of the author prepared for the training programme of statistical staff. Before presenting some aspects of data quality in different kinds of publications with survey results, a short presentation of sample surveys conducted by the CSO in last ten years is given.
1 USTAWA z dnia 29 czerwca 1995 r. o statystyce publicznej. Dziennik Ustaw Nr 88 z 31 lipca 1995 r., poz
. 439.(Law on Public Statistics in Poland).
2

2. Sample surveys conducted by CSO of Poland in 1991 - 2000
The experience gained in sampling surveys under the previous system was useful in transition period only in a limited scope. New problems and tasks emerged which were not known to our statistics before. Among them the following should be mentioned here (Kordos, 1996a): 1. Building confidence in statistical information system in the society, as a precise and useful
instrument for the description of the social and economic environment. 2. Maintaining consistency and confidentiality of information submitted to official statistics. 3. Satisfying the data needs of decision-makers both in the private and public sectors. 4. Planning of statistical programmes in such a way as to reduce the response burden and
facilitate establishing systems which make use of sample surveys and reduce bureaucratic procedures.
In the period of transformation new problems emerged which were unknown before. These are mainly the following:
a) use of administrative registers for statistical purposes, b) integration of data from various sources, c) development of corresponding systems for national accounts, d) development and implementation of registers of employers, e) training of experts in the use of various international standards and classifications and
adaptation of those classifications to the national conditions, f) extension of sample surveys to a broader scale, especially in the economic statistics
(designing of questionnaires, training of interviewers, etc.), g) extension of the methods compensating non-response (methods of weighting the results,
imputations, model approach, simulation, etc.). In this short report it is impossible to present methodology of sampling surveys in detail. General description starting with the name of the survey, its type, sample size and response rate will only be presented.
Before 1990, sampling methods were mainly used in household budget surveys (Kordos, 1985, Lednicki, 1982), agricultural surveys (Kordos, Kursa, 1997), demographic surveys ,and mainly to speed up tabulation of collected information in population censuses (in 1950, 1960 and 1970) and in sample censuses (microcensuses) of population (in 1974 and 1984) (Zasepa, 1993).
After 1990 the household budget survey (HBS) was adjusted to new requirements (Central Statistical Office, 1999; Kordos, 1996b) and in 1992 for the first time a new survey of labour force, i.e. labour force survey (LFS) was introduced (Szarkowski and Witkowski, 1994). Other new sample surveys of households were launched such as survey on the well-
3

being of households, health status of households and multi-aspect survey of the living conditions of the population (Kordos, 1998).
A number of modular surveys were conducted using subsamples of households participated in HBS and LFS . The following modular surveys were conducted in last ten years using HBS: social assistance (1993), nutritive needs (1993), housing conditions (1993), educational needs (1994), households in the market economy (1994), health status of population and expenditure on health service (1994), durable goods in households (1995), needs of families and their satisfying (1995), health protection (1998, 2000), tourism and recreation (1998), personal and property insurance (1998), participation in sport and active recreation (1999).
With LFS subsamples the following modular surveys were carried out: socio-economic status of the unemployed (August 1993), rural labour market ( November 1993), effectiveness of labour market policy (August 1994 and 1996), professional career of the graduates (November 1994 and 1997), the situation at the labour market and the living conditions of the disabled (February 1995), unregistered labour (August 1995 and 1998), disabled persons on labour market (1995, 2000). It should be stressed that since the fourth quarter of 1999 the LFS has been carried out as a continuous survey. The quarterly sample currently amounts to 24,440 dwellings. It was constructed in such a way that every one of 13 weekly samples is not only the same size but has also the same structure. Selection of quarterly samples is performed according to the rotation system: 2 (2) 2, i.e. two quarters in the sample, two quarters out of the sample and two quarters again in the sample. The results are processed and published quarterly. Results of the survey conducted trough this method allow presentation of situation on the labour market during the whole quarter (Central Statistical Office, 2000).
New sample surveys of the employed in the national economy started. At this point we will mention only two sample surveys of the employed:
(a) the survey of the employed by the level of wages and salaries, and (b) the survey of the level of wages and salaries by occupation.
New sample surveys started in economic statistics: labour costs survey, business tendency survey in industry, construction and trade (Barczyk, 1995), small enterprise survey, innovative survey (Niedbalska, 2000), and other enterprise surveys (qualitative and quantitative nature) (Zagozdzinska, 1996; Barcikowski et al., 1999). More important sample surveys conducted in 1991-2000 are presented in table 1. There are names of the sample surveys, year or years when surveys were carried out, their types (continuous, periodic or one-time), size of the sample, and approximate response rates in percent.
4
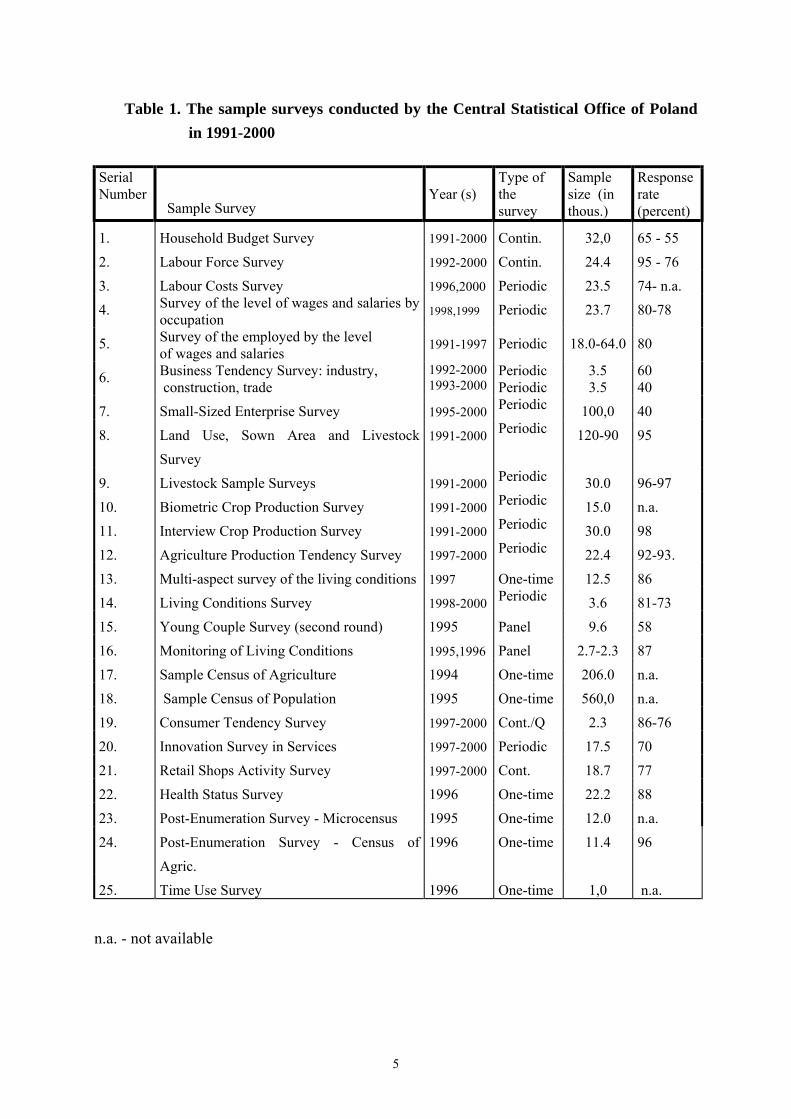
Table 1. The sample surveys conducted by the Central Statistical Office of Poland in 1991-2000
Serial Number
Sample Survey
Year (s)
Type of the survey
Sample size (in thous.)
Response rate (percent)
1. Household Budget Survey 1991-2000 Contin. 32,0 65 - 55 2. Labour Force Survey 1992-2000 Contin. 24.4 95 - 76 3. Labour Costs Survey 1996,2000 Periodic 23.5 74- n.a. 4. Survey of the level of wages and salaries by
occupation 1998,1999 Periodic 23.7 80-78
5. Survey of the employed by the level of wages and salaries
1991-1997 Periodic 18.0-64.0 80
6. Business Tendency Survey: industry, construction, trade
1992-2000 1993-2000
Periodic Periodic
3.5 3.5
60 40
7. Small-Sized Enterprise Survey 1995-2000 Periodic 100,0 40 8. Land Use, Sown Area and Livestock
Survey 1991-2000 Periodic 120-90 95
9. Livestock Sample Surveys 1991-2000 Periodic 30.0 96-97 10. Biometric Crop Production Survey 1991-2000 Periodic 15.0 n.a. 11. Interview Crop Production Survey 1991-2000 Periodic 30.0 98 12. Agriculture Production Tendency Survey 1997-2000 Periodic 22.4 92-93. 13. Multi-aspect survey of the living conditions 1997 One-time 12.5 86 14. Living Conditions Survey 1998-2000 Periodic 3.6 81-73 15. Young Couple Survey (second round) 1995 Panel 9.6 58 16. Monitoring of Living Conditions 1995,1996 Panel 2.7-2.3 87 17. Sample Census of Agriculture 1994 One-time 206.0 n.a. 18. Sample Census of Population 1995 One-time 560,0 n.a. 19. Consumer Tendency Survey 1997-2000 Cont./Q 2.3 86-76 20. Innovation Survey in Services 1997-2000 Periodic 17.5 70 21. Retail Shops Activity Survey 1997-2000 Cont. 18.7 77 22. Health Status Survey 1996 One-time 22.2 88 23. Post-Enumeration Survey - Microcensus 1995 One-time 12.0 n.a. 24. Post-Enumeration Survey - Census of
Agric. 1996 One-time 11.4 96
25. Time Use Survey 1996 One-time 1,0 n.a.
n.a. - not available
5

3. Reporting Sources of Errors in Dissemination Media
There are many formats available for release of results from CSO data collection programmes, ranging from press release and short format reports of several pages to detailed
and sophisticated analytic reports. Starting from 1997 electronic dissemination through the Internet has become a preferred format for releasing results for many surveys. It is fair to say that some information on the sources of error and other limitations of the data should be provided to users and interpreters of the data and the amount of information provided should depend on the length, type, and importance of the report.
Users of survey data need information about a survey's quality in order to assess the survey results properly. In recognition of this need, the standards adopted by many statistical agencies specify that users should be informed of survey quality. However, the measurement of survey quality and its presentation to users are not simple tasks. There are many aspects of quality to consider, and a range of statistical indicators that may be employed to measure them. Some indicators can be produced fairly readily (e.g. response rates) but others are costly (e.g. measures of response bias). In addition, users can benefit from the availability of detailed documentation of the survey procedures since procedures used are indicative of survey quality (Kasprzyk and Kalton, 1997).
In practice the amount of information produced is often limited by budget and time constraints. The situation varies depending on whether the survey is a one-time, continuous, or periodic. Continuous and periodic surveys have the advantage that research on their methods and procedures can lead to future improvements. The systematic gathering of information about survey procedures and sources of error assists this process. Over time such programme can accumulate a substantial amount of information on data quality (Kordos, 1988). As it has been stressed, reporting formats vary from a press release of several pages of analysis on a specific question, basic report from the survey to detailed complex analytic modelling exercises designed to test specific hypotheses. Although there is a considerable recognition of the need for reporting the extent and nature of the source of errors, there is a considerable uncertainty about the amount of detail that ought to be provided. Details reported ought to depend on the length of the report, its intended use, the nature of the data (one-time survey vs. continuing), the survey budget, and agency policy (Depoutot, 1999; Kasprzyk et al., 1999). The author conducted four studies to help characterise current practices of reporting sources of errors in statistical publications in Poland. The first study reviewed press release and short publications of several pages (short-format reports) from six CSO divisions. The second study reviewed basic reports of the sample surveys from the same divisions. These are printed reports resulting from a sample survey with methodology, descriptive analysis of the results, and results of the survey in tables. The third study reviewed analytic publications
6

from some divisions. Publications that compile data from many sources and reports designed primarily to study errors sources are not included in the study. The fourth study reviewed Internet with some reports from the surveys. Handbooks and articles with description of survey methodology or data quality assessment are also mentioned. 3.1. Reporting Sources of Errors in Short-Formats Reports A total of about 100 short-format reports was reviewed. None of the short reports discussed the study design, data quality, or survey error, none of them included a reference to technical reports. In some cases, a division news release focuses on a limited set of findings, with nothing more than a reference to the main publication or the division the data are drawn from. In other cases, the division news release includes more data and describes the study purpose, sample size and sampling error Close to one-third (31 percent) of authors of short reports included at least one piece of information describing the purpose of the survey or analysis, the key variables or made references to sample design. Slightly less than one-fourth of these cases included the sample size (24 percent of all reports), and one-fifth described the mode of data collection. There were no references to weighting and estimation procedures. There were not significant differences in reporting some aspects of data quality in short reports between different CSO divisions. 3.2. Reporting Sources of Errors in Basic Survey Reports In the second study, publications of basic reports from the surveys produced by 6 divisions, were reviewed. Fifty nine publications covering last five years were selected to be reviewed. These publications were published in series "Information and Statistical Materials" ("Informacje i opracowania statystyczne"). They were reviewed for their treatment of sources of sampling and nonsampling errors, data collection method, sample size, sample design and estimation procedures. About sixty percent of the reports included sampling errors (65.2 percent for social statistics, and 51.9 percent for economic statistics). Even though nonresponse error is the most visible and well known of nonsampling error and easily obtainable, only 49.2 percent included any references to response rates, to nonresponse as a potential source of error, or to imputations (75 percent for social statistics, and 18.5 percent for economic statistics). However, only 5 percent mentioned nonsampling errors. Measurement error was cited as a source of error in about 3.4 percent of the reports, but no mention of specific analyses of measurement bias or measurement variance were mentioned. Finally, none of the reports reported coverage rates or mentioned coverage as a potential source of error. Results are given in table 2.
7

Table 2.
Reporting Sources of Errors and Study Design Features
in fifty nine sample survey reports
Reporting: Surveys belonging to:
Social statistics (demography, labour and
living conditions)
Economic statistics (agriculture, enterprises,
trade & services)
TOTAL
Error sources Number Percent Number Percent Number Percen
t Total 32 100.0 27 100.0 59 100.0
Sampling 21 65.2 14 51.9 35 59.3 Nonsampling 2 6.3 1 3.7 3 5.1 Nonresponse 24 75.0 5 18.5 29 49.2 Measurement 1 3.1 1 3.7 2 3.4
Coverage - - - - Study design features
Data collection methods
32 100.0 27 100.0 59 100.0
Sample size 30 93.7 15 55.6 45 76.3 Sample design 25 78.1 18 66.7 43 72.9
Weighting Estimation
20 62.5 14 51.9 34 57.6
Source: the author�s review of the CSO publications.
We have grouped divisions into two groups: survey belonging to:
! social statistics, and ! economic statistics.
It is connected with tradition and some experience in sampling. Several publications provided excellent descriptions of the sample design, data collection methods, and estimation procedures. All reports included data collection methods, and size of sample was included in 45 reports (76.3 percent) ( 93.7 percent for social statistics, and 55.6 percent for economic statistics); 43 reports included sample design (72.9 percent) (78.1 percent for social statistics, and 66.7 percent for economic statistics), and estimation procedures were given in 34 reports (57.6 percent) (62.5 percent for social statistics, and 51.9 percent for economic statistics).
8

Descriptions of the comparability of survey results with other data sources were somewhat less commonly provided, for example, 9 reports (15.3 percent) described in detail the survey changes that affect comparisons of the survey�s data over time. 3.3. Reporting Sources of Error in Analytic Publications The study reviewed the information available on sources of error in 12 analytic publications published in series "Statistical Studies and Analysis" ("Studia i analizy statystyczne"). All publications included data collection methods, purpose of the analysis, and description of key variables. Size of sample was included in 9 publications (75 percent); sample design and estimation procedures mentioned in 3 publications (25 percent). Sampling error, the best known source of survey error and easiest to estimate, was included only in 3 publications (25 percent). Response rates are commonly used as indirect measures of nonresponse error, and are popular indicators of data quality and are expected to be routinely reported, were included in 8 publications (66.7 percent). Finally, measurement error and coverage error were not mentioned as a possible sources of nonsampling errors.
The comparison of survey data to data from independent sources was done in 9 publications (75 percent). Such comparisons can be a difficult but rewarding exercise for the data producer as well as the data user. The comparisons can result in a better understanding of the limitations of the data set for a particular form of analysis and lead to improved procedures for future rounds of the survey. 3.4. Reporting Sources of Error on the Internet The Internet has become the medium for dissemination of data products for the CSO since May 1997. However, there are no guidelines and practices for reporting error sources over the Internet. There are some written standards for web sites, but these generally focus on web site design, layout, and administrative access. We have started to study experiences in this field of a few agencies, such as the Census Bureau, which have begun the process of developing standards for providing information about data quality over the Internet (U.S. Bureau of the Census, 1997). This study reviewed the accessibility of data quality documentation on current Internet site of the CSO. There are printed reports prepared for press release and general utilisation by users. The study found current Internet standards for data quality information echo the standards for printed reports and statistical tables. More explicit standards for how the advantages of the Internet media should be employed to make data quality information more easily accessible do not exist. The Internet is a dynamic medium. It is constantly changing and being upgraded.
9

The technology and possibilities grow and change every day. We are beginners in this field, and hope to use Internet for data quality presentation efficiently.
10

4. Conclusions During the period of transformation we had to change the methodology of many surveys, to apply international standards and re-organise statistics and to anticipate future needs of the users. There is still an important problem of the way in which data should be disseminated to various users, to develop methods of their adequate use, ways of interpreting and methods of statistical analysis which could be easy to understand to a wide range of users, the ways of increasing statistical literacy of the society for the informed participation and acceptance of the processes of transformation of statistics. These problems are still waiting for a solution. The analysis is not intended to single out individual divisions. The following recommendations are offered to help divisions meet the reporting standard identified by international statistical community (e.g.: Statistics Canada (1998); Statistics Sweden (Lyberg et al., 1998; U.K. Government Statistical Service, 1997; U.S. Census Bureau. 1998). 1. As a minimum standard, the short news releases should include the title of data collection
and a mention of the fact that all report are subject to reporting errors. In addition, there should be a reference to a source report that includes more detailed information about the data collection and data quality, and a mention of the fact that sample survey data are subject to sampling errors. In addition, longer news releases and short reports of any length should include a brief description of the purpose or content of the data collection, the sample size, and the possible presence of sampling and nonsampling errors. Reports should also reference the possible sources of nonsampling errors and where appropriate draw comparisons with related data sources.
2. As it has been stressed, users of survey data need information about a survey’s quality to properly assess survey results. Standards adopted by many statistical agencies specify that users should be informed of survey quality. The studies reviewed in this paper illustrate the range of division practices in reporting information on error sources in surveys. The studies suggest CSO divisions not merely define policy and standards in the reporting of such information, but monitor the implementation of this policy. In any case, data users are best served when information about survey procedures and sources of error are readily available to them to help the interpretation of the analysis. In the case of the Polish experience, more interest and emphasis in this topic is desirable.
3. Sampling error is often the only error source presented when reporting survey estimates. With main report publications, for example, it is common practice to specify sampling error without mentioning other error sources. When sampling errors are not reported, sample size may be reported, presumably as an indicator of sampling error. Sampling error may be communicated in a number of different forms, e.g. , standard errors, coefficient of variation, and confidence intervals. In Polish statistical publications only relative standard
11
errors are presented for some estimated parameters without interpretation. For users such information is not clear.
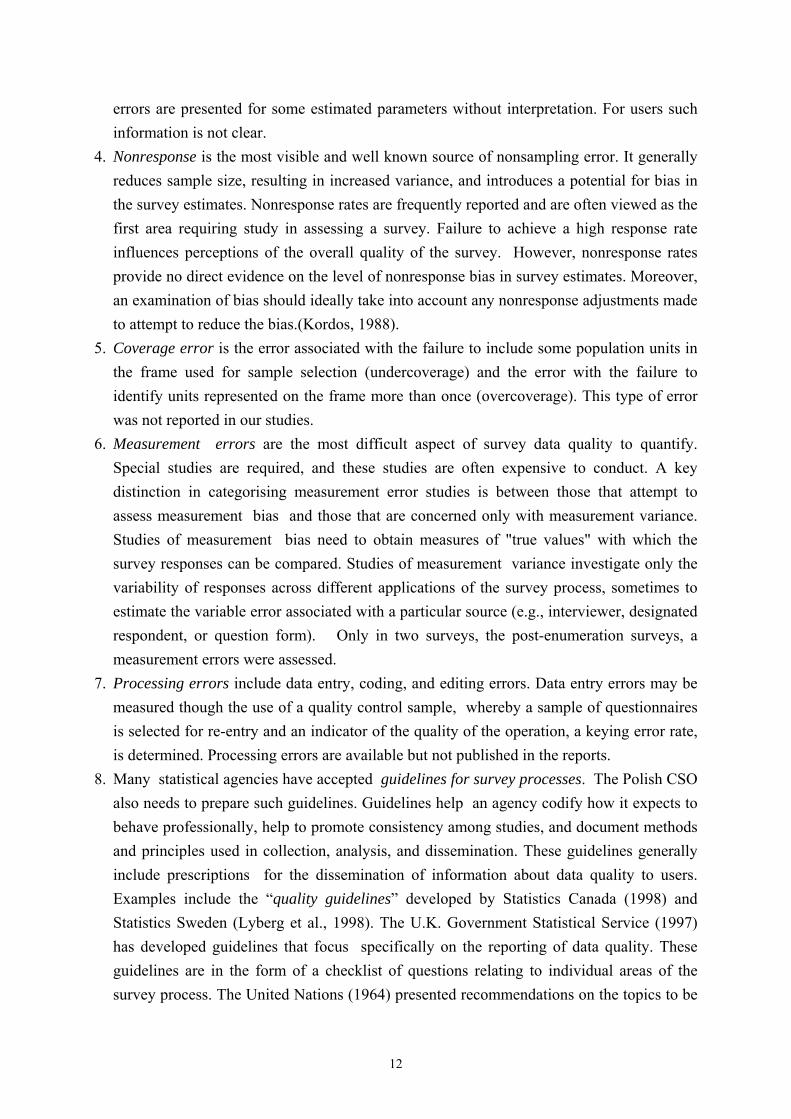
4. Nonresponse is the most visible and well known source of nonsampling error. It generally reduces sample size, resulting in increased variance, and introduces a potential for bias in the survey estimates. Nonresponse rates are frequently reported and are often viewed as the first area requiring study in assessing a survey. Failure to achieve a high response rate influences perceptions of the overall quality of the survey. However, nonresponse rates provide no direct evidence on the level of nonresponse bias in survey estimates. Moreover, an examination of bias should ideally take into account any nonresponse adjustments made to attempt to reduce the bias.(Kordos, 1988).
5. Coverage error is the error associated with the failure to include some population units in the frame used for sample selection (undercoverage) and the error with the failure to identify units represented on the frame more than once (overcoverage). This type of error was not reported in our studies.
6. Measurement errors are the most difficult aspect of survey data quality to quantify. Special studies are required, and these studies are often expensive to conduct. A key distinction in categorising measurement error studies is between those that attempt to assess measurement bias and those that are concerned only with measurement variance. Studies of measurement bias need to obtain measures of "true values" with which the survey responses can be compared. Studies of measurement variance investigate only the variability of responses across different applications of the survey process, sometimes to estimate the variable error associated with a particular source (e.g., interviewer, designated respondent, or question form). Only in two surveys, the post-enumeration surveys, a measurement errors were assessed.
7. Processing errors include data entry, coding, and editing errors. Data entry errors may be measured though the use of a quality control sample, whereby a sample of questionnaires is selected for re-entry and an indicator of the quality of the operation, a keying error rate, is determined. Processing errors are available but not published in the reports.
8. Many statistical agencies have accepted guidelines for survey processes. The Polish CSO also needs to prepare such guidelines. Guidelines help an agency codify how it expects to behave professionally, help to promote consistency among studies, and document methods and principles used in collection, analysis, and dissemination. These guidelines generally include prescriptions for the dissemination of information about data quality to users. Examples include the �quality guidelines� developed by Statistics Canada (1998) and Statistics Sweden (Lyberg et al., 1998). The U.K. Government Statistical Service (1997) has developed guidelines that focus specifically on the reporting of data quality. These guidelines are in the form of a checklist of questions relating to individual areas of the survey process. The United Nations (1964) presented recommendations on the topics to be
12

documented when preparing sample survey reports, including information on many sources of error. In is important to note that information about survey procedures can also provide users with valuable insights into data quality. It is important to report information about the background and history of the data collection programme, its scope and objectives, sample design and sample size, data collection procedures, time period of data collection, the response mode, the designated respondents, as well as processing and estimation procedures. For repeated surveys, it is also important for users to be aware of changes in design, content, and implementation procedures since they may affect comparisons over time.
REFERENCES BARCIKOWSKI, B., DYTMAN, M. and FRONK, M.(1999), The Adjustment Statistics of
Services to European Standards in Poland, Statistics in Transition, vol. 4, number 2, pp. 165-180.
BARCZYK, R. (1995), Business Survey Method and its Usefulness in the Polish Economy under Transformation, Statistics in Transition, vol. 2, number 1, pp. 93-104.
BRACHA, Cz. (1996a), Schemat losowania proby do spisu ludnosci i mieszkan 1995 r. (Sample Design for Population Micro Census 1995). [in:] Gospodarstwa domowe i rodziny. Spis ludnosci i mieszkan metoda reprezentacyjna 1995. Central Statistical Office, Warszawa, pp. 10 � 14.
BRACHA, Cz. (1996b), Teoretyczne podstawy metody reprezentacyjnej (Theoretical Background of Sampling Methods), PWN, Warszawa, pp. 283.
BRACHA, Cz. (1998), Schemat losowania proby i metoda estymacji w badaniu ankietowym �stan zdrowia ludnosci� (Sample Design and estimation Method in the Health population Survey), "Wiadomosci Statystyczne", No. 3, pp. 9-15.
CENTRAL STATISTICAL OFFICE (1999), Metodyka badania budzetow gospodarstw domowych (Methodology of Household Budget Survey), Zeszyty Metodologiczne, Głowny Urząd Statystyczny, Warszawa, pp.146.
CENTRAL STATISTICAL OFFICE (2000), Labour Force Survey in Poland - I Quarter 2000, Informacje i Opracowania Statystyczne, Głowny Urząd Statystyczny, Warszawa.
DEPOUTOT, R. (1999), Reporting Sources of Error: The Eurostat Experience. Proceedings of the International Statistical Institute, 52nd Session, Tome LVIII, Book 1, Helsinki, pp. 317-320.
KASPRZYK, D., ATKINSON, D. GIESBRECHT, L., McMILLEN, M., SCHWARZ, D. and SIEBER W.K. (1999), Reporting Sources of Error: The United States Experience. Proceedings of the International Statistical Institute, 52nd Session, Tome LVIII, Book 1, Helsinki, pp. 313-316.
KASPRZYK, D., KALTON, G. (1997), Measuring and Reporting the Quality of Survey Data, Proceedings of Statistics Canada Symposium 97: New Directions in Surveys and Censuses, 179-184, Ottawa: Statistics Canada.
KORDOS, J. (1985), Towards an Integrated System of Household Surveys in Poland, "Bulletin of the International Statistical Institute", (invited paper), vol. 51, Amsterdam, Book 2 , pp. 1.3.1 -18.
KORDOS, J. (1987), Dokładnosc danych w badaniach społecznych (Data Accuracy in Social Surveys), Biblioteka Wiadomosci Statystycznych, GUS, t. 35, Warszawa. pp. 172.
KORDOS, J. (1988), Jakosc danych statystycznych (Quality of Statistical Data), Panstwowe
13
Wydawnictwo Ekonomiczne, Warszawa, pp. 204. KORDOS, J. (1995): Nonresponse Problems in Polish Household Surveys, Statistics in Transition, vol. 2, number 5, pp. 789-812. KORDOS, J. (1996a), Some Issues of Sampling Surveys in Poland in Transition Period,
Survey Statistician, Nr 6, December 1996, pp. 5-9. KORDOS, J. (1996b): Forty years of the household budget surveys in Poland, , Statistics in Transition, vol. 2, number 7, pp. 1119-1138. KORDOS, J. (1998): Social Statistics in Poland and its Harmonisation with the European
Union Standards, Statistics in Transition, vol. 3, Number 4, pp. 617-639. KORDOS, J. and KURSA, L. (1997) , Agricultural sample surveys in Poland, Statistics in Transition, vol. 3, Nr 1, pp. 75-108. LEBERG, L., BIEMER, P. and JAPEC,l. (1998). Quality improvement in surveys - process
perspective. Joint Statistical Meetings, American Statistical Association, Dallas, August 8-13, 1998.
LEDNICKI, B. (1982), Schemat losowania i metoda estymacji w rotacyjnym badaniu budzetow gospodarstw domowych (Sampling Design and Estimation Method in Household Budget Rotation Survey) . "Wiadomosci Statystyczne", No. 9.
NIEDBALSKA, G. (2000), Polish Innovation Surveys - The Present Situation and the Analysis of the Results, Statistics in Transition, vol. 4, number 6, pp. 969-995.
STATISTICS CANADA (1998). Statistics Canada Quality Guidelines. Third Edition. October 1998.
SZARKOWSKI, A. and WITKOWSKI, J. (1994), The Polish Labour Force Survey, Statistics in Transition, vol. 1, No. 4, pp. 467-483.
U.K. GOVERNMENT STATISTICAL SERVICE (1997), Statistical Quality Checklist. Office for National Statistics.
UNITED NATIONS (1964), Recommendations for the Preparation of Sample Survey Reports (Provisional Issue). Sales No.:64.XVII.7. New York.
U.S. CENSUS BUREAU (1998), Guidelines for Statistical Metadata on the Internet, paper contributed to the Conference of European Statisticians, Forty-Sixth Plenary Session, Paris, May 18-20, 1998.
WALCZAK, T. (1999), Zasady projektowania i realizacji badan statystycznych (Principles of Designing and Implementation of Statistical Surveys), Statystyka w praktyce, Głowny Urząd Statystyczny, Warszawa, pp. 152.
ZAGOZDZINSKA, I. (1996), Selected Issues of Business Statistics in Poland, , Statistics in Transition, vol. 2, number 6, pp. 879-892. ZASEPA, R. (1969 ), Szacowanie niedokładnosci wynikow badan statystycznych
(Assessment of inaccuracy in statistical surveys), �Biblioteka Wiadomosci Statystycznych”, t. 7, Warszawa.
ZASEPA, R. (1972 ), Metoda reprezentacyjna (Sampling Methods), PWE, Warszawa. ZASEPA, R. (1979 ), Zagadnienie precyzji wynikow badan reprezentacyjnych (Precision of
results in sampling surveys) �Biblioteka Wiadomosci Statystycznych”, t. 29, Warszawa. ZASEPA, R. (1993), Use of Sampling Methods in Population Censuses in Poland, Statistics
in Transition, vol. 1, No. 1, pp. 69-78. ZASEPA, R. (1993). Precyzja wynikow badan budzetow rodzinnych (Precision of family budget survey results), "Wiadomosci Statystyczne", No. 3.
14
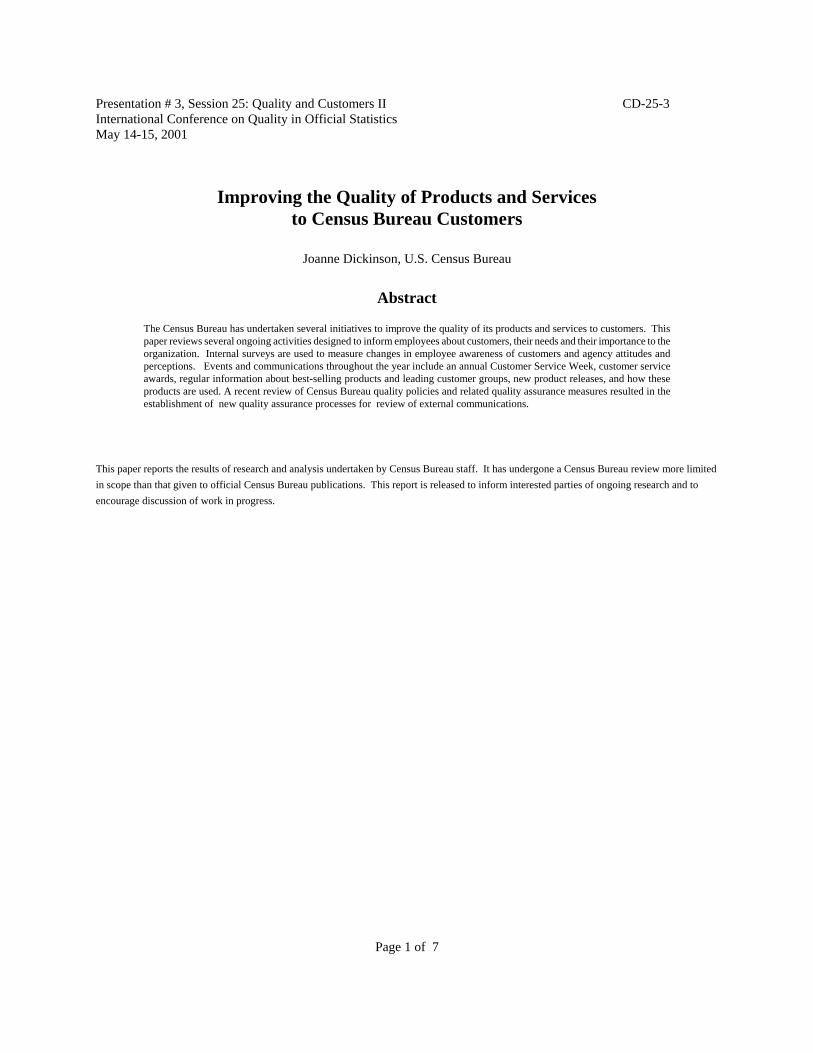
Presentation # 3, Session 25: Quality and Customers II CD-25-3 International Conference on Quality in Official Statistics May 14-15, 2001
Improving the Quality of Products and Services to Census Bureau Customers
Joanne Dickinson, U.S. Census Bureau
Abstract
The Census Bureau has undertaken several initiatives to improve the quality of its products and services to customers. This paper reviews several ongoing activities designed to inform employees about customers, their needs and their importance to the organization. Internal surveys are used to measure changes in employee awareness of customers and agency attitudes and perceptions. Events and communications throughout the year include an annual Customer Service Week, customer service awards, regular information about best-selling products and leading customer groups, new product releases, and how these products are used. A recent review of Census Bureau quality policies and related quality assurance measures resulted in the establishment of new quality assurance processes for review of external communications.
This paper reports the results of research and analysis undertaken by Census Bureau staff. It has undergone a Census Bureau review more limited in scope than that given to official Census Bureau publications. This report is released to inform interested parties of ongoing research and to encourage discussion of work in progress.
Page 1 of 7

1. INTRODUCTION 1.1 Background The Census Bureau traditionally has worked with customers to improve the quality of its products and services to its customers. Since the 1920 census, when our first advisory committee came into being, the Census Bureau has made concerted efforts to consult with its data user communities in a variety of forums about the content and publication of census information. Since the 1970's the Census Bureau has included in its organizational structure an office whose primary role is to help customers learn about, acquire, understand, and use Census Bureau information. In 1993 we began an aggressive program to focus on customers and to find out about their needs, wants, and satisfaction with our products and services. In 1996, the Census Bureau established the Marketing Services Office to bring about at the very center of its organizational being, customer-focused products and services. This paper discusses the new, recent, and ongoing activities designed to improve the quality of products and services to Census Bureau customers. It summarizes regular surveys of employees, the setting of customer service standards, awards for outstanding customer service, and an annual week-long program to continuously remind employees of the importance of customers. Moreover, the Census Bureau recently began examining options for centralizing processes to monitor quality assurance of written communications about Census Bureau programs, products, and services intended for the general public.
2. SURVEYING EMPLOYEES
2.1 Pre-Census 2000 The Census Bureau acknowledges that empowered, well-trained, and equipped employees are essential to providing quality products and services to its customers. Therefore, the Census Bureau has surveyed its employees from 1998-2000 to find out about their perspectives on workplace issues and has used this information to improve products and services for the customers it serves. 2.2 2000 Survey In the 2000 survey of Census Bureau employees were several questions on innovation and customer orientation. 2.2.1 About two-thirds of the employees agreed to strongly agreed that:
Appropriate training was available to them;
Customers have easy and adequate access to information about products and services; Service goals are aimed at meeting customer expectations.
2.2.2 However, fewer employees answered favorably about change and risk-taking: Only one-fifth to two-fifths of employees answered favorably when asked about the Census Bureau�s receptivity to change and risk-taking, and the presence and use of customer feedback systems when refining or designing new products and services. Analysis and improvement plans are under development.
Page 2 of 7

3. Implementing Customer-Focused Programs for Employees: 3.1 Establishing Official Census Bureau Customer Service Standards: The U.S. Census Bureau believes strongly in the importance of excellent customer service. That is why it decided to publish in 1996 a set of standards that communicates to the general public, particularly the data-user community, the kind of treatment they should expect when they make a request of us. The standards focus on excellence, timeliness, responsiveness, accessibility, and commitment. We further interpret these standards as they apply to our four categories of customers: general information customers, purchasers of off-the-shelf products, special request customers, and survey sponsors.
Excellence: We will guarantee a quality product or service that meets or exceeds your
expectations. We will measure our performance against the "best in the business.�
Timeliness: We will provide you with realistic delivery times based on the nature of the request.
(General information) We will answer your request for information promptly, usually within 24 hours of receipt by the responding office.
(Off-the-shelf) We will ship any available product within three days of receiving
your request. (Priority orders will be shipped within 24 hours.) (Special requests) We will ship special requests by the agreed-on delivery date. (Surveys) We will meet all dates and deliverables as documented in the time
lines we negotiate with you.
Responsiveness: We will respond promptly to all requests in accord with our resources and capabilities.
We will acknowledge receipt of e-mail, FAX, or telephone calls within 24 hours.
We will cover the telephones at all customer-contact points during normal business hours, from 8:30 a.m. to 4:30 p.m. (EST), Mondays through Fridays.
We will investigate and act to resolve your complaints within two working days of their receipt.
Accessibility: We will provide you with choices for products, services, and the means of
delivery. We will periodically survey you to assess your needs. We will use the results of these customer surveys for product development.
Commitment: We will be courteous, respectful, responsible, and professional at all times.
We will take responsibility for providing answers to your requests to the best of our knowledge and skills.
We will make sure if we need to refer your request that the person we are referring you to can provide an answer.
To remind employees of our commitment to customers, we printed desk- and wallet-sized reminder cards. As you will read later in this paper several of the Annual Customer Service Week activities have been framed around and reinforce the Census Bureau’s customer service standards.
Page 3 of 7

3.2 Conducting Ongoing Customer Research: To bring about a customer-focused culture at the Census Bureau, we recognized that we first had to inform and educate employees about their customers, needs, and preferences. The customer research program began by systematically collecting, analyzing, and presenting objective and useful information to managers to help them solve problems or to make customer-focused decisions about programs, products, and services. The research program uses database mining, customer satisfaction surveys, focus groups, and beta testing techniques and tools that ultimately translate into the Census Bureau developing better and easier-to-use offerings, based on customer information and feedback. Next, we established and maintain an InTRAnet site for employees that includes not only the results of monthly, quarterly, and annual customer research but serves also as a source for information for identifying resources and procedures to help them market and increase awareness of their products and services. Every month we publish on our InTRAnet site and route to executives reports of the Census Bureau�s �Top 10� products, customer groups, quantities, purchased, and revenue-generators during the preceding month. Of interest in one of the Top 10 reports this year, for example, was the media joining and topping the top 10 customer groups by revenues and quantities purchased. This was illustrated in a spike in the purchases of a 1990 census product. This information implies that the media were readying themselves to study the changes between 1990 census data and the newly released and forthcoming data from census 2000. The reporting of these kinds of events spurs employee interest in and awareness of customers as they work to produce new and improved products and services. 3.3 Periodic Customer Spotlight Programs: Hour-long auditorium-based presentations and product demonstrations are another venue used to keep employees informed and involved in customer-focused products and services. We try to maintain a schedule of monthly presentations to highlight to employees new Census Bureau services, demonstrate new or revised products, summarize customer- and product-based research, and discuss any program changes that may be implemented as a result. 3.4 Presenting News from �Dr. Info�: As part of our effort to keep employees aware of happenings with programs and products, the Census Bureau�s Customer Service Center hosts open, stand up meetings to brief primarily front-line customer service employees about current happenings with Census Bureau products and services. At these weekly briefings we report to all interested employees about the status of programs, products and services, include time for questions and answers, and consequently arm employees with topical information to help them more accurately respond to customer inquiries. 3.5 Celebrating Annual Customer Service Week: 3.5.1 Background: Growing in popularity and participation among employees is our Annual Customer Services Week held the first full week in October. The International Customer Service Association (ICSA) first launched National Customer Service Week in 1988. In 1992, National Customer Service Week was proclaimed a national event by the United States Congress and is also celebrated by thousands of companies around the world.
Page 4 of 7

Since 1996 when the Census Bureau first began sponsoring its Annual Customer Service Week, activities have blossomed from a single auditorium event with a guest speaker presenting information on customer service excellence to several ongoing and interactive events that reach out to Census Bureau employees at headquarters and in Census Bureau regional offices. Special events and training focus on and celebrate the importance of employees and the needs, wants, and satisfaction of customers (internal and external), and include customer service stories, techniques, and successes. 3.5.2 Opportunities: The events provide the Census Bureau with opportunities to:
Recognize and thank employees who dedicate themselves to customer satisfaction and corporate success; and,
Increase awareness and again remind employees of the importance of quality customer service.
3.5.3 Objective: The objective of the Census Bureau's Annual Customer Service Week is to re-energize employees with positive customer service messages and information-sharing that generate an even stronger ongoing commitment to customer service excellence. 3.5.4 Highlights and lessons learned from 2000 events: The theme and events corresponded with the National theme: "ALL IN A DAY'S WORK" 3.5.4.1 Kiosks, Posters, Week-at-a-glance Calendars:
Each year, we develop a kiosk display for the main entrance to the Census Bureau. It is based on the Census Bureau�s Standards for Customer Service officially established in 1996 just prior to our first Customer Service Week. On the tops of tables in our cafeteria stand plexiglass displays with our week-at-a-glance program calendars on one side and a customer service standards-based quiz on the reverse. In the lobbies of all Census Bureau buildings stand easel displays with posters to announce the special events. On the lawns at the Suitland complex entrances and at the fronts of buildings stand lawn posters reminding employees about the week and its celebrations.
3.5.4.2 Training in Customer Service Skills and Strategies:
At no cost to Census Bureau offices, on a first-come, first served basis, the Marketing Services Office hosts special 2-day courses in customer service training for front-line customer service providers who regularly communicate with external customers. Contractors are brought on site to conduct this training and classroom registrations are allocated based on one participant per division.
3.5.4.3 Celebrating Customers Carnival:
For two years� running one of the more popular events, was the Celebrating Customers Carnival. This event included table top exhibit displays developed by participating offices. Each office (whether their customers were internal or external to the Census Bureau) was invited to set up a �homemade� table display that creatively illustrated their customer service activities and quality service standards. The displays--all within the theme of "All in a Day's Work!"--could highlight:
• customers and how they were being served; • how offices maintained customer relationships; and,
Page 5 of 7

• how they kept abreast of their customer's wants, needs, and expectations --
The creativity and varying dynamics of products and services offered helped drive home the corporate story of the diversity among Census Bureau customers and the resulting program offerings. Employees had fun with this activity. It generated team-based synergy and created healthy competition among offices to best create displays that illustrated their superior customer services processes and standards in place to meet or exceed customer needs, preferences, or expectations.
In the true spirit of customer service, last year we expanded Customer Service Week activities beyond the headquarters office to reach thousands of employees in the 12 Census Bureau regional offices, phone and processing centers nationwide. We included on-line pictures of displays that allowed staff in the field to vote for their favorite display. Although ribbons and a plaque have been the only rewards to employees for their participation, we learned that they take this event and its competition very seriously. Smaller offices complained that they could never win.
3.5.4.4 Customer Service Testimonials:
Continuing to focus employees on activities to identify and communicate with customers about their product and service needs and preferences, we invited them to document some of their more unusual requests or interesting experiences with customers and to explain how they were empowered to handle the situation. This effort�s small reward was their write-up and photo being included in a program handout �Celebrating Our Customers and Services to Them: All in a Day�s Work.�
3.5.4.5 Awards for Excellence in Customer Service:
A big draw to the auditorium closing ceremony has been the employee �Excellence in Customer Service� award. We established these awards to recognize and honor employees who during the course of the year have continually demonstrated and represented excellence in customer service within their office. Although the formats for our opening (Tuesday) and closing (Thursday) ceremonies are very similar, the closing ceremony that includes these awards usually fills the auditorium to capacity as supervisors, colleagues, family, and friends join in on the celebration. Census Bureau executives and office supervisors call the recipients on stage to receive their citations and award money for their contributions to excellence in customer service. The Customer Focus program sponsors and funds the �Excellence in Customer Service� award. The award value traditionally has been U.S. $100 and each of the 40 divisions and regional offices of the Census Bureau is encouraged to select and submit nominees. We have 24 to 75 recipients from among all offices receive awards at the closing ceremonies. Auditorium ceremonies generally are opened by the Census Bureau�s director and/or Deputy Director and are traditionally followed by celebrated speakers in the arena of customer service and a humorous and interesting short film that brings home the story about the need for excellence in customer service. Occasionally, we have had round-table discussions, exercises in role playing, and audience participation in a Census Bureau created game based on customer satisfaction scenarios.
4. Focusing on Quality Communications
4.1 A New Look for the New Millennium As the preeminent collector and distributor of statistical information about the United States people and its economy and as a major player in today�s information marketplace, the Census Bureau recognized the need for a strong visual identity--a corporate image, a look that would help everyone know who we are as well as help them recognize our products and publications at a glance.
Page 6 of 7
In 1996, we contracted for an independent study to review the hundreds of products the Census Bureau released and concluded that we lacked a uniform look to our products and communications, as well as a suitable public image. We followed up this study with an internal �look and feel� corporate project team that led to the development of a new

corporate look. Our new visual identity has several main components: the emblem or word mark, a corporate tag line, a report cover design system, a standard typeface, and a palette of coordinated colors. 4.2 Reviewing Quality Assurance for Products and Communications The Census Bureau�s reputation largely depends on the quality of its products and its customers� perceived value of them. Accordingly, we apply quality assurance measures in many different forms and degrees at various stages of programs. We implement quality assurance measures in our planning and operations for data collection, review, editing, processing, and tabulation to ensure that only quality information is released. Our ability to provide quality products and to achieve program objectives is directly related to our ability to communicate effectively with constituents. Our constituency includes legislators, our parent agency, the U.S. Department of Commerce, state and local governments, and stakeholder and public interest groups. We also recognize that our ability to communicate effectively with the general public through promotions, questionnaires, and other dissemination tools can affect critical factors like response rates to surveys and censuses and also can directly impact the need for follow-up interviews to clarify ambiguous or incomplete responses. The Census Bureau needs quality assurance to avoid the release of poorly written documents that are hard to understand, that use incorrect grammar or that contain misspelled words. With the presence of these kinds of errors, our constituents and the general public might develop a quality-questioning mindset that could transcend into questions about the accuracy and reliability of the statistical information collected and disseminated by the U.S. Census Bureau. Therefore, we are aware that all Census Bureau employees need to understand the importance and impact of a well-rounded and consistent communications program that delivers consistent and accurate messages. A few examples of inconsistencies and errors with some recent narratives led Census Bureau executives to ask for a review of our quality assurance processes. In the Spring of 2000, a corporate team was asked to identify ways to ensure that Census Bureau documents prepared for external distribution (publications, promotional materials, questionnaires, correspondence, and administrative documents) meet Census Bureau standards for quality. The team found no systemic quality problems that would require major overhauls of processes or an organizational change to repair. The team�s research also found that the �defects� that led up to this study were generally the result of fast-paced, last-minute changes or processing, done to meet publishing deadlines. Finally, the team recognized that some internal re-engineering of processes may reduce the number of errors, but in perspective, agreed that a goal of �zero defects� is seldom achievable. So the team put together a template process to focus on generic quality assurance processes and standards (spelling, grammar, responsiveness, factual content, format, tone, and style) that could provide reasonable chances of discovering and fixing potential errors before documents are released. The agency recently signed off on this new set of guidelines for executive correspondence and implementation plans are underway. We plan to test and refine these guidelines as required before expanding the prototype to other program areas.
5. Summary
In summary, the Census Bureau has sustained and continues its commitment to improving quality of products and services to its customers. We focus on employees through internal programs that call attention to customer needs, wants, and satisfaction; we established standards for and recognize excellence; and, we maintain a constant customer orientation through research and quality assurance initiatives.
Page 7 of 7

CD-25-4
PARTNERSHIP – THE KEY WORD IN QUALITY?
Martin Collins, Wendy Sykes and Jean Martin
1 Introduction In this paper we seek to take forward thoughts about the dimensions of quality in survey supply first presented in a speculative contribution to the 1995 international conference on Survey Management & Process Quality and developed in a subsequent article in the Journal of Official Statistics (Collins and Sykes, 1995, 1999). We offer first some confirmation and clarification of the framework, based on interviews with UK public sector survey customers. We move on to focus on the issue of relationships between suppliers and customers, including in our discussion our interpretation of the results of conversations (and email ‘conversations’) with some major UK survey suppliers. The previous papers The previous papers were set in the framework of Levitt’s theory of the ‘augmented product’ (Levitt, 1980). This suggests that differentiation between ‘products’ – of any kind – which are comparable and acceptable in terms of basic qualities can best be achieved by augmenting the product, especially in terms of service and delivery quality. In suggesting that this theory could benefit survey suppliers, we proposed a framework of ‘levels of quality’: Resource quality: staffing, skills, experience and, arguably, reputation. Design quality: the application of the resources to a particular project. Process management quality: TQM in the survey context.
Service standards: the more formal elements of relationships between supplier and customer, generally capable of being agreed contractually. Relationship quality: the softer elements of relationships, personal or corporate.
It is important to note that we were not suggesting that strengths later in the list (especially relationship quality) can or should compensate for more basic weaknesses. Like Levitt, we are talking about ‘augmentation’ – adding something to an essentially sound product that might differentiate it from others equally sound. Nor did we suggest that there were clear-cut boundaries between our posited levels of quality. Each level tends to shade into its neighbour(s). And more distant links can arise: most importantly, the customer’s perception of a good relationship in one survey will come to be seen as part of the supplier’s ‘resources’ when another survey is to be commissioned.

CD-25-4
Partnership In defining ‘Relationship Quality’ we stressed the importance of sharing between supplier and customer – sharing concerns, objectives, recognition of constraints, problems, solutions, and information. This we now call ‘partnership’ – a balanced (even if not equal) relationship which recognises common interest whilst acknowledging differences of responsibilities and contexts, and which goes beyond contractual obligations. Subsequent research Our further research was in two parts. In the first, a small-scale project carried out for, and funded by, ONS Social Survey Division, we interviewed eight public sector survey customers. Our concern here was to explore how customers judged quality and, in particular, how they assessed and valued relationships with suppliers. The objective was to test and clarify our speculative framework. In the second, we sought (by email and conversation) views from six major UK suppliers of surveys to public sector customers. Although not all organisations replied, we did receive six responses from individuals. Our focus at this stage was on the concept of partnership – was it valid, what were the limitations and barriers? 2 Summary of the Results In subsequent sections we will seek to distill and interpret the results of our further research, with a focus on the concept of partnership. Here, we give only very broad summaries. Research among customers Our interviews with customers broadly confirmed our prior thoughts. Customers recognised that quality could be assessed at a number of different levels, even if they did not necessarily draw the lines where we drew them, or use exactly the same terminology. We had sought to focus on customer needs and their satisfaction. But our context and terminology were probably still those of the supplier – where to concentrate scarce resources, and how to compete. Customers seemed to recognise the same range of quality issues but set them in a rather different context. The buyer’s framework was equally action-oriented but still more ‘outcome-oriented’: Who can be considered for this job – generally, invited to tender; Who wins; How good was the survey; How good was the experience?

CD-25-4
Despite the difference of context, clear parallels could be drawn. Thus ‘Resource’ quality was the main determinant of whether a supplier would be considered. ‘Design’ quality, together with evidence of ‘Process Management’ quality, were key in awarding the contract. Most importantly, customers did differentiate between the quality of the survey (defined largely in terms of ‘Process Management’ quality and ‘Service Standards’, ie technical and formal factors) and the quality of the transaction (where ‘Relationship’ quality played an important part). And, in the last respect, what was sought seemed to fit with our concept of partnership – sharing goals and, especially, information. The project also alerted us to other issues deserving of attention: perceived differences between supplier organisations and individual researchers in terms of their ability to engage in worthwhile relationships, differences between customers and between surveys in terms of the valuation of relationships, necessary limitations affecting both parties, and barriers that might be reinforced or weakened (if not broken down) by procedures. We decided to follow up some of the issues among survey suppliers. Research among suppliers Among suppliers, our focus was on the concept of partnership. The principle was clearly understood and seen to be desirable. The characteristics of successful partnerships were enunciated. But the focus of all comments was on limitations and barriers, extending even to doubts that customers would or could deliver their side of the bargain. These are the problems to which we will return. 3 The Characteristics of Partnership Partnership implies a synergistic relationship working towards quality and mutual satisfaction in a particular survey. (We are not suggesting necessarily that a long term or ‘monogamous’ relationship is implied; nor is love!) Key features are mutual understanding, trust and confidence, agreed priorities, communication, and flexibility. The ideal partnership may be unattainable; certainly it can not be prescribed. Productive partnerships can arise when none of the signs seem right; failed partnerships can occur under even the most propitious circumstances. Still it seems worth exploring what factors might contribute to a successful partnership. Here, we can return to an ‘augmentation’ model. At the most basic level, it must be assumed that supplier and customer each bring basic skills or competences: the supplier bringing technical competences and resources; the customer clarity of purpose and the ability to judge when the purpose is met. We should also assume (hopefully) that each party will act ‘professionally’ to give a fair deal by acting in an even-handed way and by delivering what was promised when it was promised. Much useful research is carried out at just this level, with little real interaction between supplier and customer. Something can usually be added, however, by some exchange even at this level, with each party accepting comment from the other.

CD-25-4
At the next level we can introduce ‘sensitivity’. The supplier is sensitive to the customer’s concerns, constraints and ‘politics’. The customer is sensitive to the supplier’s constraints and objectives. Here we have the beginnings of a sharing relationship, but it stops short of partnership. Partnership depends essentially on two factors – open communication and flexibility. The supplier must keep the customer informed, even when the news is bad. The customer must inform the supplier of changes in demand and of feedback to interim information. Both must be flexible in reacting to events or problems. True partnership is signalled when problems are shared openly and solutions are discussed and agreed mutually. 4 Limitations and Barriers Factors of two kinds can stand in the way of the development of successful partnerships. One set consists of limitations – unavoidable (or virtually unavoidable) factors which limit the freedom of either party. The other consists of barriers – factors that can be broken down or reinforced by procedures and behaviour. Limitations The most obvious limitation is the fact that each party has responsibilities beyond the immediate transaction. On the supplier side, the researcher or research team has responsibilities for the good of the organisation; the organisation has a duty to remain solvent. On the customer side, the research buyer must fit in with wider policy or management needs. A second limitation arises from the fact that one partner holds the purse strings. This need not intrude upon partnership but is bound to affect to some extent the attitudes and behaviour of both parties. Other limitations can arise in the area of resource constraints. Partnership demands commitment and may seem to demand extra time, for the survey as a whole and for the (possibly over-stretched) individuals concerned. Limitations have to be accepted and worked around. If the elements of trust, mutual confidence and flexibility are strong, no great problem need arise. But any limitation can become a barrier if the will is absent or behaviour is inappropriate.

CD-25-4
Barriers Purchasing procedures can all too easily form barriers to partnership, especially in the public sector. The broad system of competitive and fixed price tendering is most often blamed. But the system is not inherently at fault; indeed, it is probably a desirable constraint on behaviour and a key element of accountability. It is the way the system is implemented that determines whether partnership can be achieved: whether it is a limitation or a barrier. Trust, confidence and flexibility are again key determinants. Most systems allow some flexibility when needed. Single tendering can be used on appropriate occasions, for small projects, for continuations, or when unique expertise is needed. The lowest tender does not have to win, if another seems more reliable on the basis of understanding the problem, past experience, and so on. ‘Fixed’ prices can be varied if justifiable need is agreed. The system becomes a barrier only when this flexibility is not used. On the customer side, this may happen when the immediate contact lacks the confidence to bend the rules, due to inexperience or excessive pressure from above. The worst case scenario, reported by suppliers, is that of an over-powerful procurement officer or department, seeking to apply to the purchase of something as complex and unpredictable as a survey principles developed in the context of buying goods or simple, highly specified services. Price and delivery time rule. Suppliers can also react badly to the system. In tendering, they may hesitate to point to flaws in the specification or suggest alternative approaches. They will pare the service to the bone to meet the specification at the lowest cost. Having won a contract, they will focus on meeting minimum demanded standards and hesitate to raise problems that may well justify additional costs or time. And, like the immediate customer, they may face – or feel they face – excessive pressure from above to meet targets set in terms of productivity or profit. If both parties adopt a rigid view of the systems or procedures, there is no hope for partnership. Rather, an adversarial relationship is likely to develop. The supplier sees the customer as a nuisance or a threat to smooth running or profit. The customer sees the supplier as a predator to be watched closely and fended off. 5 Conclusion – Where there’s a will, there’s a way In our conviction that partnership is the key to survey quality – as an addition to basic competences and processes – we were joined by almost all the customers and suppliers we contacted. All were able to see the potential benefits but many, or most, were more able to see the problems of implementation. Some of these problems are to an extent unavoidable. They are limitations but do not have to become barriers.
CD-25-4
Attempts to ‘legislate’ or systematise aspects of the ideal relationship can help to ensure that the basic survey product is not impaired. They can encourage, even train in, best practice in order to reduce differences between individuals. But, taken too far, mechanistic approaches to relationship quality can fail to capture the spirit of partnership and may even drive it out. What matters is attitude and approach: openness, honesty, mutual understanding, and flexibility. Then limitations do not become barriers, and barriers can be transformed into mere limitations, accepted by both parties. Just keep saying to yourself “for better or worse, we’re in this together”. References Collins, M. and Sykes, W. (1995). ‘Survey quality – the user’s view’. Proceedings, International Conference on Survey Measurement & Process Quality, Bristol, April 1995, pp 190-194. Collins, M. and Sykes, W. (1999) ‘Extending the definition of survey quality’. Journal of Official Statistics, 15, 1, pp 57-66. Levitt, T. (1980). ‘Differentiation – of anything’. Harvard Business Review, Jan-Feb 1980, pp 72-93.