france case study - model based analysis of the deployment of electric vehicles in the paris ile de...
TRANSCRIPT
Model based analysis of the deployment of electricvehicle in the Paris Ile de France region
66TH Semi-annual IEA-ETSAP meeting17-21 November, 2014 - Copenhagen
Edi AssoumouJérôme Houël
Jean-Paul MarmoratMines ParisTech, PSL Research Univeristy
Center for Applied Mathematics
ContextMobility analysis
Integration into the optimization module
Main problematic
Problematic1 Impact on the electric system (charging level)2 Integration of EV in the transport system and mobility
patterns
CMA researchMobility focusParis Ile de France Region
November, 17 2014 Copenhagen Jérôme Houël Analysis of the deployment of EV in the Paris IDF region 2/20
ContextMobility analysis
Integration into the optimization moduleGrand Paris ProjectEV-STEP : The Paris IDF local case study
Agenda
1 Context
2 Mobility analysis
3 Integration into the optimization module
November, 17 2014 Copenhagen Jérôme Houël Analysis of the deployment of EV in the Paris IDF region 3/20
ContextMobility analysis
Integration into the optimization moduleGrand Paris ProjectEV-STEP : The Paris IDF local case study
Agenda
1 ContextGrand Paris ProjectEV-STEP : The Paris IDF local case study
2 Mobility analysis
3 Integration into the optimization module
November, 17 2014 Copenhagen Jérôme Houël Analysis of the deployment of EV in the Paris IDF region 3/20
ContextMobility analysis
Integration into the optimization moduleGrand Paris ProjectEV-STEP : The Paris IDF local case study
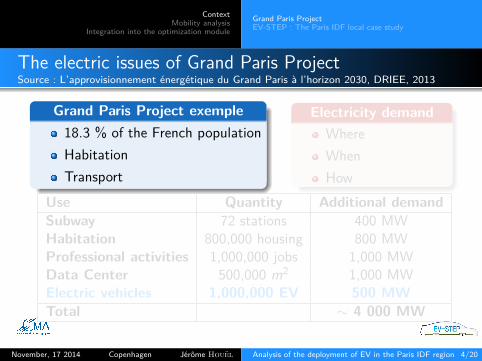
The electric issues of Grand Paris ProjectSource : L’approvisionnement énergétique du Grand Paris à l’horizon 2030, DRIEE, 2013
Grand Paris Project exemple18.3 % of the French populationHabitationTransport
Electricity demandWhereWhenHow
Use Quantity Additional demandSubway 72 stations 400 MWHabitation 800,000 housing 800 MWProfessional activities 1,000,000 jobs 1,000 MWData Center 500,000 m2 1,000 MWElectric vehicles 1,000,000 EV 500 MWTotal ∼ 4 000 MW
November, 17 2014 Copenhagen Jérôme Houël Analysis of the deployment of EV in the Paris IDF region 4/20

ContextMobility analysis
Integration into the optimization moduleGrand Paris ProjectEV-STEP : The Paris IDF local case study
The electric issues of Grand Paris ProjectSource : L’approvisionnement énergétique du Grand Paris à l’horizon 2030, DRIEE, 2013
Grand Paris Project exemple18.3 % of the French populationHabitationTransport
Electricity demandWhereWhenHow
Use Quantity Additional demandSubway 72 stations 400 MWHabitation 800,000 housing 800 MWProfessional activities 1,000,000 jobs 1,000 MWData Center 500,000 m2 1,000 MWElectric vehicles 1,000,000 EV 500 MWTotal ∼ 4 000 MW
November, 17 2014 Copenhagen Jérôme Houël Analysis of the deployment of EV in the Paris IDF region 4/20
ContextMobility analysis
Integration into the optimization moduleGrand Paris ProjectEV-STEP : The Paris IDF local case study
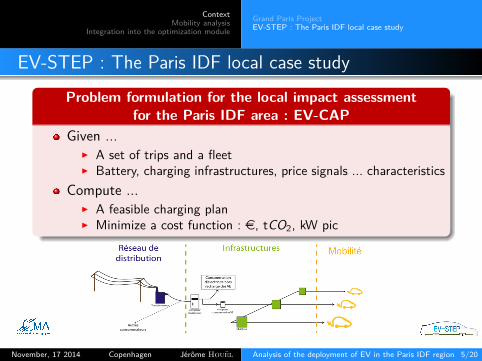
EV-STEP : The Paris IDF local case study
Problem formulation for the local impact assessmentfor the Paris IDF area : EV-CAP
Given ...I A set of trips and a fleetI Battery, charging infrastructures, price signals ... characteristics
Compute ...I A feasible charging planI Minimize a cost function : e, tCO2, kW pic
November, 17 2014 Copenhagen Jérôme Houël Analysis of the deployment of EV in the Paris IDF region 5/20

ContextMobility analysis
Integration into the optimization module
ENTD 2008Study parametersMobility results
Agenda
1 Context
2 Mobility analysisENTD 2008Study parametersMobility results
3 Integration into the optimization module
November, 17 2014 Copenhagen Jérôme Houël Analysis of the deployment of EV in the Paris IDF region 6/20
ContextMobility analysis
Integration into the optimization module
ENTD 2008Study parametersMobility results
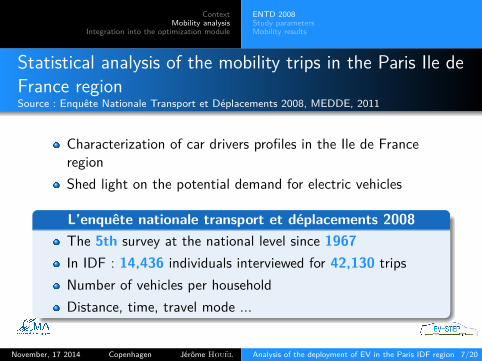
Statistical analysis of the mobility trips in the Paris Ile deFrance regionSource : Enquête Nationale Transport et Déplacements 2008, MEDDE, 2011
Characterization of car drivers profiles in the Ile de FranceregionShed light on the potential demand for electric vehicles
L’enquête nationale transport et déplacements 2008The 5th survey at the national level since 1967In IDF : 14,436 individuals interviewed for 42,130 tripsNumber of vehicles per householdDistance, time, travel mode ...
November, 17 2014 Copenhagen Jérôme Houël Analysis of the deployment of EV in the Paris IDF region 7/20

ContextMobility analysis
Integration into the optimization module
ENTD 2008Study parametersMobility results
Study parametersLocal mobility (under 80 km)A working dayTrips by car3 main criteria studied
1 Number of trips per individual per day2 Travel time of trips per individual per day3 Distance of trips per individual per day
November, 17 2014 Copenhagen Jérôme Houël Analysis of the deployment of EV in the Paris IDF region 8/20
ContextMobility analysis
Integration into the optimization module
ENTD 2008Study parametersMobility results
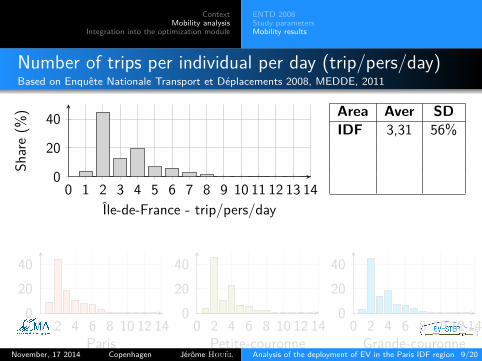
Number of trips per individual per day (trip/pers/day)Based on Enquête Nationale Transport et Déplacements 2008, MEDDE, 2011
0 1 2 3 4 5 6 7 8 9 10 11 12 13 140
20
40
Île-de-France - trip/pers/day
Share(%
) Area Aver SDIDF 3,31 56%
0 2 4 6 8 10 12 140
2040
Paris0 2 4 6 8 10 12 14
02040
Petite-couronne0 2 4 6 8 10 12 14
02040
Grande-couronneNovember, 17 2014 Copenhagen Jérôme Houël Analysis of the deployment of EV in the Paris IDF region 9/20
ContextMobility analysis
Integration into the optimization module
ENTD 2008Study parametersMobility results
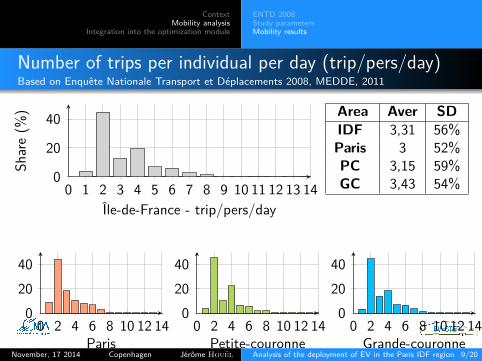
Number of trips per individual per day (trip/pers/day)Based on Enquête Nationale Transport et Déplacements 2008, MEDDE, 2011
0 1 2 3 4 5 6 7 8 9 10 11 12 13 140
20
40
Île-de-France - trip/pers/day
Share(%
) Area Aver SDIDF 3,31 56%Paris 3 52%PC 3,15 59%GC 3,43 54%
0 2 4 6 8 10 12 140
2040
Paris0 2 4 6 8 10 12 14
02040
Petite-couronne0 2 4 6 8 10 12 14
02040
Grande-couronneNovember, 17 2014 Copenhagen Jérôme Houël Analysis of the deployment of EV in the Paris IDF region 9/20

ContextMobility analysis
Integration into the optimization module
ENTD 2008Study parametersMobility results
Distance of trips per individual per day (km/pers/day)Based on Enquête Nationale Transport et Déplacements 2008, MEDDE, 2011
40 80 120 160 200020406080
100
Île-de-France - km/pers/day
Accumulated
(%)
Average : 34.7 kmStandard deviation : 90 %3/4 : - 50 km1/20 : + 100 km
November, 17 2014 Copenhagen Jérôme Houël Analysis of the deployment of EV in the Paris IDF region 10/20

ContextMobility analysis
Integration into the optimization module
ENTD 2008Study parametersMobility results
Travel time of trips per individual per day(min/pers/day)Based on Enquête Nationale Transport et Déplacements 2008, MEDDE, 2011
0 100 200 300 400 5000
20406080100
Île-de-France - min/pers/day
Accumulated
(%)
Average : 71,8 minStandard deviation : 73 %2/3 : - 1h301/10 : + 3h00
November, 17 2014 Copenhagen Jérôme Houël Analysis of the deployment of EV in the Paris IDF region 11/20

ContextMobility analysis
Integration into the optimization module
ENTD 2008Study parametersMobility results
Distribution of departure timesBased on Enquête Nationale Transport et Déplacements 2008, MEDDE, 2011
0 2 4 6 8 10 12 14 16 18 20 22 2402468
1012
Île-de-France - Departure time
Share(%
)
Begin at 6 AMFinish at 8 PM2 main pics
November, 17 2014 Copenhagen Jérôme Houël Analysis of the deployment of EV in the Paris IDF region 12/20
ContextMobility analysis
Integration into the optimization module
ENTD 2008Study parametersMobility results
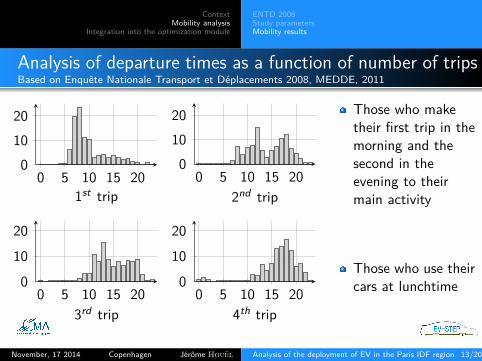
Analysis of departure times as a function of number of tripsBased on Enquête Nationale Transport et Déplacements 2008, MEDDE, 2011
0 5 10 15 2001020
1st trip0 5 10 15 20
01020
2nd trip
Those who maketheir first trip in themorning and thesecond in theevening to theirmain activity
0 5 10 15 200
10
20
3rd trip0 5 10 15 20
0
10
20
4th trip
Those who use theircars at lunchtime
November, 17 2014 Copenhagen Jérôme Houël Analysis of the deployment of EV in the Paris IDF region 13/20
ContextMobility analysis
Integration into the optimization module
ENTD 2008Study parametersMobility results
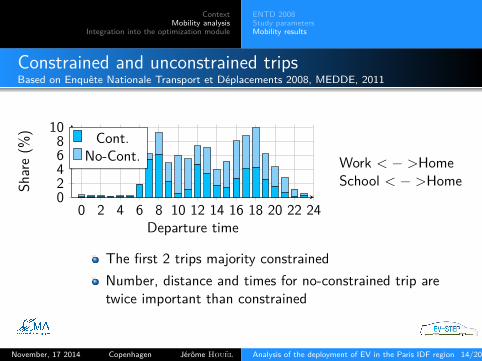
Constrained and unconstrained tripsBased on Enquête Nationale Transport et Déplacements 2008, MEDDE, 2011
0 2 4 6 8 10 12 14 16 18 20 22 2402468
10
Departure time
Share(%
) Cont.No-Cont. Work < − >Home
School < − >Home
The first 2 trips majority constrainedNumber, distance and times for no-constrained trip aretwice important than constrained
November, 17 2014 Copenhagen Jérôme Houël Analysis of the deployment of EV in the Paris IDF region 14/20
ContextMobility analysis
Integration into the optimization module
Effects of changing conditions on the load curveLoad impact of an EV fleet in kW/vehicleConclusionLe module optimisationPuissance appelée par véhicule
Agenda
1 Context
2 Mobility analysis
3 Integration into the optimization moduleEffects of changing conditions on the load curveLoad impact of an EV fleet in kW/vehicleConclusionLe module optimisationPuissance appelée par véhicule
November, 17 2014 Copenhagen Jérôme Houël Analysis of the deployment of EV in the Paris IDF region 15/20

ContextMobility analysis
Integration into the optimization module
Effects of changing conditions on the load curveLoad impact of an EV fleet in kW/vehicleConclusionLe module optimisationPuissance appelée par véhicule
Effects of changing conditions on the load curve
1 Geographical zonesI "IDF_ALL region"I "Paris"I "Petite couronne"I "Grande couronne"
2 Price signalsI time of the dayI average
3 Charging levelsI 8 AI 16 AI 32 AI 63 A
4 Preferential time of chargeI freeI supervised timing
5 V2G
6 BehavioralI SOC minI SOC maxI number of reload events
7 Vehicle typesI BEVI PHEV30I PHEV60
November, 17 2014 Copenhagen Jérôme Houël Analysis of the deployment of EV in the Paris IDF region 16/20
ContextMobility analysis
Integration into the optimization module
Effects of changing conditions on the load curveLoad impact of an EV fleet in kW/vehicleConclusionLe module optimisationPuissance appelée par véhicule
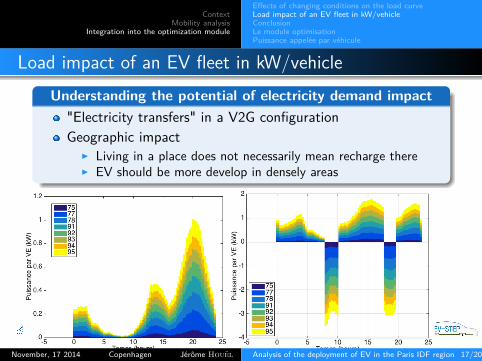
Load impact of an EV fleet in kW/vehicleUnderstanding the potential of electricity demand impact
"Electricity transfers" in a V2G configurationGeographic impact
I Living in a place does not necessarily mean recharge thereI EV should be more develop in densely areas
November, 17 2014 Copenhagen Jérôme Houël Analysis of the deployment of EV in the Paris IDF region 17/20
ContextMobility analysis
Integration into the optimization module
Effects of changing conditions on the load curveLoad impact of an EV fleet in kW/vehicleConclusionLe module optimisationPuissance appelée par véhicule
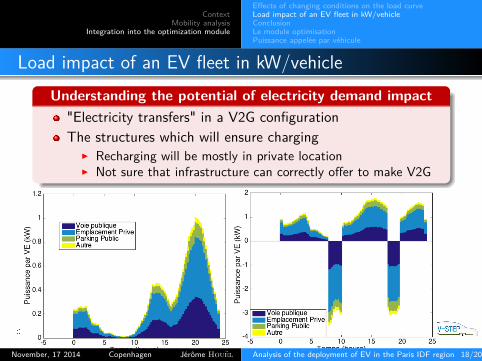
Load impact of an EV fleet in kW/vehicleUnderstanding the potential of electricity demand impact
"Electricity transfers" in a V2G configurationThe structures which will ensure charging
I Recharging will be mostly in private locationI Not sure that infrastructure can correctly offer to make V2G
November, 17 2014 Copenhagen Jérôme Houël Analysis of the deployment of EV in the Paris IDF region 18/20

ContextMobility analysis
Integration into the optimization module
Effects of changing conditions on the load curveLoad impact of an EV fleet in kW/vehicleConclusionLe module optimisationPuissance appelée par véhicule
Conclusion
ConclusionTools to evaluate variability in usage/charging conditions atlow time granularity are needed to complement deploymentscenarios for electric vehiclesOur load curve evaluation for the Paris Ile de France casestudy shows that fixed benchmarks curves can underestimatefuture impacts in both maximum power and time ofoccurrence
November, 17 2014 Copenhagen Jérôme Houël Analysis of the deployment of EV in the Paris IDF region 19/20
Model based analysis of the deployment of electricvehicle in the Paris Ile de France region
66TH Semi-annual IEA-ETSAP meeting17-21 November, 2014 - Copenhagen
Edi AssoumouJérôme Houël
Jean-Paul MarmoratThank you for your attention

ContextMobility analysis
Integration into the optimization module
Effects of changing conditions on the load curveLoad impact of an EV fleet in kW/vehicleConclusionLe module optimisationPuissance appelée par véhicule
Time between 2 tripsBased on Enquête Nationale Transport et Déplacements 2008, MEDDE, 2011
2 3 4 5 6 7 8 9 10111213140
100
200
300
Nb of trip
Tim
e(m
in)
To see if people would come tocharge their car330 min for those who do 2 trips, butwith a very important standarddeviationMore the drivers travel in the day,less time they have between 2 tripsFrom 8 trips per day, the timebetween two trips varies around 50min
Nb Share Time between Standardof trip % 2 trips (min) Deviation
2 44,8 334 783 12,8 196 634 19,5 161 415 6,9 123 376 6,1 108 287 3 95 288 1,6 67 239 0,4 55 2410 0,4 54 1611 0,1 38 2312 0,4 59 2213 0,2 47 1
ALL 100 226 94
November, 17 2014 Copenhagen Jérôme Houël Analysis of the deployment of EV in the Paris IDF region 21/20

ContextMobility analysis
Integration into the optimization module
Effects of changing conditions on the load curveLoad impact of an EV fleet in kW/vehicleConclusionLe module optimisationPuissance appelée par véhicule
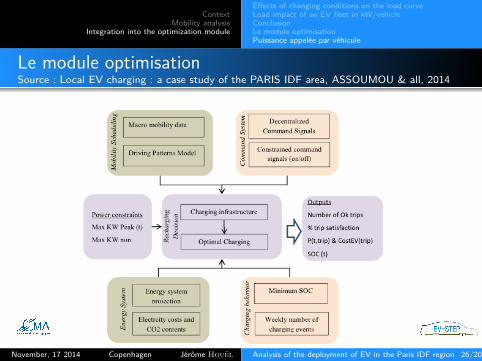
Le module optimisationSource : Local EV charging : a case study of the PARIS IDF area, ASSOUMOU & all, 2014
November, 17 2014 Copenhagen Jérôme Houël Analysis of the deployment of EV in the Paris IDF region 22/20
ContextMobility analysis
Integration into the optimization module
Effects of changing conditions on the load curveLoad impact of an EV fleet in kW/vehicleConclusionLe module optimisationPuissance appelée par véhicule
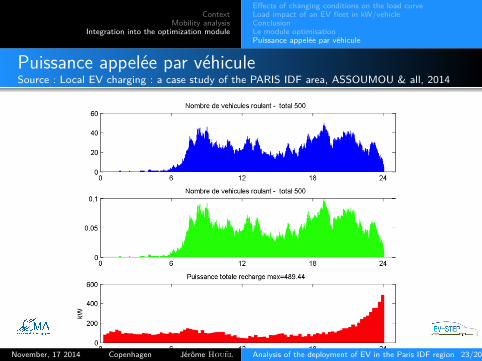
Puissance appelée par véhiculeSource : Local EV charging : a case study of the PARIS IDF area, ASSOUMOU & all, 2014
November, 17 2014 Copenhagen Jérôme Houël Analysis of the deployment of EV in the Paris IDF region 23/20
ContextMobility analysis
Integration into the optimization module
Effects of changing conditions on the load curveLoad impact of an EV fleet in kW/vehicleConclusionLe module optimisationPuissance appelée par véhicule
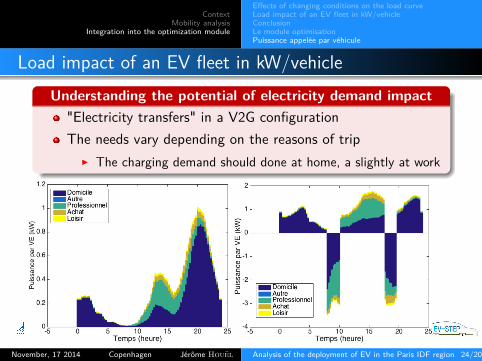
Load impact of an EV fleet in kW/vehicleUnderstanding the potential of electricity demand impact
"Electricity transfers" in a V2G configurationThe needs vary depending on the reasons of trip
I The charging demand should done at home, a slightly at work
November, 17 2014 Copenhagen Jérôme Houël Analysis of the deployment of EV in the Paris IDF region 24/20
ContextMobility analysis
Integration into the optimization module
Effects of changing conditions on the load curveLoad impact of an EV fleet in kW/vehicleConclusionLe module optimisationPuissance appelée par véhicule
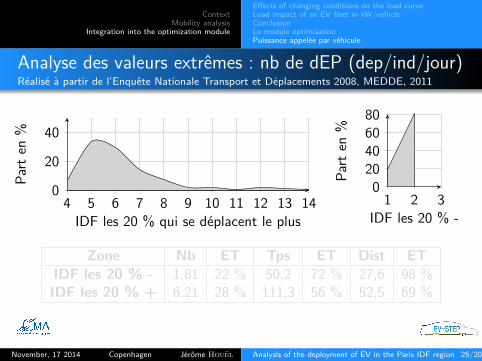
Analyse des valeurs extrêmes : nb de dEP (dep/ind/jour)Réalisé à partir de l’Enquête Nationale Transport et Déplacements 2008, MEDDE, 2011
4 5 6 7 8 9 10 11 12 13 140
20
40
IDF les 20 % qui se déplacent le plus
Part
en%
1 2 30
20406080
IDF les 20 % -
Part
en%
Zone Nb ET Tps ET Dist ETIDF les 20 % - 1,81 22 % 50,2 72 % 27,6 98 %IDF les 20 % + 6,21 28 % 111,3 56 % 52,5 69 %
November, 17 2014 Copenhagen Jérôme Houël Analysis of the deployment of EV in the Paris IDF region 25/20

ContextMobility analysis
Integration into the optimization module
Effects of changing conditions on the load curveLoad impact of an EV fleet in kW/vehicleConclusionLe module optimisationPuissance appelée par véhicule
Analyse des valeurs extrêmes : nb de dEP (dep/ind/jour)Réalisé à partir de l’Enquête Nationale Transport et Déplacements 2008, MEDDE, 2011
4 5 6 7 8 9 10 11 12 13 140
20
40
IDF les 20 % qui se déplacent le plus
Part
en%
1 2 30
20406080
IDF les 20 % -
Part
en%
Zone Nb ET Tps ET Dist ETIDF les 20 % - 1,81 22 % 50,2 72 % 27,6 98 %IDF les 20 % + 6,21 28 % 111,3 56 % 52,5 69 %
November, 17 2014 Copenhagen Jérôme Houël Analysis of the deployment of EV in the Paris IDF region 25/20
ContextMobility analysis
Integration into the optimization module
Effects of changing conditions on the load curveLoad impact of an EV fleet in kW/vehicleConclusionLe module optimisationPuissance appelée par véhicule
Le module optimisationSource : Local EV charging : a case study of the PARIS IDF area, ASSOUMOU & all, 2014
November, 17 2014 Copenhagen Jérôme Houël Analysis of the deployment of EV in the Paris IDF region 26/20