framing : the potential and prospects for renewable...
TRANSCRIPT

Working on a Proposition
Framing :
The potential and prospects
for renewable energy in South Africa
Richard Worthington - Climate & Energy Programme Manager
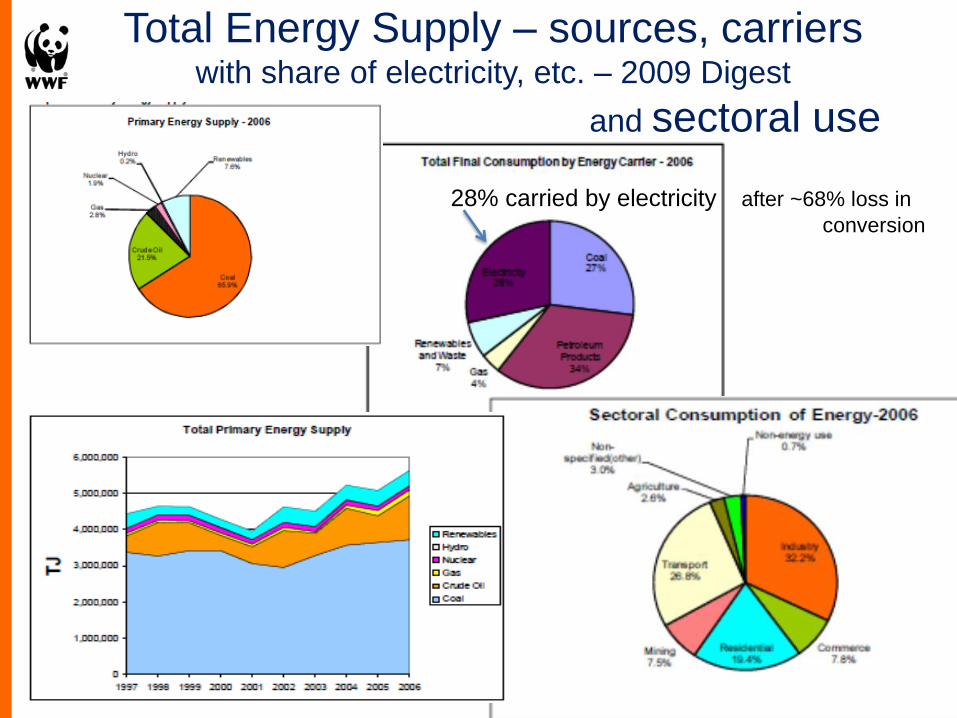
Total Energy Supply – sources, carriers with share of electricity, etc. – 2009 Digest
and sectoral use
28% carried by electricity after ~68% loss in
conversion

Electricity Consumption 2006
[ g r a p h I c ]
Choosing the energy
system we want What do we want? :
Access Affordable
Appropriate – clean and localised
Efficient (incl. economically efficient over time,
with policy continuity and pricing predictability
& requiring resource efficiency)
Reliable
Sufficient, incl. nationally, at scale,
Sustainable

to consider a renewable energy proposition
for South Africa, off grid and on, for optimal
social benefits and long term affordability .
with finance at scale
to deliver employment at scale
the scale appropriate for optimal localisation

Overview of what is being tabled
context
„the ask‟
illustrative build plans
( and impacts – some pending )
What is a proposition? 4 SA
Who will pay and how?

What is possible?
What you consider realistic depends on
your mind-set – the parameters and
framing of your questions. .
When is a just transition possible?
And for how much longer may it be within our grasp?

Context - 2008 incl. mandate from LTMS
Long Term Mitigation Scenarios
July 2008: Cabinet response to the climate challenge :
“…structurally transform the economy … to a climate-friendly path as part of a pro-growth, pro-development and pro-jobs strategy.”
.
November 2008 - WWF-SA:
Cheaper Electricity with Renewable Energy
- Costing a 2020 target for 15% renewable electricity in South Africa – Energy Research Centre (UCT) A. Marquand

SNAPP Sustainable National Accessible
Power Planning Tool
Demystifying the modelling of grid-based electricity supply
in South Africa Building on the 2008 research study showing how electricity could be cheaper
with 15% of supply sourced from renewable energy by 2020, WWF presented an
analysis of a high renewable energy scenario, compared to a fossil- and nuclear-
intensive scenario, using the SNAPP Tool.
Figure 4 – Percentage change from reference in average
cost of electricity for Cases 1A to 3A and nuclear efficiency

2010

Denial or scepticism
Resurrecting issues already rigorously addressed (e.g. IPCC) = denial
Assertion that renewable energy cannot / will not meet SA needs = denial
Two factually incorrect statements indicative of the
denial in the coal / electricity supply industry:
• “SA really has only 2 choices, coal and nuclear”
• “Coal is our most abundant /widely available energy
resource” -
If the total coal reserve of 1 298 000 PJ is used up in 200 years, as often
suggested, and this is compared to the total solar reserve potential over
200 years of 1 700 000 000 PJ, our coal reserves are 0.07% of our
solar potential over 200 years. (Peter Lukey, DEA) – 0.7% over 20 years
„Base load plant‟ is a misleading conceit – part of denialist narrative;
…base load demand is a system management challenge

What is possible? Are past trends a good measure of what is possible?
Climate Solutions 2 (2009) “The key constraint to meeting emissions levels is the speed
at which the economy can make the transformation to low-carbon resources, industries and practices. Today, only three out of 20 industries are moving sufficiently fast enough.”
“…the re-industrialisation process to commence immediately with growth rates of between 24% and 29% every year...” for key technologies
“A comprehensive plan for low-carbon industrial development is an integral part of the solution. Without this, economically disruptive “command-and-control” style government intervention will be necessary to focus industrial production on the climate change challenge.”

Optimising the generation and use of electricity has become a central and pressing
challenge for achieving sustainable access to energy services for all, particularly if we are to
avoid severely compromising the prospects of a global ecosystem conducive to human well-
being. Efficiency is key in all aspects, from decentralised services in remote areas
maximising local resource use, to the development of global networks of generation,
transport, storage and demand side management to enable the supply of energy-intensive
industries through the most rational resource use. Compelling communication of the vast potential
of integrated systems management and electronic technology deployment is imperative to inspire the
evolution of social organisation, economics and business dynamics towards optimal resource utilisation. .
Popular perception of what is possible is constrained by what is familiar and
established. Decision makers generally rely on advice from an establishment with vested interests in
avoiding transformative or disruptive change, such that the science of what is possible is marginalised
and optimal solutions are often deemed „unrealistic‟ and rendered „uneconomic‟. Propositions such as a
Vision of 100% Renewable Energy, as advanced in The Energy Report published by WWF in 2011, are
met with a mountain of doubt and inertia. Sometimes such a proposition provokes animosity, but more
often a kindly but sad shaking of the head that dismisses it as improbable. .
Future scenarios of optimal efficiency and more egalitarian use of our natural resources must certainly give rise to scepticism, considered from within our current situation and economic
conventions. Overcoming resistance or uncritical doubt requires a far broader understanding of best
available technologies and what innovation has to offer, both in social organisation as well as technology
deployment. Scepticism, applied to current arrangements as well as future prospects, is what will help us
understand the extensive challenges and constraints that must be overcome if we are to achieve
transformational change, rather than succumb to atrophy and entropy.

Coal costs more than carbon
Act now to protect South Africa‟s scarce
water resources from more coal pollution
NBI Roundtable COP17 19 March 2013 - 14
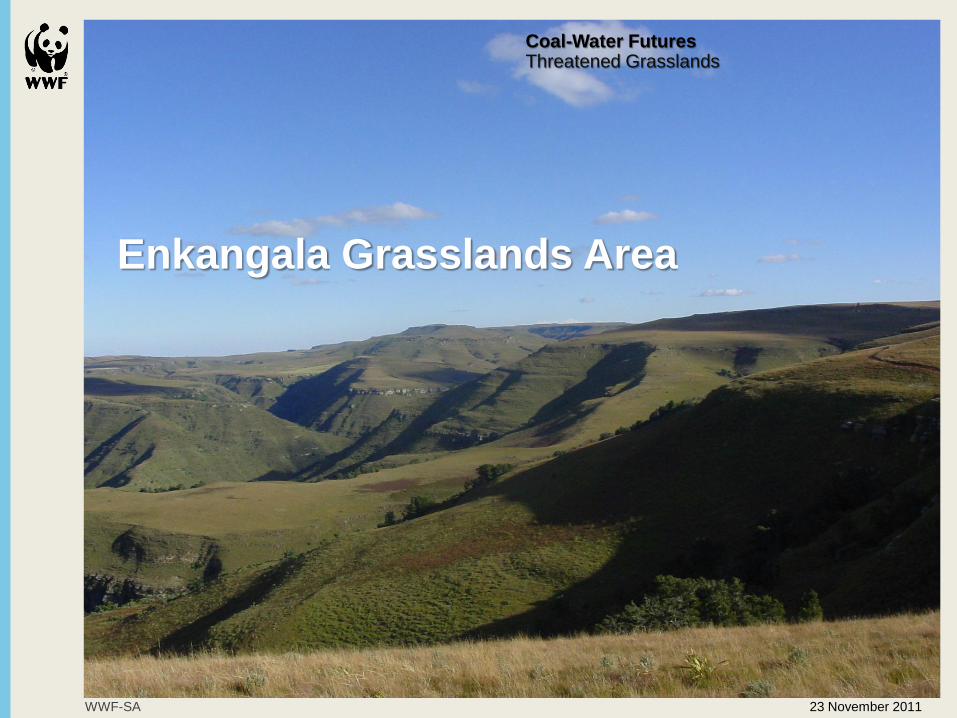
Coal-Water Futures Threatened Grasslands
WWF-SA 23 November 2011
Enkangala Grasslands Area

We cannot afford to lose
more catchments to coal
mining
Abandoned and
ownerless mines in
South Africa
5906
From abandonment of coal mines in
the Olifants until AMD began to
discharge into the Blesbokspruit
44 years
Threatened by
deteriorating water
quality in the Loskop
Irrigation area
Agricultural jobs
Estimated costs to the tax
payer to clean up current list
of abandoned mines
+R30 bill
Coal costs more than
carbon
Presentation to Company Name 17 August 2010 - 16
Photo: © Michel Roggo / WWF-Canon

Rather than being an add-on or afterthought,
the Department sees the need for water to
be mainstreamed and placed at the nucleus
of all planning decisions…”
Water for Growth and Development
Framework, DWAF 2009

What is „the ask‟ ?
Not in GW, or GWh,
but in social benefits .
What is a job-creating energy plan?
& is it also a „climate-safe‟ energy plan? .
What scale of planned deployment is ideal for localisation of
manufacturing?
What should be primary determinant of RE planning and
aggregate deployment, the pace and scale of production
and over-all development ambition ?

Jobs per $1 million invested Industry Direct Indirect Induced TOTAL
Solar 5.4 4.4 3.92 13.72
Biomass 7.4 5.0 4.96 17.36
Smart Grid 4.3 4.6 3.56 12.46
Coal 1.9 3.0 1.96 6.86
Oil and gas 0.8 2.9 1.48 5.18
Nuclear 1.2 1.8 1.2 4.2
Source: Heidi Garrett-Peltier and Robert Pollin,
University of Massachusetts Political Economy and Research Institute.
Note: Multipliers derived using IMPLAN 2.0 with 2007 data. Infrastructure multipliers and assumptions are presented in
"How Infrastructure Investments Support the U.S. Economy: Employment, Productivity and Growth," Political Economy
Research Institute, January 2009,
http://www.peri.umass.edu/236/hash/efc9f7456a/publication/333/
In SA Context : JOBS

Looks like the nuclear industry has managed to
become more labour-intensive, even as its share
of global supply declines

Renewable Investment Growth REN 21,
IEA 2010
Key Findings 2012

The Energy Report
Global wind power growth
Source: REN 21, 2012
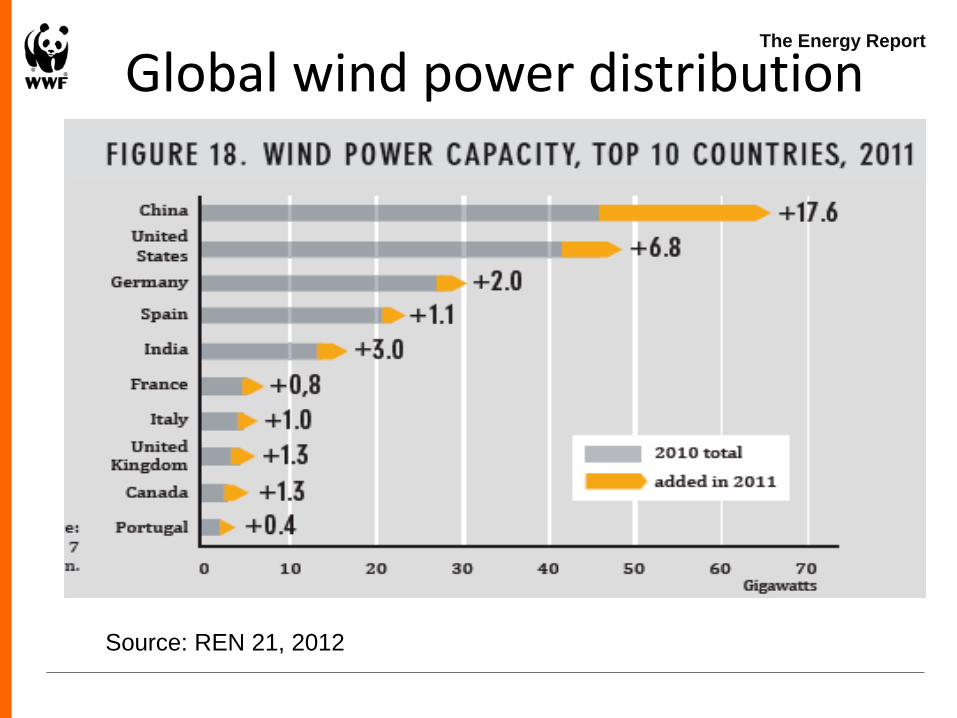
The Energy Report
Global wind power distribution
Source: REN 21, 2012

Wind power Growth in 2012 II
The Energy Report
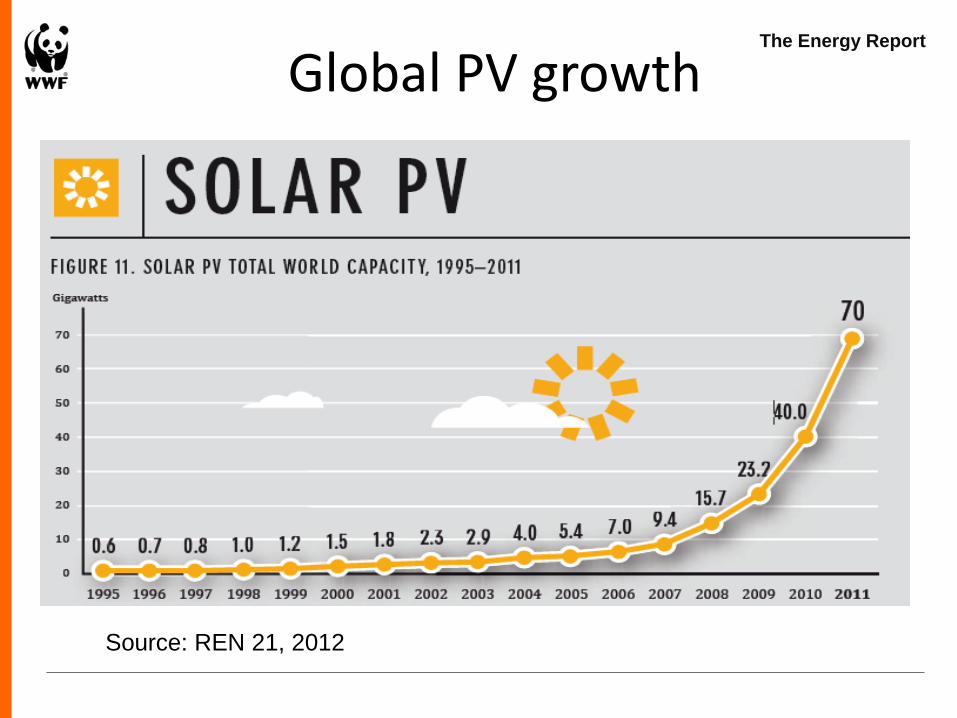
Global PV growth
Source: REN 21, 2012

The Energy Report
Global CSP growth
Source: REN 21, 2012

Stephan Singer (WWF EPO):
• there is hope – renewable implementation and investments grow strongly
• However, not strong enough to curb growth in fossil fuels
• 2011 investments in oil and gas infrastructure alone were about 3 times those of investments in RES
• But - jobs in RES worldwide are almost 10 times higher than those in the six largest fossil fuel companies (Exxon, BP, Chevron, Shell, Conoco, Gazprom) together

Jobs in RES 2011 (+20% in one year)
Source: REN 21, 2012

Carbon budgeting
The term carbon budget (CB) may be understood as an hypothetical allocation of a specified quantity of emissions of greenhouse gases (as listed in the UNFCCC) over a set period of time, to an identified sector, sub-sector, activity or entity.
Carbon budgeting should seek to discover the optimal allocation of emissions allowances. It should take account of the likely consequences of over-all distribution of the total resource, as well as of exceeding the proposed allocations, but it does not require setting an absolute limit on this total; indeed it could be undertaken purely in terms of proportional or percentage allocation of whole of unspecified size. It could be approached starting with:
Hypothetical Allocation of National Emissions (HANE)

Comparing IRP 2010 (policy-adjusted scenario)
with a high renewable energy scenario cost increase ~10% with emissions reduction ~27%
Ref Case: IRP 2010 45% RE; Slow Kusile, as replacement for early coal retirement; no nuclear
0
50
100
150
200
250
300
350
0
0.05
0.1
0.15
0.2
0.25
0.3
Average cost (R/kWh) - units: R / kWh
GHG emissions - units: Mt CO2-eq
0
50
100
150
200
250
300
350
0
0.05
0.1
0.15
0.2
0.25
0.3
Average cost (R/kWh) - units: R /kWh
PRESENTATION TO SAFCEI ENERGY WORKSHOP OCTOBER 2012

Comparing IRP 2010 with 37% RE cost increase ~3% with emissions reduction ~15%
Ref Case: IRP 2010 37% re; 3 units Kusile; no nuke
0
50
100
150
200
250
300
350
0
0.05
0.1
0.15
0.2
0.25
0.3
2010 2012 2014 2016 2018 2020 2022 2024 2026 2028 2030
Average cost (R/kWh) - units: R / kWh
GHG emissions - units: Mt CO2-eq
0
50
100
150
200
250
300
350
0
0.05
0.1
0.15
0.2
0.25
0.3
2010 2012 2014 2016 2018 2020 2022 2024 2026 2028 2030
Average cost (R/kWh) - units: R / kWh
GHG emissions - units: Mt CO2-eq
PRESENTATION TO SAFCEI ENERGY WORKSHOP OCTOBER 2012

IRP2010 vs. 37% RE with half Kusile Reference annual investment requirement
Scenario annual investment requirement
0
10000
20000
30000
40000
50000
60000
70000
80000
2005 2007 2009 2011 2013 2015 2017 2019 2021 2023 2025 2027 2029
R m
illio
n
Annual investment requirement
Existing coal Large Existing coal Small OCGT liquid fuels
PWR nuclear Hydro Landfill gas
Biomass Supercritical coal Existing imported hydro
Wind 29% availability Solar CSP Solar PV
OCGT nat gas CCGT Fluidised Bed Combustion Coal
Coal imported Hydro imported new CCGT gas imported
IGCC Pumped storage
0
10000
20000
30000
40000
50000
60000
70000
80000
90000
100000
2005 2007 2009 2011 2013 2015 2017 2019 2021 2023 2025 2027 2029R
mill
ion
Annual investment requirement
Existing coal Large Existing coal Small
OCGT liquid fuels PWR nuclear
Hydro Landfill gas
Biomass Supercritical coal
Existing imported hydro Wind 29% availability
Solar CSP Solar PV
OCGT nat gas CCGT
Fluidised Bed Combustion Coal Coal imported
Hydro imported new CCGT gas imported
IGCC Pumped storage
PRESENTATION TO SAFCEI ENERGY WORKSHOP OCTOBER 2012

Reference & Scenario electricity system costs and average electricity cost
Ref Case – IRP2010 37% RE; half Kusile; Ext’d DSM
0
0.05
0.1
0.15
0.2
0.25
0.3
0.35
0.4
0
20000
40000
60000
80000
100000
120000
140000
160000
180000
2005 2008 2011 2014 2017 2020 2023 2026 2029R
and
s /
kWh
R m
illio
n
Existing coal Large Existing coal Small
OCGT liquid fuels PWR nuclear
Hydro Landfill gas
Biomass Supercritical coal
Existing imported hydro Wind 29% availability
Solar CSP Solar PV
OCGT nat gas CCGT
Fluidised Bed Combustion Coal Coal imported
Hydro imported new CCGT gas imported
IGCC Pumped storage
carbon tax Average electricity cost
Average an elec cost with carbon tax
0
0.05
0.1
0.15
0.2
0.25
0.3
0.35
0.4
0
20000
40000
60000
80000
100000
120000
140000
160000
180000
2005 2008 2011 2014 2017 2020 2023 2026 2029
R m
illio
n
carbon tax Pumped storage
IGCC CCGT gas imported
Hydro imported new Coal imported
Fluidised Bed Combustion Coal CCGT
OCGT nat gas Solar PV
Solar CSP Wind 29% availability
Existing imported hydro Supercritical coal
Biomass Landfill gas
Hydro PWR nuclear
OCGT liquid fuels Existing coal Small
Existing coal Large Average annual electricity cost (R/kWh)
Average an elec cost with carbon tax
PRESENTATION TO SAFCEI ENERGY WORKSHOP OCTOBER 2012

The Energy
Report
Pathway to a fully
sustainable
global energy
system by 2050
3 February 2011
The Energy Report

The Energy Report 100% Renewable Energy by 2050
A world powered by 100%
renewable, sustainable
energy by mid-century
In all of our hands - policy-
makers, investors, corporate
leaders, communities and
individuals.
Stop fossil fuel pollution;
save money; address
climate change; improve
health; no nuclear risks;
new jobs; innovation;
protect nature
Extensive electrification of
transport; enhanced energy
conservation; smart grids;
sustainable energy for all
Conserving energy & reducing demand; electrification;
equity; investment; land/water/sea-use implications;
governance; lifestyle choices - behaviour changes &
public attitudes; innovation and R&D
A VISION
A SCENARIO
SOLUTIONS
CHALLENGES
BENEFITS
3 February 2011 - 72

Access Some of the greatest social benefits of renewable energy
technology use are found beyond grid-based electricity supply, in
decentralised and community-based development
Electricity – on grid
This account of the proposition does not detail the knock-on benefits for local
development and ensuring sustainable access to locally affordable energy
services that robust renewable energy industries can deliver, though such co-
benefits are of far greater valuable for addressing poverty and inequality than
the grid-supply proposition and are being taken up in other work – including the WWF South Africa Energy Access Initiative.
Localisation is important not just at national level, but at local level also the
benefits through local resource use, building value from the bottom up…
community-based project development will benefit from economies of scale
while arriving at optimal resource efficiency…
…this is elaborated in Smart Energy Planning – to follow

The Scenario – Key Elements The Ecofys Scenario
SOURCE: Ecofys Energy Scenario, 2010
3 February 2011 - 31
The Energy Report

Electrification is Key The Ecofys Scenario
0
100
200
300
400
500
2000 2010 2020 2030 2040 2050
EJ/a
0
100
200
300
400
500
2000 2010 2020 2030 2040 2050
EJ/
a
0
100
200
300
400
500
2000 2010 2020 2030 2040 2050
EJ/
a
0
100
200
300
400
500
2000 2010 2020 2030
EJ/
a
Other
Electricity
All values in final energy; *approximation
The Energy
Report
Shell
Blueprints*
Advanced
[R]evolution „10
WEO „09
Reference
SOURCE: Ecofys Energy Scenario, 2010
3 February 2011 - 55
The Energy Report
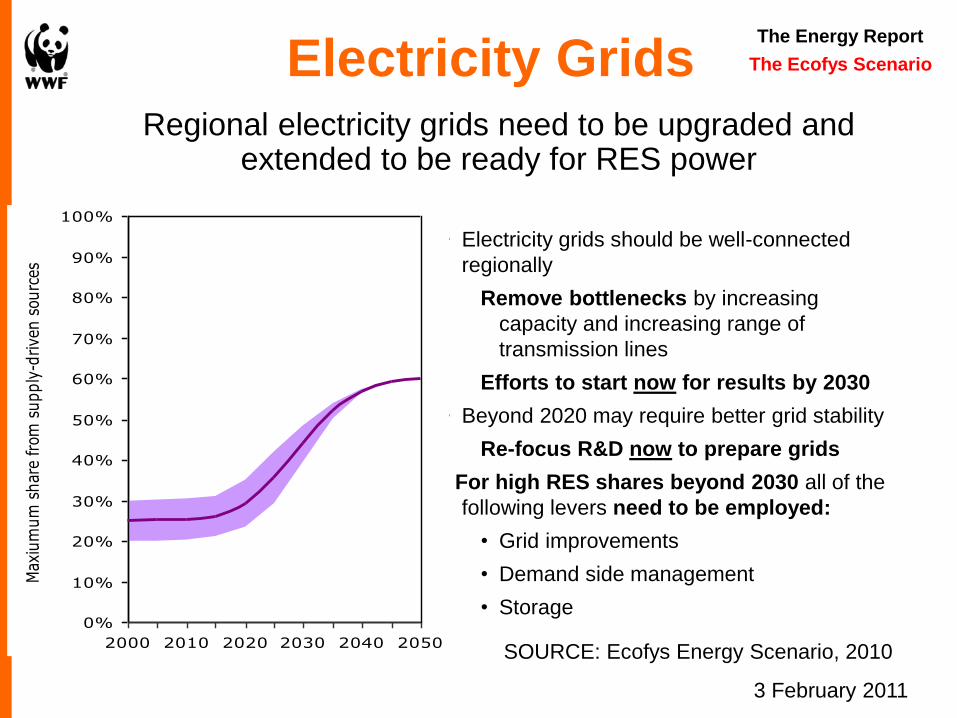
Electricity Grids Regional electricity grids need to be upgraded and
extended to be ready for RES power
• Electricity grids should be well-connected
regionally
Remove bottlenecks by increasing
capacity and increasing range of
transmission lines
Efforts to start now for results by 2030
• Beyond 2020 may require better grid stability
Re-focus R&D now to prepare grids
For high RES shares beyond 2030 all of the
following levers need to be employed:
• Grid improvements
• Demand side management
• Storage
Limit placed on
supply-driven
electricity: PV,
Wave and Wind
The Ecofys Scenario
0%
10%
20%
30%
40%
50%
60%
70%
80%
90%
100%
2000 2010 2020 2030 2040 2050
Max
ium
um
shar
e fr
om s
upply
-drive
n s
ourc
es
SOURCE: Ecofys Energy Scenario, 2010
3 February 2011
The Energy Report

Total Investments and Savings Total global annual cost results for Energy Scenario
The Ecofys Scenario
SOURCE: Ecofys Energy Scenario, 2010
The Energy Report
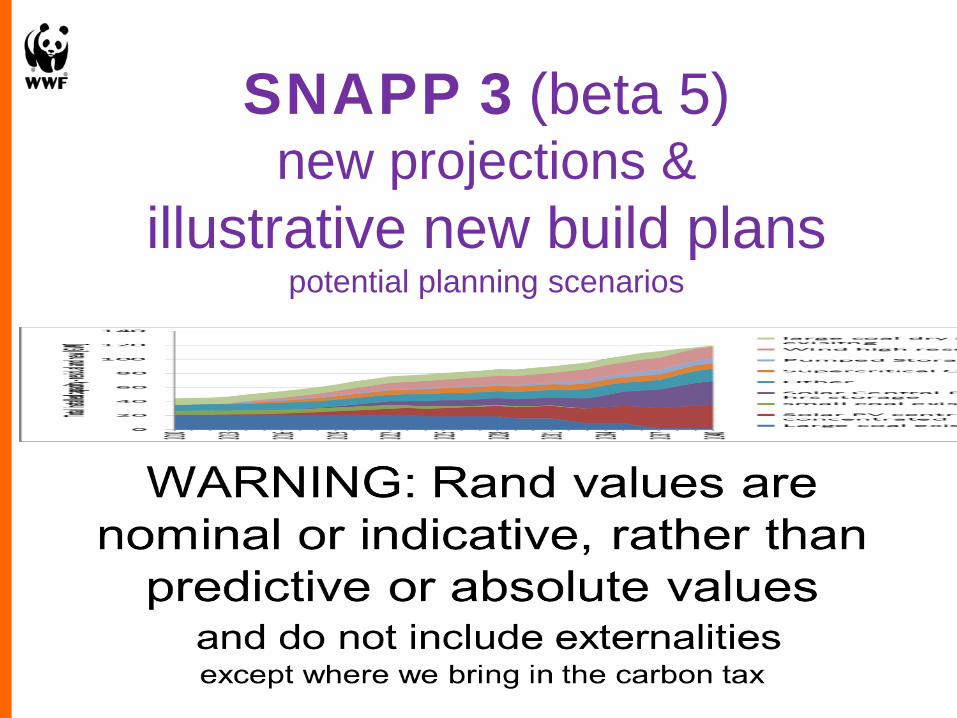
SNAPP 3 (beta 5) new projections &
illustrative new build plans potential planning scenarios

Demand 2 Projections:
Govt plans: i.e. IRP2010 - System Operator‟s „Medium Outlook‟ + DSM – extrapolated to 2040
CSIR Moderate with Moderate DSM /„Tight version of Smart Track‟: EGI projection
Supply Reference Case (IRP2010 extrapolated to 2040) plus 3 approaches:
Strong Change – grow RE as rapidly as reasonable with no „new‟ coal, Kusile gradual start-up and
a little early coal retirement ( CHECK – roughly 2 plants close 2 years early); no new nuclear;
RE and Gas – grow RE rapidly early and bring in gas at scale from about 2030, with no „new‟ coal,
Kusile gradual start-up and a little early coal retirement; no new nuclear;
Gentle / slow RE, with new nuclear build [at „current‟ cost of $6 000/kW, start-up 2025],
Kusile on schedule; little more coal and no early retirement
Over-supply / over-estimated demand? Lack of EE & DSM vs stronger GDP growth
and/or
EE & DSM with electrification (growing electricity share of total energy supply) .
In other words strong efficiency and demand side management efforts to moderate demand are off-set
by changing energy carrier e.g. electrification of transport, hospital boilers and/or strong GDP growth…

Two demand projections: ‘IRP Extended’ and CSIR Mod+DSM
Diff of Moderate and Extended DSM

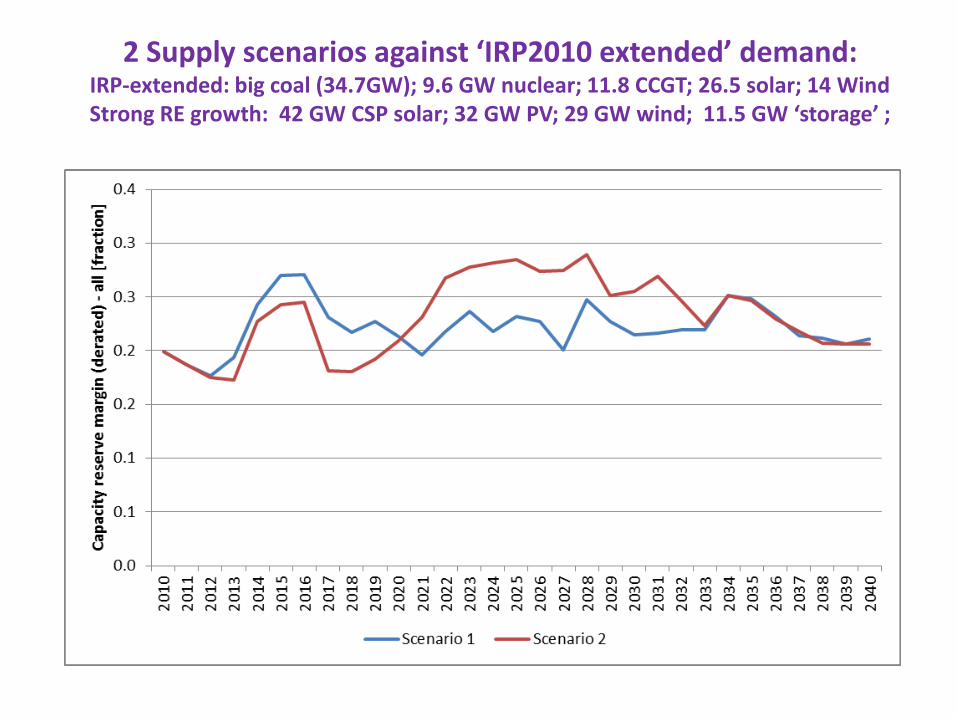
2 Supply scenarios against ‘IRP2010 extended’ demand: IRP-extended: big coal (34.7GW); 9.6 GW nuclear; 11.8 CCGT; 26.5 solar; 14 Wind Strong RE growth: 42 GW CSP solar; 32 GW PV; 29 GW wind; 11.5 GW ‘storage’ ;
Reference Case: ‘Govt plans’
Strong RE Strong RE Installed Capacity

2 Supply scenarios against ‘IRP2010 extended’ demand: IRP-extended: big coal (34.7GW); 9.6 GW nuclear; 11.8 CCGT; 26.5 solar; 14 Wind Strong RE growth: 42 GW CSP solar; 32 GW PV; 29 GW wind; 11.5 GW ‘storage’ ;
Reference Case: ‘Govt plans’
Strong RE Capital Cost

2 Supply scenarios against ‘IRP2010 extended’ demand: Share of RE & Share of coal
Coal share
RE share of supply
2 Supply scenarios against ‘IRP2010 extended’ demand: IRP-extended: big coal (34.7GW); 9.6 GW nuclear; 11.8 CCGT; 26.5 solar; 14 Wind Strong RE growth: 42 GW CSP solar; 32 GW PV; 29 GW wind; 11.5 GW ‘storage’ ;

2 Supply scenarios against ‘IRP2010 extended’ demand: IRP-extended: big coal (34.7GW); 9.6 GW nuclear; 11.8 CCGT; 26.5 solar; 14 Wind Strong RE growth: 42 GW CSP solar; 32 GW PV; 29 GW wind; 11.5 GW ‘storage’ ;
Greenhouse Gas Emissions

2 Supply scenarios against ‘IRP2010 extended’ demand: IRP-extended: big coal (34.7GW); 9.6 GW nuclear; 11.8 CCGT; 26.5 solar; 14 Wind Strong RE growth: 42 GW CSP solar; 32 GW PV; 29 GW wind; 11.5 GW ‘storage’ ;
Average cost per kWh
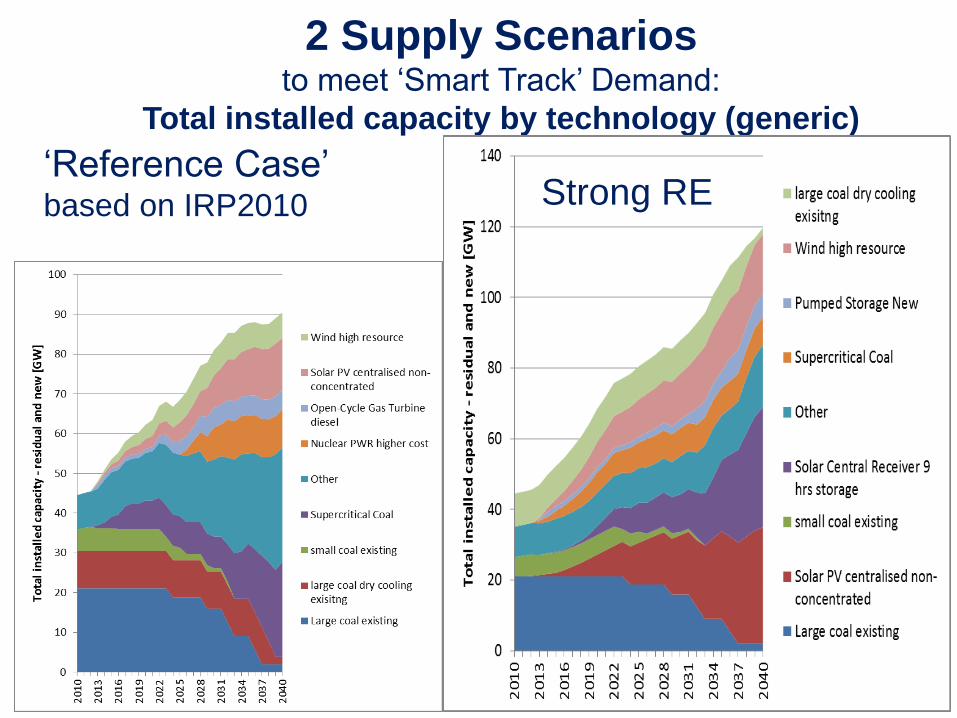
2 Supply Scenarios to meet „Smart Track‟ Demand:
Total installed capacity by technology (generic)
„Reference Case‟ based on IRP2010 Strong RE

2 Supply Scenarios to meet „Smart Track‟ Demand:
Total cost of supply (nuclear at $6000/W): – R50 – 350 billion
„Reference Case‟ based on IRP2010
Strong RE

2 Supply Scenarios to meet „Smart Track‟ Demand:
Share of renewable energy and coal
illustrative
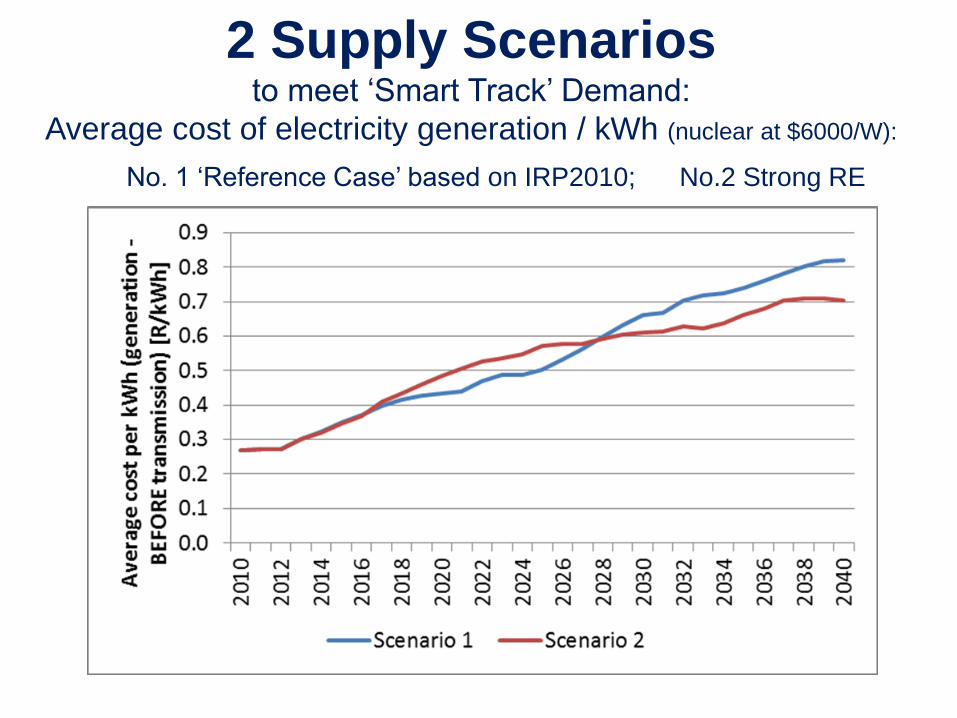
2 Supply Scenarios to meet „Smart Track‟ Demand:
Average cost of electricity generation / kWh (nuclear at $6000/W):
No. 1 „Reference Case‟ based on IRP2010; No.2 Strong RE
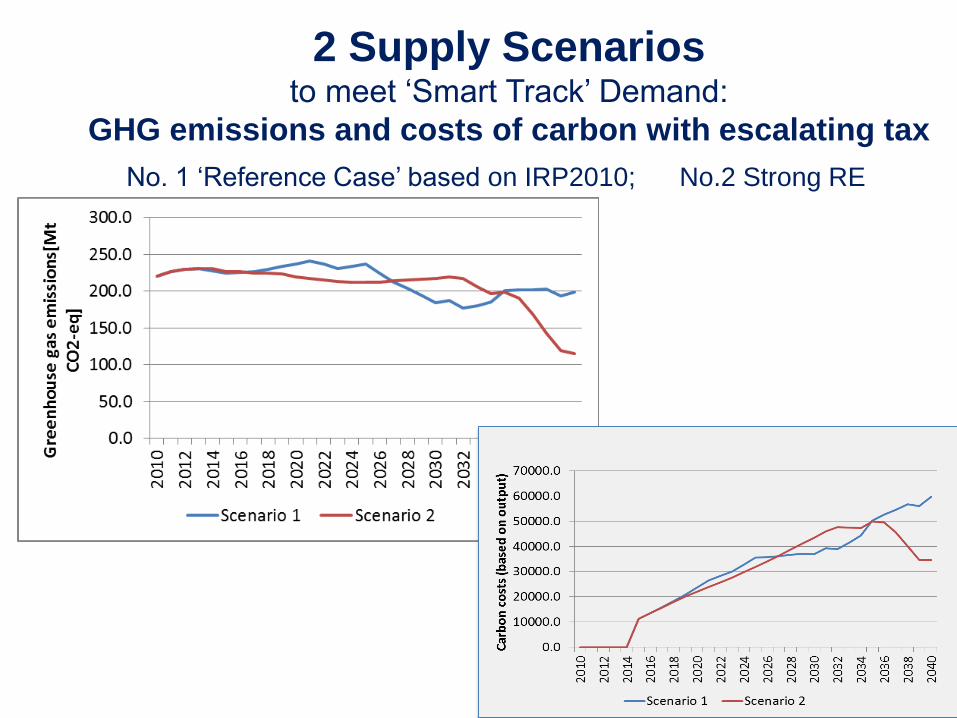
2 Supply Scenarios to meet „Smart Track‟ Demand:
GHG emissions and costs of carbon with escalating tax
No. 1 „Reference Case‟ based on IRP2010; No.2 Strong RE


Presentation title can go here
Secondary information
XX-XX Month, Year
Additional information can run
Underneath if neccessary
Topic can go here
Some ideas…
© E
dw
ard
Pa
rke
r / W
WF
-Can
on

Common thread in draft proposition for RE
and Smart Electricity Planning is an orientation to: .
Planning for success
• Success in energy conservation, efficient use and system
and demand side management;
• Success in developing local manufacturing for RETs and
supply-side system management, as well as storage
(batteries and fuel cells; micro-power);
• Success in developing a smart grid and use interfacing;
• Success in achieving universal access to modern energy,
incl. transition from unsustainable and harmful fuel use
(~8% „traditional‟ biomass) to efficient and healthy utilisation
of local energy resources

Programmatic approach
REBID approach not adequate or sufficient – not an application
of feed-in tariffs; precludes most economies of scale
for scaling up with localisation .
Is there space for new players in key materials production, e.g.
glass and reflective materials…
( We have a state-owned mining company )
Would we benefit from a state-owned RE company?
Will Sasol become a big player in CSP? How SA is Sasol?
Are national borders appropriate parameters or barriers for
assessing success in renewable energy development?
Can SA electricity supply industry be saved from Eskom?
– access to the wires be delivered from Eskom control?
Is regulator too constrained (captured) to act in public interest?

Finance
Patient capital
Conflating competitiveness with short term gain
/ return on capital
Just as efficiency conflated with rate of return
R500 billion dormant in private sector?

Saliem Fakir
Head – Living Planet Unit
Manisha Gulati
Energy Economist
Carbon Tax in South Africa
May 18, 2012

SCRAP the CAP On renewable energy
imposed by IRP 2010
Seize Your Power
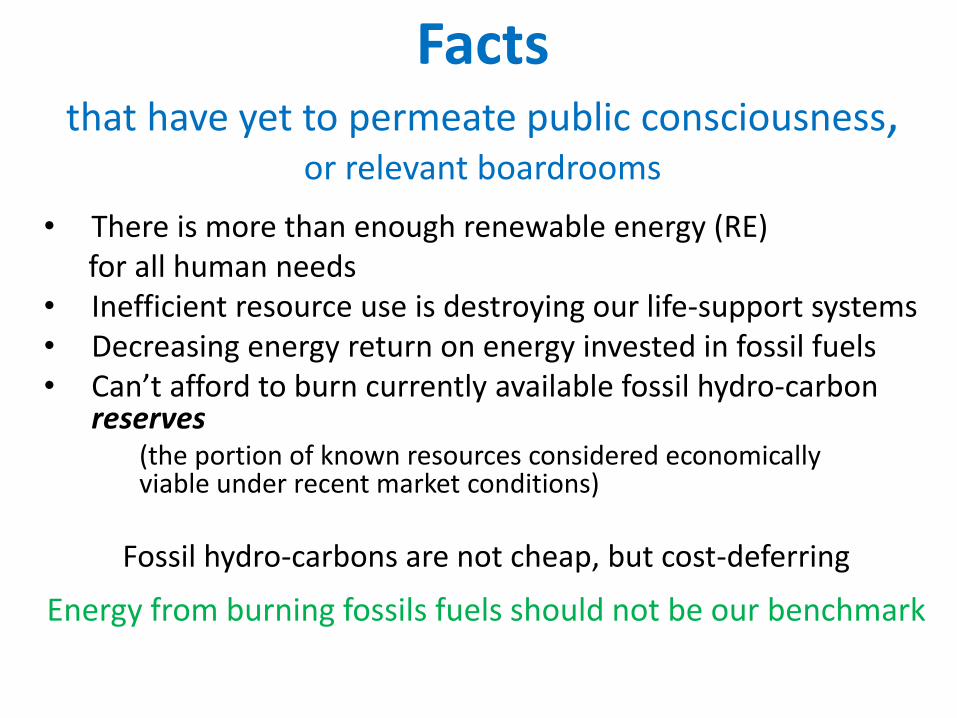
Facts
that have yet to permeate public consciousness, or relevant boardrooms
• There is more than enough renewable energy (RE) for all human needs • Inefficient resource use is destroying our life-support systems • Decreasing energy return on energy invested in fossil fuels • Can’t afford to burn currently available fossil hydro-carbon
reserves (the portion of known resources considered economically viable under recent market conditions)
Fossil hydro-carbons are not cheap, but cost-deferring
Energy from burning fossils fuels should not be our benchmark
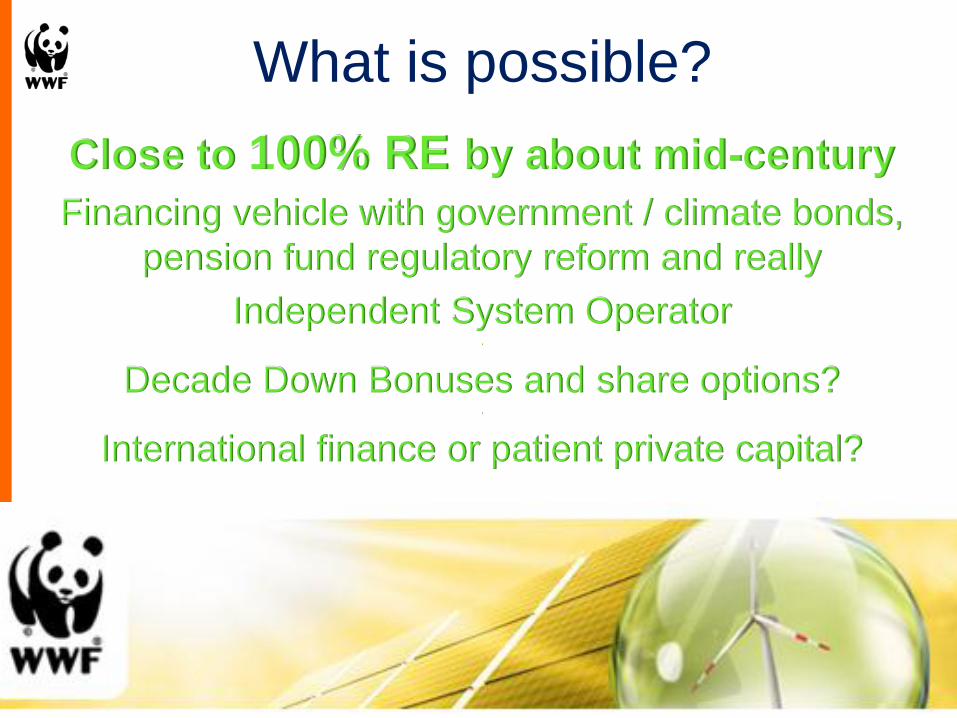
What is possible?
Close to 100% RE by about mid-century
Financing vehicle with government / climate bonds,
pension fund regulatory reform and really
Independent System Operator .
Decade Down Bonuses and share options? .
International finance or patient private capital?
Seize Your Power
Thank you www.panda.org
© 2010, WWF. All photographs used in this presentation are copyright protected and courtesy of the WWF-Canon Global Photo Network and the respective photographers.
WWF Mission ©
Mu
rat
Se
lam
/ W
WF
Nep
al
19 March 2013 - 66
To stop the degradation of the planets natural environment and to build a future in which humans live in harmony with nature.

Source: OPEC Secretariate 2011, BP 2011, IEA 2011, IPCC 2007
The global GHG budget (400 ppm) requires retiring about 60% of all known conventional fossil fuel recoverable reserves until 2050 (if CCS is excluded – with CCS, perhaps use 50%? 60%?)
Gt CO2e
GAP
2010 - 2050
?

MARKETS NEED ALIGNING WITH
CLIMATE POLICY OBJECTIVES
IEA World
Energy
Outlook
Scenarios
Markets not
following
required
pathway 1,000
2,000
3,000
4,000
5,000
6,000
1965
1970
1975
1980
1985
1990
1995
2000
2005
2010
2015
2020
2025
2030
2035
Mtoe 450ppm Current po licy New Policies

IEA RECOGNISES THE CARBON
BUBBLE:
LOCK-IN OR STRANDED ASSETS?
745 GtCO2
Proven coal, oil & gas reserves
owned by listed companies
2860 GtCO2
Total proven coal, oil and gas reserves
“without a significant deployment of CCS, more than TWO THIRDS
of current proven fossil-fuel reserves cannot be commercialised in a 2 °C world before 2050.”
884 GtCO2 2012 -50 budget for (50% chance) of 2 degrees
IEA (Nov 2012)
World Energy
Outlook

Some questions…
• What is the best deployment of
the limited emissions space
left to achieve South Africa‟s
development needs?
• What monitoring will help us to
ensure that we are on a
suitable emissions trajectory?
• What are the areas of
opportunity for both emissions
reduction outcomes and
development outcomes?
• What new industrial activities
or manufacturing should we
anticipate in South Africa? • What sectors or new activities
or processes are likely, globally
or regionally, to require
substantial carbon allocation in
future?
“Industry,
manufacturing etc.” Breakaway
NCCRP Implementation Conference 21 November 2012

SA RESERVES EXCEED CARBON BUDGET
16.4 = LTMS Required
by Science budget

EROEI of electricity generation
by Jamie Bull
Technology Average EROEI Average EIRR Average lifespan Number found
Coal no CCS 5.5 17% 31 11
Coal w. CCS 1.5 8% 23 2
Solar thermal elec. 9.9 40% 25 7
Gas no CCS 3.5 11% 32 5
Gas w. CCS 2.2 13% 23 2
Nuclear 10.9 36% 29 50
PV 8.3 34% 24 46
Tidal range 115.9 97% 120 1
Tidal stream 14.9 74% 20 2
Wind 25.0 125% 21 108
Wave 12.0 60% 20 2