fragments of the city: stanfordʹs digital forma urbis...
TRANSCRIPT

Draft - To appear in the Proceedings of the Third Williams Symposium on Classical Architecture, Journal of Roman Archaeology suppl., 2005
Fragments of the City: Stanfordʹs Digital Forma Urbis Romae Project*
David Koller, Jennifer Trimble, Tina Najbjerg, Natasha Gelfand, Marc Levoy
Introduction Rome at its height was the capital of the largest of the ancient empires; with a population estimated at
one million between c.100 BCE and 200 CE, it was also the largest city the world had yet seen. Understanding this megalopolis‐‐how it grew so large and why, how it sustained itself, what life was like there in light of major historical developments‐‐is an issue of major importance for historians and archaeologists. A key source of evidence with which to tackle these questions is the Severan Marble Plan of Rome, or Forma Urbis Romae. This enormous map, measuring c.18 x 13 meters (c.60 x 43 feet), constructed between 203‐211 CE, was carved onto 150 marble slabs installed on a wall of an aula of the Templum Pacis. It depicted, in astonishing detail, the ground plan of every architectural feature in the ancient city, from temple complexes and entertainment buildings to aqueducts, warehouses, and elite residences to small shops, tiny rooms, and even internal staircases. The map provides information about the city in the early 3rd c. CE not obtainable in any other way, depicting the city’s lesser‐known neighborhoods as well as its famous monuments, its back alleys as well as its major streets, its commercial infrastructure and its religious life. The Plan tells us about ancient Roman ideas of the city, ideologies of graphic representation, the layout of the city and movement through its streets, the interactions of monumental, commercial and residential space, the formation and microfabric of neighborhoods, and practices of mapping and surveying. The importance of the Marble Plan for understanding the imperial capital is unparalleled.
Unfortunately, only approximately 10 percent of the map survives, broken into 1,186 pieces.1 Since its rediscovery in 1562, scholars have focused on joining the fragments and reconstructing this great monument, but this is a very difficult puzzle to work with. Its surviving fragments are numerous but the map is drastically incomplete; many fragments are huge and heavy, while others are so small that their carved surfaces hardly provide any identifiable information. The incised features can be difficult to interpret and to relate to the archaeological record on the ground, and the fundamental publications that
* Abbreviations employed in this article: AG 1980 E. Rodríguez‐Almeida, Forma Urbis Marmorea. Aggiornamento Generale 1980 (Rome 1981) PM 1960 G. Carettoni, A. Colini, L. Cozza, and G. Gatti (eds.) , La pianta marmorea di Roma antica. Forma urbis
Romae (Rome 1960) Reynolds 1996 Reynolds, D. Forma Urbis Romae: The Severan Marble Plan and the urban form of ancient Rome (Diss.
University of Michigan 1996) 1 Note that this number is inexact. Some fragments have been cemented together in modern times, not all pieces may
have belonged to the map itself, and the number does not include the most recently discovered fragments.

help guide this effort are normally found only in specialist research settings.2 As a result, the work of identifying and interpreting pieces of the Plan has been painstaking and slow; moreover, it has necessarily focused on the most identifiable public monuments rather than on the urban fabric as a whole. It also means that this difficult monument is little known outside the community of specialists who work on Roman topography.
In response to these twin challenges of fragmentation and accessibility, and under the aegis of the Sovraintendenza ai Beni Culturali del Comune di Roma, Stanfordʹs Digital Forma Urbis Romae Project has been bringing digital technologies to bear on the map. A collaboration between computer scientists and archaeologists, the Project has had two primary goals: first, to match and locate fragments in order to reconstruct the map, and second, to make this monument publicly accessible through an on‐line, fully searchable database of fragments and information.3 This Project represents the first computer‐aided attempt to reconstruct the surviving portions of the Marble Plan; an exciting corollary of the digital data and its organization is the possibility of doing new kinds of archaeological research.
In this article, we summarize the Project’s work since it began in 1999 and discuss its implications for representing and imaging Rome. First, we digitized the shape and surface of every known fragment of the Marble Plan using laser range scanners and digital color cameras; the raw data collected consists of 8 billion polygons and 6 thousand color images, occupying 40 gigabytes. These range and color data have been assembled into a set of 3D computer models and high‐resolution photographs ‐ one for each of the 1,186 marble fragments. Second, this data has served in the development of fragment matching algorithms; to date, these have resulted in over a dozen highly probable, new matches. Third, we have gathered the Project’s 3D models and color photographs into a relational database and supported them with archaeological documentation and an up‐to‐date scholarly apparatus for each fragment. This database is intended to be a public, web‐based, research and study tool for scholars, students and interested members of the general public alike; as of this writing, 400 of the surviving fragments are publicly available, and the full database is scheduled for release in 2005. Fourth, these digital and archaeological data, and their availability in a hypertext format, have the potential to broaden the scope and type of research done on this ancient map by facilitating a range of typological, representational and urbanistic analyses of the map, some of which are proposed here. In these several ways, we hope that this Project will contribute to new ways of imaging Rome. Digitizing the fragments and building 3D models
Digitizing the fragments of the Marble Plan involved capturing their shape with 3D scanners, imaging their surface information with a digital camera, and developing software for processing the resulting data.
A number of technologies exist for digitizing the shape of three‐dimensional objects. Non‐contact technologies include photogrammetry, structured‐light triangulation, time‐of‐flight rangefinding, and interferometry. Among these, we chose laser‐stripe triangulation because it offered the best combination of accuracy, working volume, reliability, and portability. To accelerate the digitization process, we used
2 The two fundamental publications on the plan are G. Carettoni, A. Colini, L. Cozza, and G. Gatti (eds.), La pianta marmorea di Roma antica. Forma urbis Romae (Rome 1960) (henceforth PM 1960) and E. Rodríguez‐Almeida, Forma Urbis Marmorea. Aggiornamento Generale 1980 (Rome 1981) (henceforth AG 1980). Only 400 copies of PM 1960 were printed. 3 The Project website is at http://formaurbis.stanford.edu.
2

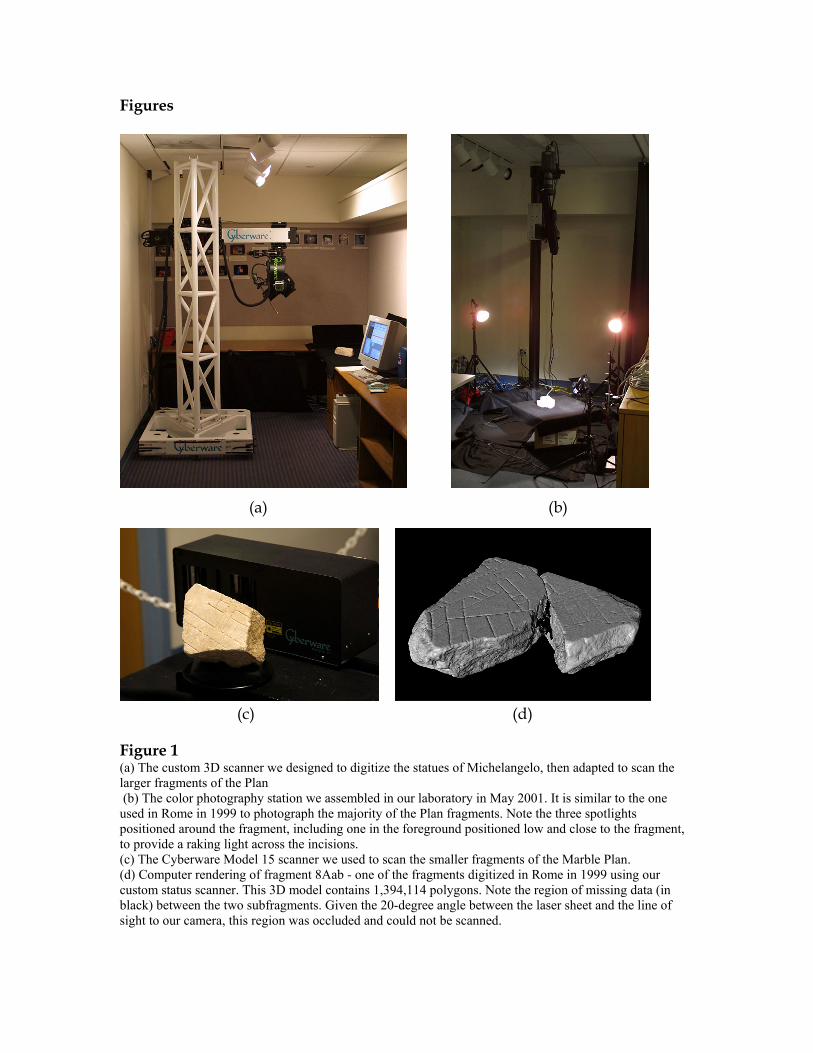
two such scanners, both built by Cyberware. One was a custom design originally intended for scanning the statues of Michelangelo, which we adapted for use in this project (figs. 1a). The other was a Cyberware Model 15, a relatively inexpensive, commercially available desktop scanner (fig. 1c). In order to capture the details of the incisions and other surface characteristics of the fragments, we scanned them with an X‐Y sample spacing of about 250 microns (0.25 mm) and a Z (depth) resolution of 50 microns. To acquire color data, we used a Sony DKC‐ST5 programmable 3‐CCD digital still camera (fig. 1b). It had a nominal resolution of 1300 x 1030 pixels, which we configured to provide a resolution of 0.25 mm (100 dpi) on the fragment surfaces. We actually assembled this collection of scanners twice: once in the Museo della Civiltà Romana in Rome in May of 1999 to scan the majority of the map fragments, and again at Stanford University in May of 2001 to scan a set of 23 newly discovered fragments.
A laser‐stripe scanner digitizes an object by sweeping it with a plane of laser light, imaging the resulting stripe as it moves across the object surface, and analyzing the shape of the stripe 30 times per second. This sweeping motion is typically accomplished either by translating the laser, translating the object, rotating the laser around a point, or rotating the object on a turntable. Between our two scanners we had all four capabilities, which we used in various combinations depending on the size and shape of each fragment. Regardless of the fragment shape, many scans were required to completely cover its surface. To permit these multiple scans to be aligned together, we overlapped them substantially, sometimes scanning each surface point several times. This redundancy also allowed us to downweight oblique views, which yield poor data in all laser triangulation systems and particularly poor data when scanning marble, due to subsurface scattering.
Our software pipeline consisted of aligning these multiple scans, combining them together using a volumetric algorithm, and filling any remaining holes (areas not captured by the scanner). Since the fragments were rotated partially by a motorized turntable and partially by hand, we initiated the registration process by aligning each scan to its neighbor manually. This procedure was refined by automatic pairwise alignment of scans using a modified iterated‐closest‐points (ICP) algorithm and finally by a global relaxation procedure designed to minimize alignment errors across the entire fragment.4
Digitizing the 1,186 fragments of the Marble Plan was a challenging task; the fragments varied in size from a few inches to several feet across, and some of them weighed several hundred pounds. Although our scanners and software pipeline generally worked well, they were not without problems. First, our statue scanner was not designed to be recalibrated in the field, so after five months of scanning the statues of Michelangelo, its calibration had degraded significantly. This degradation manifested itself as a visible warping of the range images, by up to a millimeter in Z per 300mm in X or Y. Second, the fragments of the Forma Urbis Romae consist mainly of smooth surfaces bounded by sharp corners or breaks. Smooth surfaces do not present enough constraints for alignment algorithms, and when the laser strikes sharp corners at a glancing angle, it leads to noisy range data. As a result, we have at present successfully aligned about 80 percent of the 3D data at full resolution. For the remaining fragments, we have low‐resolution 3D models of the entire fragment and higher quality 3D models of the top (incised) surfaces; although not perfect, these models are adequate for many types of archaeological research (fig. 1d).
4 For a more detailed description of our pipeline, see M. Levoy, K. Pulli, B. Curless, S. Rusinkiewicz, D. Koller, L.
Pereira, M. Ginzton, S. Anderson, J. Davis, J. Ginsberg, J. Shade, and D. Fulk, ʺThe Digital Michelangelo Project: 3D scanning of large statues,ʺ in K. Akeley (ed.), Proceedings of ACM SIGGRAPH 2000, New Orleans, Computer Graphics Proceedings, Annual Conference Series, ACM, 131‐ 44.
3

Third, since the scanning of the Forma Urbis Romae was added to the agenda of the Digital Michelangelo Project after we were already in Italy scanning the statues of Michelangelo, we had no opportunity to design from scratch a set of devices and protocols suited to the digitization of this very different artifact. One implication of this was that our decision to use a Model 15 scanner to digitize the smaller fragments meant that we could not rely on the color camera in our statue scanner to capture the color of fragments (the Model 15 scanner does not capture color). We solved this problem by rapidly assembling in the field a separate color photography station based on a Sony DKC‐ST5 camera, as already described. Since this camera did not also record range information, our color is not aligned a priori to the 3D fragment models. We have attempted to compute this 2D‐to‐3D alignment after the fact, but errors in the calibration of both our 2D and 3D data have made this task difficult. At present, our 3D models and 2D color information represent separate archives.
In retrospect, this project was at the edge of what one would consider feasible using field‐deployable scanning and computer technology in 1999. In particular, our target spatial resolution was ambitious (0.25mm over surfaces 1m wide), our scanning process was long and tedious (the average fragment took an hour to scan), and the resulting archive was extremely large (8 billion polygons and 6,000 color images). Scanning took 6 people 25 days working around the clock on 3 stations simultaneously ‐ about 3,600 man‐hours. Alignment and merging of the data, which is about 75 percent complete at this writing, has taken thousands more. As the technology develops, some aspects of 3D scanning will become faster and less expensive; others, however, will always remain difficult. Examples of the latter are scanning uncooperative materials such as highly translucent marble optically, scanning geometrically complicated objects such as the Laocoon, and scanning objects in the field, where calibration and lighting can not be easily controlled. In the short term, archaeologists who embark on similar digitization projects will need significant funding, staffing, and technological expertise.
Our digital fragment representations have proved very useful for archaeological analysis tasks, particularly reconstruction (see below). The user should exercise great care when doing research with these virtual artifacts, however. The computer models and photographs of the fragments do not, for example, show fine details such as sawing marks (scalini) and other subtle characteristics of the marble such as texture, veining, and color. These variations can only be observed in person and should be verified by examining the actual fragments in Rome.
Computer‐aided reconstruction
A primary goal of our work on the Digital Forma Urbis Project has been to use advanced computer algorithms to aid in reconstructing the Marble Plan. Although computer techniques have been used before to assist in archaeological fragment reassembly,5 our high‐resolution digitization of the individual pieces of the map present a unique opportunity to investigate the efficacy of computer‐aided matching. Several of our methods have resulted in new (proposed) fragment matches.
The remains of the Severan Marble Plan include a number of properties that are potentially useful as clues for automated fragment reconstruction. The most obvious is the inscribed map topography on the marble surface, which has been the primary source of information for prior reconstruction scholarship.6
5 See, for example, R. W. Smith, ʺComputer helps scholars re‐create an Egyptian temple,ʺ National Geographic
Magazine (November 1970) 634‐55. 6 A major reconstruction effort took place in 1741‐ 42 when many of the known fragments were exhibited in wooden
frames in the Capitoline Museums. In the 20th century, the authors of PM 1960 and AG 1980 reinvigorated the reconstruction process by using additional constraints such as marble veining direction and clamp holes.
4

Another strong clue is the fracture shape of the fragment edges; adjacent fragments whose edge geometry has not substantially eroded should fit together geometrically. Fragment characteristics such as the nature of the incisions (ductus), marble color, and marble texture are also usually very similar between matching fragments. Fragments originating from the same marble slabs should have similar thicknesses and marble veining direction. Properties such as the roughness of the bottom surface, and presence of straight slab edges, clamp holes, and wedge holes (tasselli) on the fragments also help match fragments together, as well as providing information about the orientation and position of fragments on the original map wall.7
We have experimented with a number of different computer algorithms for fragment reconstruction. The most successful of these methods has been automated boundary incision matching. This technique is similar to the manual process that scholars have used when searching for fragment joins. We have annotated by hand all of the topographic features that leave the boundaries of each fragment, indicating their relative position, direction, and feature type (such as rows of columns, tabernae fronts, aqueducts, etc.), as seen in figure 2a. The computer algorithm searches this collection of fragment boundary annotations, and returns a ranked list of suggested pairwise fragment matches. Each suggested match is scored based on the alignment of the annotated boundary features, with highest scores for those pairs of fragments which have the strongest correspondence between the angles, spacings, and types of incised features. The top‐scoring matches output from the computer algorithm can then be reviewed manually, or this output list can be further filtered by passing it on to other matching algorithms. An example of a proposed match among a group of fragments using this method is shown in figure 2b.
Another computer algorithm we have successfully used to find and locate new fragment joins is wall feature matching. This technique uses the wall measurements collected by L. Cozza for the 1960 publication of the map.8 In particular, it employs the locations of those clamp holes and masonry patches that are still intact on the wall, which are expected to correspond to clamp holes and tasselli on the fragments, respectively. The relative distances and directions between the clamp holes, masonry patches, and wedge holes, in addition to the orientation of fragment slab edges, provide a number of geometric constraints. We have digitized Cozzaʹs wall feature measurements, as well as the fragment feature locations, and use this data as input to a computer matching process that searches all the valid positions and orientations of the fragments, and outputs a ranked list of those fragments which best match up with the corresponding features on the wall. Again, the top‐scoring positions suggested by the computer can be manually checked to verify their suitability in light of considerations beyond the simple geometric constraints of the wall features. The potential of this particular method is limited by the scarcity of the surviving constraints on both the fragments and the aula wall; few fragments have tasselli, slab edges, or multiple clamp holes, and many areas of the wall have been disturbed since antiquity.
Other computer matching algorithms that we employ are multi‐variable clustering and fractured edge geometry matching. The clustering algorithm looks for similarities among fragment characteristics including fragment thickness, marble veining direction, the primary axial direction of the architecture depicted on the fragment, direction of slab edges, and the back surface condition of the fragments (i.e. whether the backs are rough, smooth, or sawed off). As with the other techniques, the clustering algorithm output assigns high scores to those groups of fragments that have a high degree of correlation
7 E. Rodríguez‐Almeidaʹs discovery of the relationship between tasselli on the back of fragments and mortar patches
on the aula wall is described in ʺForma Urbis marmorea: Nuovi elementi di analisi e nuove ipotesi di lavoro,ʺ Mélanges de lʹEcole Française de Rome, Antiquité 89.1 (1977) 219‐56.
8 PM 1960, 175‐95, pls. 61ab.
5

in these characteristics. The geometric fracture matching techniques use our 3D scanned data of the fragments to search for matching shapes among all the fragment edges. In one approach we have experimented with, we extract 2D boundary slices from the 3D models at different levels of the fragment thickness, and then convert these 2D contours to 1D signals. These one‐dimensional representations of the fractured surfaces can be searched and compared for match quality very efficiently, using well‐studied algorithms developed by computer scientists for searching large bodies of text and sequencing the human genome. Although we initially expected this shape matching based on the scanned 3D fragment models to be the most fruitful approach for digital reconstruction, the large degree of erosion of many fragment edges has turned out to be a limiting factor in the usefulness of this technique.
Though we are still tuning and experimenting with our computerized reconstruction algorithms, our methods have yielded a number of new discoveries among the fragments of the Forma Urbis. We have so far found approximately 20 new fragment joins and placements of high likelihood; further details on these new proposed matches are available in a forthcoming article9 and at the Project website. In general, our approach has been very effective at leveraging digital technology for automating the geometric matching aspects of fragment reconstruction. However, we still rely on human knowledge and archaeological expertise to verify suggested matches, to identify false positives, and to take into account factors that are difficult to encode for the computer, such as evidence from literary sources and excavation data. Our current work includes development of interactive visualization and analysis tools that directly support this human‐machine collaborative effort.
The database: a public tool for study and research
Providing wide‐ranging access to this extraordinary monument has been a major goal of the Stanford project. Access to the Severan Marble Plan is a central issue, not only because of the difficulties presented by the monument and its scholarly literature, as indicated above, but also because it is a tremendous and ongoing challenge to exhibit over one thousand fragile pieces of marble in a way that explains the monument as a whole while allowing for detailed study of its individual fragments. Accordingly, in collaboration with the Sovraintendenza Comunale di Roma, the Project has constructed an on‐line, fully searchable website containing color photographs, 3D models, and up‐to‐date archaeological information about each fragment as well as the map in general.10 This public website includes 1,186 surviving fragments, plus 87 fragments known only from 16th c. drawings.11 With the exception of 24 fragments that were recently excavated and are soon to be published, these totals include every known fragment of the Marble Plan.12
9 See D. Koller and M. Levoy, ʺComputer‐aided reconstruction and new matches in the Forma Urbis Romae,ʺ
BullComm (forthcoming 2005). 10 For web address of site, see n.3. 11 Several drawings of fragments of the Forma Urbis Romae were made in the years following its discovery in 1562.
The majority of these are contained in the Codex Vaticanus Latinus 3439, now kept in the Vatican libraries. For more information about these drawings, refer to PM 1960, 43‐52 or D. Reynolds, Forma Urbis Romae: The Severan Marble Plan and the urban form of ancient Rome (Diss. University of Michigan 1996) 107‐114.
12 Twenty-three of these fragments were flown to Stanford in 2001 and scanned and photographed there; those data will be incorporated into the public database following the first official publication of the new fragments in the coming year (BullCom, forthcoming 2005).
6

This database was built using the freely available software MySQL to store the information about the fragments in a relational database, and the scripting language PHP to organize this information into a set of web pages. The entire database resides on an Apache web server at Stanford University and can be accessed by any user with an Internet connection. Organizing the database as a web server, instead of using a more static approach such as putting the information on DVDs, allows us, or any scholar working on the Plan, to update the database with the current state of research about the Plan through a simple web interface. Presenting the information through a set of web pages using a familiar set of tools also allows us to reach a wide audience. No special software is required to view the fragment pages and photographs. To view the 3D models, however, users need to download and install the ScanView secure viewer,13 which provides protected, interactive access to the models via remote rendering. By agreement with the Sovraintendenza Comunale, the photographs in the public version of the database are half‐resolution and the 3D models can be interactively viewed but not downloaded. Researchers wishing to work with high‐resolution (100 dpi) color photographs and downloadable 3D models need written permission from the Project directors at Stanford and from the Sovraintendenza in Rome.
Our goal is for the Digital Forma Urbis Romae website and fragment database to become a fundamental research and study tool for scholars, teachers, students, and interested members of the general public. The website and its database are designed with this multiple audience in mind. Figure 3, a screenshot of one of the 1,273 database entries, helps explain how this works. Each surviving fragment can be examined in the form of a 3D model (A); viewers can rotate the model, zoom in and out, and change the lighting to study all sides of a fragment and its incisions in detail (see also fig. 5). Each database entry also includes a color digital photograph (B) of both the front and the back of the fragment, as well as the relevant photographic plate from the still‐fundamental PM 1960 publication (C). (The 87 fragments surviving only in 16th c. drawings are illustrated with the relevant Renaissance drawing in place of a photograph and model, plus the relevant plate from the 1960 publication; the latter plates are important evidence for the way in which the authors regularized those 16th c. drawings and joined them to surviving fragments.) The box in the top left corner (D) provides essential information including the various identification numbers assigned to a fragment over time; which of the 150 slabs of the map it originally belonged to, if known, what fragments it adjoins; the state of its back surface (smooth, rough, or sawed off), and the number of slab edges, clamp holes, and tasselli on that particular fragment. All this information is fully searchable.
The textual analysis begins with a header labeling the architecture depicted in the fragment (E in fig. 3). Next, every surviving inscription has been re‐examined; we supply our transcription together with the various published reconstructions (F). The text proper (G) consists of a detailed analytical description of the fragment, a synthesis of the most recent scholarship about it, and the fragment’s history. Throughout, architectural and other terms are linked to a glossary intended primarily for students or non‐Romanists using the site. Bibliographic citations specific to that fragment (H) are linked to a lengthy annotated bibliography; it is also reachable from the navigation buttons at the top of each page that allow easy movement around the website’s different features (J). All of these data sets are fully searchable by means
13 D. Koller, M. Turitzin, M. Levoy, M. Tarini, G. Croccia, P. Cignoni, and R. Scopigno, ʺProtected Interactive 3D
Graphics via Remote Rendering, Computer Graphics,ʺ ACM Transactions on Graphics 23.3 (2004) 695‐703.
7
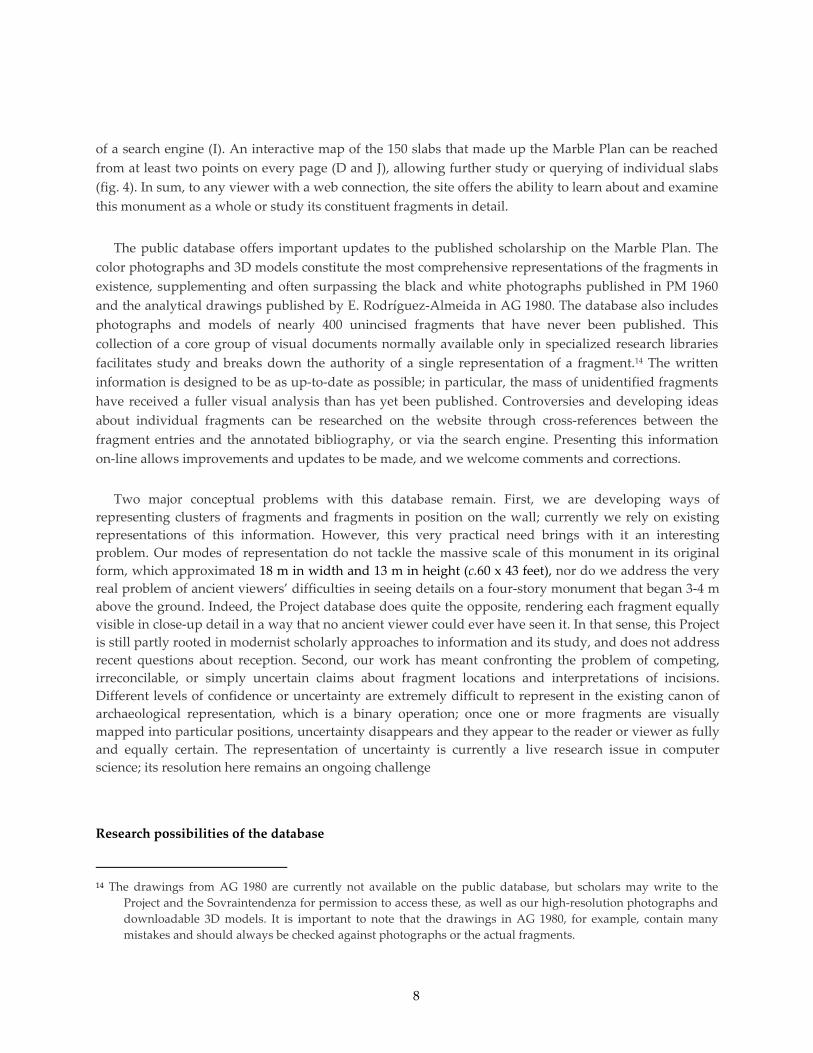
of a search engine (I). An interactive map of the 150 slabs that made up the Marble Plan can be reached from at least two points on every page (D and J), allowing further study or querying of individual slabs (fig. 4). In sum, to any viewer with a web connection, the site offers the ability to learn about and examine this monument as a whole or study its constituent fragments in detail.
The public database offers important updates to the published scholarship on the Marble Plan. The color photographs and 3D models constitute the most comprehensive representations of the fragments in existence, supplementing and often surpassing the black and white photographs published in PM 1960 and the analytical drawings published by E. Rodríguez‐Almeida in AG 1980. The database also includes photographs and models of nearly 400 unincised fragments that have never been published. This collection of a core group of visual documents normally available only in specialized research libraries facilitates study and breaks down the authority of a single representation of a fragment.14 The written information is designed to be as up‐to‐date as possible; in particular, the mass of unidentified fragments have received a fuller visual analysis than has yet been published. Controversies and developing ideas about individual fragments can be researched on the website through cross‐references between the fragment entries and the annotated bibliography, or via the search engine. Presenting this information on‐line allows improvements and updates to be made, and we welcome comments and corrections.
Two major conceptual problems with this database remain. First, we are developing ways of representing clusters of fragments and fragments in position on the wall; currently we rely on existing representations of this information. However, this very practical need brings with it an interesting problem. Our modes of representation do not tackle the massive scale of this monument in its original form, which approximated 18 m in width and 13 m in height (c.60 x 43 feet), nor do we address the very real problem of ancient viewers’ difficulties in seeing details on a four‐story monument that began 3‐4 m above the ground. Indeed, the Project database does quite the opposite, rendering each fragment equally visible in close‐up detail in a way that no ancient viewer could ever have seen it. In that sense, this Project is still partly rooted in modernist scholarly approaches to information and its study, and does not address recent questions about reception. Second, our work has meant confronting the problem of competing, irreconcilable, or simply uncertain claims about fragment locations and interpretations of incisions. Different levels of confidence or uncertainty are extremely difficult to represent in the existing canon of archaeological representation, which is a binary operation; once one or more fragments are visually mapped into particular positions, uncertainty disappears and they appear to the reader or viewer as fully and equally certain. The representation of uncertainty is currently a live research issue in computer science; its resolution here remains an ongoing challenge
Research possibilities of the database
14 The drawings from AG 1980 are currently not available on the public database, but scholars may write to the
Project and the Sovraintendenza for permission to access these, as well as our high‐resolution photographs and downloadable 3D models. It is important to note that the drawings in AG 1980, for example, contain many mistakes and should always be checked against photographs or the actual fragments.
8

This hypertext environment brings with it new possibilities for analyzing the Severan Marble Plan. Here we touch on two areas to illustrate. The first considers the way in which the database’s electronic juxtaposition of multiple forms of visual documentation forces a greater engagement with the map’s two‐dimensional and representational nature; with this engagement comes a consideration of the real distances between different genres and levels of evidence. The second point illustrated here stems from the way in which the database makes the Severan Marble Plan a searchable map, thereby opening up new directions of analysis. Both areas are potentially vast; they are discussed briefly here for their potential relevance to interpretations of the map and reconstructions of the city it represents.
First—and perhaps ironically—the Project’s collection of visual evidence provides not a more holistic image of the map but a more vivid sense of its representational nature and evidentiary uncertainty. This point is perhaps best illustrated by the example of the Theater of Pompey. Today, very little remains of this famous monument, and to reconstruct its architecture in three dimensions, archaeologists have to rely to a great extent on the evidence presented by the Severan Marble Plan. This evidence, however, is not straightforward, especially when different media and representations are involved. In the case of the Theater of Pompey, the evidence consists both of surviving fragments of the map and of Renaissance drawings of fragments now lost—the latter are thus representations of representations. This presents immediate challenges. For example, the part of the map that depicted the scaenae frons of the theater survives only as depicted in two different 16th c. drawings (fig. 6).15 These drawings are thus crucial evidence for any reconstruction of the monument, but they differ in certain important details. Specifically, the number of columns in the central rows of the stage building varies; the drawing on the left in fig. 6 shows two and three columns alternating, while the drawing on the right shows three in each row. Which do we believe? Architecturally, the drawing that shows three columns in each row makes more sense. However, the same drawing includes at least one mistake of detail; this can be shown by comparing it to a surviving fragment, 39f, which is depicted in a different part of this drawing. The database entry for fr. 39f includes a photo (fig. 7), a 3D model, and the Renaissance drawing of the piece. Close examination of the photograph shows that the squares along the parallel lines emerging from the top of the cavea are plain, a convention generally symbolizing columns on the Severan map; in this case they are thought to represent buttresses for a tall foundation for the Temple of Venus Victrix.16 The Renaissance artist, however, incorrectly filled those squares with dots (fig. 6, left), meaning that if this drawing were the only evidence available, we would reconstruct the dotted squares as columns on plinths, the usual meaning of this symbol on the Plan. As it is, the survival of fragment 39f shows that Renaissance drawing 23r is inaccurate here, and therefore perhaps—but not certainly—in other details as well. This is surely why the authors of PM 1960 chose to include the information depicted in Renaissance drawing 22r in their photographic reconstruction of the Theater (PM 1960, pl. 32). In presenting all of these as core elements of the entries for the Theater of Pompey, the database spotlights the complex evidentiary problems associated with the interpretation of this map.17
The second area we touch upon here draws on a major advantage of digital data in a hypertext environment: its searchability. In many ways, the Project’s public database has made the Severan Marble
15 Both drawings are part of the Codex Vaticanus Latinus 3439 and are reproduced in PM 1960, pls. 13 and 14. The
identification letters provided by the PM 1960 authors are used here as well; the drawings are, respectively, Fo 22r (on the left in fig. 6), and Fo 23r (on the right in fig. 6).
16 This identification is not universally accepted. For an alternative interpretation, offered by L. Richardson, see the entry for fr. 39f in the Stanford database.
17 For a detailed analysis of the accuracy of the Renaissance drawings, see Reynolds 1996, 107‐14.
9
Plan a searchable map, which allows for certain kinds of urbanistic research that have not been much exploited in past scholarship on the map.18 The classic form of research on the location and description of textually attested monuments is made easier, with the added interest of investigating the relationship of those monuments to their immediate surroundings and their functioning with the local urban fabric. Much less exploited has been the study of certain types of buildings on the map, an investigation made much easier by this digital research tool. Some studies of this kind have been performed—for neighborhood baths, for instance, and warehouses—but they remain few and far between, and tend to focus on typological studies in isolation from the urban fabric.19 By contrast, the searchability afforded by digital data means that a user may search for “domus” or “house” and within seconds receive an index of all the fragments that contain such a structure, each one linked to that entry. With a few clicks of the mouse, the user can then evaluate not only architectural similarities between these structures but also the ways in which residential structures fit into a spatial context of streets and other kinds of buildings. This focus on the constitution of the urban fabric and the interactions of different kinds of space is a largely untapped vein of research for the city of Rome. A particular interest here is the recuperation of the unidentified fragments of the map as valuable and interesting; these constitute the majority of the surviving fragments but remain largely unstudied. They are valuable for this proposed line of research, however; their location within the city may be unknown, but these fragments are nonetheless rich evidence of the fabric of the city and can be employed in the detailed analysis of its social and spatial interactions.
Alternatively, the site’s search engine allows the study of the map’s depiction of major organizing features in the city, such as streets or the river Tiber. A search for ʺClivus Suburanusʺ, for example, results in a list of all the fragments known to depict this important ‘spoke’ street between the city center and the Esquiline Gate; this in turn allows the examination of the street’s appearance and function in relation to its surrounding streets, buildings, and neighborhoods. Similarly, even a quick look through the fragments resulting from a search for ʺTiberʺ shows how the riverfront gradually shifts from an emphasis on large warehouses and goods processing in the Emporium area south of the Aventine (fragment groups 23, 24, 25, and 28), to a far more cellular, dense and small‐scale architectural environment toward the center of the city (e.g. fragment group 27). The search engine also encourages research of entire areas or neighborhoods on the map. A search for the word “Subura” will bring up a linked index of all the fragments thought to depict this neighborhood.20 From that index, the user may examine a single fragment, such as fr. 10g, in order to consider what this particular fragment tells us about the Subura (fig. 8). From the database entry for 10g, he or she can click on links to the adjoining
18 Discussed by T. Najbjerg and J. Trimble in ʺThe Forma Urbis Romae since 1980,ʺ (BullCom, 2005 forthcoming). 19 In PM 1960, pp. 255‐256, R. A. Staccioli created a typological index for different types of features on the Plan. He
subsequently published a series of articles in which he discussed three types of buildings in more detail: ʺTipi di ʹhorreaʹ nella documentazione della ʹForma Urbisʹ,ʺ Coll. Latomus 58.3 (1962) 1430‐1440; ʺTerme Minori e Balnea nella Documentazione della ʹForma Urbisʹ,ʺ Archeologica Classica 13 (1961) 93‐102; and ʺLe ʹtabernaeʹ a Roma attraverso la ʹForma Urbisʹ,ʺ Rendiconti della Reale Accademia dei Lincei, Ser. 8, vol. 14 (1959) 56‐66. In his book, Roman granaries and store buildings (Cambridge 1971) 108‐121, G. Rickman uses evidence from the Severan plan to explore types of granaries in Rome. B. Bollman identifies six scholae or headquarters for collegia on the FUR in her Römische Vereinshäuser (Mainz 1998) figs. 15, 16, 61, 67, 70, 73.
20 In a case in which the boundaries of a zone are not firm or known in detail, we deliberately include more rather than fewer fragments in adjudicating doubtful zones; the specialist user will of course make his or her own determinations. For a discussion of the changing boundaries of the Subura over time, see K. Welch, “Subura,” LTUR IV, 379‐83.
10

fragments and in this way follow particular roads, buildings, or other topographic features in this neighborhood. An additional feature of the database, still under construction, will enable the viewer to see the Subura fragments superimposed upon the slab map (fig. 9), thus providing him or her with a larger view of the neighborhood, all of which facilitates the study of its relative proportions of elite and non‐elite housing, the interactions of monumental, residential and commercial space, or the way in which the streets, alleys and monuments shaped movement through the area.
In short, this new research and study tool interacts fruitfully with current developments in Roman topography as well as in history and archaeology more generally. The Severan Marble Plan’s scholarship has been effectively limited to a small group of expert researchers and to a research agenda narrowly focused on the location and description of individual monuments and elements of the city’s physical archaeological record. By providing access and high‐quality digital data and information to work with, we hope to expand the monument’s intellectual currency to reflect and encourage the move toward more urbanistic studies of the built urban environment, the exploration of socio‐spatial interactions, and the sophisticated analysis of representations as representations. This research and study tool allows us to focus on this map as a two‐dimensional representation, as a complex monument and artifact in itself—a crucial resource for our knowledge of the three‐dimensional city, but by no means a transparent or unproblematic route to that knowledge.
Conclusions
The ultimate goals of this Project, then, are not to offer a single, authoritative visualization of Rome or of its most famous ancient map. For one, even if all the surviving fragments are matched up and located on the map, we will still only have approximately 10% of the original monument. For another, a map is by nature a highly selective representation of a fragmentary reality; reconstructing this map is not an easy avenue to the reconstruction of the city. Rather, our contribution is a multi‐layered, multi‐dimensional tool for working with a highly particular representation of Rome while taking seriously its fragmentation and the uncertainty of knowledge claims about it. This runs counter to much existing scholarship, which is aimed at reconstructing the map as a complete image of the city, erasing the distance between the city and its representation. A problematic corollary is that this map is often treated as a transparent topographic reference tool, an unproblematic stand‐in for the multidimensional, ever‐changing ancient city. However, the Forma Urbis is the ultimate two‐dimensional representation of Rome—based on the graphic conventions and spatial conceptions of urban surveying, which is already a highly particular form of two‐dimensional representation of urban space. More work is needed to understand the series of transformations whose results are visible on the Severan Marble Plan of Rome, from three‐dimensional architecture into a highly‐conventionalized, two‐dimensional petrification of features and space.
At the same time, the map’s potential to answer questions about Rome is enormous. Several directions for future digitization can be suggested, that we have considered but for various reasons not undertaken; these may be grist for the mill of other research groups, even if not our own. A complete vectorization and annotation of the incisions of the map would allow for statistical area analysis that could produce results of urbanistic interest. A similar possibility is the automated color coding of space as another means toward analysis of different kinds of space and their interactions. 21 Of real interest but immediate
21 D.W. Reynolds is exploring this avenue of research (pers. comm.).
11
logistical difficulty is a direct focus on the physical relationship of depictions of the map and excavations in the ground: could certain excavated features be digitally and automatically overlain onto unidentified map fragments to find correspondences in that way? This remains an interesting research question related to pattern recognition, but the process of identifying and digitizing the ancient remains of the city would require an overwhelming amount of time, funding, and archaeological expertise.
Large portions of our digital archive of the Forma Urbis have been publicly available for several months as of this writing. Already during this period, thousands of users, both archaeologists and curious lay persons, have accessed the database to view and study the fragments and learn more about the map. Although the response from users has been overwhelmingly positive, we are keenly aware of the challenges that still face our efforts to collect and disseminate archaeological data in a digital form. For example, the permanence and usability of a digital archive versus traditional forms of information preservation, such as books, remain an open question; we are currently working to guarantee the sustainability of our database beyond the short lifetime of the current technological platforms. At the same time, we continue to explore the advantages of the highly dynamic nature of digital information presentation, which naturally allows for rapid updates and widespread cross‐referencing. The wide access to the fragments could, for example, be employed to construct an open source environment in which anyone could search for new fragment joins and contribute their ideas. Further possibilities include opening up the information editing and managing efforts to create a collaboratively authored research tool involving a wide segment of the archaeological community. These and other questions are the subject of active research in the digital libraries community.22
By digitizing the surviving fragments of the Severan Marble Plan, offering multiple new fragment matches and locations, and making all this information available in a fully searchable, public website, we hope to make a major contribution to the study of the city‐‐including Rome’s capacity to produce the ultimate in two‐dimensional representations, a monumental map of itself.
Acknowledgments
This project is sponsored by the National Science Foundation under the name Solving the Puzzle of the Forma Urbis Romae. Some of the early work was funded under an NSF Digital Libraries Initiative pilot grant called Creating Digital Archives of 3D Artworks. Additional funding has been provided by Stanford Universityʹs Presidentʹs Fund and Program on Urban Studies, UPS Endowment Fund, Interval Research Corporation, The Paul G. Allen Foundation for the Arts, The Mellon Foundation, The City of Rome, and Pierluigi Zappacosta. The Project would not exist without the collaboration, interest and support of the Sovraintendenza Comunale of Rome. We would especially like to thank Superintendent Eugenio La Rocca and the curator of the Marble Plan itself, Dott.ssa Laura Ferrea. We also thank Dott.ssa Susanna Le Pera and Dott.ssa Anna Mura Sommella for key interventions at various steps along the way. Dott.ssa Claudia Cecamore has provided valuable help and expertise, particularly concerning computer matching of wall features. The database, 3D models and digital photographs discussed in this article are the technological brainchildren of Natasha Gelfand David Koller, François‐Marie Lefevère, Marc Levoy,
22 One example from the rapidly growing number of cultural heritage digital libraries is the Perseus Project
(http://www.perseus.tufts.edu/). On this issue, see G. Crane et al., "Towards a cultural heritage digital library" in Proceedings of the 3rd ACM/IEEE-CS Joint Conference on Digital Libraries, Houston, TX, June 2003, 75-86; "Cultural heritage digital libraries: Needs and components" in Sixth European Conference on Digital Libraries, Rome, Italy, 16-18. September, 2002, 626-37.
12

Austen McDonald, Rene Patnode and Nicolas Scapel. Archaeological research and input are by Tina Najbjerg and Jennifer Trimble. We also thank the following for their help in technical development: Samantha Chui, Kevin Coletta, James Davis, Leslie Ikemoto, Tricia Lee, Min Liu, John Mandsager, Gini Shinn, Lilla Toal. Scanning in Rome was also done by Sean Anderson, Lucas Pereira, Kari Pulli, and Szymon Rusinkiewicz, with help from Barbara Caputo and Maisie Tsui. Help on the archaeological side has been provided by Meg Butler, Liz Clevenger, Jacob Denmark, Andy Martin. Marden Nichols, and Matthew Shulman.
13
Figures
(a) (b)
(c) (d) Figure 1 (a) The custom 3D scanner we designed to digitize the statues of Michelangelo, then adapted to scan the larger fragments of the Plan (b) The color photography station we assembled in our laboratory in May 2001. It is similar to the one used in Rome in 1999 to photograph the majority of the Plan fragments. Note the three spotlights positioned around the fragment, including one in the foreground positioned low and close to the fragment, to provide a raking light across the incisions. (c) The Cyberware Model 15 scanner we used to scan the smaller fragments of the Marble Plan. (d) Computer rendering of fragment 8Aab - one of the fragments digitized in Rome in 1999 using our custom status scanner. This 3D model contains 1,394,114 polygons. Note the region of missing data (in black) between the two subfragments. Given the 20-degree angle between the laser sheet and the line of sight to our camera, this region was occluded and could not be scanned.

(a)
(b) Figure 2 (a) Incised features leaving the fragment boundaries are annotated for input to the computer matching algorithm. Annotations include the position and angle at which the incision intersects the fragment boundary, and a label specifying the type of feature depicted. (b) The automated

boundary incision matching algorithm suggested this matching configuration for fragments 156, 667, and 134. The join between 667 and 134 was previously reported by Rodriguez‐Almeida in 1992 (ʺNovità minori dalla Forma Urbis marmorea,ʺ Ostraka 1 [1992] 55‐80).

Figure 3 View of the database entry for fragment 8h.

Figure 4 Interactive slab map showing the 150 fragments of the Forma Urbis Romae.
Figure 5 Three-dimensional model of fragment 8h, positioned to show a clamp hole and the edge of the slab.

Figure 6: Renaissance images Cod. Vat. Lat. 3439 ‐ Fos 22r (left) and 23r (right), showing sections of the Theater of Pompey. Reproduced from PM 1960, pls. 13 and 14.
Figure 7:

Color photograph of fragment 39f, showing the line and blank squares emerging at an obscure angle from the cavea of the Theater of Pompey.
(b)
(a) (c)
Figure 8 Constructed view of two sequential searches in the database. Searching for the keyword subura in the database (A) produces an index of all fragments located in the Subura neighborhood (B). Clicking on a fragment number in this list (circled) brings up the page for the particular fragment entry (C).
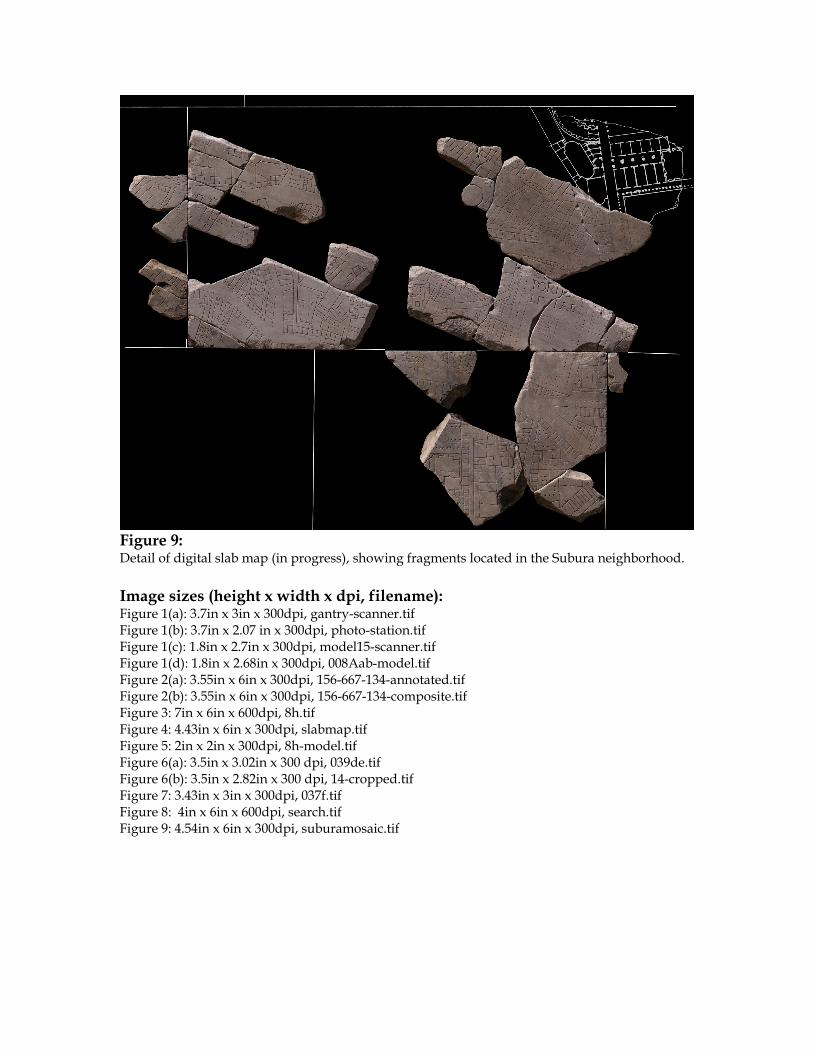
Figure 9: Detail of digital slab map (in progress), showing fragments located in the Subura neighborhood. Image sizes (height x width x dpi, filename): Figure 1(a): 3.7in x 3in x 300dpi, gantry-scanner.tif Figure 1(b): 3.7in x 2.07 in x 300dpi, photo-station.tif Figure 1(c): 1.8in x 2.7in x 300dpi, model15-scanner.tif Figure 1(d): 1.8in x 2.68in x 300dpi, 008Aab-model.tif Figure 2(a): 3.55in x 6in x 300dpi, 156-667-134-annotated.tif Figure 2(b): 3.55in x 6in x 300dpi, 156-667-134-composite.tif Figure 3: 7in x 6in x 600dpi, 8h.tif Figure 4: 4.43in x 6in x 300dpi, slabmap.tif Figure 5: 2in x 2in x 300dpi, 8h-model.tif Figure 6(a): 3.5in x 3.02in x 300 dpi, 039de.tif Figure 6(b): 3.5in x 2.82in x 300 dpi, 14-cropped.tif Figure 7: 3.43in x 3in x 300dpi, 037f.tif Figure 8: 4in x 6in x 600dpi, search.tif Figure 9: 4.54in x 6in x 300dpi, suburamosaic.tif