fracture of fiber-reinforced composites analyzed via
TRANSCRIPT
INTRODUCTION
The use of fibers to improve the mechanical properties of dental resins has been widely reported in the literature for more than 40 years1). Fibers are now used to reinforce various types of dental materials including denture bases, prosthodontic frameworks used in implants, fixed prostheses, periodontal splints, orthodontic appliances, and endodontic posts2). Numerous studies had investigated the effect of fiber reinforcement on the strength of composites. Fiber-reinforced composites (FRC) were reported to have greater strength than the maximum masticatory load expected in clinical situations, comparable strength to alloys used in fixed partial dentures and to ceramic materials, and higher strength than non-reinforced composites3-5). The addition of fibers was also found to enhance the edge strength of composites, resulting in less catastrophic failures6).
Mechanical properties vary between different types of FRC materials, depending on many factors including the amount and diameter of fibers used, properties of the matrix polymer7), type of fibers used8), and fiber orientation or architecture9). Furthermore, the use of fibers to reinforce interpenetrating polymer network (IPN) matrices produces highly viscous matrices with improved handling and bonding properties. These properties provide high-quality dental FRC restorations and extend their lifespan with enhanced mechanical properties10,11), enabling a gradual rather than instantaneous failure during their clinical use12).
Fracture occurs when a particular stress limit is exceeded. Therefore, the load-bearing capacity of a particular material is an important criterion that
influences its performance and serviceability in clinical situations13). Various testing methods have been used to investigate the mechanical strength of dental materials. Three-point, four-point bending tests and biaxial flexural tests are some examples14). Alternatives to conventional testing methods have often been sought, and many techniques such as Acoustic Emission (AE) analysis15-17) have been suggested. AE are stress waves produced by a sudden internal stress redistribution of a material caused by changes in the internal structure of the material18). When an object is subject to external stimuli, areas with flaws develop high stress energies and some of this energy is released in the form of a pressure wave or sound. These waves are generated from both ductile and brittle materials, by any type of elastic or plastic deformation, dislocations, microcracking, inter-crystal fractures, impurity fractures, or phase transformation19).
AE technique is considered as a non-destructive technique which can monitor the condition of a material throughout the test without the need to stop to visually examine the specimen16). It can detect failure initiation, the initial site of damage, damage propagation, accurately measure the maximum strength of a material and detect the mechanism of failure at multiple sites —even non-visible subsurface ones. It provides early warnings of failure and is regarded as having high sensitivity since it can register even small cracks15,19,20).
Dental composite structures often exhibit local failures before rupture into two or more pieces. Progression from initial local failure to rupture is defined as damage accumulation. Early damage can reduce the lifespan of a material, and sub-threshold cracking allows for water ingress into composite structures. Therefore, understanding the lower failure
Fracture of fiber-reinforced composites analyzed via acoustic emissionNadia S EREIFEJ1, Yara G OWEIS2 and Sandra K ALTARAWNEH1
1 Department of Prosthodontics, Faculty of Dentistry, University of Jordan, Queen Rania Street, Amman 11942, Jordan2 Department of Conservative Dentistry, Faculty of Dentistry, University of Jordan, Queen Rania Street, Amman 11942, JordanCorresponding author, Nadia S EREIFEJ; E-mail: [email protected]
This study investigated the fracture resistance of composite resins using a three-point bending test and acoustic emission (AE) analysis. Three groups of specimens (n=15) were prepared: non-reinforced BelleGlass HP composite (NRC), unidirectional (UFRC) and multidirectional (MFRC) fiber-reinforced groups which respectively incorporated unidirectional Stick and multidirectional StickNet fibers. Specimens were loaded to failure in a universal testing machine while an AE system was used to detect audible signals. Initial fracture strengths and AE amplitudes were significantly lower than those at final fracture in all groups (p<0.05). Initial fracture strength of UFRC (170.0 MPa) was significantly higher than MFRC (124.6 MPa) and NRC (87.9 MPa). Final fracture strength of UFRC (198.1 MPa) was also significantly higher than MFRC (151.0 MPa) and NRC (109.2 MPa). Initial and final fracture strengths were significantly correlated (r=0.971). It was concluded that fiber reinforcement improved the fracture resistance of composite resin materials and the monitoring of acoustic signals revealed significant information regarding the fracture process.
Keywords: Acoustic emission, Flexural strength, Fiber-reinforced composite, Three-point bending
Color figures can be viewed in the online issue, which is avail-able at J-STAGE.Received Nov 27, 2014: Accepted Jan 28, 2015doi:10.4012/dmj.2014-325 JOI JST.JSTAGE/dmj/2014-325
Dental Materials Journal 2015; 34(4): 417–424
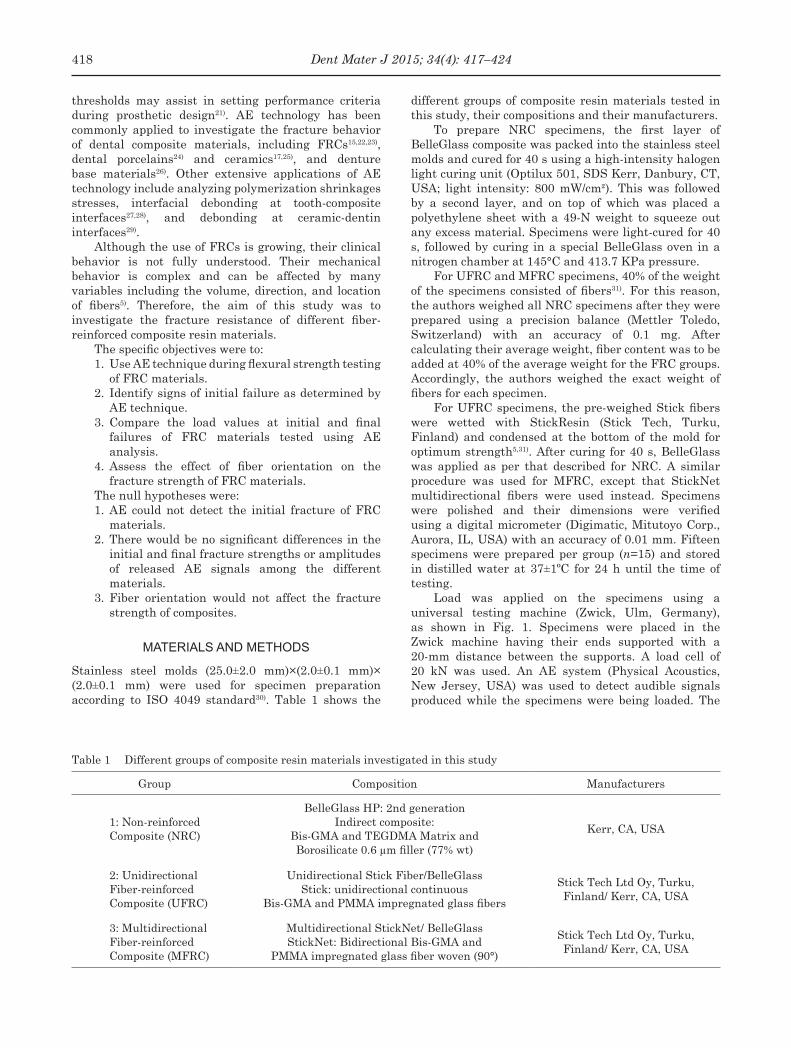
Table 1 Different groups of composite resin materials investigated in this study
Group Composition Manufacturers
1: Non-reinforcedComposite (NRC)
BelleGlass HP: 2nd generationIndirect composite:
Bis-GMA and TEGDMA Matrix and Borosilicate 0.6 µm filler (77% wt)
Kerr, CA, USA
2: Unidirectional Fiber-reinforcedComposite (UFRC)
Unidirectional Stick Fiber/BelleGlassStick: unidirectional continuous
Bis-GMA and PMMA impregnated glass fibers
Stick Tech Ltd Oy, Turku, Finland/ Kerr, CA, USA
3: Multidirectional Fiber-reinforcedComposite (MFRC)
Multidirectional StickNet/ BelleGlass StickNet: Bidirectional Bis-GMA and
PMMA impregnated glass fiber woven (90°)
Stick Tech Ltd Oy, Turku, Finland/ Kerr, CA, USA
thresholds may assist in setting performance criteria during prosthetic design21). AE technology has been commonly applied to investigate the fracture behavior of dental composite materials, including FRCs15,22,23), dental porcelains24) and ceramics17,25), and denture base materials26). Other extensive applications of AE technology include analyzing polymerization shrinkages stresses, interfacial debonding at tooth-composite interfaces27,28), and debonding at ceramic-dentin interfaces29).
Although the use of FRCs is growing, their clinical behavior is not fully understood. Their mechanical behavior is complex and can be affected by many variables including the volume, direction, and location of fibers5). Therefore, the aim of this study was to investigate the fracture resistance of different fiber-reinforced composite resin materials.
The specific objectives were to:1. Use AE technique during flexural strength testing
of FRC materials.2. Identify signs of initial failure as determined by
AE technique.3. Compare the load values at initial and final
failures of FRC materials tested using AE analysis.
4. Assess the effect of fiber orientation on the fracture strength of FRC materials.
The null hypotheses were:1. AE could not detect the initial fracture of FRC
materials. 2. There would be no significant differences in the
initial and final fracture strengths or amplitudes of released AE signals among the different materials.
3. Fiber orientation would not affect the fracture strength of composites.
MATERIALS AND METHODS
Stainless steel molds (25.0±2.0 mm)×(2.0±0.1 mm)× (2.0±0.1 mm) were used for specimen preparation according to ISO 4049 standard30). Table 1 shows the
different groups of composite resin materials tested in this study, their compositions and their manufacturers.
To prepare NRC specimens, the first layer of BelleGlass composite was packed into the stainless steel molds and cured for 40 s using a high-intensity halogen light curing unit (Optilux 501, SDS Kerr, Danbury, CT, USA; light intensity: 800 mW/cm²). This was followed by a second layer, and on top of which was placed a polyethylene sheet with a 49-N weight to squeeze out any excess material. Specimens were light-cured for 40 s, followed by curing in a special BelleGlass oven in a nitrogen chamber at 145°C and 413.7 KPa pressure.
For UFRC and MFRC specimens, 40% of the weight of the specimens consisted of fibers31). For this reason, the authors weighed all NRC specimens after they were prepared using a precision balance (Mettler Toledo, Switzerland) with an accuracy of 0.1 mg. After calculating their average weight, fiber content was to be added at 40% of the average weight for the FRC groups. Accordingly, the authors weighed the exact weight of fibers for each specimen.
For UFRC specimens, the pre-weighed Stick fibers were wetted with StickResin (Stick Tech, Turku, Finland) and condensed at the bottom of the mold for optimum strength5,31). After curing for 40 s, BelleGlass was applied as per that described for NRC. A similar procedure was used for MFRC, except that StickNet multidirectional fibers were used instead. Specimens were polished and their dimensions were verified using a digital micrometer (Digimatic, Mitutoyo Corp., Aurora, IL, USA) with an accuracy of 0.01 mm. Fifteen specimens were prepared per group (n=15) and stored in distilled water at 37±1ºC for 24 h until the time of testing.
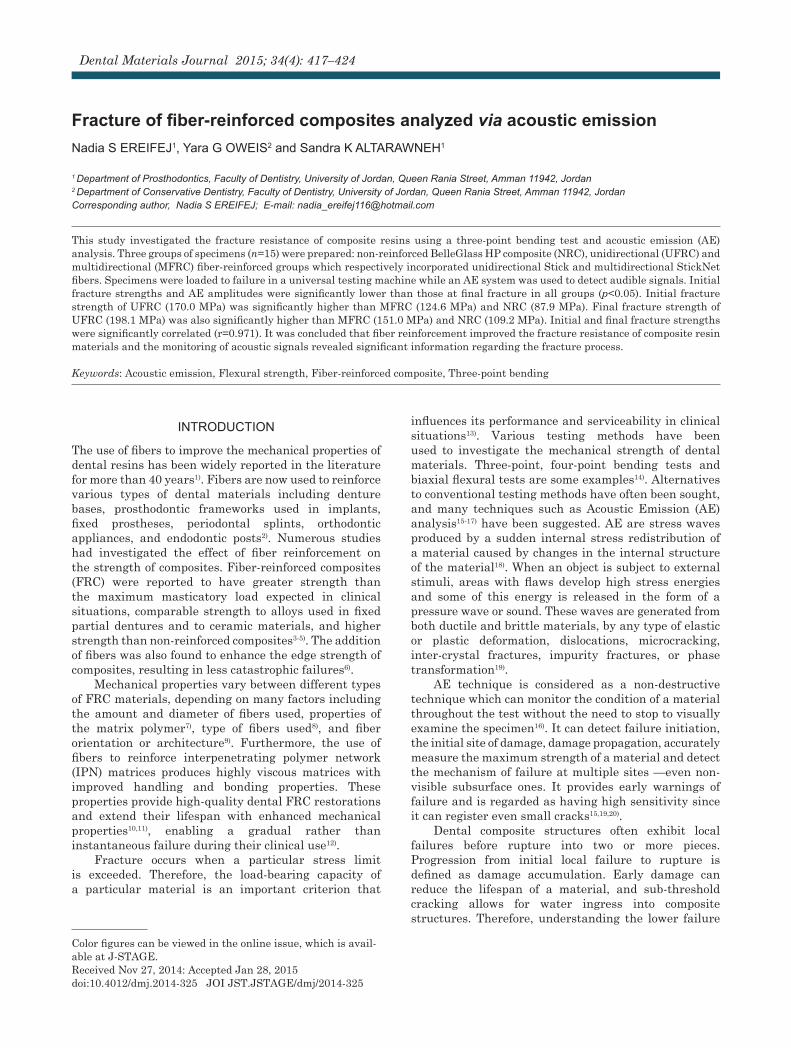
Load was applied on the specimens using a universal testing machine (Zwick, Ulm, Germany), as shown in Fig. 1. Specimens were placed in the Zwick machine having their ends supported with a 20-mm distance between the supports. A load cell of 20 kN was used. An AE system (Physical Acoustics, New Jersey, USA) was used to detect audible signals produced while the specimens were being loaded. The
418 Dent Mater J 2015; 34(4): 417–424
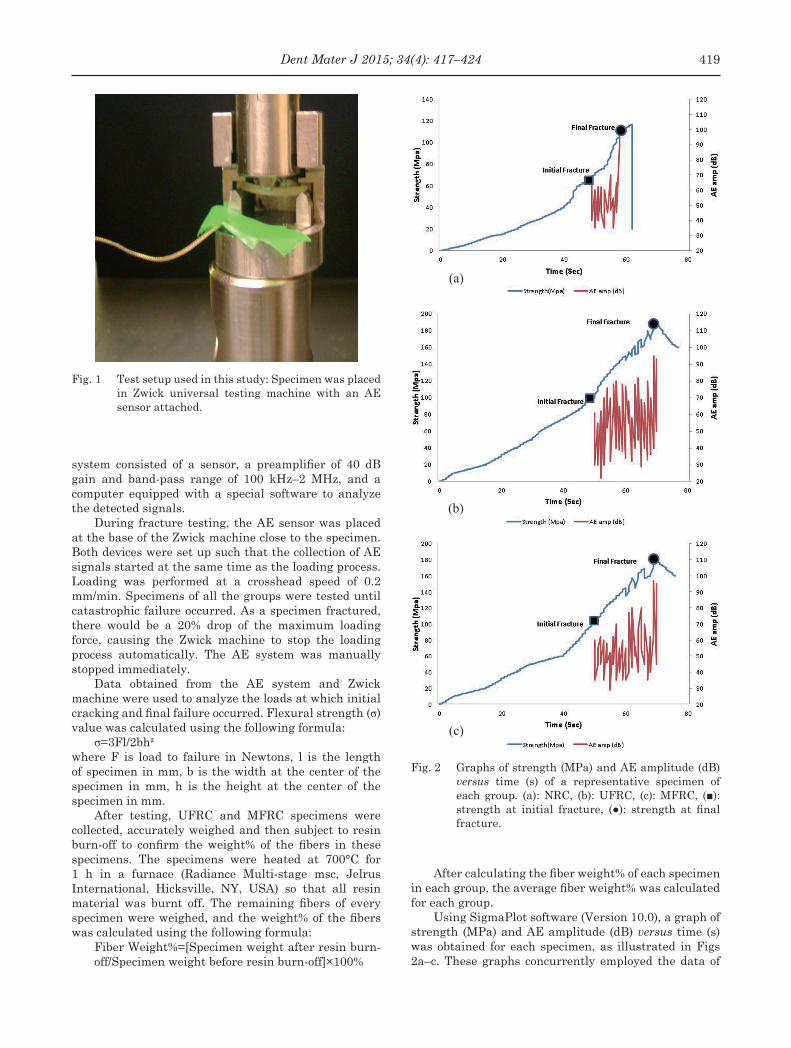
Fig. 1 Test setup used in this study: Specimen was placed in Zwick universal testing machine with an AE sensor attached.
Fig. 2 Graphs of strength (MPa) and AE amplitude (dB) versus time (s) of a representative specimen of each group. (a): NRC, (b): UFRC, (c): MFRC, (■): strength at initial fracture, (●): strength at final fracture.
(a)
(b)
(c)
system consisted of a sensor, a preamplifier of 40 dB gain and band-pass range of 100 kHz–2 MHz, and a computer equipped with a special software to analyze the detected signals.
During fracture testing, the AE sensor was placed at the base of the Zwick machine close to the specimen. Both devices were set up such that the collection of AE signals started at the same time as the loading process. Loading was performed at a crosshead speed of 0.2 mm/min. Specimens of all the groups were tested until catastrophic failure occurred. As a specimen fractured, there would be a 20% drop of the maximum loading force, causing the Zwick machine to stop the loading process automatically. The AE system was manually stopped immediately.
Data obtained from the AE system and Zwick machine were used to analyze the loads at which initial cracking and final failure occurred. Flexural strength (σ) value was calculated using the following formula:
σ=3Fl/2bh²where F is load to failure in Newtons, l is the length of specimen in mm, b is the width at the center of the specimen in mm, h is the height at the center of the specimen in mm.
After testing, UFRC and MFRC specimens were collected, accurately weighed and then subject to resin burn-off to confirm the weight% of the fibers in these specimens. The specimens were heated at 700°C for 1 h in a furnace (Radiance Multi-stage msc, Jelrus International, Hicksville, NY, USA) so that all resin material was burnt off. The remaining fibers of every specimen were weighed, and the weight% of the fibers was calculated using the following formula:
Fiber Weight%=[Specimen weight after resin burn-off/Specimen weight before resin burn-off]×100%
After calculating the fiber weight% of each specimen in each group, the average fiber weight% was calculated for each group.
Using SigmaPlot software (Version 10.0), a graph of strength (MPa) and AE amplitude (dB) versus time (s) was obtained for each specimen, as illustrated in Figs 2a–c. These graphs concurrently employed the data of
419Dent Mater J 2015; 34(4): 417–424
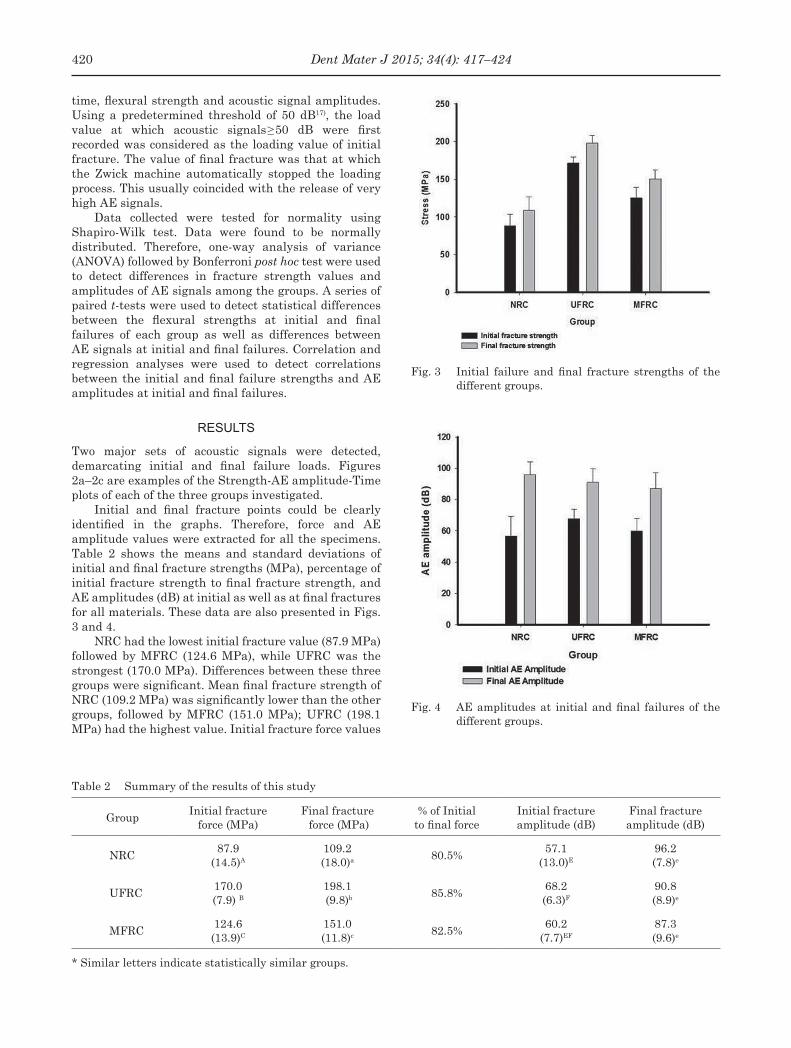
Table 2 Summary of the results of this study
GroupInitial fracture
force (MPa)Final fracture force (MPa)
% of Initial to final force
Initial fracture amplitude (dB)
Final fracture amplitude (dB)
NRC87.9
(14.5)A
109.2 (18.0)a 80.5%
57.1(13.0)E
96.2(7.8)e
UFRC170.0 (7.9) B
198.1 (9.8)b 85.8%
68.2(6.3)F
90.8 (8.9)e
MFRC124.6(13.9)C
151.0 (11.8)c 82.5%
60.2(7.7)EF
87.3 (9.6)e
* Similar letters indicate statistically similar groups.
Fig. 3 Initial failure and final fracture strengths of the different groups.
Fig. 4 AE amplitudes at initial and final failures of the different groups.
time, flexural strength and acoustic signal amplitudes. Using a predetermined threshold of 50 dB17), the load value at which acoustic signals≥50 dB were first recorded was considered as the loading value of initial fracture. The value of final fracture was that at which the Zwick machine automatically stopped the loading process. This usually coincided with the release of very high AE signals.
Data collected were tested for normality using Shapiro-Wilk test. Data were found to be normally distributed. Therefore, one-way analysis of variance (ANOVA) followed by Bonferroni post hoc test were used to detect differences in fracture strength values and amplitudes of AE signals among the groups. A series of paired t-tests were used to detect statistical differences between the flexural strengths at initial and final failures of each group as well as differences between AE signals at initial and final failures. Correlation and regression analyses were used to detect correlations between the initial and final failure strengths and AE amplitudes at initial and final failures.
RESULTS
Two major sets of acoustic signals were detected, demarcating initial and final failure loads. Figures 2a–2c are examples of the Strength-AE amplitude-Time plots of each of the three groups investigated.
Initial and final fracture points could be clearly identified in the graphs. Therefore, force and AE amplitude values were extracted for all the specimens. Table 2 shows the means and standard deviations of initial and final fracture strengths (MPa), percentage of initial fracture strength to final fracture strength, and AE amplitudes (dB) at initial as well as at final fractures for all materials. These data are also presented in Figs. 3 and 4.
NRC had the lowest initial fracture value (87.9 MPa) followed by MFRC (124.6 MPa), while UFRC was the strongest (170.0 MPa). Differences between these three groups were significant. Mean final fracture strength of NRC (109.2 MPa) was significantly lower than the other groups, followed by MFRC (151.0 MPa); UFRC (198.1 MPa) had the highest value. Initial fracture force values
420 Dent Mater J 2015; 34(4): 417–424
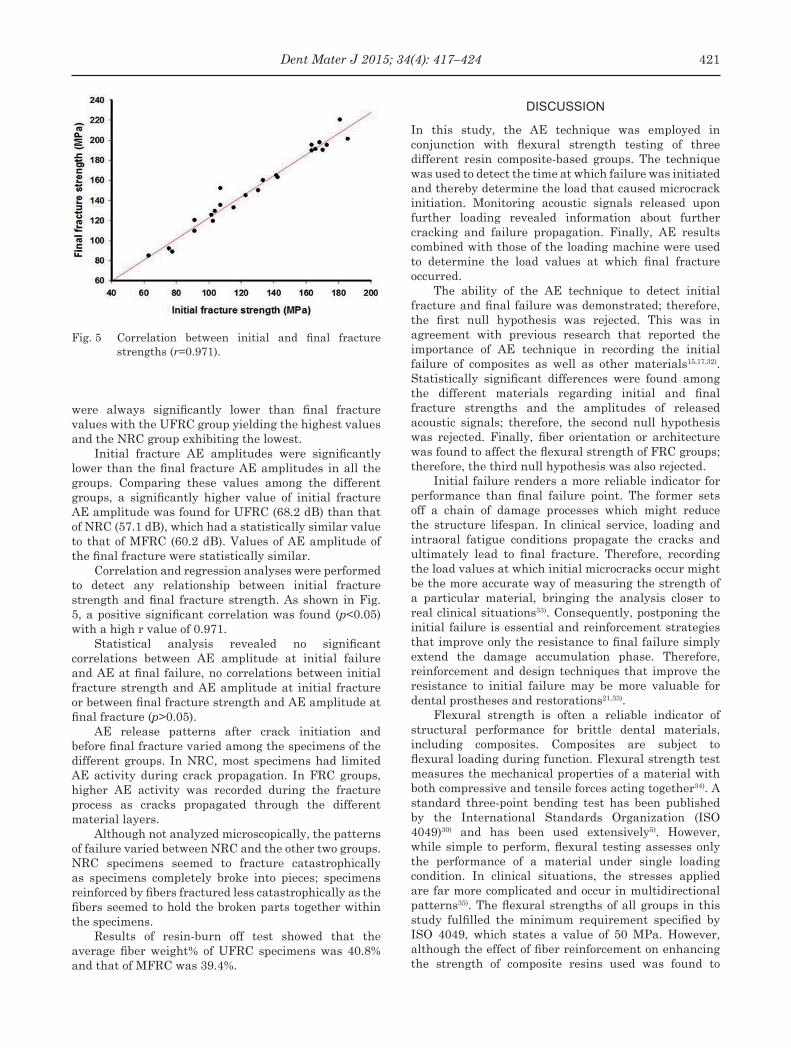
Fig. 5 Correlation between initial and final fracture strengths (r=0.971).
were always significantly lower than final fracture values with the UFRC group yielding the highest values and the NRC group exhibiting the lowest.
Initial fracture AE amplitudes were significantly lower than the final fracture AE amplitudes in all the groups. Comparing these values among the different groups, a significantly higher value of initial fracture AE amplitude was found for UFRC (68.2 dB) than that of NRC (57.1 dB), which had a statistically similar value to that of MFRC (60.2 dB). Values of AE amplitude of the final fracture were statistically similar.
Correlation and regression analyses were performed to detect any relationship between initial fracture strength and final fracture strength. As shown in Fig. 5, a positive significant correlation was found (p<0.05) with a high r value of 0.971.
Statistical analysis revealed no significant correlations between AE amplitude at initial failure and AE at final failure, no correlations between initial fracture strength and AE amplitude at initial fracture or between final fracture strength and AE amplitude at final fracture (p>0.05).
AE release patterns after crack initiation and before final fracture varied among the specimens of the different groups. In NRC, most specimens had limited AE activity during crack propagation. In FRC groups, higher AE activity was recorded during the fracture process as cracks propagated through the different material layers.
Although not analyzed microscopically, the patterns of failure varied between NRC and the other two groups. NRC specimens seemed to fracture catastrophically as specimens completely broke into pieces; specimens reinforced by fibers fractured less catastrophically as the fibers seemed to hold the broken parts together within the specimens.
Results of resin-burn off test showed that the average fiber weight% of UFRC specimens was 40.8% and that of MFRC was 39.4%.
DISCUSSION
In this study, the AE technique was employed in conjunction with flexural strength testing of three different resin composite-based groups. The technique was used to detect the time at which failure was initiated and thereby determine the load that caused microcrack initiation. Monitoring acoustic signals released upon further loading revealed information about further cracking and failure propagation. Finally, AE results combined with those of the loading machine were used to determine the load values at which final fracture occurred.
The ability of the AE technique to detect initial fracture and final failure was demonstrated; therefore, the first null hypothesis was rejected. This was in agreement with previous research that reported the importance of AE technique in recording the initial failure of composites as well as other materials15,17,32). Statistically significant differences were found among the different materials regarding initial and final fracture strengths and the amplitudes of released acoustic signals; therefore, the second null hypothesis was rejected. Finally, fiber orientation or architecture was found to affect the flexural strength of FRC groups; therefore, the third null hypothesis was also rejected.
Initial failure renders a more reliable indicator for performance than final failure point. The former sets off a chain of damage processes which might reduce the structure lifespan. In clinical service, loading and intraoral fatigue conditions propagate the cracks and ultimately lead to final fracture. Therefore, recording the load values at which initial microcracks occur might be the more accurate way of measuring the strength of a particular material, bringing the analysis closer to real clinical situations33). Consequently, postponing the initial failure is essential and reinforcement strategies that improve only the resistance to final failure simply extend the damage accumulation phase. Therefore, reinforcement and design techniques that improve the resistance to initial failure may be more valuable for dental prostheses and restorations21,33).
Flexural strength is often a reliable indicator of structural performance for brittle dental materials, including composites. Composites are subject to flexural loading during function. Flexural strength test measures the mechanical properties of a material with both compressive and tensile forces acting together34). A standard three-point bending test has been published by the International Standards Organization (ISO 4049)30) and has been used extensively5). However, while simple to perform, flexural testing assesses only the performance of a material under single loading condition. In clinical situations, the stresses applied are far more complicated and occur in multidirectional patterns35). The flexural strengths of all groups in this study fulfilled the minimum requirement specified by ISO 4049, which states a value of 50 MPa. However, although the effect of fiber reinforcement on enhancing the strength of composite resins used was found to
421Dent Mater J 2015; 34(4): 417–424
be significant, it remained unclear whether such restorations could withstand the complex intraoral conditions.
A crosshead speed of 0.2 mm/min was selected for loading in this study. This was thought to be more conducive to AE data collection and was used in previous studies for fracture testing of dental materials17,33). The slow loading rate allowed for sufficient time for the detection of AE signals while the specimens were being loaded. During fracture testing, the AE sensor was placed at the base of the Zwick machine close to the specimen, as described in previous studies17). This was recommended by the instrument manufacturer for optimum acoustic signal collection and to reduce the risk of damaging the sensor during testing. Position of the transducer was standardized throughout the entire study where both the transducer and specimen were placed in the exact same position each time the test was conducted. Only one AE sensor was used; it was already established in a previous study that one AE sensor was sufficient for AE data collection28). Moreover, it was not within the scope of this study to identify the exact location of initial damage.
Results showed that initial fracture, as detected by AE technique, always started at a lower loading value (14.2–19.5%) than the final loading value. This might indicate that loading machines, which record only the forces at catastrophic failure, have overestimated the fracture strengths of tested materials. This finding agreed with Alander et al.15) who investigated the acoustic signals emitted during flexural strength testing of different types of FRCs. They found that AE signals were first released at load values which were 19–32% lower than those at final failure points15). It was also observed in this study that the final fracture force tended to increase as the initial fracture force increased, accounting for the strong correlation (r=0.971). In light of these results, it was concluded that the initial failure point could be used to predict the final failure point.
In comparing the initial failure points among the groups, UFRC had a significantly higher value followed by MFRC; NRC was the weakest. Initial crack formation was previously found to be greatly dependent on the stress distribution of the whole structure, which in turn is controlled by many material- and geometry-related variables33). In this study, the inclusion of fibers in the composite resin specimens had an evidently positive effect on their flexural strength. High resistance against crack initiation by UFRC and MFRC specimens could be explained by the placement of the fibers at the tension side of the specimens, which acted to delay crack initiation —especially when fracture was proven to be initiated at the tension side of the specimens in such test geometry. Highest flexural strength of UFRC could be explained by the optimum fiber orientation in its specimens relative to the direction of load application. In the case of UFRC, load direction was perpendicular to the fibers, thus accounting for this group’s highest flexural strength as well as the highest AE amplitude and frequency.
The ratio between initial to final failure provides an insight into the failure of complex structures. A high initial-to-final failure ratio indicates minimal damage accumulation, while a low ratio indicates that a large portion of damage occurs after initiation and before rupture. In general, it is desirable to have a high initial failure load and long damage accumulation phase to avoid instantaneous failure21). In this study, fracture was less catastrophic in FRC groups. NRC showed the lowest initial/final failure ratio, proving the effect of fiber addition on improving fracture resistance and preventing catastrophic failures of composites.
During crack propagation, most NRC specimens had limited AE activity —indicating that few events occurred within the specimens at fracture36). NRC specimens were composed of composite material only with no fiber addition, hence fewer microcracks were expected to occur. Plastic deformation that composites undergo before they break catastrophically is a relatively quiet process, therefore minimal AE signals are expected. Plastic deformation of a material usually results in emission of AE signals with reduced amplitude and frequency26).
In FRC groups, higher AE activity was recorded as cracks propagated through the different layers of the specimens or at the interfaces between the different components until AE signals with higher frequency and amplitude were recorded when the fibers eventually fractured. Two signal levels were identified in the FRC groups. Low amplitude level was presumably associated with matrix cracking, while the high amplitude might indicate fiber-cracking15). This finding agreed with Fennis et al.22) who found that where fibers were not used, failure was more catastrophic than FRCs and fewer acoustic signals were recorded. Fewer signals were recorded during the fracture process of MFRC specimens compared with UFRC ones. In the case of MFRC, fibers in the woven design were equally divided in the longitudinal and transverse directions, giving the material orthotropic mechanical properties. Therefore, MFRC specimens might be more efficient in impeding crack propagation, causing fewer fracture events and acoustic signals to be produced. This meant that MFRC might be more suited for restorations where multidirectional reinforcement is needed and where the loading direction is difficult to predict34).
Debonding between the fibers and polymer matrix can be another source of AE activity in FRC groups. Separation of the fibers from the matrix can occur due to inadequate bonding between the fibers and the resin composite or due to a difference in the elastic modulus between them37). In clinical situations, hydrothermal and mechanical stresses can degrade the fiber-matrix interfacial bonding, limiting the lifespan of such restorations38). Silanization of E-glass fibers can help improve the interfacial fiber-resin matrix bonding and its resistance to degradation39).
Final failure points were clearly identified for all the different groups of specimens. At the final fracture of NRC specimens, parts of the specimens were chipped
422 Dent Mater J 2015; 34(4): 417–424
off and thus the loading process was automatically stopped. Chipping failure of the specimens was accompanied by a release of AE signals of high amplitude, demarcating the catastrophic fracture of the specimens. These events are evidently shown in Fig. 2a.
In UFRC and MFRC groups, the fractured fragments of specimens were kept in place by the underlying reinforcing fibers. Presence of the fibers resulted in a gradual rather than a sudden drop of the loading force, as observed in the NRC group. Nonetheless, the fibers began to break gradually. After initial failure occurs, which is usually caused by microcracking of the matrix, a part of the strain energy is released as a wave that propagates through the structure. As the crack propagates from one fiber to another in FRCs, the fibers absorb the energy of the wave propagation. This decreases the energy of the final failure, making the final failure less catastrophic in the form of localized chippings and limited fractures. Therefore, fibers convert the fracture mode of composites from an instantaneous occurrence to an extended process12). From a clinical point of view, keeping the fractured pieces linked together may prevent swallowing or aspiration of the displaced pieces. Particularly in the MFRC group, no separation of the broken pieces was observed. This was probably because the fibers of this group were bidirectionally oriented at 90° to each other. Therefore, less fracture lines were expected and this was proven by the fewer AE signals detected for this group40).
At initial fracture, mean AE amplitudes ranged between 57.1 and 68.2 dB and were higher in UFRC and MFRC groups. At final failure, they ranged between 87.3 and 96.2 dB. In all the groups, AE amplitudes at initial failure were found to be significantly lower than those at final fracture. Signals released at initial failure were believed to be caused by small cracks, while those at final failure were caused by more catastrophic fracture. On this premise, it was concluded that AE amplitude might be an indication of fracture severity. This agreed with previous studies which indicated that plastic deformation of the matrix and fibers produced continuous signals of low amplitudes; on the other hand, cracking of the resin matrix or reinforcing fibers or debonding of the fibers generated burst-type signals of higher amplitudes41).
Watanabe et al.20) found a positive linear relationship between AE activity, in terms of cumulative counts and load for initiation of acoustic signals, and the final failure load. In the present study, AE amplitude was analyzed instead of signal counts. Although it was evident that AE at final fracture was significantly higher than AE at initial failure, no significant correlations were found between AE amplitude at initial failure and initial failure strength nor between AE at final failure and final fracture strength. Differences between the present study and that of Watanabe et al.20) could be related to differences in the materials used.
CONCLUSIONS
Within the limitations of this study, the following conclusions were drawn:
1. Fiber reinforcement with unidirectional or multidirectional glass fibers significantly improved the fracture resistance of composite resin materials and changed the fracture pattern to one of less catastrophic failure.
2. AE analysis provided valuable information regarding the fracture process of dental composite materials.
REFERENCES
1) Goldberg AJ, Burstone CJ. The use of continuous fiber reinforcement in dentistry. Dent Mater 1992; 8: 197-202.
2) Cacciafesta V, Sfondrini MF, Lena A, Scribante A, Vallittu PK, Lassila LV. Flexural strengths of fiber-reinforced composites polymerized with conventional light-curing and additional postcuring. Am J Orthod Dentofacial Orthop 2007; 132: 524-527.
3) Behr M, Rosentritt M, Leibrock A, Schneider-Feyrer S, Handel G. In-vitro study of fracture strength and marginal adaptation of fibre-reinforced adhesive fixed partial inlay dentures. J Dent 1999; 27: 163-168.
4) Loose M, Rosentritt M, Leibrock A, Behr M, Handel G. In vitro study of fracture strength and marginal adaptation of fibre-reinforced-composite versus all ceramic fixed partial dentures. Eur J Prosthodont Restor Dent 1998; 6: 55-62.
5) van Heumen CC, Kreulen CM, Bronkhorst EM, Lesaffre E, Creugers NH. Fiber-reinforced dental composites in beam testing. Dent Mater 2008; 24: 1435-1443.
6) Ereifej N, Silikas N, Watts DC. Edge strength of indirect restorative materials. J Dent 2009; 37: 799-806.
7) Obukuro M, Takahashi Y, Shimizu H. Effect of diameter of glass fibers on flexural properties of fiber-reinforced composites. Dent Mater J 2008; 27: 541-548.
8) Kolbeck C, Rosentritt M, Behr M, Lang R, Handel G. In vitro study of fracture strength and marginal adaptation of polyethylene-fibre-reinforced-composite versus glass-fibre-reinforced-composite fixed partial dentures. J Oral Rehabil 2002; 29: 668-674.
9) Chong KH, Chai J. Strength and mode of failure of unidirectional and bidirectional glass fiber-reinforced composite materials. Int J Prosthodont 2003; 16: 161-166.
10) Tezvergil-Mutluay A, Vallittu PK. Effects of fiber-reinforced composite bases on microleakage of composite restorations in proximal locations. Open Dent J 2014; 8: 213-219.
11) Garoushi S, Vallittu PK, Lassila LV. Use of short fiber-reinforced composite with semi-interpenetrating polymer network matrix in fixed partial dentures. J Dent 2007; 35: 403-408.
12) Turkaslan S, Tezvergil-Mutluay A, Bagis B, Vallittu PK, Lassila LV. Effect of fiber-reinforced composites on the failure load and failure mode of composite veneers. Dent Mater J 2009; 28: 530-536.
13) Darvell BW. In: Darvell BW (ed.). Mechanical testing in materials science for dentistry. 7th edition. Hong Kong: Quintessence publishing; 2002. pp. 1-35.
14) Ban S, Anusavice KJ. Influence of test method on failure stress of brittle dental materials. J Dent Res 1990; 69: 1791-1799.
15) Alander P, Lassila LV, Tezvergil A, Vallittu PK. Acoustic emission analysis of fiber-reinforced composite in flexural testing. Dent Mater 2004; 20: 305-312.
16) Jeffers JR, Browne M, Taylor M. Damage accumulation,
423Dent Mater J 2015; 34(4): 417–424
fatigue and creep behaviour of vacuum mixed bone cement. Biomaterials 2005; 26: 5532-5541.
17) Ereifej N, Silikas N, Watts DC. Initial versus final fracture of metal-free crowns, analyzed via acoustic emission. Dent Mater 2008; 24: 1289-1295.
18) Kou W, Kou S, Liu H, Sjogren G. Numerical modeling of the fracture process in a three-unit all-ceramic fixed partial denture. Dent Mater 2007; 23: 1042-1049.
19) Kohn DH. Acoustic emission and nondestructive evaluation of biomaterials and tissues. Crit Rev Biomed Eng 1995; 23: 221-306.
20) Watanabe Y, Takai S, Arai Y, Yoshino N, Hirasawa Y. Prediction of mechanical properties of healing fractures using acoustic emission. J Orthop Res 2001; 19: 548-553.
21) Dyer SR, Sorensen JA, Lassila LV, Vallittu PK. Damage mechanics and load failure of fiber-reinforced composite fixed partial dentures. Dent Mater 2005; 21: 1104-1110.
22) Fennis WM, Tezvergil A, Kuijs RH, Lassila LV, Kreulen CM, Creugers NH, Vallitu PK. In vitro fracture resistance of fiber reinforced cusp-replacing composite restorations. Dent Mater 2005; 21: 565-572.
23) Kim KH, Kim YB, Okuno O. Microfracture mechanisms of composite resins containing prepolymerized particle fillers. Dent Mater J 2000; 19: 22-33.
24) Yi YJ, Kelly JR. Failure responses of a dental porcelain having three surface treatments under three stressing conditions. Dent Mater 2011; 27: 1252-1258.
25) Lin CL, Chang YH, Pai CA. Evaluation of failure risks in ceramic restorations for endodontically treated premolar with MOD preparation. Dent Mater 2011; 27: 431-438.
26) Lin CT, Lee SY, Tsai TY, Dong DR, Shih YH. Degradation of repaired denture base materials in simulated oral fluid. J Oral Rehabil 2000; 27: 190-198.
27) Cho NY, Ferracane JL, Lee IB. Acoustic emission analysis of tooth-composite interfacial debonding. J Dent Res 2013; 92: 76-81.
28) Li H, Li J, Yun X, Liu X, Fok AS. Non-destructive examination of interfacial debonding using acoustic emission. Dent Mater 2011; 27: 964-971.
29) Lin CL, Kuo WC, Yu JJ, Huang SF. Examination of ceramic restorative material interfacial debonding using acoustic emission and optical coherence tomography. Dent Mater 2013; 29: 382-388.
30) ISO 4049. Dentistry —Polymer-based filling, restorative and luting materials. Geneva, Switzerland: International Organization for Standardization; 2007.
31) Vakiparta M, Yli-Urpo A, Vallittu PK. Flexural properties of glass fiber reinforced composite with multiphase biopolymer matrix. J Mater Sci Mater Med 2004; 15: 7-11.
32) Ozcan M, Breuklander MH, Vallittu PK. The effect of box preparation on the strength of glass fiber-reinforced composite inlay-retained fixed partial dentures. J Prosthet Dent 2005; 93: 337-345.
33) Wang Y, Darvell BW. Failure mode of dental restorative materials under Hertzian indentation. Dent Mater 2007; 23: 1236-1244.
34) Eronat N, Candan U, Turkun M. Effects of glass fiber layering on the flexural strength of microfill and hybrid composites. J Esthet Restor Dent 2009; 21: 171-178; discussion 179-181.
35) Karbhari VM, Strassler H. Effect of fiber architecture on flexural characteristics and fracture of fiber-reinforced dental composites. Dent Mater 2007; 23: 960-968.
36) Lee SY, Lin CT, Wang MH, Tseng H, Huang HM, Dong DR, Pan LC, Shih YH. Effect of temperature and flux concentration on soldering of base metal. J Oral Rehabil 2000; 27: 1047-1053.
37) Al-Darwish M, Hurley RK, Drummond JL. Flexure strength evaluation of a laboratory-processed fiber-reinforced composite resin. J Prosthet Dent 2007; 97: 266-270.
38) Bouillaguet S, Schutt A, Alander P, Schwaller P, Buerki G, Michler J, Cattani-Lorente M, Villittu PK, Kreici I. Hydrothermal and mechanical stresses degrade fiber-matrix interfacial bond strength in dental fiber-reinforced composites. J Biomed Mater Res B Appl Biomater 2006; 76: 98-105.
39) McDonough WG, Antonucci JM, Dunkers JP. Interfacial shear strengths of dental resin-glass fibers by the microbond test. Dent Mater 2001; 17: 492-498.
40) Stiesch-Scholz M, Schulz K, Borchers L. In vitro fracture resistance of four-unit fiber-reinforced composite fixed partial dentures. Dent Mater 2006; 22: 374-381.
41) Duray SJ, Lee SY, Menis DL, Gilbert JL, Lautenschlager EP, Greener EH. Laser acoustic emission thermal technique (LAETT): a technique for generating acoustic emission in dental composites. Dent Mater 1996; 12: 13-18.
424 Dent Mater J 2015; 34(4): 417–424