fracture behaviour and defect assessment of brazed steel joints … · 2020. 11. 30. ·...
TRANSCRIPT

17th European Conference on Fracture2 -5 September,2008, Brno, Czech Republic
Fracture Behaviour and Defect Assessment of Brazed Steel Joints
Christian Leinenbach 1,a, Hans-Jakob Schindler 2,b, Tanya A. Ba�er 1,c, Niklaus Rüttimann 3,d, Konrad Wegener 3,e
1EMPA - Swiss Federal Laboratories for Materials Testing and Research, Dübendorf, Switzerland 2 MatTec AG, Winterthur, Switzerland
3 ETH Zürich, Institute of Machine Tools and Manufacturing, Zürich, Switzerland [email protected], [email protected], [email protected],
[email protected], [email protected]
Keywords: Brazing, fracture toughness, defect assessment, failure assessment diagram
Abstract. Brazed components are widely applied in industry and are often subjected to complex loading conditions. Even if such components often contain brazing defects, no failure assessment procedures for brazed joints are reported in the literature. In this work, the deformation as well as the quasistatic and cyclic fracture behaviour of brazed joints of the martensitic stainless steel X3CrNiMo13-4 was investigated. This included the determination of stress-strain-curves as well as of the fracture toughness. In addition, the mechanical behaviour of component like specimens with T-joint geometry under tensile loading was characterized. In order to consider the effect of brazing defects on the structural integrity, typical defects with different sizes and geometries were introduced in the brazing zone. The experimentally determined material parameters were used for additional numerical deformation analyses by means of finite elements. Both the experimental and the numerical results provided a basis for the engineering defect assessment of brazed components based on failure assessment diagrams.
Introduction High temperature (HT) furnace brazing is widely applied in industry as a quick and cost-effective method for joining large components used in the aerospace and the chemical industry as well as for power generation, e.g. compressor impellers or turbine parts [1]. These components are subjected to complex loading conditions in service, comprising mechanical, thermal or thermo-mechanical loads. Brazed joints form a heterogeneous anisotropic system consisting of base material, diffusion zone and filler metal. The different elastic properties of the filler metal and the base material result in complex triaxial stresses in the brazing zone which considerably affect the joint strength [2]. During brazing, defects such as pores or incomplete gap filling may arise and act as stress concentrations, leading to crack growth and spontaneous failure. Thus, defect assessment of brazed components is of practical interest, but up to now no information on the applicability of defect assessment procedures developed for bulk materials or weld joints such as the R6 method on brazed components is available [3, 4]. In this work, the mechanical performance as well as the quasistatic and cyclic fracture behaviour of HT brazed specimens of the martensitic stainless steel X3CrNiMo13-4 and the filler metal Au-18Ni was characterized. The experimentally obtained material parameters were used for additional numerical stress and strain analyses by finite element (FE) methods. The aim was to develop a defect assessment procedure for brazed components.
Mechanical Properties and Fracture Behaviour of Brazed Joints
Materials and Brazing Process. In this study, the martensitic stainless steel X3CrNiMo13-4, which is widely applied in the chemical industry and in power generation, was used as base material. As filler metal, foils of the binary alloy Au-18Ni with a thickness of 100 �m were applied.
2121

17th European Conference on Fracture2 -5 September,2008, Brno, Czech Republic
Cuboidal steel plates with the dimensions 300x100x25 mm were brazed using a special brazing jig. Brazing was performed in an industrial shielding gas furnace (SOLO Profitherm 600) at a temperature of 1020 °C for 20 minutes. Hydro-Argon 7 (93 vol.-% Ar, 7 vol.-% H2) was used as shielding gas. The addition of hydrogen to the argon allows removing the oxide film on the stainless steel surface, which is essential for filler metal wetting. After brazing, the specimens were tempered at 520 C for 5.5 h in nitrogen atmosphere. With this process a homogenous braze joint with a brazing zone width of 100 �m was obtained.
Strength and Fracture Behaviour. In order to determine the mechanical properties of the steel
joints, standard round tensile specimens with a diameter of 10 mm and a gauge length of 50 mm as well as tubular specimens with an outer diameter of 16 mm and an inner diameter of 12 mm for quasi-static torsion tests were manufactured from the brazed steel plates. The fracture behaviour under quasi-static and cyclic loading was investigated using Double Cantilever Beam (DCB) specimens with the dimensions Bx2hxt = 90x60x8 mm. For all specimen types, the brazing zone was positioned in the middle of the samples. After machining of the DCB specimens a notch was introduced into the brazing zone by electro discharge machining (EDM) using a wire with a diameter of 0.3 mm.
Tensile tests were performed on a standard electro-mechanical testing machine (Schenck Trebel RSA 250kN) with a deformation velocity of 10 mm/min. Torsion tests were performed on a biaxial servo-hydraulic testing machine (Schenck Hydropuls PTT S59). The axial load was held constantly at 0 kN and the torsion rate was set to 0.05 °s-1. The ultimate shear stress �max can be calculated from the maximum measured torque at fracture as �max = Mmax/Wp, where Wp = 5.5x10⁻⁷ m3 denotes the section modulus for the given geometry.
The quasi-static fracture behaviour was characterized on the same electro-mechanical testing machine as the tensile tests. The fracture toughness for mode I loading was determined from load-displacement curves. The crack mouth opening displacement (CMOD) was measured with a special clip gauge. The stress intensity KI as well as the CMOD as functions of the specimen geometry and the applied load were derived in [5] and can be written as:
5.02
5.0 1225.138 ���
����
����
���ha
ha
BhFKI . (1a)
���
����
�
3
23
2
2 12425.13624.6882hdaa
hada
hda
BEFCMOD . (1b)
where F is the applied force, B and h the specimen geometry as described above, a the total crack length measured from the load initiation point, d the distance between the load initiation point and the specimen edge and E Young’s modulus.
Fatigue crack propagation tests were performed on a resonant testing machine (Rumul Type 8601). The load form was a sinusoidal constant amplitude. The initial testing frequency depended on the specimen geometry and was in the range of 60-65 Hz. The crack length was periodically measured using two travelling light microscopes on both sides of the DCB specimen. The specimens were cyclically loaded until a fatigue crack with a length of approximately 2 mm was detected. The fatigue crack propagation curve for a constant load ratio of R = 0.1 was determined. The fatigue threshold value �Kth, which was defined as the stress intensity range at which the crack propagation rate da/dN achieved a value of 10-10 m/cycle was determined in load decrease tests according to ASTM E647 [6]. In addition, the crack length as a function of the number of loading cycles was measured in constant load tests at R = 0.1.
2122

17th European Conference on Fracture2 -5 September,2008, Brno, Czech Republic
In Fig. 1 the applied load is presented as a function of the CMOD for four DCB specimens. The load increases linearly with increasing CMOD until local instabilities (‘pop-ins’) occurred between 9.2 and 10 kN. The load at which the first pop-in could be detected was used for the calculation of the critical stress intensity, KIc, according to eq. 1a). Figure 1b) shows the corresponding crack growth resistance curves. It can be clearly seen that with increasing crack length the fracture toughness remains almost constant at values of approximately 50 MPa m0.5.
In Table 1, the mechanical properties of the base material and of the braze joint are summarized. The results are average values over 3-4 tests. All specimens fractured in the brazing zone. Brazed specimens showed nearly the same yield and tensile strength as the base material, whereas significant differences were detected under torsion loading. This is a result of the pronounced constraining effect that the surrounding base material imposes on the thin braze layer, which prevents the latter from yielding as long as the former remains essentially elastic [2].
(a)
0.0 0.5 1.0 1.50
2
4
6
8
10
12
F [k
N]
CMOD [mm]
X3CrNiMo13-4 - AuNi18
(b)
0 5 10 15 20 25 300
10
20
30
40
50
60
K I [MPa
m1/
2 ]
�a [mm]
X3CrNiMo13-4 - AuNi18
Fig. 1: (a) Load-CMOD curves and (b) crack growth resistance curves taken from DCB-specimens Table 1. Mechanical properties of X3CrNiMo 13-4 and X3CrNiMo13-4 – Au-18Ni braze joints Rp0.2
[MPa] Rm
[MPa] A5 [%]
�e [MPa]
�max [MPa]
KIc [MPa m0.5]
X3CrNi 13-4 920 ± 5 975 ± 25 17.5 ± 2.5 620 ± 5 660 ± 10 ~270 X3CrNi13-4 - AuNi18 923 ± 7 976 ± 15 6 ± 0.5 245 ± 10 539 ± 7 49 ± 1.5
Figure 2a) shows the measured da/dN-�K curve, which has a rather linear shape on the double
logarithmic scale over the whole testing range. With respect to the large scatter at low crack growth rates, the threshold value was estimated to be �Kth = 9 MPa m0.5. The curve could not be clearly divided into the threshold range, the Paris range and the fast crack propagation range. It should be noted that the slope of the curve is very high compared to homogeneous metals. For crack propagation rates between 10-9 and 10-5 m/cycles a curve fit was performed according to the Paris equation:
nKCdNda
� . (2)
2123

17th European Conference on Fracture2 -5 September,2008, Brno, Czech Republic
The parameters C and n were estimated to 1.309E-22 and 11.165, respectively. Corresponding to the slope of the da/dN curve, the Paris exponent, n, is very high compared to homogeneous materials, which means that the fatigue crack growth rate of brazed components is extremely sensitive to the load range. This behaviour was confirmed in constant load tests which were performed at load ranges of �F = 4.6 kN, �F = 5.7 kN and �F = 6.8 kN, corresponding to initial stress intensity ranges of �K = 16 MPa m0.5, �K = 19 MPa m0.5 and �K = 23 MPa m0.5. It can be seen that a relatively slight increase of the applied load leads to a pronounced increase of the crack length over a certain number of loading cycles, i.e. the crack growth rate.
(a)
1 10 1001E-11
1E-10
1E-9
1E-8
1E-7
1E-6
1E-5
1E-4R = 0.1
�K [MPa m1/2]
da/d
N [m
/cyc
le]
(b)
0 5 10 15 200
5
10
15
20
25
�F = 6.8 kN �F = 5.7 kN �F = 4.6 kN
a [m
m]
N [104]
R = 0.1
Fig. 2: Fatigue crack propagation, (a) da/dN-�K curve at R = 0.1, (b) crack growth over number of loading cycles in constant load tests
Mechanical Properties of the Filler Metal. The elastic-plastic material properties of the Au-
18Ni filler metal are important for FE simulations of the deformation behaviour of brazed joints. However, these parameters cannot be easily evaluated from the above mentioned tensile and torsion tests. In a first approximation, the yield and the tensile strength of the filler metal can be estimated by the von-Mises-criterion to about twice the corresponding values for torsion loading, �e and �max, respectively (cf. Table 1).
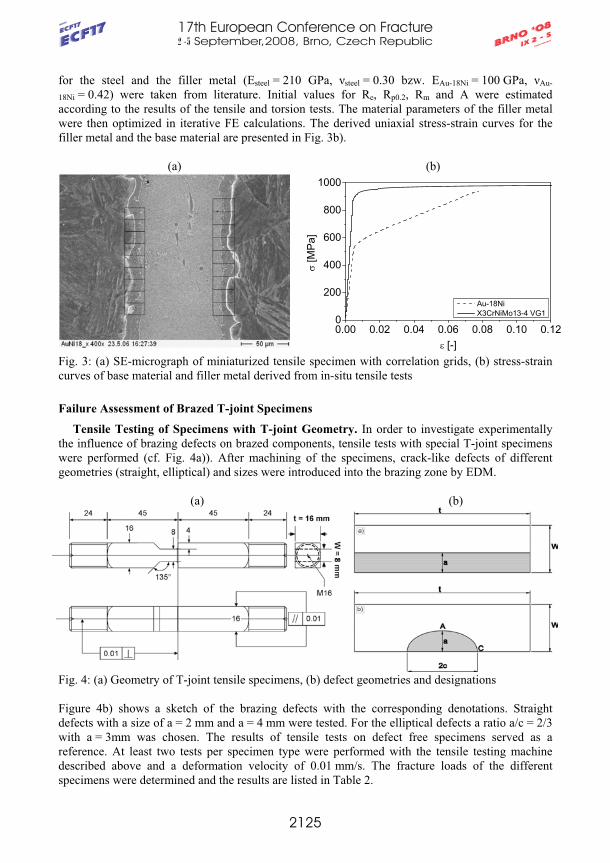
In order to determine the stress-strain-curve of the filler metal more precisely, in situ tensile tests inside a scanning electron microscope (SEM) were performed. Miniaturized dog bone shaped tensile specimens with a width of 5 mm and a thickness of 1.5 mm were clamped in a special testing device (Kammrath & Weiss) and tested at a constant deformation velocity of 0.5 �m/s to fracture. The test was interrupted at certain load levels and a sequence of high quality micrographs as a function of the applied load was taken.
On the digital images, two correlation grids with 9x1 cells were positioned along the interfaces between the steel and the filler metal (cf. Fig. 3a)). The displacement of characteristic features inside the marker zones was detected by digital image correlation, using a correlation algorithm developed at EPF Lausanne [7]. The applied stress-strain curve of the filler metal was derived from the load-displacement curves by averaging 8 individual measurements.
The uniaxial stress-strain curve was determined by comparing the experimental results with the results of additional FE calculations. A 3D model of the tensile specimen including the brazing zone was created using the commercial FE Code AnsysTM, taking into account specimen symmetries. The stress-strain behaviour of the steel joints was assumed to follow Hooke’s law in the elastic range and a power law according to Ludwik in the plastic range . The elastic parameters
2124
17th European Conference on Fracture2 -5 September,2008, Brno, Czech Republic
for the steel and the filler metal (Esteel = 210 GPa, �steel = 0.30 bzw. EAu-18Ni = 100 GPa, �Au-
18Ni = 0.42) were taken from literature. Initial values for Re, Rp0.2, Rm and A were estimated according to the results of the tensile and torsion tests. The material parameters of the filler metal were then optimized in iterative FE calculations. The derived uniaxial stress-strain curves for the filler metal and the base material are presented in Fig. 3b).
(a) (b)
0.00 0.02 0.04 0.06 0.08 0.10 0.120
200
400
600
800
1000
[M
Pa]
� [-]
Au-18Ni X3CrNiMo13-4 VG1
Fig. 3: (a) SE-micrograph of miniaturized tensile specimen with correlation grids, (b) stress-strain curves of base material and filler metal derived from in-situ tensile tests
Failure Assessment of Brazed T-joint Specimens
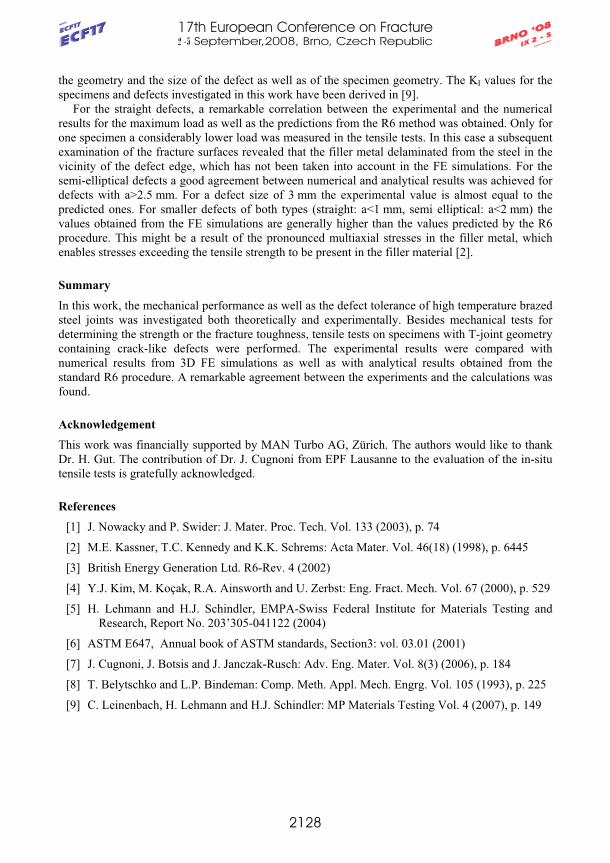
Tensile Testing of Specimens with T-joint Geometry. In order to investigate experimentally the influence of brazing defects on brazed components, tensile tests with special T-joint specimens were performed (cf. Fig. 4a)). After machining of the specimens, crack-like defects of different geometries (straight, elliptical) and sizes were introduced into the brazing zone by EDM.
(a) (b)
Fig. 4: (a) Geometry of T-joint tensile specimens, (b) defect geometries and designations Figure 4b) shows a sketch of the brazing defects with the corresponding denotations. Straight defects with a size of a = 2 mm and a = 4 mm were tested. For the elliptical defects a ratio a/c = 2/3 with a = 3mm was chosen. The results of tensile tests on defect free specimens served as a reference. At least two tests per specimen type were performed with the tensile testing machine described above and a deformation velocity of 0.01 mm/s. The fracture loads of the different specimens were determined and the results are listed in Table 2.
2125

17th European Conference on Fracture2 -5 September,2008, Brno, Czech Republic
Table 2: Measured limit loads of defect free and defect containing T-joint specimens
Defect type semi-elliptical, a = 3 mm
straight, a = 2 mm
straight, a = 4 mm no defect
Fmax [kN] 42.5 (±11.3)
33.1 (±18.0)
18.6 (±3.6)
123.3 (±7.0)
Numerical Simulation of Tensile Tests. The tensile tests on T-joint specimens were
additionally simulated by finite element methods. The aim was to numerically determine the critical limit loads. A 3D model of the complex joint geometries was created with the FE code ANSYSTM taking into account specimen symmetries. Ideal bonding between the steel and the filler metal was assumed. A mesh of hexalateral brick elements with 8 nodes (SOLID164) was created. In the brazing zone, the element size was set to 0.05 mm, whereas the element size in the base material was set to 0.5 mm. The mesh size was chosen as an optimum between the accuracy of the simulated load-displacement response of the joint and the finite element solution time. The model was then transferred to the FE code LS-DYNATM, which was used for any further calculations as well as for data post processing. The deformation behaviour was described by an elastic-plastic deformation law, with Hooke’s law describing the elastic part and the plastic part according to eq. (3):
npypy k )( �� � . (3)
where y is the yield stress, k is the hardening coefficient, �yp is the elastic strain at the beginning of plastic flow, �p is the logarithmic plastic von-Mises strain and n is the hardening exponent. The material parameters were taken from the stress-strain curves presented in Fig. 3b). In order to prevent hourglass phenomena at large deformations as well as necking, a Belytschko-Bindemann integration scheme was used [8]. The specimen was defined to fail when the critical stress intensity KIc according to Table 1 was reached in the region of the highest deformation.
(a) (b)
A
C
Fig. 5: FE model of T-joint tensile specimen (a), distribution of von-Mises-strains in the vicinity of a semi-elliptical defect
In Fig. 5a) the meshed specimen and the resulting von-Mises stresses of a specimen with a semi-elliptical defect subjected to tensile loading are presented. Figure 5b) shows the stress distribution in the vicinity of the defect. For a better visibility, the upper part of the T-joint specimen was removed from the picture. As expected the stress maxima are located at the edges of the defect.
2126

17th European Conference on Fracture2 -5 September,2008, Brno, Czech Republic
Defect Assessment of Brazed Steel Joints. In order to compare the experimental and numerical results with the predictions of a standard failure assessment procedure, a set of failure assessment diagrams (FAD) was constructed. In to contrast to the FAD in [3], which present the normalized stress intensity Kr as a function of the normalized load Lr and a limit curve according to the equation
� � 0.52 61 0.5 0.3 0.7exp( 0.6 )�
� � �� �r r rK L L with r I IcK K K and maxr mL R . (4)
where KI is the local stress intensity, KIc is the critical stress intensity factor, max is the maximal applicable nominal stress applied to the component and Rm the tensile strength according to Table 1, the FADs suggested in this work give directly the maximal applicable load Fmax as a function of the defect size a.
(a)
(b)
Fig. 6: Failure assessment diagrams – comparison between experimental, numerical and analytical results, a) straight defects, b) semi-elliptical defects Figure 6 shows the FADs for the straight (a) and the semi-elliptical (b) defects. Besides the results from the tensile tests (�) and the data obtained from the FE calculations (�), the theoretical load which only takes into account the reduction of the cross section in the brazing zone due to the defects,but not the corresponding stress concentrations (�) is presented. The results are compared with the maximum loads obtained from procedure according to R6, option 1 (�). KI is a function of
2127
17th European Conference on Fracture2 -5 September,2008, Brno, Czech Republic
the geometry and the size of the defect as well as of the specimen geometry. The KI values for the specimens and defects investigated in this work have been derived in [9].
For the straight defects, a remarkable correlation between the experimental and the numerical results for the maximum load as well as the predictions from the R6 method was obtained. Only for one specimen a considerably lower load was measured in the tensile tests. In this case a subsequent examination of the fracture surfaces revealed that the filler metal delaminated from the steel in the vicinity of the defect edge, which has not been taken into account in the FE simulations. For the semi-elliptical defects a good agreement between numerical and analytical results was achieved for defects with a>2.5 mm. For a defect size of 3 mm the experimental value is almost equal to the predicted ones. For smaller defects of both types (straight: a<1 mm, semi elliptical: a<2 mm) the values obtained from the FE simulations are generally higher than the values predicted by the R6 procedure. This might be a result of the pronounced multiaxial stresses in the filler metal, which enables stresses exceeding the tensile strength to be present in the filler material [2].
Summary In this work, the mechanical performance as well as the defect tolerance of high temperature brazed steel joints was investigated both theoretically and experimentally. Besides mechanical tests for determining the strength or the fracture toughness, tensile tests on specimens with T-joint geometry containing crack-like defects were performed. The experimental results were compared with numerical results from 3D FE simulations as well as with analytical results obtained from the standard R6 procedure. A remarkable agreement between the experiments and the calculations was found.
Acknowledgement This work was financially supported by MAN Turbo AG, Zürich. The authors would like to thank Dr. H. Gut. The contribution of Dr. J. Cugnoni from EPF Lausanne to the evaluation of the in-situ tensile tests is gratefully acknowledged.
References [1] J. Nowacky and P. Swider: J. Mater. Proc. Tech. Vol. 133 (2003), p. 74
[2] M.E. Kassner, T.C. Kennedy and K.K. Schrems: Acta Mater. Vol. 46(18) (1998), p. 6445
[3] British Energy Generation Ltd. R6-Rev. 4 (2002)
[4] Y.J. Kim, M. Koçak, R.A. Ainsworth and U. Zerbst: Eng. Fract. Mech. Vol. 67 (2000), p. 529
[5] H. Lehmann and H.J. Schindler, EMPA-Swiss Federal Institute for Materials Testing and Research, Report No. 203’305-041122 (2004)
[6] ASTM E647, Annual book of ASTM standards, Section3: vol. 03.01 (2001)
[7] J. Cugnoni, J. Botsis and J. Janczak-Rusch: Adv. Eng. Mater. Vol. 8(3) (2006), p. 184
[8] T. Belytschko and L.P. Bindeman: Comp. Meth. Appl. Mech. Engrg. Vol. 105 (1993), p. 225
[9] C. Leinenbach, H. Lehmann and H.J. Schindler: MP Materials Testing Vol. 4 (2007), p. 149
2128