fpga implementation of circularly shifted pts technique ... · rourkela, odisha, 769 008, india may...
TRANSCRIPT

Fpga implementation
of circularly shifted PTS
Technique for pAPr Reduction in
OFDM
A Thesis submitted in partial fulfillment of the Requirements for the degree of
Master of Technology
In
Electronics and Communication Engineering
Specialization: VLSI Design and Embedded System
By
seemanjali sahoo
Roll No. : 212EC2144
Department of Electronics and Communication Engineering
National Institute of Technology Rourkela
Rourkela, Odisha, 769 008, India
May 2014

fpga implementation of circularly
shifted PTS Technique for PAPR
Reduction in OFDM
A Thesis submitted in partial fulfillment of the Requirements for the degree of
Master of Technology In
Electronics and Communication Engineering
Specialization: VLSI Design and Embedded System
By
Seemanjali Sahoo
Roll No. : 212EC2144
Under the Guidance of
Prof. Sarat K. Patra
Department of Electronics and Communication Engineering
National Institute of Technology Rourkela
Rourkela, Odisha, 769 008, India
May 2014

Dedicated to…
My parents, brother and sister
My teachers

i
DEPT. OF ELECTRONICS AND COMMUNICATION
ENGINEERING
NATIONAL INSTITUTE OF TECHNOLOGY, ROURKELA
ROURKELA – 769008, ODISHA, INDIA
Certificate
This is to certify that the work in the thesis entitled FPGA Implementation of Circularly
Shifted PTS Technique for PAPR Reduction in OFDM by Seemanjali Sahoo is a
record of an original research work carried out by her during 2013 - 2014 under my
supervision and guidance in partial fulfillment of the requirements for the award of the
degree of Master of Technology in Electronics and Communication Engineering (VLSI
Design and Embedded System), National Institute of Technology, Rourkela. Neither this
thesis nor any part of it, to the best of my knowledge, has been submitted for any degree or
diploma elsewhere.
Place: NIT Rourkela Dr. Sarat Kumar Patra
Date: 31 May 2014 Professor

ii
DEPT. OF ELECTRONICS AND COMMUNICATION
ENGINEERING
NATIONAL INSTITUTE OF TECHNOLOGY, ROURKELA
ROURKELA – 769008, ODISHA, INDIA
Declaration I certify that
a) The work contained in the thesis is original and has been done by myself under the
general supervision of my supervisor.
b) The work has not been submitted to any other Institute for any degree or diploma.
c) I have followed the guidelines provided by the Institute in writing the thesis.
d) Whenever I have used materials (data, theoretical analysis, and text) from other
sources, I have given due credit to them by citing them in the text of the thesis and
giving their details in the references.
e) Whenever I have quoted written materials from other sources, I have put them
under quotation marks and given due credit to the sources by citing them and giving
required details in the references.
Seemanjali Sahoo
31st May 2014

iii
ACKNOWLEDGEMENT
It is my immense pleasure to avail this opportunity to express my gratitude, regards and
heartfelt respect to Prof. Sarat K. Patra, Department of Electronics and Communication
Engineering, NIT Rourkela for his endless and valuable guidance prior to, during and
beyond the tenure of the project work. His priceless advices have always lighted up my
path whenever I have struck a dead end in my work. It has been a rewarding experience
working under his supervision as he has always delivered the correct proportion of
appreciation and criticism to help me excel in my field of research.
I would like to express my gratitude and respect to Prof. K. K. Mahapatra, Prof. D. P.
Acharya, Prof. A. Swain, Prof. P. Tiwari, Prof. N. Islam, Prof. A.K. Sahoo, Prof. S.
Hiremath, Prof. S. Meher, and Prof. P. Singh for their support, feedback and guidance
throughout my M. Tech course duration. I would also like to thank all the faculty and staff
of ECE department, NIT Rourkela for their support and help during the two years of my
student life in the department.
I would like to make a special mention of the selfless support and guidance I received
from my senior Pallab Maji, J. R. Bhaskar, Prasanta K. Pradhan, Tom Varghese and
Jagannath P. Mohanty, Manas R. Biswal department of Electronics and Communication
Engineering, NIT Rourkela during my project work. Also I would like to thank my friends,
Sadananda Behera, Khusboo Mawatwal and Sangeeta Bhattacharjee for making my hours
of work in the laboratory enjoyable with their endless companionship and help as well. I
would like to thank all my friends in VLSI specialization for their companionship and help
related to any matter.
Last but not the least; I would like to express my love, respect and gratitude to my
parents, younger brother and sister, who have always supported me in every decision I have

iv
made, guided me in every turn of my life, believed in me and my potential and without
whom I would have never been able to achieve whatsoever I could have till date.
seemanjali Sahoo

v
ABSTRACT
In today‟s world, the ongoing trend in 4G has adopted multi-carrier transmission
schemes like OFDM, OFDMA and MIMO-OFDM. OFDM has proven to be one of the
most promising schemes used for transmission of signals. It still exists with some of the
drawbacks, out of which, the high peak to average power ratio gives rise to non-linear
distortion, inter-symbol interference and out-of-band radiation. There has been various
ways developed and implemented to reduce peak to average power ratio. Comparing
between all the techniques to reduce peak to average power ratio, it has been found that the
best method is partial transmit sequence technique. This technique was first proposed by
Muller and Huber in the year 1997. Within the years there have been various modifications
with this technique which has been proposed and implemented. Today‟s world is a digital
world where an analog form of communication can be transformed to digital form of
communication. Weste and Skellern were the first to propose the OFDM method in VLSI.
The partial transmit sequence technique in FPGA has been proposed by Junjun et.al. and
Varahram et.al. In this thesis work an efficient FPGA implementation of circularly shifted
partial transmit sequence (CS-PTS) scheme for peak-to-average power ratio (PAPR)
reduction in orthogonal frequency division multiplexing (OFDM) signals has been carried
out. It eliminates the search for optimum phase factors from a given set, which manifests
improved PAPR at reduced computational complexity as compared to conventional PTS
(C-PTS). The amplitude of the signal is reduced by rotating each of the partially
transmitted sequence anti-clockwise by a pre-determined degree and the peak power is
reduced by circularly shifting the quadrature component of the partially transmitted
sequence after phase rotation. A brief description of C-PTS and CS-PTS is also presented
and VHDL implementation of Circularly Shifted PTS is designed. The peak-to-average

vi
power ratio performance of the proposed method has been investigated. Moreover, the peak
to average power ratio calculation in VHDL is proposed and implemented. The CS-PTS is
implemented in an FPGA (XC5VLX110T-1FF1136) and the synthesis results have been
verified with the help of Chip Scope Pro.
vii
CONTENTS
ACKNOWLEDGEMENT .............................................................................................. III
ABSTRACT ................................................................................................................. V
CONTENTS ............................................................................................................... VII
NOMENCLATURE...................................................................................................... IX
ABBREVIATIONS ....................................................................................................... X
LIST OF FIGURES ................................................................................................... XIII
LIST OF TABLES ...................................................................................................... XV
1 OFDM AND PEAK TO AVERAGE POWER RATIO: AN INTRODUCTION ............. 1
1.1 Introduction to OFDM .............................................................................................. 2
1.1.1 Advantages of OFDM .............................................................................................. 3
1.1.2 Disadvantages of OFDM .......................................................................................... 3
1.2 OFDM Transceiver .................................................................................................... 4
1.2.1 OFDM Transmitter [3] ............................................................................................. 4
1.2.2 OFDM Receiver [3] ................................................................................................. 4
1.3 Applications of OFDM .............................................................................................. 5
1.4 Peak to Average Power Ratio in OFDM ................................................................. 5
1.5 PAPR Reduction Techniques ................................................................................... 6
1.5.1 Criteria for selection of PAPR Reduction Techniques ............................................. 6
1.6 Motivation .................................................................................................................. 8
1.7 Objective of the Work ............................................................................................... 9

viii
1.8 Literature Review .................................................................................................... 10
1.9 Thesis Organization ................................................................................................. 11
2 PARTIAL TRANSMIT SEQUENCE TECHNIQUE FOR PAPR REDUCTION ........ 13
2.1 Partial Transmit Sequence Technique .................................................................. 13
2.1.1 PTS Technique: Algorithm .................................................................................... 14
2.1.2 PTS Technique: Mathematical analysis ................................................................. 15
2.2 Advantages and Disadvantages .............................................................................. 16
2.2.1 Advantages of PTS Technique ............................................................................... 16
2.2.2 Disadvantages of PTS Technique .......................................................................... 17
3 CIRCULARLY SHIFTED PTS TECHNIQUE .......................................................... 18
3.1 Circularly Shifted PTS: Design Approach and Algorithm .................................. 18
3.2 Circularly Shifted PTS: FPGA Implementation .................................................. 21
3.2.1 Xilinx ISE 14.2 with XC5VLX110T-1FF1136 ...................................................... 21
3.2.2 PAPR Calculation in VHDL .................................................................................. 23
3.2.3 Experimental Setup ................................................................................................ 24
3.3 Simulation Results and Discussions ....................................................................... 25
3.3.1 Simulation Results in MatLab ................................................................................ 25
3.3.2 Simulation and Synthesis Results in FPGA ........................................................... 27
3.4 Timing Analysis of FPGA Implementation ........................................................... 34
4 CONCLUSION ........................................................................................................ 35
4.1 Future Work ............................................................................................................ 36
DISSEMINATION: ...................................................................................................... 37
BIBLIOGRAPHY: ....................................................................................................... 38

ix
NOMENCLATURE
N : Number of sub-carriers
: Subcarrier spacing
T : Period for pulse-shaping symbol
M : Number of sub-blocks in PTS
W : Number of allowed phase factors
: mth allowed phase factor
: Phase value of mth allowed phase factor
Xm : mth sub-block
: mth
PTS
Pav : Average power
Ppeak : Peak power
PAPRth : Threshold PAPR
: Shift matrix
: Transmitted signal
: In-phase component
: Quadrature phase component

x
ABBREVIATIONS
ADC : Analog to Digital Converter
AWGN : Additive white Gaussian noise
BER : Bit Error Rate
BPSK : Binary Phase Shift Keying
BTS : Base Transmit Station
CCDF : Complementary Cumulative Distribution Function
CCS : Code Composer Studio
CMOS : Complementary Metal Oxide Semiconductor
CPU : Central Processing Unit
DAB : Digital Audio Broadcasting
DAC : Digital to Analog Converter
dB : Decibel
DFT : Discrete Fourier Transform
DSK : Digital Signal Processor Starter Kit
DSO : Digital Storage Oscilloscope
DSP : Digital Signal Processor
DVB : Digital Video Broadcasting
FFT : Fast Fourier Transform
FPGA : Field Programmable Gate Array
GB : Gigabytes
GHz : Giga Hertz
IDFT : Inverse Discrete Fourier Transform
IFFT : Inverse Fast Fourier Transform
IP : Internet Protocol
IQ : In-phase and Quadrature

xi
ISI : Inter-symbol Interference
JTAG : Joint Test Action Group
KHZ : Kilo Hertz
LED : Light Emitting Diodes
LTE : Long Term Evolution
MC : Multi-carrier
MCCDMA : Multicarrier Code Division Multiple Access
MFLOPs : Mega Floating-Point Operations Per Second
MHz : Mega Hertz
MIMO : Multiple Input Multiple Output
MIPs : Million Instructions per Second
OFDM : Orthogonal Frequency Division Multiplexing
OFDMA : Orthogonal Frequency Division Multiple Access
PA : Power Amplifier
PAN : Personal Area Network
PAPR : Peak to Average Power Ratio
PTS : Partial Transmit Sequence
RAM : Random Access Memory
RF : Radio Frequency
SC-FDMA : Single Carrier Frequency Division Multiple Access
SDRAM : Synchronous dynamic random access memory
SER : Symbol Error Rate
SNR : Signal to Noise Ratio
TI : Texas Instruments
USB : Universal Serial Bus
VHDL : Very-high-speed-integrated-circuit Hardware Description Language
VLSI : Very Large Scale Integration

xii
WiMAX : Worldwide Interoperability for Microwave Access
WLAN : Wireless Local Area Network

xiii
LIST OF FIGURES
Figure 1-1: Block Diagram of OFDM Transmitter ............................................................... 4
Figure 1-2: Block Diagram of OFDM Receiver .................................................................... 5
Figure 2-1: Block Diagram for Conventional Partial Transmit Sequence Technique ........ 15
Figure 3-1: Block Diagram for Circularly Shifted Partial Transmit Sequence................... 19
Figure 3-2: Block Diagram for Inverse Fast Fourier Transform in VHDL ........................ 22
Figure 3-3: Block Diagram for Peak to Average Power Ratio Calculation in VHDL ........ 23
Figure 3-4: Block Diagram for Circularly Shifted PTS in Xilinx (vhdl).............................. 24
Figure 3-5: CCDF of PAPR with N=64, M=4 and P=8, Q=8 for OFDM without PTS, with
conventional PTS and with circularly shifted PTS ............................................................... 25
Figure 3-6: CCDF of PAPR with N=64, M=4 and P=16, Q=8 for OFDM without PTS,
with conventional PTS and with circularly shifted PTS ....................................................... 26
Figure 3-7: CCDF of PAPR with N=128, M=4 and P=8, Q=8 for OFDM without PTS,
with conventional PTS and with circularly shifted PTS ....................................................... 27
Figure 3-8: Testbench Waveform for PRDG ....................................................................... 27
Figure 3-9: Testbench Waveform for SIPO ......................................................................... 28
Figure 3-10: Testbench Waveform for Signal Mapping ...................................................... 28
Figure 3-11: Testbench Waveform for Subblock Partitioning ............................................. 29
Figure 3-12: Testbench Waveform for IFFT ........................................................................ 29
Figure 3-13: Testbench Waveform for Circular Shifting ..................................................... 30
Figure 3-14: Testbench Waveform for Squaring ................................................................. 30
Figure 3-15: Testbench Waveform for Division .................................................................. 30
Figure 3-16: Testbench Waveform for Circularly Shifted PTS ............................................ 31
Figure 3-17: Waveform From Chipscope Pro for Circularly Shifted PTS .......................... 31

xiv
Figure 3-18: Waveform From Chipscope Pro for Circularly Shifted PTS with PAPR values
.............................................................................................................................................. 32

xv
LIST OF TABLES
Table 1-1: Comparison of PAPR Reduction Techniques ....................................................... 7
Table 1-2: A Literature Review Related to the Work Done ................................................. 10
Table 3-1: Resources Utilization Summary ......................................................................... 32
Table 3-2: Performance Comparison .................................................................................. 33

1
1
OFDM AND PEAK TO AVERAGE POWER
RATIO: AN INTRODUCTION
There has been a vast advance in wireless communication industry with changes from
analog to digital, circuit switched to IP-centric platforms and from narrowband to
broadband. The 2nd
generation evolved with single carrier transmission but due to its
limitations in bandwidth and data rates, multi-carrier transmission of data came into
existence.
The most significant and widely used multi-carrier transmission system is Orthogonal
Frequency Division Multiplexing (OFDM). It was first introduced by R.W. Chang in 1966
and was patented in 1970. With the years ahead the applications of OFDM increased
rapidly. The first commercial OFDM based wireless system came up in 1995 in the form
of Digital Audio Broadcasting (DAB) standards. The development in the field of OFDM
continued in parallel to all other simultaneously existing technologies until the major 21st
century wireless standards like WLAN, WiMAX and LTE started using OFDM in one way
or the other.
The 4G wireless technology has adopted OFDM transmission supporting high data rate
communications [1]. OFDM is a multicarrier technique which converts frequency selective

2
channel to several flat fading channels eliminating ISI. International standards like
European Digital Video Broadcasting (DVB), Wireless LAN (IEEE 802.11 a/g), Wireless
MAN (IEEE 802.16e) have adopted the OFDM method [1].
OFDM employed in transmission systems exhibits very high peak-to-average power
ratio. The high PAPR drives the power amplifier to operate in non-linear region which
causes inter-modulation distortions and out-of-band radiations. So, it is highly essential to
reduce PAPR. For the same, various techniques have been employed such as coding,
companding, amplitude clipping and filtering, active constellation extension (ACE), tone
reservation (TR), tone injection (TI), selected mapping (SLM), partial transmit sequence
(PTS) [1, 2]. Among these, PTS is considered to be a suitable scheme for PAPR reduction
whereas; its computational complexity is very high.
In this chapter, an introduction to OFDM and PAPR with its advantages and
disadvantages are described. Motivation, objective and literature review of the project has
been outlined. Finally, the thesis organization is presented in brief.
1.1 Introduction to OFDM
In an OFDM system, the serial data stream to be transmitted is divided into parallel data
stream constituting series of frames. All bits/symbols in a frame is modulated by
subcarriers, = [ (0), (1), , ( -1)]T, which are orthogonal. This is achieved by
considering, where denotes the duration of OFDM symbol, is the subcarrier
spacing and is number of subcarriers. After modulation, the frequency domain symbol is
converted to time domain symbol with an -point IFFT operation. The transmitted symbol
is given by,
, 0 ≤ ≤ (1.1)
where is the data block period.

3
1.1.1 Advantages of OFDM
Spectral Efficiency is high: The spectral efficiency is very high as because of the
orthogonality of the subcarriers. This orthogonality reduces the inter-symbol
interference (ISI). Therefore, the complete spectrum can be effectively utilized.
Avoidance to Frequency Selective Fading: The coherence bandwidth is less than the
subcarrier bandwidth so it is avoids frequency selective fading.
Estimation of phase and channel can be done easily: The phase and channel
estimation is difficult in this time variant environment but due to the orthogonality of
the subcarriers it is easy for OFDM.
Easily can be implemented in VLSI: OFDM functions in digital domain and also its
design is carried out by the incorporation of FFT/IFFT blocks. This is the reason why it
is easy to implement it in VLSI.
1.1.2 Disadvantages of OFDM
Peak-to-Average Power Ratio is very high: The peak-to-average power ratio is very
high in OFDM. As the number of subcarriers increases the peak to average power ratio
increases. PAPR causes various other problems. Some of the problems are like non-
linear distortion, out of band radiation, etc.
Sensitivity to Frequency and Phase Offset: The orthogonality of subcarriers removes
overlapping of the subcarriers but in turn the subcarriers are closely spaced. This closed
spacing gives rise to the frequency errors. Therefore, OFDM is very sensitive to
frequency and phase offset.
Inter-carrier Interference: Whenever there is a violation to orthogonality of
subcarriers inter-carrier interference takes place. Therefore, in OFDM the subcarriers are
placed orthogonally to get rid of ICI.

4
1.2 OFDM Transceiver
The basic building blocks of OFDM transceiver are the FFT and IFFT blocks. At the
transmitter side IFFT is implemented whereas at the receiver side FFT is implemented. The
OFDM transmitter and receiver have been explained individually in the following sections.
1.2.1 OFDM Transmitter [3]
The incoming serial data stream is converted to parallel blocks of data, with the number
of elements in one parallel block being equal to the number of sub-carriers, say N. The
parallel block of data is then passed through an N-point IFFT block to obtain the OFDM
symbol. Thus the OFDM symbol is in digital time domain. The transmitter is illustrated in
the following Figure 1-1.
FIGURE 1-1: BLOCK DIAGRAM OF OFDM TRANSMITTER
1.2.2 OFDM Receiver [3]
OFDM signal is passed through a channel to the receiver which is then converted from
serial to parallel stream. This parallel stream of OFDM signal data is de-mapped or
demodulated by any of the demodulation technique BPSK or QPSK. This demodulated
data is transformed from time domain to frequency domain with the operation of fast
fourier transform (FFT). Finally, the frequency domain signal is converted from parallel to
serial and is received at the receiver. The receiver is illustrated in the following Figure 1-2.

5
FIGURE 1-2: BLOCK DIAGRAM OF OFDM RECEIVER
1.3 Applications of OFDM
Digital Audio Broadcasting (DAB): It is the first commercial OFDM based
system which was developed in the year 1995.
Digital Video Broadcasting (DVB): This application came up just after DAB
which utilizes OFDM as its basic technology.
IEEE standards (IEEE 802.11a/g/n): Later on wireless LAN, Wifi, came up with
standards IEEE 802.11 a/g/n.
LTE: The 4th
generation mobile communication adopted OFDM as LTE after 3rd
generation.
1.4 Peak to Average Power Ratio in OFDM
The average power of the transmitted signal can be written as,
, (1.2)
where, is the expectation.
and, the peak power of the transmitted signal is,
(1.3)
From (1.2) and (1.3), the PAPR of the transmitted OFDM symbol can be defined by,
= (1.4)

6
PAPR is generally represented by a complementary cumulative distribution function
(CCDF) where x-axis denotes the preset threshold and y-axis denotes the probability that
the PAPR exceeds this threshold.
The CCDF is defined by,
(1.5)
where, is the threshold PAPR.
1.5 PAPR Reduction Techniques
Various PAPR reduction techniques have been implemented since years after the
invention of OFDM technology. The main objective of these techniques is to reduce the
PAPR of the OFDM signal to an acceptable value before the OFDM signal is sent to the
transmitter. The different techniques are listed below:
Amplitude Clipping and Filtering
Coding
Partial Transmit Sequence Technique
Selected Mapping Technique
Interleaving Technique
Tone Reservation Technique
Tone Injection Technique
Active constellation extension technique
1.5.1 Criteria for selection of PAPR Reduction Techniques
There are a number of parameters or factors which are considered about the PAPR
reduction techniques. Not all the criteria can be fully satisfied by any of the existing PAPR
reduction techniques. A tradeoff is required between these factors to select the most
appropriate technique depending on the system under consideration.

7
The factors are as listed below:
1. PAPR Reduction capability: The PAPR reduction capability is described by the
reduction of PAPR value (in dB) after the technique is applied to OFDM
transmission system. It is measured by CCDF graph.
2. Power Increase in transmit signal: The technique must not increment the total
power level that is being transmitted. If it does happen, the increment in power has
to be within a permissible limit.
3. BER increase at the receiver: The technique must not introduce unwanted errors
into the transmitted bit stream, such that the overall BER at the receiver is increased.
In other words the technique must not distort the signal.
4. Loss in data rate: The technique may use some extra bits and this may result in a
loss of data rate. The loss is acceptable up to certain value dependent on the system
under consideration
5. Computational complexity: The technique may satisfy all the other criteria but at the
cost of a very high computational complexity. If this complexity is exceedingly
high, the technique might not be suitable for hardware implementation as it will
incur higher cost, power and time which are not desirable in speedy networks based
on OFDM.
The following Table 1-1 presents the comparison of all these techniques based on the
criteria presented earlier.
Table 1-1: Comparison of PAPR Reduction Techniques
Technique name Power
increase Distortion-
less Loss in
data rate Computational
Complexity
Amplitude clipping & filtering No No No Low
Coding No Yes Yes Medium

8
Partial Transmit Sequence No Yes Yes Very High
Selected Mapping No Yes Yes High
Interleaving No Yes Yes Medium
Tone Reservation Yes Yes Yes Medium
Tone Injection Yes Yes No Medium
Active constellation extension Yes Yes No Medium
The Partial Transmit Sequence technique has a very high computational complexity but
delivers a remarkably good performance in terms of PAPR reduction. The higher the
complexity of the technique and the more extensive the technique is, better is the PAPR
reduction performance. Hence this technique has been worked upon by a number of
researchers with an objective to reduce the computational complexity so as to avail the
PAPR reduction performance in an efficient manner.
1.6 Motivation
The advent of 4th
generation wireless communication technology has been possible due
to the OFDM technology. The current world requires speed and efficient bandwidth
utilization, which is very well provided by OFDM. However implementation of OFDM has
the major concern of high PAPR like any multi-carrier signal. For the last few decades,
researchers have been trying to device techniques that might reduce the PAPR value to an
acceptable limit without causing unwanted distortions or loss in data rates or added
complexity. Some techniques provide good PAPR reduction but have very high
computational complexity while some techniques have a lower complexity but introduce
some distortion in the signal. There is a trade-off among various such factors and hence
global optimization is required to hit equilibrium and choose the most suited technique.
9
The PTS technique has been among those techniques which presents a remarkable
PAPR reduction performance but is handicapped by a very high computational complexity
as well as loss of data rates. Thus this technique has been the interest of researchers to
develop upon such that the PAPR reduction capability can be exploited yet the high
complexity and the loss of data rates can be overcome efficiently. Care has been exercised
to preserve the advantages of the technique while the disadvantages have been eradicated
to a concordant degree. Motivation has been derived from such research works for the
betterment of the technique and to address the drawbacks in a novel approach. The
concepts of parallel and serial system have been used in the work. It is known that serial
system has a lower complexity in comparison to parallel system at a cost of throughput
time. The design of the new technique has been improvised on the basis of this concept.
Moreover, the increasing level of integration afforded by CMOS processes and the
associated computer-aided design tools motivates to implement it in very large scale
integration. The FFT requirement of an OFDM modem affords some interesting
possibilities in speed, power, and size constraints. Power and area efficient FFT/IFFT
implementation is very worthwhile.
1.7 Objective of the Work
The main objective of this work is to implement the PAPR reduction technique in an
FPGA. To realize the objective, the following analysis and investigations were required to
be undertaken:
Study and analyze the existing PTS technique and understand the main reasons
behind the high computational complexity of the technique.
Device a new method that would preserve the principle of the technique, yet reduce
the complexity to a much lower value. The algorithm for this method has to be

10
developed and simulated to test if the PAPR reduction performance is maintained or
not.
Implement the newly devised algorithm in hardware such as FPGA to test the design
feasibility, hardware realization and performance analysis of the algorithm in real-
time.
1.8 Literature Review
The study of previous work gives an idea of updated technology which is very vital to
keep a track of. The PTS technique was first introduced in the year 1997 by Muller and
Huber [2]. OFDM can be implemented using VLSI was first proposed by Weste and
Skellern [7] in the year 1998. A complete overview of all the PAPR reduction techniques
was given by Han and Lee [1] in the year 2005. The VLSI architecture for FFT/IFFT has
been proposed by Liu and Min [11] in the year 2005. Later on Arioua et al. [8] brought up
some more ways to implement FFT/IFFT in the year 2011. PTS has been implemented in
FPGA by Varahram et al. [9] and Junjun et al. [10] in the year 2011. In the year 2012 the
very recent and novel method to reduce PAPR has been proposed by Eom et al. [3].
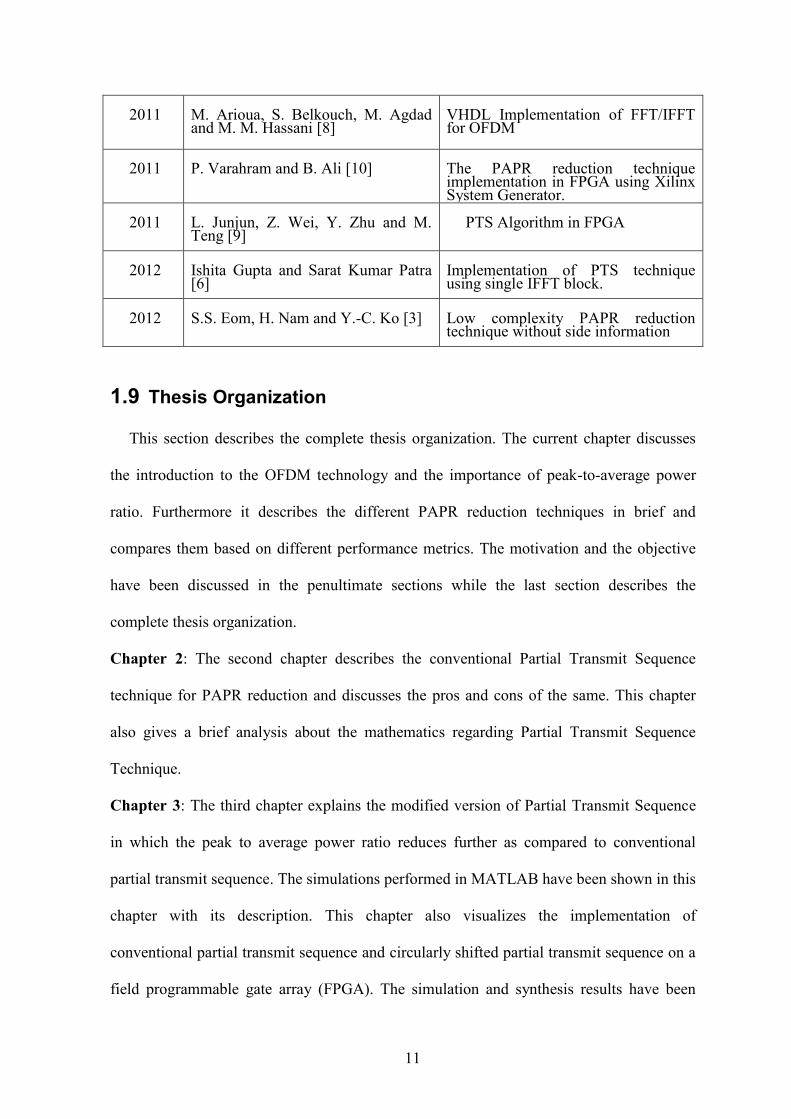
Table 1-2: A Literature Review Related to the Work Done
Year
Author
Description
1997
S. H. Muller and J. B. Huber [2]
The Partial Transmit Sequence technique has been introduced.
1998
Neil Weste and David J. Skellern [7]
The VLSI implications of high-speed orthogonal frequency division multiplexing modulation.
2005
SeungHee Han and Jae Hong Lee [1]
The PAPR reduction techniques for multicarrier transmission.
2005
J. Wu, K. Liu, B. Shen and H. Min [11]
VLSI architecture of FFT has been designed for OFDM systems
2007
G. Lu, P. Wu and D. Aronsson [4]
PAPR Reduction technique using cyclically shifted phase sequences
11
2011
M. Arioua, S. Belkouch, M. Agdad and M. M. Hassani [8]
VHDL Implementation of FFT/IFFT for OFDM
2011
P. Varahram and B. Ali [10]
The PAPR reduction technique implementation in FPGA using Xilinx System Generator.
2011
L. Junjun, Z. Wei, Y. Zhu and M. Teng [9]
PTS Algorithm in FPGA
2012
Ishita Gupta and Sarat Kumar Patra [6]
Implementation of PTS technique using single IFFT block.
2012
S.S. Eom, H. Nam and Y.-C. Ko [3]
Low complexity PAPR reduction technique without side information
1.9 Thesis Organization
This section describes the complete thesis organization. The current chapter discusses
the introduction to the OFDM technology and the importance of peak-to-average power
ratio. Furthermore it describes the different PAPR reduction techniques in brief and
compares them based on different performance metrics. The motivation and the objective
have been discussed in the penultimate sections while the last section describes the
complete thesis organization.
Chapter 2: The second chapter describes the conventional Partial Transmit Sequence
technique for PAPR reduction and discusses the pros and cons of the same. This chapter
also gives a brief analysis about the mathematics regarding Partial Transmit Sequence
Technique.
Chapter 3: The third chapter explains the modified version of Partial Transmit Sequence
in which the peak to average power ratio reduces further as compared to conventional
partial transmit sequence. The simulations performed in MATLAB have been shown in this
chapter with its description. This chapter also visualizes the implementation of
conventional partial transmit sequence and circularly shifted partial transmit sequence on a
field programmable gate array (FPGA). The simulation and synthesis results have been

12
demonstrated in this chapter. The results after implementing in an FPGA have been
analyzed in a Chip Scope Pro analyzer. The internal signal can be viewed in this analyzer.
Chapter 4: The fourth chapter concludes the work and also encourages with an idea for
proceeding with the work in future. It gives brief of what has been done and in future what
is to be done.

13
2
PARTIAL TRANSMIT SEQUENCE
TECHNIQUE FOR PAPR REDUCTION
The demerits of high PAPR incurred in OFDM system is generally addressed to by a
number of PAPR reduction techniques which reduce the PAPR value to a certain threshold
such that the derogatory effects are eliminated. Some of the techniques have moderate
PAPR reduction capability but have lower complexity while some have very good PAPR
reduction capability at the cost of very high complexity. Partial Transmit Sequence
technique complies with the second type of techniques with high computational complexity
and good PAPR reduction performance. The existing PTS technique has been described in
the chapter aided by mathematical equations and block diagrams.
The chapter also discusses the advantages of this technique. The later sections describe
about the limitations of the technique.
2.1 Partial Transmit Sequence Technique
The PTS technique was first proposed by Muller and Huber in 1997, as a modification
to the existing Selective Mapping technique. Figure 2-1 shows the block diagram of
conventional PTS technique.

14
2.1.1 PTS Technique: Algorithm
The incoming bit stream is converted to a parallel block of data.
The parallel block of data is then divided into smaller sub-blocks. Each of these sub-
blocks has the same length as the original parallel block of data. As for example if
there are N sub-carriers, then the length of the parallel block of data will be N.
Similarly the length of each sub-block will also be N. However not all the N
elements of a sub-block will be non-zero. The division will be such that, some of the
sub-carriers have non-zero values in a sub-block while others have zero. And it is to
be noted that a set of sub-carriers cannot have non-zero values in more than one sub-
block. In this way, effectively the addition of all sub-blocks will give the original
parallel block of data as the sum.
The sub-blocks are then simultaneously passed through IFFT blocks which perform
the inverse Fourier transform of each of these sub-blocks. The output of each of
these IFFT blocks is referred to as partial transmit sequence.
Each of the PTSs is then simultaneously rotated by a certain pre-defined phase
factor. The phase factor is selected from a set of allowed values which is defined
earlier. Once rotation is complete, the phase-rotated PTSs are added up to get a
candidate signal.
The entire process is then again performed but with a different combination of phase
factors being multiplied with the PTSs. This is continued until all possible
combinations of phase-factor and PTS has been generated. Thus a large number of
candidate signals are generated.
The candidate signals are compared on the basis of their PAPR value and the one
with the lowest PAPR is chosen as the correct OFDM symbol to be transmitted.

15
FIGURE 2-1: BLOCK DIAGRAM FOR CONVENTIONAL PARTIAL TRANSMIT SEQUENCE TECHNIQUE
2.1.2 PTS Technique: Mathematical analysis
The data symbols after modulation are partitioned into disjoint sub-blocks,
, =1,2,., where is the number of sub-blocks. An -point
IFFT is employed on each sub-block which can be written as,
(2.1)
These time domain sequences are the partial transmit sequences, each of which are then
multiplied by the phase factors =[ , , …, ]. These phase factors are chosen from
{ } and { } for W= {2, 4}, where W is the set of allowed phase factors. The phase
factors can also be generated from,
(2.2)
where, is the phase and = 1,2,… .
The candidate signals are generated by combining the partial transmit sequence after phase
factor multiplication, which is defined by,

16
(2.3)
Finally, the optimum candidate signal with lowest PAPR is selected from WM-1
candidate signals and is transmitted [2, 6]. This guarantees reduction in PAPR. The PAPR
reduction by conventional PTS technique is shown in Figure 2-1.
2.2 Advantages and Disadvantages
Like any other technique or algorithm, the PTS technique has a number of advantages as
well as drawbacks or disadvantages. The advantages that have been pointed out by the
authors of the original technique are described in the following sections. They have also
pointed out the possible disadvantage of the technique. The further research work
conducted on PTS technique has drawn the feed from the drawbacks of the technique.
2.2.1 Advantages of PTS Technique
Distortion less technique: This technique is distortion less due to which the BER
performance is not affected in OFDM.
Works with arbitrary number of sub-carriers: This technique can be
implemented for large number of subcarriers. In turn the complexity is not
affected. It provides flexibility to work with any number of subcarriers.
Works with any modulation: This technique is flexible for any type of
modulation. It functions equally well with BPSK, QPSK, etc.
Flexible approach: This technique is flexible for any number of subcarriers, any
type of modulation and any number of sub-blocks.
PAPR reduction performance: This technique is the best method for peak to
average power ratio reduction as compared to other techniques.

17
2.2.2 Disadvantages of PTS Technique
High computational complexity: Due to IFFT operation and the phase factor
optimization this technique undergoes very high computational complexity. This
is the major disadvantage of PTS technique but this technique is preferred only
due to good PAPR reduction.
Loss in data rates: The side information is the main reason behind data rate loss.
This takes place as because the phase factor rotation values needs to be send at
receiver.

18
3
CIRCULARLY SHIFTED PTS TECHNIQUE
The purpose of these techniques is to reduce peak to average power ratio which
ultimately removes non-linear distortion and out of band radiation. This chapter deals with
a novel method of reducing peak to average power ratio. Here, the existing partial transmit
sequence technique is modified by substituting the phase factors with two basic operations:
phase rotation and circular shifting. Partial transmit sequence refers to the sequences
transmitted after the IFFT operation on each sub-block. Then these partially transmitted
sequences are multiplied by phase factors. In this chapter, the novel method proposed, just
substitutes this multiplication of partially transmitted sequences with phase factors to phase
rotation of partially transmitted sequences and circular shifting of quadrature phase
components. Due to which the search of phase factors gets eliminated, in turn, it reduces
the computational complexity. Further, in this chapter, the mathematical model has been
explained in brief to proceed with its simulation in MATLAB.
3.1 Circularly Shifted PTS: Design Approach and Algorithm
CS-PTS eliminates the use of phase factors and reduces peak to average power ratio.
After modulation, the data symbols are partitioned into sub-blocks which generate the
frequency domain symbols. These frequency domain symbols are converted to time
domain symbols by -point IFFT operation on each sub-block. Figure 3-1 depicts the
19
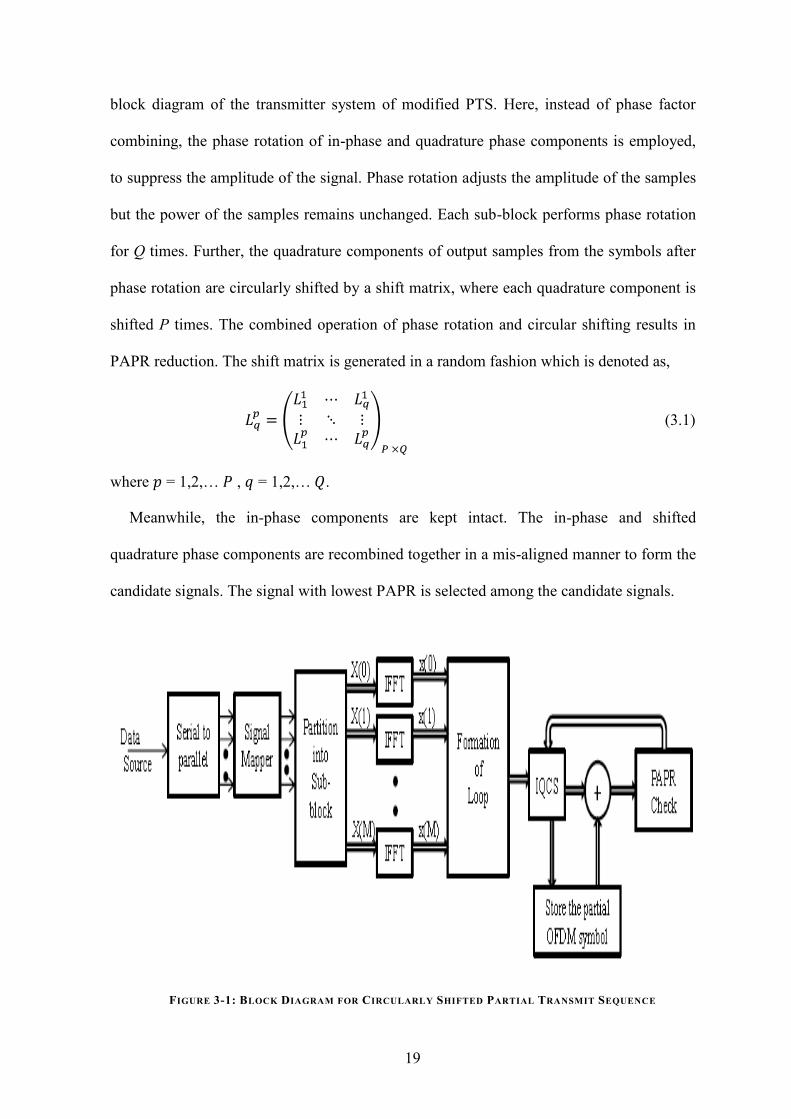
block diagram of the transmitter system of modified PTS. Here, instead of phase factor
combining, the phase rotation of in-phase and quadrature phase components is employed,
to suppress the amplitude of the signal. Phase rotation adjusts the amplitude of the samples
but the power of the samples remains unchanged. Each sub-block performs phase rotation
for Q times. Further, the quadrature components of output samples from the symbols after
phase rotation are circularly shifted by a shift matrix, where each quadrature component is
shifted P times. The combined operation of phase rotation and circular shifting results in
PAPR reduction. The shift matrix is generated in a random fashion which is denoted as,
(3.1)
where = 1,2,… , = 1,2,… .
Meanwhile, the in-phase components are kept intact. The in-phase and shifted
quadrature phase components are recombined together in a mis-aligned manner to form the
candidate signals. The signal with lowest PAPR is selected among the candidate signals.
FIGURE 3-1: BLOCK DIAGRAM FOR CIRCULARLY SHIFTED PARTIAL TRANSMIT SEQUENCE

20
The modified PTS can be obtained in following steps:
1. Partitioning of the input data sequence into M subblocks.
2. IFFT operation on each subblock which is denoted by,
T
(3.2)
3. Phase Rotation of time domain partially transmitted sequences.
, being a complex variable, can be represented as,
= + , (3.3)
= 1,2,… , =1,2,…, , =1,2,…,
where, and are in-phase and quadrature phase components.
The phase rotation of in-phase and quadrature phase components can be written as,
= + ) ( ), (3.4)
where, is taken as for which =
So, (3.4) can be modified as,
= - , (3.5)
= + , (3.6)
= 1,2,…, , =1,2,…, , =1,2,…,
where, ( ) and ( ) are in-phase and quadrature components after phase
rotation.
Therefore, (3.5) and (3.6) shows that instead of phase rotation, the addition and
subtraction of in-phase and quadrature phase components with a constant multiplication
can be performed. This operation reduces complexity by eliminating the need of complex
multiplication.
4. Circular shifting of output samples, , where is kept intact.
= ((n - ))N, (3.7)
21
= 1,2,…, , = 1,2,…, , = 1,2,…, .
5. Re-combination of in-phase component, (m) and quadrature component,
gives the P Q candidate signals.
= + j , (3.8)
6. Select the candidate signals with minimum PAPR from each sub-block and add them.
7. The selected signal is the signal with minimum PAPR.
3.2 Circularly Shifted PTS: FPGA Implementation
With the advent of new and efficient technologies [7 - 11], it has been simpler to
implement the PTS-OFDM transmitter system and its peak to average power ratio
calculation in VHDL. The architecture proposed in this thesis was coded in VHDL and
then simulated and synthesized in Xilinx ISE 14.2 device, XC5VLX110T, with a speed of -
1, and the package used is FF1136.VHDL implementation provides parallel processing of
data symbols instead of serial processing. The resource utilization for this design can also
be known by VHDL implementation.
3.2.1 Xilinx ISE 14.2 with XC5VLX110T-1FF1136
The circularly shifted partial transmit sequence technique is implemented in Xilinx. The
complete model is coded in VHSIC Hardware Description Language (VHDL) and then
downloaded in Virtex-5 FPGA.
The coding is done in the Xilinx ISE 14.2 version which is compatible with any kind of
FPGA devices. The bit file generated from the code is programmed on to the FPGA device.
The user constraint file is edited which connects the FPGA internally. This user constraint
file gives the details of the pin configuration. Finally, the programmed FPGA results are
verified with the help of Chipscope pro analyzer. The inputs are provided through a
Chipscope pro inserter.

22
FIGURE 3-2: BLOCK DIAGRAM FOR INVERSE FAST FOURIER TRANSFORM IN VHDL
Figure 3-2 shows the block diagram for implementation of the inverse fast fourier
transform in VHDL. It reveals the single processing element or the butterfly which further
will constitute to form a complete inverse fast fourier transform model. In this processing
element the operation is carried out individually on each of the real and imaginary values.
Initially, the individual real and imaginary values are added and subtracted as per the logic
of operation of inverse fast fourier transform. Then the twiddle factor multiplication is
carried out. The twiddle factor multiplication is the one which gives the complexity of
computation of complex multiplications. This computational complexity of complex
multiplications has been removed by the use of the method shift and adds. The shift and
add algorithm involves a vital step of distributed arithmetic where to implement in VHDL
the distributed arithmetic concept is used. In this shift and add method a shifter is used,
generally a left shifter is designed for complex multiplication. Finally, the maximum value
and the average value are divided which gives the final result of the peak to average power
ratio value is calculated. This result specifies that the OFDM data with minimum PAPR to
be transmitted. Further, the PAPR calculation in VHDL is described below with its block
diagram.

23
3.2.2 PAPR Calculation in VHDL
FIGURE 3-3: BLOCK DIAGRAM FOR PEAK TO AVERAGE POWER RATIO CALCULATION IN VHDL
PAPR is calculated by the expression given in (1.4). The same can be evaluated in VHDL
as per the block diagram shown in Figure 3-3. Here, the operations are performed
individually on in-phase and quadrature components. The inputs are taken in integer
representation upon which squaring, adding and division operations are performed. For an
example, an OFDM signal with N=8 subcarriers is considered to verify the results. The real
and imaginary data are first squared by using the method of shift and add instead of
multiplication. The squared results are then added using the ripple carry adder technique.
Out of this adder values the maximum values needs to be selected which has been done
with the help of a comparator logic, where it will compare with each previous value and
decide the higher value to be selected. Then as per the (1.4) the maximum value is divided
with the mean value which is calculated by taking the average of the initially added values.
Figure 3-18 depicts the test-bench waveform for PAPR calculation of an OFDM symbol. It
can be viewed that for each transmitted symbol a PAPR is calculated. The symbol with
minimum PAPR value is transmitted.

24
3.2.3 Experimental Setup
FIGURE 3-4: BLOCK DIAGRAM FOR CIRCULARLY SHIFTED PTS IN XILINX (VHDL)
Figure 3-4 illustrates the VHDL implementation of modified partial transmit sequence
technique. Pseudo-random data generator provides random serial data which is converted
to parallel with the help of serial-in-parallel-out register. These data symbols are then
modulated and partitioned into subblocks. Each subblock is employed with an N-point
IFFT operation. An IFFT operation is carried out by number of butterfly
processing elements. The twiddle factor multiplications involved in a butterfly is
eliminated by the use of shift and add algorithm [8]. Here, radix-2 multi-path delay
commutator (R2MDC) pipelined architecture processing element is employed for IFFT
operation. Moreover, the computational complexity which arises due to IFFT operation is
reduced by its VHDL implementation.
For parallel processing of the time domain symbols, a multiplexer is incorporated where
the select inputs are selected by a counter. The count of a counter depends on the number
of select inputs. As shown before, that instead of phase rotation, the addition, subtraction
and constant multiplication operations can be performed on the in-phase and quadrature

25
phase components. Now, the quadrature components are circularly shifted by a random
variable and then the in-phase and quadrature components are re-combined to form the
partial OFDM symbol. The partial OFDM symbol is stored in a random access memory
which is then added when the counter reads the last count. Peak to average power ratio
calculation of this OFDM symbol is calculated and the symbol with minimum peak-to-
average power ratio is transmitted.
3.3 Simulation Results and Discussions
3.3.1 Simulation Results in MatLab
Simulations was performed to compare the performance of PAPR reduction in OFDM
symbols among OFDM without PTS, with PTS and modified PTS with N=64 subcarriers.
FIGURE 3-5: CCDF OF PAPR WITH N=64, M=4 AND P=8, Q=8 FOR OFDM WITHOUT PTS, WITH
CONVENTIONAL PTS AND WITH CIRCULARLY SHIFTED PTS
For conventional PTS, M=4 and W=4 was considered whereas in modified PTS M=4,
P=8 and Q=8 iterations are assumed. Figure 3-5 represents the CCDF of PAPR for OFDM
26
system without PTS, with PTS and modified PTS. The CCDF of PAPR was generated
using 10000 random samples. It is observed that the modified PTS has better PAPR
performance than C-PTS with less computational complexity.
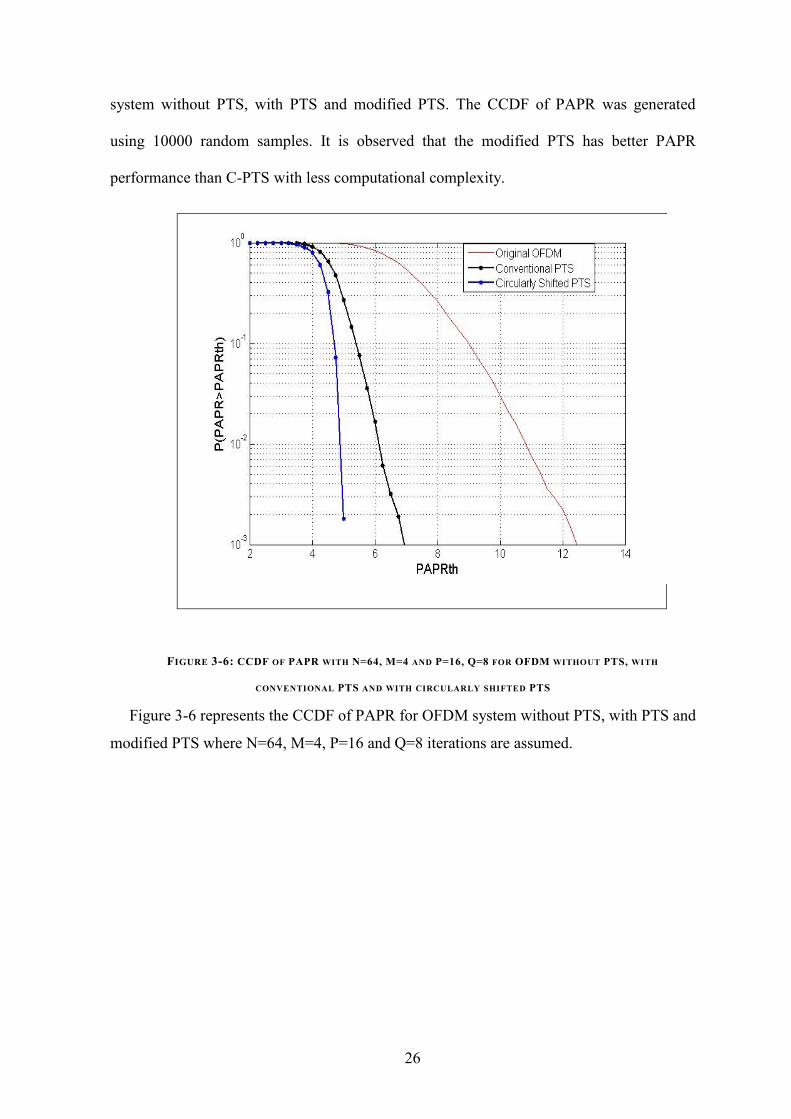
FIGURE 3-6: CCDF OF PAPR WITH N=64, M=4 AND P=16, Q=8 FOR OFDM WITHOUT PTS, WITH
CONVENTIONAL PTS AND WITH CIRCULARLY SHIFTED PTS
Figure 3-6 represents the CCDF of PAPR for OFDM system without PTS, with PTS and
modified PTS where N=64, M=4, P=16 and Q=8 iterations are assumed.

27
FIGURE 3-7: CCDF OF PAPR WITH N=128, M=4 AND P=8, Q=8 FOR OFDM WITHOUT PTS, WITH
CONVENTIONAL PTS AND WITH CIRCULARLY SHIFTED PTS
Figure 3-7 represents the CCDF of PAPR for OFDM system without PTS, with PTS and
modified PTS where N=128, M=4, P=8 and Q=8 iterations are assumed.
3.3.2 Simulation and Synthesis Results in FPGA
The experimental setup discussed in Section 3.2.3 has been used to generate OFDM
signal by circularly shifting the partially transmitted sequences. According to the Figure
4.1 the output results are shown below:
FIGURE 3-8: TESTBENCH WAVEFORM FOR PRDG

28
Figure 3-8 depicts the testbench waveform of pseudo-random data generator which
randomly generates the data stream. This data stream has been generated with the help of
flip-flops and logic gates (AND and EX-OR).
FIGURE 3-9: TESTBENCH WAVEFORM FOR SIPO
Figure 3-9 shows the testbench waveform of serial in parallel out register. The random
data stream generated from a PRDG is sent through a SIPO register to convert the serial
data to parallel data.
FIGURE 3-10: TESTBENCH WAVEFORM FOR SIGNAL MAPPING
Figure 3-10 gives the testbench waveform of the signal mapper. The parallel form of
data is passed through any mapping technique whose output is a frequency domain signal.
The mapping technique used here is the binary phase shift keying (BPSK). In this

29
technique the binary value „1‟ corresponds to as 1 or cosine signal where as the binary
value „0‟ corresponds to as -1 or sine signal.
FIGURE 3-11: TESTBENCH WAVEFORM FOR SUBBLOCK PARTITIONING
Figure 3-11 shows the testbench waveform of subblock partitioning. The mapped data is
partitioned into subblocks.
FIGURE 3-12: TESTBENCH WAVEFORM FOR IFFT
Figure 3-12 depicts the testbench waveform of IFFT. For start at logic „1‟ the
corresponding IFFT value results.

30
FIGURE 3-13: TESTBENCH WAVEFORM FOR CIRCULAR SHIFTING
Figure 3-13 shows the testbench waveform of circular shifting where the input value is
shifted by three towards left.
FIGURE 3-14: TESTBENCH WAVEFORM FOR SQUARING
Figure 3-14 gives the testbench waveform for squaring any number. Here, the real and
imaginary magnitude values are squared for further operations to be performed.
FIGURE 3-15: TESTBENCH WAVEFORM FOR DIVISION
Figure 3-15 shows the testbench waveform for division of any value by the constant
value. This operation can be performed by any of two methods. One is by repetitive
subtraction and the other one is by shift algorithm.

31
FIGURE 3-16: TESTBENCH WAVEFORM FOR CIRCULARLY SHIFTED PTS
Figure 3-16 depicts the final testbench waveform for circularly shifted PTS technique.
FIGURE 3-17: WAVEFORM FROM CHIPSCOPE PRO FOR CIRCULARLY SHIFTED PTS

32
Figure 3-17 shows the final result on chipscope pro when downloaded into an FPGA.
FIGURE 3-18: WAVEFORM FROM CHIPSCOPE PRO FOR CIRCULARLY SHIFTED PTS WITH PAPR VALUES
Figure 3-18 shows the final result with the peak to average power ratio calculated values
on chipscope pro when downloaded into an FPGA.
Table 3-1: Resources Utilization Summary
Logic Utilization Resources Used Performance (%)
Number of Slices 2517 3
Number of fully used 256 9

33
LUT-FF pairs
Number of bonded IOBs 148 23
Number of DSP48 slices 16 25
Table 3-1 gives the resources utilization summary where it can be observed that the
number of slices used is only 3% of the total resources available. The number of input-
output blocks utilized is 148 which is 23% of the available resources. The number of LUT-
FF pairs and DSP48 slices is 256 and 16 out of the available resources. This model has
been downloaded in Virtex 5 FPGA and the resource available is according to this FPGA
device.
Table 3-2: Performance Comparison
Number of
Slices
Number of
DSP48
Slices
Number of fully
used LUT-FF pairs
IO
Utilization
Varahram
et.al [9]
19% 41% 28% 34%
Junjun et.al
[10]
11% 33% 20% 25%
CS-PTS 3% 25% 9% 23%
Table 3-2 gives the performance comparison among the existing and the novel
technique. All the above mentioned techniques are designed and synthesized in Virtex 5 for
comparison purpose. It can be observed from the table that the novel technique CS-PTS

34
utilizes less number of resources as compared to the existing two techniques. In terms of all
parameters CS-PTS utilizes the minimum number of resources.
3.4 Timing Analysis of FPGA Implementation
The timing report gives the maximum frequency of operation with its time delay and
also summarizes the minimum input arrival time before clock and maximum output
required time after clock.
The timing summary is summarized as below:

35
4
CONCLUSION
The phase rotation and circular shifting of partial transmit sequences is carried out
which provides better peak-to-average power ratio as compared to conventional PTS.
Moreover, the parallel and pipe-line processing of symbols is applied by implementation in
VHDL. This implementation in VHDL lowers the complexity by eliminating the complex
multiplications. Matlab simulations done for N=64 subcarriers with 10000 samples of
OFDM symbols to plot the CCDF, which shows that the modified PTS gives better PAPR
reduction as compared to C-PTS. The same concept is implemented in VHDL in addition
to its PAPR calculation. PAPR calculation in VHDL can also be simulated for subcarriers
greater than 8 using the same process as is done for N=8. In comparison to C-PTS, this
scheme eliminates phase factor combination with a better PAPR reduction. Furthermore,
this scheme has been implemented in FPGA, which depicts the usage of resources. The
results generated after downloading into an FPGA can be verified with the help of Chip
Scope Pro. The Chip Scope Pro inserter inserts the input triggers and the Chip Scope Pro
analyzer displays the result waveforms.

36
4.1 Future Work
The future work that can be carried out by this technique is that it can be applied on
recent standards in IEEE 802.11 g/n. With the increase in number of subcarriers, the
number of IFFT points can be increased and can be implemented using Radix-4/8
algorithm. Furthermore, the arithmetic operations on floating-point representation of
symbols can be done by using NEDA (New Distributed Arithmetic) algorithm.
Moreover, modifications can be carried out in its VLSI implementation so as to
minimize the resource utilization. Research work can be made on its power and area
optimization.

37
DISSEMINATION:
Sahoo, S.; Patra, S.K. , “VHDL Implementation of Circularly Shifted PTS Technique
for PAPR reduction in OFDM”, IEEE International Conf. on Advanced Communication,
Control and Computing Technologies 2014, Syed Anmal Engineering College,
Ramanathapuram, Tamil Nadu, 8th
-10th
May 2014. (Accepted and Presented)

38
BIBLIOGRAPHY:
[1] S. H. Han and J. H. Lee, "An overview of peak-to-average power ratio reduction
techniques for multicarrier transmission," Wireless Communications, IEEE, vol. 12,
no. 2, pp. 56-65, 2005.
[2] S. H. Muller and J. B. Huber, "A novel peak power reduction scheme for OFDM," in
Personal, Indoor and Mobile Radio Communications, 1997. Waves of the Year 2000.
PIMRC'97., The 8th IEEE International Symposium on, 1997.
[3] S.S. Eom, H. Nam and Y.-C. Ko, "Low-complexity PAPR reduction scheme without
side information for OFDM systems," Signal Processing, IEEE Transactions on, vol.
60, no. 7, pp. 3657-3669, 2012.
[4] G. Lu, P. Wu and D. Aronsson, "Peak-to-average power ratio reduction in OFDM
using cyclically shifted phase sequences," IET communications, vol. 1, no. 6, pp.
1146-1151, 2007.
[5] L. Yang, K. Soo, S. Li and Y. Siu, "PAPR reduction using low complexity PTS to
construct of OFDM signals without side information," Broadcasting, IEEE
Transactions on, vol. 57, no. 2, pp. 284-290, 2011.
[6] Y. Xiao, X. Lei, Q. Wen and S. Li, "A class of low complexity PTS techniques for
PAPR reduction in OFDM systems," Signal Processing Letters, IEEE, vol. 14, pp.
680-683, 2007.
[7] N. Weste and D. J. Skellern, "VLSI for OFDM," Communications Magazine, IEEE,
vol. 36, no. 10, pp. 127-131, 1998.
[8] M. Arioua, S. Belkouch, M. Agdad and M. M. Hassani, "VHDL implementation of an
optimized 8-point FFT/IFFT processor in pipeline architecture for OFDM systems," in

39
Multimedia Computing and Systems (ICMCS), 2011 International Conference on,
2011.
[9] L. Junjun, Z. Wei, Y. Zhu and M. Teng, "Low complexity PTS algorithm based on
gray code and its FPGA implementation," in Electronic Measurement & Instruments
(ICEMI), 2011 10th International Conference on, 2011.
[10] P. Varahram and B. Ali, "FPGA implementation of novel peak-to-average power ratio
reduction in orthogonal frequency division multiplexing systems," 2011.
[11] J. Wu, K. Liu, B. Shen and H. Min, "A hardware efficient VLSI architecture for FFT
processor in OFDM systems," in ASIC, 2005. ASICON 2005. 6th International
Conference On, 2005.
[12] I. Gupta and S. K. Patra, "Single IFFT block based reduced complexity Partial
Transmit Sequence technique for PAPR reduction in OFDM," in Communications,
Devices and Intelligent Systems (CODIS), 2012 International Conference on, 2012.
[13] J. Hou, J. Ge and J. Li, "Peak-to-average power ratio reduction of OFDM signals
using PTS scheme with low computational complexity," Broadcasting, IEEE
Transactions on, vol. 57, no. 1, pp. 143-148, 2011.
[14] G. Lu, P. Wu and D. Aronsson, "Peak-to-average power ratio reduction in OFDM
using cyclically shifted phase sequences," IET communications, vol. 1, no. 6, pp.
1146-1151, 2007.
[15] P. Varahram and B. M. Ali, "Partial transmit sequence scheme with new phase
sequence for PAPR reduction in OFDM systems," Consumer Electronics, IEEE
Transactions on, vol. 57, no. 2, pp. 366-371, 2011.
[16] S. G. Kang, J. G. Kim and E. K. Joo, "A novel subblock partition scheme for partial

40
transmit sequence OFDM," Broadcasting, IEEE Transactions on, vol. 45, no. 3, pp.
333-338, 1999.
[17] H. Li, T. Jiang and Y. Zhou, "A novel subblock linear combination scheme for peak-
to-average power ratio reduction in OFDM systems," Broadcasting, IEEE
Transactions on, vol. 58, no. 3, pp. 360-369, 2012.
[18] B. M. Lee and R. J. de Figueiredo, "A Lowcomplexity Tree Algorithm for Pts-Based
Papr Reduction in Wireless Ofdm," in Acoustics, Speech and Signal Processing, 2006.
ICASSP 2006 Proceedings. 2006 IEEE International Conference on, 2006.
[19] J. Wu, K. Liu, B. Shen and H. Min, "A hardware efficient VLSI architecture for FFT
processor in OFDM systems," in ASIC, 2005. ASICON 2005. 6th International
Conference On, 2005.
Online Resources:
1. www.wikipedia.org
2. www.google.com – Search Engine for data and images.