fourth quarter operations review - rio tinto
TRANSCRIPT

Fourth quarter operations review
Page 1 of 31
Rio Tinto releases fourth quarter production results
18 January 2019
Rio Tinto chief executive J-S Jacques said “We delivered a solid operational performance in the final
quarter of 2018, in particular across our copper assets. During the year, we further strengthened our asset
portfolio, continuing to invest in high quality growth. 2018 saw the early completion of Amrun, the
deployment of AutoHaul™, the Koodaideri and Robe River investments and the signing of the power
agreement at Oyu Tolgoi. Meanwhile, we completed disposals of $8.6 billion, including the Grasberg mine
in Indonesia and our remaining coal assets. With a firm ‘value over volume’ focus and disciplined allocation
of capital, we will continue to progress our strategic objectives and to deliver superior returns to
shareholders in the short, medium and long term.”
Q4 2018 vs Q4 2017 vs Q3 2018 2018 vs 2017
Pilbara iron ore shipments (100% basis) Mt 87.4 -3% +7% 338.2 +2%
Pilbara iron ore production (100% basis) Mt 86.6 -1% +5% 337.8 +2%
Bauxite kt 11,790 -14% -7% 50,421 -1%
Aluminium kt 874 -1% -1% 3,458 -3%
Mined copper kt 177.8 +20% +11% 633.5 +33%
Titanium dioxide slag kt 294 -14% -1% 1,116 -15%
IOC iron ore pellets and concentrate Mt 2.8 +4% -2% 9.0 -20%
Operational update
• Pilbara iron ore shipments of 338 million tonnes (100 per cent basis) in 2018 were two per cent
higher than 2017.
• During the quarter, Rio Tinto announced it had successfully deployed AutoHaul™ at its Pilbara
operations, approved a $2.6 billion investment in the Koodaideri iron ore replacement mine, and
approved an investment of $1.55 billion (Rio Tinto's 53 per cent share $820 million) at two projects
to sustain production capacity at the Robe River Joint Venture.
• Bauxite production of 50.4 million tonnes in 2018 was one per cent lower than 2017. Third party
shipments increased by two per cent to 32.8 million tonnes. During the fourth quarter,
commissioning works at CBG in Guinea and the transition of operations from East Weipa to Amrun
in Queensland resulted in a short term drop in production.
• Aluminium production of 3.5 million tonnes was three per cent lower than 2017 due primarily to
ongoing labour disruptions at the non-managed Becancour smelter in Canada.
• Mined copper production of 634 thousand tonnes was 33 per cent higher than 2017, and above the
guidance range, primarily reflecting strong performance at Escondida and increased production
from Rio Tinto Kennecott due largely to higher grades.
• Titanium dioxide slag production of 1.1 million tonnes was 15 per cent lower than 2017 due to
production disruptions at Rio Tinto Fer et Titane in the second quarter, and intermittent stoppages
related to labour disputes between contractors and their employees at Richards Bay Minerals in the
first half.
• Fourth quarter production at Iron Ore Company of Canada was four per cent higher than the fourth
quarter of 2017. However, 2018 production was 20 per cent lower than 2017, due to a strike at the
mine that significantly impacted second quarter production.
• Other major milestones in the quarter included first bauxite shipment from Amrun, achieved six
weeks ahead of schedule, and the signing of the Power Source Framework Agreement between
Oyu Tolgoi and the Government of Mongolia.

Page 2 of 31
Corporate update
• Disposal proceeds received in 2018 were approximately $8.6 billion, pre-tax, including:
- The completion of the sale of our entire interest in the Grasberg mine in Indonesia for $3.5
billion, including a $0.1 billion attributable share of copper and gold revenues, net of our
capital contribution for the year.
- The completion of the sale of our aluminium smelter at Dunkerque, France for $0.4 billion,
net of completion adjustments.
- The completion of the sale of a wharf and land in Kitimat, British Columbia for $0.6 billion.
- The completion of the sale of our coking coal assets for $4.1 billion.
• During the quarter, Rio Tinto announced that it had entered into a binding agreement with China
National Uranium Corporation for the sale of its entire 68.62 per cent stake in Rössing Uranium.
Subject to certain conditions precedent being met, the transaction is expected to complete in the
first half of 2019.
• In 2018, Rio Tinto repurchased $5.4 billion of shares. This included an off-market buy-back tender
in Rio Tinto Limited shares for $2.1 billion, and further on-market purchases of Rio Tinto plc shares
of $3.3 billion. See page 11 for details.
• In the first half of 2018, Rio Tinto noted the negative impact to EBITDA resulting from raw material
input price inflation, particularly in the Aluminium business, and the escalation of alumina index
prices which impacted its alumina legacy contracts. These trends have continued to be observed in
the second half of 2018.
Average realised prices
2018 vs 2017
Iron ore $/dmt, FOB 62.5 -4%
Aluminium $/t (including VAP, mid-west premium) 2,470 +11%
All figures in this report are unaudited. All currency figures in this report are US dollars, and comments refer to Rio Tinto’s share of
production, unless otherwise stated. To allow production numbers to be compared on a like-for-like basis, production from asset
divestments completed in 2017 is excluded from Rio Tinto share of production data but assets sold in 2018 remain in comparisons.

Page 3 of 31
IRON ORE
Rio Tinto share of production (million tonnes)
Q4 2018 vs Q4 2017 vs Q3 2018 2018 vs 2017
Pilbara Blend Lump 21.7 +3% +5% 84.8 +5%
Pilbara Blend Fines 31.7 +2% +6% 122.6 +5%
Robe Valley Lump 1.4 -14% -4% 5.9 -4%
Robe Valley Fines 2.6 -12% -5% 11.0 +6%
Yandicoogina Fines (HIY) 14.9 -8% +3% 57.5 -0%
Total Pilbara production 72.2 -1% +4% 281.8 +4%
Total Pilbara production (100% basis) 86.6 -1% +5% 337.8 +2%
Pilbara operations
Pilbara operations produced 337.8 million tonnes (Rio Tinto share 281.8 million tonnes) in 2018, two per
cent higher than 2017, at the upper end of guidance. The production performance is attributable to the
ramp-up of expanded mines and minimal weather events.
Fourth quarter production of 86.6 million tonnes (Rio Tinto share 72.2 million tonnes) was one per cent
lower than the corresponding quarter of 2017.
2018 sales of 338.2 million tonnes (Rio Tinto share 280.8 million tonnes) were two per cent higher than
2017, whilst fourth quarter sales of 87.4 million tonnes (Rio Tinto share 72.7 million tonnes) were three per
cent lower than the same period of last year.
Approximately 17 per cent of sales in 2018 were priced by reference to the prior quarter’s average index
lagged by one month. The remainder was sold either on current quarter average, current month average or
on the spot market.
Approximately 32 per cent of sales in 2018 were made free on board (FOB), with the remainder sold
including freight.
Achieved average pricing in 2018 was $57.6 per wet metric tonne on an FOB basis (equivalent to $62.5
per dry metric tonne). In 2017, the full year price achieved was $59.6 per wet metric tonne (equivalent to
$64.8 per dry metric tonne).
Pilbara projects
On 28 December 2018, Rio Tinto announced it had successfully deployed AutoHaul™, establishing the
world’s first automated heavy-haul, long distance rail network. Since completing the first autonomous
haulage run in July 2018, Rio Tinto has steadily increased the number of autonomous journeys in a
controlled and safe manner, with over 1.6 million kilometres now travelled autonomously. The programme
will now focus on optimising autonomous operations.
On 29 November 2018, Rio Tinto announced the full approval of a $2.6 billion investment in the Koodaideri
iron ore replacement mine. Koodaideri will deliver a new production hub in the Pilbara, incorporating a
processing plant and infrastructure including a 166-kilometre rail line connecting the mine to the existing
network. Construction will start in 2019 with first production expected in late-2021. Once complete, the
mine will have an annual capacity of 43 million tonnes, underpinning production of the Pilbara Blend.
Construction of accommodation facilities has commenced at site. A $44 million pre-feasibility study into
Koodaideri Phase 2 was also approved in the fourth quarter.
On 1 October 2018, Rio Tinto announced an investment of $1.55 billion (Rio Tinto's 53 per cent share
$820 million) at two projects to sustain production capacity at the Robe River Joint Venture. Approvals and
commencement of works are proceeding to plan.
Page 4 of 31
2019 guidance Rio Tinto’s Pilbara shipments in 2019 are expected to be between 338 and 350 million tonnes, (100 per cent basis), subject to weather and market conditions.
Following a plant fire at the port of Cape Lambert A on 10 January 2019, Rio Tinto expects limited
disruption to Robe Valley lump and fines shipments, which is reflected in the above guidance.
Page 5 of 31
ALUMINIUM
Rio Tinto share of production (‘000 tonnes)
Q4 2018 vs Q4 2017 vs Q3 2018 2018 vs 2017
Rio Tinto Aluminium
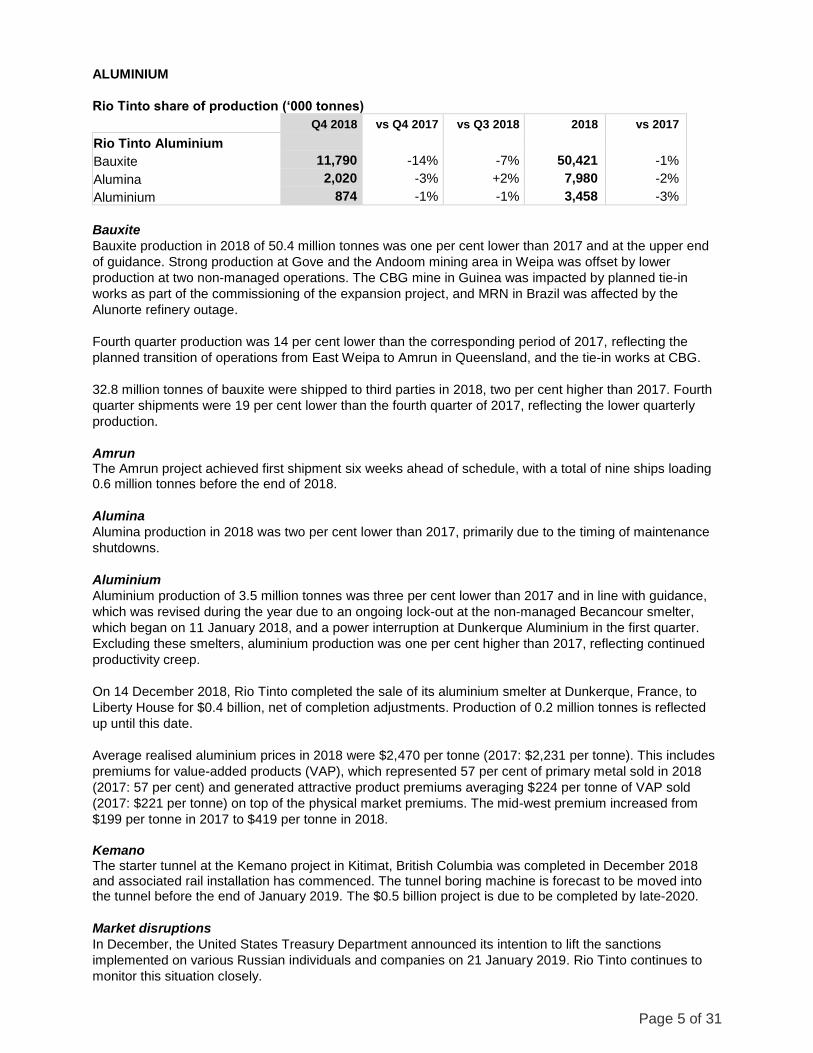
Bauxite 11,790 -14% -7% 50,421 -1%
Alumina 2,020 -3% +2% 7,980 -2%
Aluminium 874 -1% -1% 3,458 -3%
Bauxite
Bauxite production in 2018 of 50.4 million tonnes was one per cent lower than 2017 and at the upper end
of guidance. Strong production at Gove and the Andoom mining area in Weipa was offset by lower
production at two non-managed operations. The CBG mine in Guinea was impacted by planned tie-in
works as part of the commissioning of the expansion project, and MRN in Brazil was affected by the
Alunorte refinery outage.
Fourth quarter production was 14 per cent lower than the corresponding period of 2017, reflecting the
planned transition of operations from East Weipa to Amrun in Queensland, and the tie-in works at CBG.
32.8 million tonnes of bauxite were shipped to third parties in 2018, two per cent higher than 2017. Fourth
quarter shipments were 19 per cent lower than the fourth quarter of 2017, reflecting the lower quarterly
production.
Amrun The Amrun project achieved first shipment six weeks ahead of schedule, with a total of nine ships loading 0.6 million tonnes before the end of 2018.
Alumina
Alumina production in 2018 was two per cent lower than 2017, primarily due to the timing of maintenance
shutdowns.
Aluminium
Aluminium production of 3.5 million tonnes was three per cent lower than 2017 and in line with guidance,
which was revised during the year due to an ongoing lock-out at the non-managed Becancour smelter,
which began on 11 January 2018, and a power interruption at Dunkerque Aluminium in the first quarter.
Excluding these smelters, aluminium production was one per cent higher than 2017, reflecting continued
productivity creep.
On 14 December 2018, Rio Tinto completed the sale of its aluminium smelter at Dunkerque, France, to
Liberty House for $0.4 billion, net of completion adjustments. Production of 0.2 million tonnes is reflected
up until this date.
Average realised aluminium prices in 2018 were $2,470 per tonne (2017: $2,231 per tonne). This includes
premiums for value-added products (VAP), which represented 57 per cent of primary metal sold in 2018
(2017: 57 per cent) and generated attractive product premiums averaging $224 per tonne of VAP sold
(2017: $221 per tonne) on top of the physical market premiums. The mid-west premium increased from
$199 per tonne in 2017 to $419 per tonne in 2018.
Kemano The starter tunnel at the Kemano project in Kitimat, British Columbia was completed in December 2018 and associated rail installation has commenced. The tunnel boring machine is forecast to be moved into the tunnel before the end of January 2019. The $0.5 billion project is due to be completed by late-2020.
Market disruptions
In December, the United States Treasury Department announced its intention to lift the sanctions
implemented on various Russian individuals and companies on 21 January 2019. Rio Tinto continues to
monitor this situation closely.

Page 6 of 31
2019 guidance Rio Tinto’s expected share of bauxite production in 2019 is between 56 and 59 million tonnes. Aluminium production guidance is between 3.2 and 3.4 million tonnes and alumina production guidance is 8.1 to 8.4 million tonnes.

Page 7 of 31
COPPER & DIAMONDS
Rio Tinto share of production (‘000 tonnes)
Q4 2018 vs Q4 2017 vs Q3 2018 2018 vs 2017
Mined copper
Rio Tinto Kennecott 58.3 +67% -1% 203.9 +37%
Escondida 79.7 -14% -9% 350.4 +29%
Grasberg 25.9 +353% N/A 25.9 +353%
Oyu Tolgoi 13.9 -8% +5% 53.3 +1%
Refined copper
Rio Tinto Kennecott 64.6 +193% +19% 194.7 +55%
Escondida 21.6 -6% +30% 80.0 +12%
Diamonds (‘000 carats)
Argyle 3,211 -48% -16% 14,069 -18%
Diavik 1,078 +2% +1% 4,358 -3%
Rio Tinto Kennecott
Mined copper production in 2018 was 37 per cent higher than 2017 as mining activity continued in a higher
grade area of the pit, coupled with productivity improvements and increased plant throughput.
Refined copper was 55 per cent higher than 2017 as better mine grades improved concentrate quality and
smelting throughput. Fourth quarter 2017 production was impacted by a fatality at the smelter.
Rio Tinto Kennecott continues to toll and purchase third party concentrate to optimise smelter utilisation,
with 100 thousand tonnes of concentrate received for processing in 2018, compared with 161 thousand
tonnes in 2017. Purchased and tolled copper concentrate are excluded from reported production figures.
In 2019, the production profile will see increased variability in grade as operations mine in lower levels of
the pit, together with waste stripping related to the south wall pushback expansion. Anticipated south wall
pushback grades begin to increase in late-2020 and are expected to offset this variability over the longer
term.
Escondida
Mined copper production at Escondida in 2018 was 29 per cent higher than 2017, reflecting the ramp-up of
production to nameplate capacity following commissioning of the Los Colorados concentrator, and the
absence of a labour strike which significantly impacted 2017 production.
Oyu Tolgoi
Mined copper production from the open pit in 2018 was one per cent higher than 2017, with higher copper
recovery partly offset by lower plant throughput due to the processing of harder ore.
Oyu Tolgoi Underground Project Work continues on the critical Shaft Two equipping activities, central heating plant, mine infrastructure, underground materials handling systems and on priority underground development. Overall progress continues to track in-line with the re-forecast undertaken in the third quarter of 2018. The project workforce has now reached peak levels of around 9,400, whilst maintaining a high (88 per cent) participation rate of Mongolian nationals.
On 31 December 2018, Rio Tinto announced the signing of the Power Source Framework Agreement between Oyu Tolgoi and the Government of Mongolia. The agreement provides a binding framework and pathway for the construction of a power plant and also sets out an amended timetable for Oyu Tolgoi to meet its obligation to source power domestically. The 300 megawatt plant will be majority owned by Oyu Tolgoi LLC and will be situated close to the Tavan Tolgoi coalfields. Construction is scheduled to start in 2020, with the commissioning of the plant by mid-2023.

Page 8 of 31
Grasberg
On 21 December 2018, Rio Tinto announced that it had completed the sale of its entire interest in the
Grasberg mine in Indonesia as part of a series of transactions involving Inalum (PT Indonesia Asahan
Aluminium (Persero)), Indonesia’s state mining company, and Freeport McMoRan Inc. Total proceeds from
the transaction were $3.5 billion, including $0.1 billion for the 2018 attributable metal share of 25.9
thousand tonnes of copper and 266.7 thousand ounces of gold, net of the capital contribution for the year.
Provisional pricing
At 31 December 2018, the Group had an estimated 240 million pounds of copper sales that were
provisionally priced at 277 cents per pound. The final price of these sales will be determined during the first
half of 2019. This compares with 250 million pounds of open shipments at 31 December 2017,
provisionally priced at 304 cents per pound.
Diamonds
At Argyle, carat production in 2018 was 18 per cent lower than 2017, when production was enhanced by
the processing of higher grade alluvial tailings.
At Diavik, carats recovered in 2018 were three per cent lower than 2017 as lower recovered grade were
partially offset by higher ore processing. The A21 project successfully mined first ore in March 2018 and
reached commercial production during the fourth quarter.
2019 guidance
Rio Tinto’s share of mined copper production for 2019 is expected to be between 550 and 600 thousand
tonnes, subject to grade availability. Refined copper production is expected to be between 220 and 250
thousand tonnes.
Diamond production guidance for 2019 is between 15 and 17 million carats.

Page 9 of 31
ENERGY & MINERALS
Rio Tinto share of production
Q4 2018 vs Q4 2017 vs Q3 2018 2018 vs 2017
Coal (‘000 tonnes)
Hard coking coal - -100% -100% 3,988 -48%
Thermal coal (a) - -100% -100% 2,527 -38%
Iron ore pellets and
concentrate (million tonnes)
IOC 2.8 +4% -2% 9.0 -20%
Minerals (‘000 tonnes)
Borates – B2O3 content 118 -2% -14% 512 -1%
Salt 1,496 -3% +1% 6,153 +21%
Titanium dioxide slag 294 -14% -1% 1,116 -15%
Uranium (‘000 lbs)
Energy Resources of Australia 924 +1% +13% 3,014 -13%
Rössing 979 +9% -1% 3,750 +17%
(a) Production from Coal & Allied of 9.9 million tonnes (Rio Tinto share) prior to divestment on 1 September 2017 has been excluded
from the comparisons above.
Coal
Following the completion of the sale of Rio Tinto’s interests in Kestrel and Hail Creek on 1 August 2018,
production of coal attributable to Rio Tinto ceased. The sale of these assets, along with the Valeria coal
and Winchester South development projects resulted in gross disposal proceeds of $4.15 billion.
Iron Ore Company of Canada (IOC)
Fourth quarter production at IOC was four per cent higher than the corresponding period of 2017.
IOC production and sales in 2018 were impacted by a two month strike at the mine in the second quarter,
but was in line with revised guidance. Pellet production of 8.5 million tonnes (Rio Tinto share 5.0 million
tonnes) was 18 per cent lower than 2017, whilst concentrate production for sale of 6.7 million tonnes (Rio
Tinto share 3.9 million tonnes) was 22 per cent lower than 2017.
Total sales of pellets and concentrates achieved in 2018 were 15.0 million tonnes (Rio Tinto share 8.8
million tonnes), 21 per cent lower than 2017.
Borates
Borates production was one per cent lower than 2017, and in line with guidance, with production aligned to
customer demand.
Iron and Titanium
Titanium dioxide feedstock production was 15 per cent lower in 2018 compared to 2017, primarily due to
disruptions at Rio Tinto Fer et Titane (RTFT), the deflagration of a furnace at RTFT, and intermittent
stoppages related to labour disputes between contractors and their employees at Richards Bay Minerals
(RBM) in the first half. Production was in line with revised guidance.
Three of nine furnaces at RTFT are idle, two of which are being rebuilt. One of four furnaces at RBM
remains idle. The focus remains on maximising the productivity of the furnaces currently in operation, and
a decision to re-start idle furnaces will be based on maximising value over volume.
Salt
Salt production in 2018 was 21 per cent higher than 2017, with production aligned to customer demand.

Page 10 of 31
Uranium
Energy Resources of Australia continues to process existing low grade stockpiles. 2018 production was 13
per cent lower than 2017 due to declining grades and completion of laterite processing.
Production at Rössing Uranium in 2018 was 17 per cent higher than 2017 due to higher mill grades.
On 26 November 2018, Rio Tinto announced it had entered into a binding agreement with China National
Uranium Corporation for the sale of its entire 68.62 per cent stake in Rössing Uranium. The transaction is
subject to certain conditions precedent including merger approval from the Namibian Competition
Commission. Subject to these conditions precedent being met, the transaction is expected to complete in
the first half of 2019.
2019 guidance
At IOC, guidance for Rio Tinto’s expected share of iron ore pellets and concentrates production in 2019 is
between 11.3 and 12.3 million tonnes. Titanium dioxide slag production guidance is between 1.2 and 1.4
million tonnes, and boric oxide equivalent production guidance is 0.5 million tonnes.

Page 11 of 31
CORPORATE UPDATE
Share buy-back
During 2018, Rio Tinto purchased $5.4 billion of shares through a combination of on-market purchases of
Rio Tinto plc shares and an off-market tender of Rio Tinto Limited shares. As at 1 January 2019, a further
$1.7 billion of previously announced buy-backs in Rio Tinto plc shares remains outstanding.
Rio Tinto Limited
The Group returned $2.1 billion through a Rio Tinto Limited off-market tender announced on 20 September
2018 and completed on 12 November 2018.
Rio Tinto plc
In 2018, on-market purchases were completed of $3.3 billion in Rio Tinto plc shares. These comprised the
return of $1.9 billion announced in the second half of 2017, the $1 billion programme announced on 7
February 2018 and $0.4 billion of a $1 billion programme announced on 1 August 2018. The remaining
$0.6 billion of this last programme will be completed no later than 27 February 2019.
A further $1.1 billion of the programme announced in September 2018 will be returned through an on-
market Rio Tinto plc share buy-back commencing on 28 February 2019 and will be completed no later than
28 February 2020.
Cash inflows of approximately $8.6 billion, pre-tax, from divestments in 2018
Pre-tax proceeds
received in 2018 $ billion
Aluminium Dunkerque, France sold to Liberty House* 0.4
Hail Creek coal mine and Valeria coal development project,
both in Queensland, Australia, sold to Glencore
1.7
Kestrel underground coal mine, Queensland, Australia, sold to
EMR Capital and PT Adaro Energy Tbk
2.3
Interest in Grasberg mine sold to Inalum (PT Indonesia
Asahan Aluminium (Persero))**
3.4
Wharf and land in Kitimat, British Columbia sold to LNG
Canada
0.6
Other, including Winchester South coal development project 0.2
Total 8.6
* Net of completion adjustments
** Before a $0.1 billion attributable share of copper and gold revenues, net of Rio Tinto’s capital
contribution for the year.
Simandou
The non-binding heads of agreement, originally signed on 28 October 2016, for Chinalco to acquire Rio
Tinto's entire interest in the Simandou iron ore project in Guinea has lapsed. Rio Tinto and Chinalco, who
respectively own 45.05 per cent and 39.95 per cent of Simandou, will continue to work with the
Government of Guinea to explore other options to realise value from the world-class Simandou iron ore
deposit. The Government of Guinea owns a 15 per cent stake in the project.

Page 12 of 31
EXPLORATION AND EVALUATION
Pre-tax and pre-divestment expenditure on exploration and evaluation charged to the profit and loss
account in 2018 was $488 million, compared with $445 million in 2017, driven primarily by increased
activity at Resolution. Approximately 48 per cent of this expenditure was incurred by central exploration, 37
per cent by Copper & Diamonds, eight per cent by Iron Ore and the remainder by Energy & Minerals and
Aluminium.
There were no significant divestments of central exploration properties in the fourth quarter of 2018.
Exploration highlights
Rio Tinto has a strong portfolio of projects with activity in 16 countries across some eight commodities. The
bulk of the exploration expenditure in this quarter was focused on copper targets in Australia, Canada,
Chile, Kazakhstan, Mongolia, Namibia, Papua New Guinea, Peru, Serbia, United States, Zambia and
diamond projects in Canada. Mine-lease exploration continued at a number of Rio Tinto managed
businesses including Pilbara Iron in Australia, RTIT in Canada, Oyu Tolgoi In Mongolia, Weipa in Australia
and Bingham in the US.
A summary of activity for the quarter is as follows:
Product
Groups
Studies stage Advanced exploration
projects
Greenfield/ Brownfield
programmes
Aluminium Cape York, Australia Amargosa, Brazil
Sanxai, Laos
Cape York, Australia
Copper &
Diamonds
Copper/molybdenum:
Resolution, US
Copper: La Granja, Peru
Nickel: Tamarack, US
Diamonds: FalCon1,
Canada
Copper Greenfield:
Australia, Chile, China,
Kazakhstan, Mongolia,
Namibia, Papua New
Guinea, Peru, Serbia, US,
Zambia
Copper Brownfield:
Bingham, US
Nickel Greenfield:
Canada, Uganda
Diamonds: Canada
Energy &
Minerals
Lithium borates: Jadar,
Serbia
Potash: KP405, Canada
Heavy mineral sands:
Mutamba, Mozambique
and Zulti South, South
Africa
Uranium: Roughrider,
Canada
Heavy mineral sands:
Tanzania, Canada
Iron Ore Pilbara, Australia Pilbara, Australia Koodaideri, Australia
(1) Formerly Forte a la Corne

Page 13 of 31
Forward-looking statements
This announcement may include "forward-looking statements" within the meaning of the US Private Securities Litigation Reform Act of 1995. All statements other than statements of historical facts included in this announcement, including, without limitation, those regarding Rio Tinto’s production forecast or guidance, financial position, business strategy, plans and objectives of management for future operations (including development plans and objectives relating to Rio Tinto’s products and reserve and resource positions), are forward-looking statements. The words “intend”, “aim”, “project”, “anticipate”, “estimate”, “plan”, “believes”, “expects”, “may”, “should”, “will”, “target”, “set to”, “assumes” or similar expressions, commonly identify such forward looking statements. Such forward-looking statements involve known and unknown risks, uncertainties and other factors which may cause the actual production, performance or results of Rio Tinto to be materially different from any future production, performance or results expressed or implied by such forward-looking statements. Such forward-looking statements could be influenced by such risk factors as identified in Rio Tinto's most recent Annual Report and Accounts in Australia and the United Kingdom and the most recent Annual Report on Form 20-F filed with the United States Securities and Exchange Commission (the "SEC") or Form 6-Ks furnished to, or filed with, the SEC. Forward-looking statements should, therefore, be construed in light of such risk factors and undue reliance should not be placed on forward-looking statements. These forward-looking statements speak only as of the date of this announcement. Rio Tinto expressly disclaims any obligation or undertaking (except as required by applicable law, the UK Listing Rules, the Disclosure and Transparency Rules of the Financial Conduct Authority and the Listing Rules of the Australian Securities Exchange) to release publicly any updates or revisions to any forward-looking statement contained herein to reflect any change in Rio Tinto’s expectations with regard thereto or any change in events, conditions or circumstances on which any such statement is based. Nothing in this announcement should be interpreted to mean that future earnings per share of Rio Tinto plc or Rio Tinto Limited will necessarily match or exceed its historical published earnings per share.

Page 14 of 31
Contacts
[email protected] www.riotinto.com
Follow @riotinto on Twitter Media Relations, United Kingdom Media Relations, Australia Illtud Harri M +44 7920 503 600
Jonathan Rose T +61 3 9283 3088 M +61 447 028 913
David Outhwaite T +44 20 7781 1623 M +44 7787 597 493
Jesse Riseborough T +61 8 6211 6013 M +61 436 653 412
Media Relations, Canada Matthew Klar
T +1 514 608 4429
Investor Relations, EMEA/Americas Investor Relations, Australia/Asia John Smelt T +44 20 7781 1654 M +44 7879 642 675
Natalie Worley T +61 3 9283 3063 M +61 409 210 462
David Ovington T +44 20 7781 2051 M +44 7920 010 978
Rachel Storrs T +61 3 9283 3628 M +61 417 401 018
Nick Parkinson M +61 436 637 571
Rio Tinto plc 6 St James’s Square London SW1Y 4AD United Kingdom T +44 20 7781 2000 Registered in England No. 719885
Rio Tinto Limited Level 7, 360 Collins Street Melbourne 3000 Australia T +61 3 9283 3333 Registered in Australia ABN 96 004 458 404

Page 15 of 31
Rio Tinto production summary
Rio Tinto share of production
Quarter Full Year % Change
2017 Q4
2018 Q3
2018 Q4
2017
2018
Q4 18 vs
Q4 17
Q4 18 vs
Q3 18
2018 vs
2017
Principal Commodities
Alumina ('000 t) 2,077 1,972 2,020 8,131 7,980 -3% 2% -2%
Aluminium ('000 t) 887 880 874 3,551 3,458 -1% -1% -3%
Bauxite ('000 t) 13,762 12,700 11,790 50,796 50,421 -14% -7% -1%
Borates ('000 t) 120 137 118 517 512 -2% -14% -1%
Coal - hard coking ('000 t) 2,322 712 - 7,704 3,988 -100% -100% -48%
Coal - thermal ('000 t) 966 397 - 4,065 2,527 -100% -100% -38%
Copper - mined ('000 t) 148.6 159.7 177.8 478.1 633.5 20% 11% 33%
Copper - refined ('000 t) 44.9 70.8 86.1 197.2 274.8 92% 22% 39%
Diamonds ('000 cts) 7,207 4,896 4,290 21,627 18,427 -40% -12% -15%
Iron Ore ('000 t) 75,656 72,010 75,018 282,484 290,800 -1% 4% 3%
Titanium dioxide slag ('000 t) 341 297 294 1,315 1,116 -14% -1% -15%
Uranium ('000 lbs) 1,821 1,814 1,904 6,650 6,764 5% 5% 2%
Other Metals & Minerals
Gold - mined ('000 oz) 62.6 101.4 385.1 260.1 638.8 515% 280% 146%
Gold - refined ('000 oz) 55.4 50.3 58.6 203.7 198.0 6% 17% -3%
Molybdenum ('000 t) 1.9 1.4 2.2 5.0 5.8 15% 63% 16%
Salt ('000 t) 1,535 1,481 1,496 5,090 6,153 -3% 1% 21%
Silver - mined ('000 oz) 1,172 1,384 1,840 4,194 5,910 57% 33% 41%
Silver - refined ('000 oz) 516 730 807 2,378 2,865 56% 10% 21%
Throughout this report, figures in italics indicate adjustments made since the figure was previously quoted on the equivalent page. Production figures are sometimes more precise than the rounded numbers shown, hence small differences may result between the total of the quarter figures and the year to date figures.

Page 16 of 31
Rio Tinto share of production
Rio Tinto interest
Q4 2017
Q1 2018
Q2 2018
Q3 2018
Q4 2018
Full Year 2017
Full Year 2018
ALUMINA
Production ('000 tonnes)
Jonquière (Vaudreuil) 100% 365 362 365 363 354 1,448 1,444
Jonquière (Vaudreuil) specialty Alumina plant 100% 29 31 32 31 29 122 124
Queensland Alumina 80% 773 717 752 748 742 2,988 2,958
São Luis (Alumar) 10% 93 87 87 85 92 370 351
Yarwun 100% 816 793 763 744 803 3,203 3,103
Rio Tinto total alumina production 2,077 1,990 1,999 1,972 2,020 8,131 7,980
ALUMINIUM
Production ('000 tonnes)
Australia - Bell Bay 100% 47 47 47 48 48 187 189
Australia - Boyne Island 59% 74 72 74 75 74 302 295
Australia - Tomago 52% 77 75 76 78 77 304 305
Canada - six wholly owned 100% 405 398 402 407 408 1,596 1,616
Canada - Alouette (Sept-Îles) 40% 60 58 58 59 58 239 234
Canada - Bécancour 25% 27 10 9 8 8 110 34
France - Dunkerque (a) 0% 72 51 52 66 57 284 227
Iceland - ISAL (Reykjavik) 100% 54 52 53 53 54 212 212
New Zealand - Tiwai Point 79% 67 66 67 68 70 267 270
Oman - Sohar 20% 5 17 19 20 20 51 76
Rio Tinto total aluminium production
887 846 858 880 874 3,551 3,458
(a) On 14 December 2018, Rio Tinto completed the sale of its 100% interest in the Dunkerque smelter. Production is reported up to the date of completion.
BAUXITE
Production ('000 tonnes) (a)
Gove 100% 3,224 3,124 3,274 2,893 3,250 11,201 12,540
Porto Trombetas 12% 426 353 393 342 489 1,764 1,576
Sangaredi (b) 1,809 1,745 1,657 1,261 1,204 6,934 5,868
Weipa 100% 8,304 7,431 7,955 8,204 6,847 30,898 30,437
Rio Tinto total bauxite production 13,762 12,653 13,279 12,700 11,790 50,796 50,421
(a) Mine production figures for metals refer to the total quantity of metal produced in concentrates, leach liquor or doré bullion irrespective of whether these products are then refined onsite, except for the data for bauxite and iron ore which represent production of marketable quantities of ore plus concentrates and pellets.
(b) Rio Tinto has a 22.95% shareholding in the Sangaredi mine but benefits from 45.0% of production.

Page 17 of 31
Rio Tinto share of production
Rio Tinto interest
Q4 2017
Q1 2018
Q2 2018
Q3 2018
Q4 2018
Full Year 2017
Full Year 2018
BORATES
Production ('000 tonnes B2O3 content)
Rio Tinto Borates - borates 100% 120 124 132 137 118 517 512
COAL - hard coking
Rio Tinto Coal Australia ('000 tonnes)
Hail Creek Coal (a) (c) 0% 1,275 758 1,131 325 - 4,303 2,214
Kestrel Coal (b) (c) 0% 1,048 344 1,043 387 - 3,402 1,774
Rio Tinto total hard coking coal production 2,322 1,102 2,174 712 - 7,704 3,988
(a) On 1 August 2018, Rio Tinto completed the sale of its 82% interest in the Hail Creek mine. Production is reported up to the date of completion. (b) On 1 August 2018, Rio Tinto completed the sale of its 80% interest in the Kestrel mine. Production is reported up to the date of completion. (c) Kestrel and Hail Creek produce hard coking coal and thermal coal through their mining operations. Both mines may blend coal types at ports.
COAL - thermal
Rio Tinto Coal Australia ('000 tonnes)
Hail Creek Coal (a) (c) 0% 785 1,060 835 368 - 3,390 2,264
Kestrel Coal (b) (c) 0% 180 59 176 28 - 674 263
Rio Tinto total thermal coal production 966 1,119 1,011 397 - 4,065 2,527
(a) On 1 August 2018, Rio Tinto completed the sale of its 82% interest in the Hail Creek mine. Production is reported up to the date of completion. (b) On 1 August 2018, Rio Tinto completed the sale of its 80% interest in the Kestrel mine. Production is reported up to the date of completion. (c) Kestrel and Hail Creek produce hard coking coal and thermal coal through their mining operations. Both mines may blend coal types at ports.

Page 18 of 31
Rio Tinto share of production
Rio Tinto interest
Q4 2017
Q1 2018
Q2 2018
Q3 2018
Q4 2018
Full Year 2017
Full Year 2018
COPPER
Mine production ('000 tonnes) (a)
Bingham Canyon 100% 34.8 35.4 51.2 59.1 58.3 148.9 203.9
Escondida 30% 92.9 90.9 92.4 87.4 79.7 270.8 350.4
Grasberg - Joint Venture (b) 40% 5.7 0.0 0.0 0.0 25.9 5.7 25.9
Oyu Tolgoi (c) 34% 15.2 13.0 13.2 13.2 13.9 52.8 53.3
Rio Tinto total mine production
148.6 139.3 156.8 159.7 177.8 478.1 633.5
Refined production ('000 tonnes)
Escondida 30% 22.8 20.8 21.0 16.6 21.6 71.4 80.0
Rio Tinto Kennecott 100% 22.1 35.3 40.7 54.2 64.6 125.8 194.7
Rio Tinto total refined production 44.9 56.1 61.7 70.8 86.1 197.2 274.8
(a) Mine production figures for metals refer to the total quantity of metal produced in concentrates, leach liquor or doré bullion irrespective of whether these products are then refined onsite, except for the data for bauxite and iron ore which represent production of marketable quantities of ore plus concentrates and pellets.
(b) Through a joint venture agreement with Freeport-McMoRan (FCX), Rio Tinto is entitled to 40% of additional material mined as a consequence of expansions and developments of the Grasberg facilities since 1998. On 21 December 2018, Rio Tinto completed the sale of its entire interest in the Grasberg mine in Indonesia to PT Indonesia Asahan Aluminium (Persero) (Inalum). Production is reported up to 30 November 2018. Net cashflow of $0.1 billion relating to this production is included in the total divestments proceeds of $3.5 billion.
(c) Rio Tinto owns a 33.52% indirect interest in Oyu Tolgoi through its 50.79% interest in Turquoise Hill Resources Ltd.
DIAMONDS
Production ('000 carats)
Argyle 100% 6,146 3,551 3,476 3,830 3,211 17,135 14,069
Diavik 60% 1,060 1,065 1,150 1,066 1,078 4,492 4,358
Rio Tinto total diamond production 7,207 4,616 4,626 4,896 4,290 21,627 18,427
GOLD
Mine production ('000 ounces) (a)
Bingham Canyon 100% 35.9 37.4 45.6 56.6 57.1 177.9 196.7
Escondida 30% 15.1 18.0 20.5 19.1 22.1 43.9 79.7
Grasberg - Joint Venture (b) 40% 0.0 0.0 0.0 0.0 266.7 0.0 266.7
Oyu Tolgoi (c) 34% 11.7 14.0 16.8 25.8 39.1 38.3 95.7
Rio Tinto total mine production
62.6 69.4 82.8 101.4 385.1 260.1 638.8
Refined production ('000 ounces)
Rio Tinto Kennecott 100% 55.4 40.8 48.4 50.3 58.6 203.7 198.0
(a) Mine production figures for metals refer to the total quantity of metal produced in concentrates, leach liquor or doré bullion irrespective of whether these products are then refined onsite, except for the data for bauxite and iron ore which represent production of marketable quantities of ore plus concentrates and pellets.
(b) Through a joint venture agreement with Freeport-McMoRan (FCX), Rio Tinto is entitled to 40% of additional material mined as a consequence of expansions and developments of the Grasberg facilities since 1998. On 21 December 2018, Rio Tinto completed the sale of its entire interest in the Grasberg mine in Indonesia to PT Indonesia Asahan Aluminium (Persero) (Inalum). Production is reported up to 30 November 2018. Net cashflow of $0.1 billion relating to this production is included in the total divestments proceeds of $3.5 billion.
(c) Rio Tinto owns a 33.52% indirect interest in Oyu Tolgoi through its 50.79% interest in Turquoise Hill Resources Ltd.

Page 19 of 31
Rio Tinto share of production
Rio Tinto interest
Q4 2017
Q1 2018
Q2 2018
Q3 2018
Q4 2018
Full Year 2017
Full Year 2018
IRON ORE
Production ('000 tonnes) (a)
Hamersley mines (b) 56,501 53,631 56,034 54,583 56,364 206,760 220,612
Hamersley - Channar 60% 1,345 1,136 1,227 604 1,337 6,479 4,304
Hope Downs 50% 5,987 5,342 5,783 5,713 5,845 23,470 22,684
Iron Ore Company of Canada 59% 2,733 2,364 871 2,880 2,836 11,166 8,952
Robe River - Pannawonica (Mesas J and A) 53% 4,580 4,672 4,048 4,208 4,004 16,526 16,932
Robe River - West Angelas 53% 4,509 4,290 4,373 4,021 4,631 18,082 17,316
Rio Tinto iron ore production ('000 tonnes)
75,656 71,436 72,336 72,010 75,018 282,484 290,800
Breakdown of Production:
Pilbara Blend Lump
21,082 20,714 21,901 20,554 21,674 80,770 84,843
Pilbara Blend Fines
31,172 29,769 31,239 29,921 31,652 116,359 122,582
Robe Valley Lump
1,646 1,587 1,431 1,470 1,409 6,128 5,897
Robe Valley Fines
2,934 3,086 2,617 2,738 2,595 10,398 11,035
Yandicoogina Fines (HIY)
16,088 13,916 14,277 14,446 14,852 57,663 57,491
Pilbara iron ore production ('000 tonnes)
72,922 69,072 71,465 69,129 72,182 271,318 281,848
IOC Concentrate
1,163 799 572 1,131 1,433 5,020 3,934
IOC Pellets
1,571 1,566 299 1,750 1,403 6,146 5,018
IOC iron ore production ('000 tonnes)
2,733 2,364 871 2,880 2,836 11,166 8,952
Breakdown of Sales:
Pilbara Blend Lump
18,861 18,062 19,424 17,967 18,439 71,156 73,892
Pilbara Blend Fines
35,575 30,746 35,158 31,432 35,205 127,272 132,541
Robe Valley Lump
1,388 1,223 1,264 1,174 1,219 5,217 4,881
Robe Valley Fines
3,287 2,996 3,255 2,839 2,996 11,204 12,085
Yandicoogina Fines (HIY)
15,731 13,578 14,388 14,583 14,831 57,185 57,380
Pilbara iron ore sales ('000 tonnes)
74,843 66,604 73,489 67,995 72,690 272,034 280,778
IOC Concentrate
1,559 746 62 1,521 1,558 5,053 3,887
IOC Pellets
1,615 1,574 202 1,659 1,516 6,108 4,950
IOC Iron ore sales ('000 tonnes)
3,173 2,320 263 3,180 3,073 11,161 8,837
Rio Tinto iron ore sales ('000 tonnes) 78,016 68,925 73,752 71,175 75,763 283,195 289,614
(a) Mine production figures for metals refer to the total quantity of metal produced in concentrates, leach liquor or doré bullion irrespective of whether these products are then refined onsite, except for the data for bauxite and iron ore which represent production of marketable quantities of ore plus concentrates and pellets.
(b) Includes 100% of production from Paraburdoo, Mt Tom Price, Marandoo, Yandicoogina, Brockman, Nammuldi, Silvergrass and the Eastern Range mines. Whilst Rio Tinto owns 54% of the Eastern Range mine, under the terms of the joint venture agreement, Hamersley Iron manages the operation and is obliged to purchase all mine production from the joint venture and therefore all of the production is included in Rio Tinto's share of production.

Page 20 of 31
Rio Tinto share of production
Rio Tinto interest
Q4 2017
Q1 2018
Q2 2018
Q3 2018
Q4 2018
Full Year 2017
Full Year 2018
MOLYBDENUM
Mine production ('000 tonnes) (a)
Bingham Canyon 100% 1.9 1.5 0.7 1.4 2.2 5.0 5.8
(a) Mine production figures for metals refer to the total quantity of metal produced in concentrates, leach liquor or doré bullion irrespective of whether these products are then refined onsite, except for the data for bauxite and iron ore which represent production of marketable quantities of ore plus concentrates and pellets.
SALT
Production ('000 tonnes)
Dampier Salt 68% 1,535 1,514 1,662 1,481 1,496 5,090 6,153
SILVER
Mine production ('000 ounces) (a)
Bingham Canyon 100% 418 461 615 708 736 2,156 2,520
Escondida 30% 658 702 758 599 771 1,712 2,830
Grasberg - Joint Venture (b) 40% 0 0 0 0 253 0 253
Oyu Tolgoi (c) 34% 96 74 75 77 80 326 306
Rio Tinto total mine production
1,172 1,237 1,448 1,384 1,840 4,194 5,910
Refined production ('000 ounces)
Rio Tinto Kennecott 100% 516 867 461 730 807 2,378 2,865
(a) Mine production figures for metals refer to the total quantity of metal produced in concentrates, leach liquor or doré bullion irrespective of whether these products are then refined onsite, except for the data for bauxite and iron ore which represent production of marketable quantities of ore plus concentrates and pellets. (b) Through a joint venture agreement with Freeport-McMoRan (FCX), Rio Tinto is entitled to 40% of additional material mined as a consequence of expansions and developments of the Grasberg facilities since 1998. On 21 December 2018, Rio Tinto completed the sale of its entire interest in the Grasberg mine in Indonesia to PT Indonesia Asahan Aluminium (Persero) (Inalum). Production is reported up to 30 November 2018. Net cashflow of $0.1 billion relating to this production is included in the total divestments proceeds of $3.5 billion. (c) Rio Tinto owns a 33.52% indirect interest in Oyu Tolgoi through its 50.79% interest in Turquoise Hill Resources Ltd.
TITANIUM DIOXIDE SLAG
Production ('000 tonnes)
Rio Tinto Iron & Titanium (a) 100% 341 294 232 297 294 1,315 1,116
(a) Quantities comprise 100% of Rio Tinto Fer et Titane and Rio Tinto's 74% interest in Richards Bay Minerals (RBM).
URANIUM
Production ('000 lbs U3O8) (a)
Energy Resources of Australia 68% 919 667 603 820 924 3,458 3,014
Rössing (b) 69% 902 848 928 994 979 3,192 3,750
Rio Tinto total uranium production 1,821 1,515 1,531 1,814 1,904 6,650 6,764
(a) ERA and Rössing production reported are drummed U3O8. (b) On 26 November 2018, Rio Tinto signed a binding agreement to sell its 68.62% interest in the Rossing mine in Namibia to China National Uranium Corporation Limited. Production figures are sometimes more precise than the rounded numbers shown, hence small differences may result between the total of the quarter figures and the year to date figures.
The Rio Tinto percentage shown above is at 31 December 2018. Rio Tinto's interest in the Coal and Allied mines were sold in 2017. No data for these operations are included in the Share of production table.

Page 21 of 31
Rio Tinto operational data
Rio Tinto interest
Q4 2017
Q1 2018
Q2 2018
Q3 2018
Q4 2018
Full Year 2017
Full Year 2018
ALUMINA
Smelter Grade Alumina - Aluminium Group
Alumina production ('000 tonnes)
Australia
Queensland Alumina Refinery - Queensland 80.0% 966 896 940 935 927 3,735 3,697
Yarwun refinery - Queensland 100.0% 816 793 763 744 803 3,203 3,103
Brazil
São Luis (Alumar) refinery 10.0% 934 871 869 851 918 3,697 3,509
Canada
Jonquière (Vaudreuil) refinery - Quebec (a) 100.0% 365 362 365 363 354 1,448 1,444
(a) Jonquière’s (Vaudreuil’s) production shows smelter grade alumina only and excludes hydrate produced and used for specialty alumina.
Specialty Alumina - Aluminium Group
Specialty alumina production ('000 tonnes)
Canada
Jonquière (Vaudreuil) plant – Quebec 100.0% 29 31 32 31 29 122 124
Rio Tinto percentage interest shown above is at 31 December 2018. The data represent full production and sales on a 100% basis unless otherwise stated.

Page 22 of 31
Rio Tinto operational data
Rio Tinto interest
Q4 2017
Q1 2018
Q2 2018
Q3 2018
Q4 2018
Full Year 2017
Full Year 2018
ALUMINIUM
Primary Aluminium
Primary aluminium production ('000 tonnes)
Australia
Bell Bay smelter - Tasmania 100.0% 47 47 47 48 48 187 189
Boyne Island smelter - Queensland 59.4% 124 122 124 126 125 508 497
Tomago smelter - New South Wales 51.6% 149 145 148 151 149 590 592
Canada
Alma smelter - Quebec 100.0% 116 115 116 117 118 457 465
Alouette (Sept-Îles) smelter - Quebec 40.0% 150 144 146 148 146 598 584
Arvida smelter - Quebec 100.0% 44 43 43 43 44 171 173
Arvida AP60 smelter - Quebec 100.0% 14 13 13 13 13 57 52
Bécancour smelter - Quebec 25.1% 108 39 35 32 30 438 136
Grande-Baie smelter - Quebec 100.0% 58 57 58 59 59 229 233
Kitimat smelter - British Columbia 100.0% 110 108 109 110 109 433 436
Laterrière smelter - Quebec 100.0% 64 63 64 65 65 249 257
France
Dunkerque smelter (a) 0% 72 51 52 66 57 284 227
Iceland
ISAL (Reykjavik) smelter 100.0% 54 52 53 53 54 212 212
New Zealand
Tiwai Point smelter 79.4% 85 83 84 85 88 337 341
Oman
Sohar smelter 20.0% 27 87 97 98 99 253 380
(a) On 14 December 2018, Rio Tinto completed the sale of its 100% interest in the Dunkerque smelter. Production is reported up to the date of completion.
Rio Tinto percentage interest shown above is at 31 December 2018. The data represent full production and sales on a 100% basis unless otherwise stated.

Page 23 of 31
Rio Tinto operational data
Rio Tinto interest
Q4 2017
Q1 2018
Q2 2018
Q3 2018
Q4 2018
Full Year 2017
Full Year 2018
BAUXITE
Bauxite production ('000 tonnes)
Australia
Gove mine - Northern Territory 100.0% 3,224 3,124 3,274 2,893 3,250 11,201 12,540
Weipa mine - Queensland 100.0% 8,304 7,431 7,955 8,204 6,847 30,898 30,437
Brazil
Porto Trombetas (MRN) mine 12.0% 3,550 2,939 3,273 2,848 4,073 14,698 13,134
Guinea
Sangaredi mine (a) 23.0% 4,020 3,878 3,683 2,803 2,675 15,409 13,039
Rio Tinto share of bauxite shipments
Share of total bauxite shipments ('000 tonnes) 13,557 12,551 12,936 12,427 11,622 50,240 49,536
Share of third party bauxite shipments ('000 tonnes) 9,164 8,248 8,738 8,441 7,387 32,303 32,813
(a) Rio Tinto has a 22.95% shareholding in the Sangaredi mine but benefits from 45.0% of production.
Rio Tinto percentage interest shown above is at 31 December 2018. The data represent full production and sales on a 100% basis unless otherwise stated.

Page 24 of 31
Rio Tinto operational data
Rio Tinto interest
Q4 2017
Q1 2018
Q2 2018
Q3 2018
Q4 2018
Full Year 2017
Full Year 2018
BORATES
Rio Tinto Borates - borates 100.0%
US
Borates ('000 tonnes) (a)
120 124 132 137 118 517 512
(a) Production is expressed as B2O3 content.
COAL
Rio Tinto Coal Australia
Hail Creek Coal mine (a) 0.0%
Queensland
Hard coking coal ('000 tonnes)
1,555 924 1,380 396 -
5,247 2,700
Thermal coal ('000 tonnes)
958 1,293 1,018 449 -
4,134 2,760
Hunter Valley Operations (b) 0.0%
New South Wales
Semi-soft coking coal ('000 tonnes)
-
-
-
-
-
1,529 -
Thermal coal ('000 tonnes)
-
-
-
-
-
8,502 -
Kestrel Coal mine (c) 0.0%
Queensland
Hard coking coal ('000 tonnes)
1,309 430 1,303 484 -
4,252 2,217
Thermal coal ('000 tonnes)
226 74 220 35 -
843 329
Mount Thorley Operations (b) 0.0%
New South Wales
Semi-soft coking coal ('000 tonnes)
-
-
-
-
-
876 -
Thermal coal ('000 tonnes)
-
-
-
-
-
2,011 -
Rio Tinto percentage interest shown above is at 31 December 2018. The data represent full production and sales on a 100% basis unless otherwise stated.

Page 25 of 31
Rio Tinto operational data
Rio Tinto interest
Q4 2017
Q1 2018
Q2 2018
Q3 2018
Q4 2018
Full Year 2017
Full Year 2018
COAL (continued)
Warkworth mine (b) 0.0%
New South Wales
Semi-soft coking coal ('000 tonnes)
-
-
-
-
-
514 -
Thermal coal ('000 tonnes)
-
-
-
-
-
4,521 -
Total hard coking coal production ('000 tonnes) 2,864 1,354 2,683 880 -
9,499 4,917
Total semi-soft coking coal production ('000 tonnes) -
-
-
-
-
2,919 -
Total thermal coal production ('000 tonnes) 1,183 1,367 1,238 485 -
20,010 3,089
Total coal production ('000 tonnes)
4,047 2,721 3,921 1,365 -
32,429 8,007
Total coal sales ('000 tonnes)
4,092 3,050 3,717 1,725 -
32,053 8,492
Rio Tinto Coal Australia share (d)
Share of hard coking coal sales ('000 tonnes) 2,429 1,368 2,228 650 -
8,181 4,246
Share of semi-soft coal sales ('000 tonnes) (e) -
-
-
-
-
2,010 -
Share of thermal coal sales ('000 tonnes) (e) 896 1,119 791 754 -
13,186 2,664
(a) On 1 August 2018, Rio Tinto completed the sale of its 82% interest in the Hail Creek mine. Production is reported up to the date of completion. (b) On 1 September 2017, Rio Tinto completed the sale of Coal & Allied, a wholly owned subsidiary of Rio Tinto Coal Australia (RTCA) and production from these assets is included to this date. This included Coal & Allied’s 67.6% interest in the Hunter Valley Operations mine, 80% interest in the Mount Thorley mine and 55.6% interest in the Warkworth mine. In an earlier restructuring of the Coal & Allied group completed on 3 February 2016, Rio Tinto had obtained 100% of Coal & Allied and retained a 67.6% interest in the newly created Hunter Valley Operations joint venture. Prior to restructuring, Rio Tinto’s interest in the Hunter Valley Operations, Mount Thorley and Warkworth mines was 80%, 64% and 44.46% respectively. (c) On 1 August 2018, Rio Tinto completed the sale of its 80% interest in the Kestrel mine. Production is reported up to the date of completion. (d) Kestrel and Hail Creek produce hard coking coal and thermal coal through their mining operations. Both mines may blend coal types at ports. (e) Sales relate only to coal mined by the operations and exclude traded coal.
Rio Tinto percentage interest shown above is at 31 December 2018. The data represent full production and sales on a 100% basis unless otherwise stated.

Page 26 of 31
Rio Tinto operational data
Rio Tinto interest
Q4 2017
Q1 2018
Q2 2018
Q3 2018
Q4 2018
Full Year 2017
Full Year 2018
COPPER & GOLD
Escondida 30.0%
Chile
Sulphide ore to concentrator ('000 tonnes) 30,260 32,203 31,732 30,513 30,507 81,171 124,956
Average copper grade (%)
0.98 0.96 0.96 0.94 0.87 1.03 0.93
Mill production (metals in concentrates):
Contained copper ('000 tonnes)
245.7 252.6 253.6 241.9 219.9 684.5 968.0
Contained gold ('000 ounces)
50 60 68 64 74 146 266
Contained silver ('000 ounces)
2,193 2,339 2,527 1,997 2,570 5,707 9,433
Recoverable copper in ore stacked for leaching ('000 tonnes) (a)
63.9 50.4 54.4 49.4 45.7 218.2 199.9
Refined production from leach plants:
Copper cathode production ('000 tonnes)
76.1 69.4 70.1 55.4 71.9 238.0 266.8
(a) The calculation of copper in material mined for leaching is based on ore stacked at the leach pad.
Freeport-McMoRan
Grasberg mine (a) 0.0% (b)
Papua, Indonesia
Ore treated ('000 tonnes)
16,381 15,625 17,101 17,535 14,049 51,262 64,310
Average mill head grades:
Copper (%)
1.03 1.12 1.06 1.00 0.73 1.01 0.99
Gold (g/t)
1.28 1.63 1.77 1.77 1.08 1.15 1.59
Silver (g/t)
4.36 4.68 5.09 4.49 2.09 4.32 4.17
Production of metals in concentrates:
Copper in concentrates ('000 tonnes)
153.2 159.9 165.7 158.7 85.4 468.2 569.7
Gold in concentrates ('000 ounces)
579 693 842 842 402 1,602 2,779
Silver in concentrates ('000 ounces)
1,293 1,513 1,548 1,439 545 3,877 5,045
Sales of payable metals in concentrates: (c)
Copper in concentrates ('000 tonnes)
154.3 157.4 145.3 170.6 82.7 450.3 556.0
Gold in concentrates ('000 ounces)
584 676 740 903 399 1,540 2,719
Silver in concentrates ('000 ounces)
1,044 1,184 1,098 1,221 426 2,964 3,928
(a) Through a joint venture agreement with Freeport-McMoRan (FCX), Rio Tinto is entitled to 40% of additional material mined as a consequence of expansions and developments of the Grasberg facilities since 1998. The Q4 2018 results show the forecast from FCX's most recent five-year plan, because FCX is not releasing its actual 100% operating data for Q4 2018 until the release of its 2018 fourth-quarter results on 24 January 2019. On 21 December 2018, Rio Tinto completed the sale of its entire interest in the Grasberg mine in Indonesia to PT Indonesia Asahan Aluminium (Persero) (Inalum). (b) Rio Tinto share of Grasberg production is 40% of the expansion. (c) Net of smelter deductions.
Rio Tinto percentage interest shown above is at 31 December 2018. The data represent full production and sales on a 100% basis unless otherwise stated.

Page 27 of 31
Rio Tinto operational data
Rio Tinto interest
Q4 2017
Q1 2018
Q2 2018
Q3 2018
Q4 2018
Full Year 2017
Full Year 2018
COPPER & GOLD (continued)
Rio Tinto Kennecott
Bingham Canyon mine 100.0%
Utah, US
Ore treated ('000 tonnes)
9,074 9,260 8,974 11,173 10,853 39,382 40,260
Average ore grade:
Copper (%)
0.43 0.43 0.63 0.58 0.59 0.43 0.56
Gold (g/t)
0.21 0.23 0.26 0.26 0.26 0.25 0.25
Silver (g/t)
1.89 2.25 2.73 2.62 2.76 2.33 2.60
Molybdenum (%)
0.036 0.025 0.025 0.030 0.032 0.029 0.028
Copper concentrates produced ('000 tonnes) 162 171 194 233 222 704 820
Average concentrate grade (% Cu)
21.5 20.7 26.4 25.3 26.0 21.1 24.8
Production of metals in copper concentrates:
Copper ('000 tonnes) (a)
34.8 35.4 51.2 59.1 58.3 148.9 203.9
Gold ('000 ounces)
36 37 46 57 57 178 197
Silver ('000 ounces)
418 461 615 708 736 2,156 2,520
Molybdenum concentrates produced ('000 tonnes): 3.8 2.8 1.5 2.8 4.5 9.8 11.6
Molybdenum in concentrates ('000 tonnes)
1.9 1.5 0.7 1.4 2.2 5.0 5.8
Kennecott smelter & refinery 100.0%
Copper concentrates smelted ('000 tonnes) 90 200 224 246 262 644 932
Copper anodes produced ('000 tonnes) (b) 12.1 42.4 44.4 58.1 62.4 129.0 207.3
Production of refined metal:
Copper ('000 tonnes)
22.1 35.3 40.7 54.2 64.6 125.8 194.7
Gold ('000 ounces) (c)
55.4 40.8 48.4 50.3 58.6 203.7 198.0
Silver ('000 ounces) (c)
516 867 461 730 807 2,378 2,865
(a) Includes a small amount of copper in precipitates. (b) New metal excluding recycled material. (c) Includes gold and silver in intermediate products.
Rio Tinto percentage interest shown above is at 31 December 2018. The data represent full production and sales on a 100% basis unless otherwise stated.

Page 28 of 31
Rio Tinto operational data
Rio Tinto interest
Q4 2017
Q1 2018
Q2 2018
Q3 2018
Q4 2018
Full Year 2017
Full Year 2018
COPPER & GOLD (continued)
Turquoise Hill Resources
Oyu Tolgoi mine (a) 33.5%
Mongolia
Ore Treated ('000 tonnes)
10,838 9,561 10,164 9,652 9,361 41,177 38,738
Average mill head grades:
Copper (%)
0.53 0.51 0.48 0.51 0.55 0.51 0.51
Gold (g/t)
0.20 0.25 0.26 0.38 0.56 0.17 0.36
Silver (g/t)
1.54 1.32 1.17 1.19 1.22 1.39 1.22
Copper concentrates produced ('000 tonnes) 205.5 177.3 178.8 179.8 189.0 722.5 724.9
Average concentrate grade (% Cu)
22.0 21.9 22.0 21.9 21.9 21.8 21.9
Production of metals in concentrates:
Copper in concentrates ('000 tonnes)
45.3 38.8 39.4 39.4 41.5 157.4 159.1
Gold in concentrates ('000 ounces)
34.8 41.8 50.0 77.0 116.7 114.3 285.4
Silver in concentrates ('000 ounces)
285 221 225 230 238 974 914
Sales of metals in concentrates:
Copper in concentrates ('000 tonnes)
35.7 34.3 46.1 36.0 40.2 149.3 156.7
Gold in concentrates ('000 ounces)
27 31 51 55 111 111 248
Silver in concentrates ('000 ounces)
205 206 250 201 216 860 873
(a) Rio Tinto owns a 33.52% indirect interest in Oyu Tolgoi through its 50.79% interest in Turquoise Hill Resources.
Rio Tinto percentage interest shown above is at 31 December 2018. The data represent full production and sales on a 100% basis unless otherwise stated.

Page 29 of 31
Rio Tinto operational data
Rio Tinto interest
Q4 2017
Q1 2018
Q2 2018
Q3 2018
Q4 2018
Full Year 2017
Full Year 2018
DIAMONDS
Argyle Diamonds 100.0%
Western Australia
AK1 ore processed ('000 tonnes)
1,446 1,260 1,428 1,465 1,292 4,957 5,444
AK1 diamonds produced ('000 carats)
6,146 3,551 3,476 3,830 3,211 17,135 14,069
Diavik Diamonds 60.0%
Northwest Territories, Canada
Ore processed ('000 tonnes)
525 556 652 670 651 2,190 2,530
Diamonds recovered ('000 carats)
1,767 1,774 1,916 1,776 1,797 7,486 7,264
Rio Tinto percentage interest shown above is at 31 December 2018. The data represent full production and sales on a 100% basis unless otherwise stated.

Page 30 of 31
Rio Tinto operational data
Rio Tinto interest
Q4 2017
Q1 2018
Q2 2018
Q3 2018
Q4 2018
Full Year 2017
Full Year 2018
IRON ORE
Rio Tinto Iron Ore
Western Australia
Pilbara Operations
Saleable iron ore production ('000 tonnes)
Hamersley mines (a) 56,501 53,631 56,034 54,583 56,364 206,760 220,612
Hamersley - Channar 60.0% 2,241 1,893 2,045 1,007 2,228 10,798 7,173
Hope Downs 50.0% 11,975 10,685 11,567 11,426 11,691 46,941 45,368
Robe River - Pannawonica (Mesas J and A) 53.0% 8,642 8,816 7,637 7,940 7,555 31,182 31,947
Robe River - West Angelas 53.0% 8,507 8,094 8,252 7,587 8,738 34,116 32,672
Total production ('000 tonnes) 87,866 83,120 85,534 82,542 86,576 329,797 337,772
Breakdown of total production:
Pilbara Blend Lump
25,496 24,831 26,253 24,461 26,084 99,127 101,629
Pilbara Blend Fines
37,641 35,556 37,368 35,696 38,085 141,826 146,705
Robe Valley Lump
3,106 2,993 2,699 2,774 2,659 11,563 11,126
Robe Valley Fines
5,535 5,823 4,937 5,166 4,896 19,619 20,821
Yandicoogina Fines (HIY)
16,088 13,916 14,277 14,446 14,852 57,663 57,491
Breakdown of total sales:
Pilbara Blend Lump
22,377 21,457 22,954 21,644 22,161 86,059 88,215
Pilbara Blend Fines
43,039 37,320 42,638 38,100 42,497 155,895 160,555
Robe Valley Lump
2,619 2,307 2,386 2,215 2,301 9,843 9,209
Robe Valley Fines
6,202 5,652 6,141 5,356 5,652 21,140 22,801
Yandicoogina Fines (HIY)
15,731 13,578 14,388 14,583 14,831 57,185 57,380
Total sales ('000 tonnes) (b) 89,968 80,314 88,506 81,898 87,442 330,122 338,160
(a) Includes 100% of production from Paraburdoo, Mt Tom Price, Marandoo, Yandicoogina, Brockman, Nammuldi, Silvergrass and the Eastern Range mines. Whilst Rio Tinto owns 54% of the Eastern Range mine, under the terms of the joint venture agreement, Hamersley Iron manages the operation and is obliged to purchase all mine production from the joint venture and therefore all of the production is included in Rio Tinto's share of production. (b) Sales represent iron ore exported from Western Australian ports.
Iron Ore Company of Canada 58.7%
Newfoundland & Labrador and Quebec in Canada
Saleable iron ore production:
Concentrates ('000 tonnes)
1,980 1,360 974 1,926 2,441 8,549 6,700
Pellets ('000 tonnes)
2,675 2,667 510 2,979 2,389 10,467 8,545
IOC Total production ('000 tonnes)
4,655 4,027 1,484 4,905 4,830 19,016 15,245
Sales:
Concentrates ('000 tonnes)
2,655 1,271 105 2,590 2,653 8,605 6,619
Pellets ('000 tonnes)
2,750 2,681 343 2,825 2,581 10,402 8,430
IOC Total Sales ('000 tonnes)
5,404 3,951 449 5,415 5,234 19,006 15,049
Global Iron Ore Totals
Iron Ore Production ('000 tonnes)
92,521 87,146 87,018 87,448 91,406 348,814 353,017
Iron Ore Sales ('000 tonnes)
95,373 84,265 88,954 87,314 92,676 349,128 353,209
Rio Tinto percentage interest shown above is at 31 December 2018. The data represent full production and sales on a 100% basis unless otherwise stated.

Page 31 of 31
Rio Tinto operational data
Rio Tinto interest
Q4 2017
Q1 2018
Q2 2018
Q3 2018
Q4 2018
Full Year 2017
Full Year 2018
SALT
Dampier Salt 68.4%
Western Australia
Salt production ('000 tonnes) 2,246 2,215 2,431 2,167 2,188 7,446 9,001
TITANIUM DIOXIDE SLAG
Rio Tinto Iron & Titanium 100.0%
Canada and South Africa
(Rio Tinto share) (a)
Titanium dioxide slag ('000 tonnes)
341 294 232 297 294 1,315 1,116
(a) Quantities comprise 100% of Rio Tinto Fer et Titane and Rio Tinto's 74% interest in Richards Bay Minerals' production. Ilmenite mined in Madagascar is being processed in Canada.
URANIUM
Energy Resources of Australia Ltd
Ranger mine (a) 68.4%
Northern Territory, Australia
U3O8 Production ('000 lbs)
1,343 975 881 1,199 1,351 5,056 4,407
(a) ERA production data are drummed U3O8.
Rössing Uranium Ltd (a) (b) 68.6%
Namibia
U3O8 Production ('000 lbs)
1,314 1,236 1,352 1,449 1,427 4,652 5,465
(a) Rössing production data are drummed U3O8. (b) On 26 November 2018, Rio Tinto signed a binding agreement to sell its 68.62% interest in the Rossing mine in Namibia to China National Uranium Corporation Limited.
Rio Tinto percentage interest shown above is at 31 December 2018. The data represent full production and sales on a 100% basis unless otherwise stated.