fourth quarter 2017 financial results and business update/media/enb/documents/investor...
TRANSCRIPT

February 16, 2018 Al Monaco, Chief Executive Officer | John Whelen, Chief Financial Officer
Fourth Quarter 2017 Financial Results and Business Update

Legal Notice
2
Forward Looking Information This presentation includes certain forward looking statements and information (FLI) to provide potential investors, shareholders and unitholders of Enbridge Inc. (Enbridge or the Company), Enbridge Income Fund Holdings Inc. (ENF), Enbridge Energy Partners, L.P. (EEP) and Spectra Energy Partners, LP (SEP) with information about Enbridge, ENF, EEP, SEP and their respective subsidiaries and affiliates, including management’s assessment of their future plans and operations, which FLI may not be appropriate for other purposes. FLI is typically identified by words such as “anticipate”, “expect”, “project”, “estimate”, “forecast”, “plan”, “intend”, “target”, “believe”, “likely” and similar words suggesting future outcomes or statements regarding an outlook. All statements other than statements of historical fact may be FLI. In particular, this presentation contains FLI pertaining to, but not limited to, information with respect to the following: 2018 and future year strategic priorities and guidance; expected EBITDA or expected adjusted EBITDA; expected earnings/(loss) and earnings/(loss) per share; expected DCF and DCF/share; expected future cash flows debt/EBITDA and funds from operations to debt ratios; expectations on sources of liquidity and sufficiency of financial resources; secured growth projects and future growth, development and expansion program, including Mainline expansions and competitive position; expected closing of acquisitions and dispositions; expected streamlining of business;; dividend payout policy; dividend and distribution growth and dividend and distribution payout expectations; expected impact of tax reform, including sponsored vehicle impacts; project execution, including capital costs, expected construction and in service dates and regulatory approvals, including with respect to Line 3 Replacement; system throughput, capacity and expansions; and supply and demand forecasts.
Although we believe that the FLI is reasonable based on the information available today and processes used to prepare it, such statements are not guarantees of future performance and you are cautioned against placing undue reliance on FLI. By its nature, FLI involves a variety of assumptions, which are based upon factors that may be difficult to predict and that may involve known and unknown risks and uncertainties and other factors which may cause actual results, levels of activity and achievements to differ materially from those expressed or implied by the FLI, including, but not limited to, the following: the expected supply of and demand for crude oil, natural gas, natural gas liquids (NGL) and renewable energy; prices of crude oil, natural gas, NGL and renewable energy; exchange rates; inflation; interest rates; availability and price of labour and construction materials; operational reliability and performance; customer and regulatory approvals; maintenance of support and regulatory approvals for the projects; anticipated in-service dates; weather; the impact of the merger of Enbridge and Spectra Energy Corp; governmental legislation; acquisitions and dispositions and the timing thereof; the success of integration plans; impact of capital project execution on the Company’s future cash flows; credit ratings; capital project funding; expected EBITDA or expected adjusted EBITDA; expected earnings/(loss); expected earnings/(loss) per share; expected future cash flows and expected future DCF and DCF per share; estimated future dividends;; financial strength and flexibility; debt and equity market conditions, including the ability to access capital markets on favourable terms or at all; cost of debt and equity capital; economic and competitive conditions; changes in tax laws and tax rates; and changes in trade agreements; We caution that the foregoing list of factors is not exhaustive. Additional information about these and other assumptions, risks and uncertainties can be found in applicable filings with Canadian and U.S. securities regulators (including the most recently filed Form 10-K and any subsequently filed Form 10-Q, as applicable). Due to the interdependencies and correlation of these factors, as well as other factors, the impact of any one assumption, risk or uncertainty on FLI cannot be determined with certainty.
Except to the extent required by applicable law, we assume no obligation to publicly update or revise any FLI made in this presentation or otherwise, whether as a result of new information, future events or otherwise. All FLI in this presentation and all subsequent FLI, whether written or oral, attributable to Enbridge, ENF, EEP or SEP, or persons acting on their behalf, are expressly qualified in its entirety by these cautionary statements.
Non-GAAP Measures This presentation makes reference to non-GAAP measures, including adjusted earnings before interest, income taxes, depreciation and amortization (EBITDA), ongoing EBITDA distributable cash flow (DCF), ongoing DCF and DCF per share. Adjusted EBITDA represents EBITDA adjusted for unusual, non-recurring or non-operating factors on both a consolidated and segmented basis. Management uses adjusted EBITDA to set targets and to assess the performance. DCF is defined as cash flow provided by operating activities before changes in operating assets and liabilities (including changes in environmental liabilities) less distributions to noncontrolling interests and redeemable noncontrolling interests, preference share dividends and maintenance capital expenditures, and further adjusted for unusual, non-recurring or non-operating factors. Management also uses DCF to assess the performance and to set its dividend or distribution payout target. Management believes the presentation of these measures gives useful information to investors shareholders and unitholders as they provide increased transparency and insight into the performance of Enbridge, ENF, EEP and SEP. Reconciliations of forward looking non-GAAP financial measures to comparable GAAP measures are not available due to the challenges and impracticability with estimating some of the items, particularly with estimates for certain contingent liabilities, and estimating non-cash unrealized derivative fair value losses and gains and ineffectiveness on hedges which are subject to market variability and therefore a reconciliation is not available without unreasonable effort.
These measures are not measures that have a standardized meaning prescribed by generally accepted accounting principles in the United States of America (U.S. GAAP) and may not be comparable with similar measures presented by other issuers. A reconciliation of non-GAAP measures to the most directly comparable GAAP measures is available on the applicable entity’s website. Additional information on non-GAAP measures may be found in the earnings news releases or additional information on the applicable entity’s website, www.sedar.com or www.sec.gov.

Agenda
3
• 2017 Recap • Strategic & Business Update • Financial Results Review • 2018 Priorities
Line 3 Replacement

Closed Spectra acquisition
Achieved Year 1 synergy target
$12B projects put in service
Raised $14B+ of capital
Strong operational and safety performance
Achieved DCF/ share within guidance range ($3.68/share)
Strengthened sponsored vehicles: EEP, DCP, SEP
Established new 3-year plan and strategic priorities
2017 Recap
4 Sabal Trail – fully restored right of way L3 Replacement project

2018 – 2020 Strategic Priorities
1. Move to pure regulated pipelines/utility model – Focus on crown jewel businesses – De-emphasize, sell, monetize non-core assets
2. Accelerate de-leveraging – 5.0x Debt/EBITDA by end of 2018
3. Deliver premium cash flow & dividend growth – 10% DCF and dividend CAGR through 2020
4. Streamline the business – Top quartile cost performance – Effective sponsored vehicles
5. Extend growth beyond 2020 – Disciplined capital allocation
5
Liquids pipelines Gas pipelines Gas distribution NGL pipelines Renewable power

Economic Environment
6
Interest Rates • Positive energy fundamentals – Robust WCSB supply outlook
– Rising North American demand
• Tax reform – Immaterial impact to DCF through 2020
– Positive longer term
• Interest rate risks well managed – Prudent debt portfolio
– Financial hedges
– Inflation protection/escalators
2018 Planned term debt hedge position
Fixed Rate / Total Debt2 ~85%
~65%
Consolidated Cash Flow at Risk1
<3%
(1) Cash flow at risk measures the maximum cash flow loss that could result from adverse Market Price movements over a specified time horizon within a pre-determined level of statistical confidence under normal market conditions. (2) Current position, including impact of hedges.
2018 Interest rate sensitivity Budget Assumption DCF/ Share
+/- .25% Interest Rates 3M CDOR: 1.8%; 3M LIBOR: 1.9% 10Y GoC: 2.3%; 10Y UST: 2.6%
~$0.02
As of Dec.31, 2017

Mainline Performance and 2018 Outlook
Enbridge system optimized and operating at full capacity
1,737 1,995
2,185 2,405
2,530
0
500
1,000
1,500
2,000
2,500
3,000
2013 2014 2015 2016 2017 2018e
• Since 2014, expansions and optimization have added significant capacity
• Upstream customer disruptions impacted volumes in 2016 and 2017
• Capacity and throughput now being optimized
• Over 2,700kbpd ex-Gretna deliveries Dec 2017
• 2018 expected to remain very strong
Average Mainline Throughput
Effective Annual Capacity
Alberta Clipper Expansion and System Optimizations
7
Ex-
Gre
tna
Del
iver
ies
(KB
PD
)
Budget ~2,650
Dec 2017: 2,733kbpd
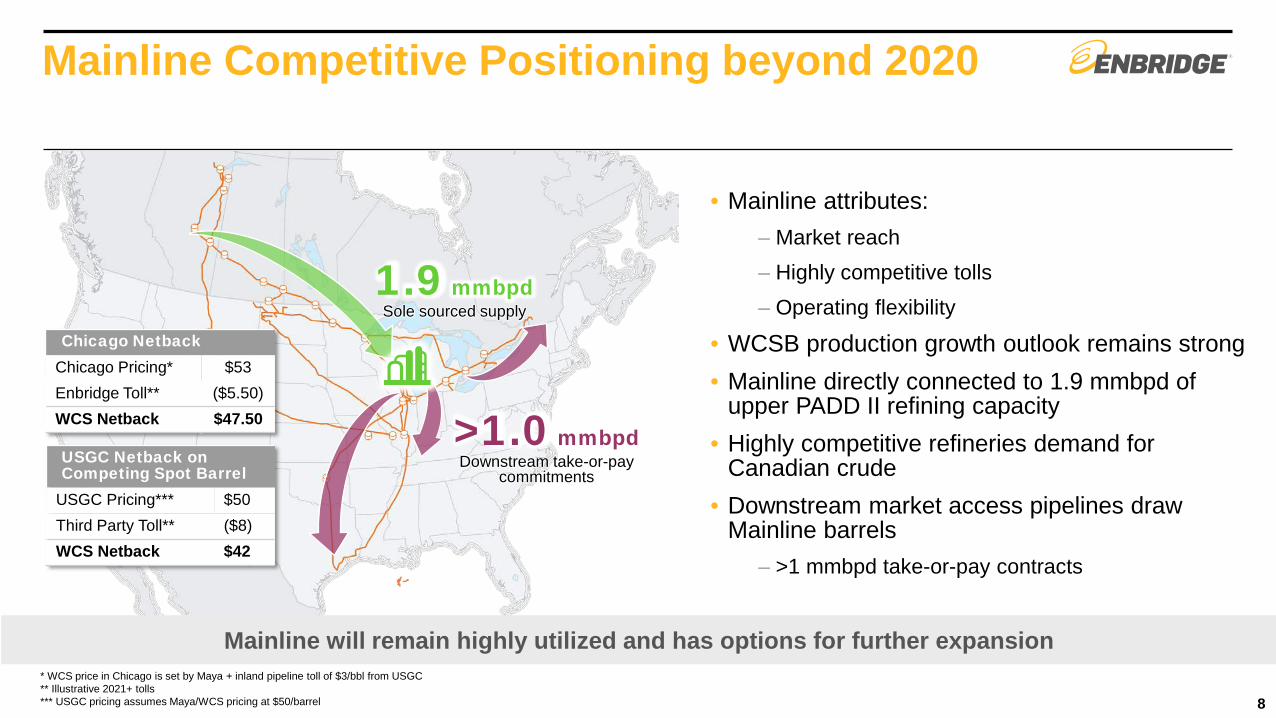
Mainline Competitive Positioning beyond 2020
• Mainline attributes: – Market reach – Highly competitive tolls – Operating flexibility
• WCSB production growth outlook remains strong • Mainline directly connected to 1.9 mmbpd of
upper PADD II refining capacity • Highly competitive refineries demand for
Canadian crude • Downstream market access pipelines draw
Mainline barrels – >1 mmbpd take-or-pay contracts
1.9 mmbpd Sole sourced supply
>1.0 mmbpd Downstream take-or-pay
commitments USGC Netback on Competing Spot Barrel
USGC Pricing*** $50 Third Party Toll** ($8) WCS Netback $42
* WCS price in Chicago is set by Maya + inland pipeline toll of $3/bbl from USGC ** Illustrative 2021+ tolls *** USGC pricing assumes Maya/WCS pricing at $50/barrel
Chicago Netback Chicago Pricing* $53 Enbridge Toll** ($5.50) WCS Netback $47.50
8
Mainline will remain highly utilized and has options for further expansion
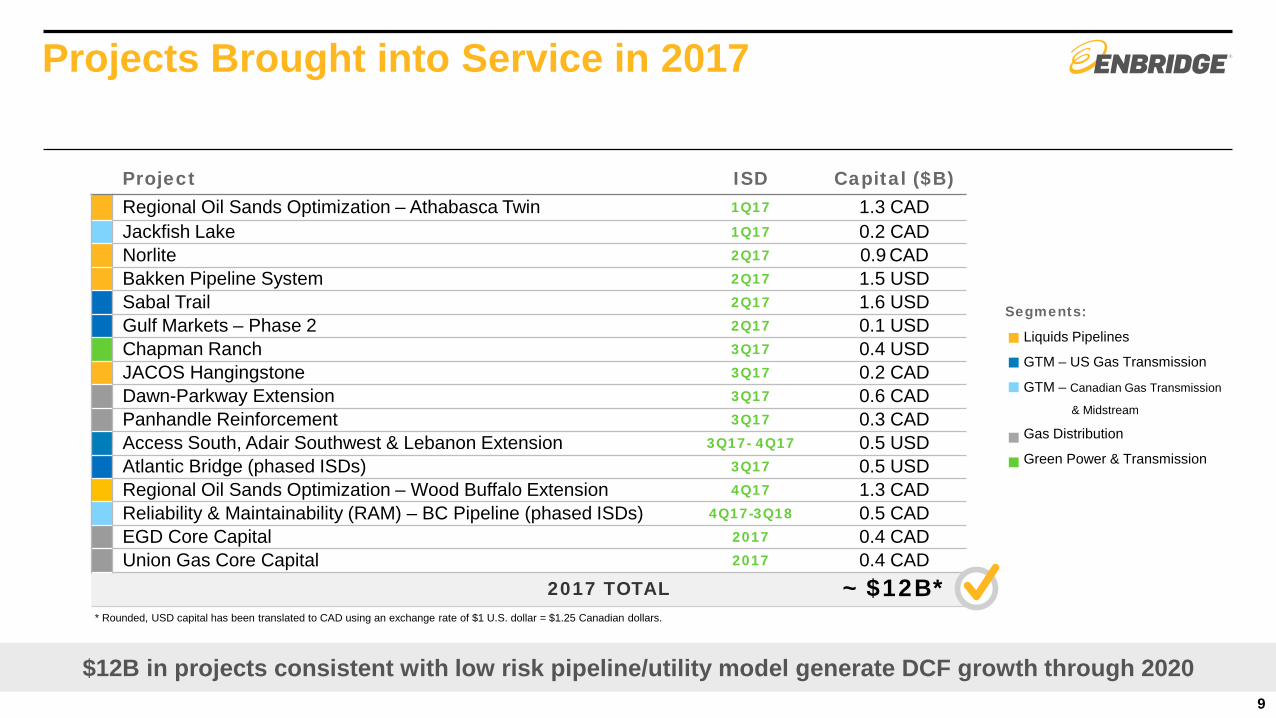
$12B in projects consistent with low risk pipeline/utility model generate DCF growth through 2020
Segments:
Liquids Pipelines
GTM – US Gas Transmission
GTM – Canadian Gas Transmission
& Midstream
Gas Distribution
Green Power & Transmission
Projects Brought into Service in 2017
* Rounded, USD capital has been translated to CAD using an exchange rate of $1 U.S. dollar = $1.25 Canadian dollars.
9
Project ISD Capital ($B) Regional Oil Sands Optimization – Athabasca Twin 1Q17 1.3 CAD Jackfish Lake 1Q17 0.2 CAD Norlite 2Q17 0.9 CAD
Bakken Pipeline System 2Q17 1.5 USD Sabal Trail 2Q17 1.6 USD Gulf Markets – Phase 2 2Q17 0.1 USD Chapman Ranch 3Q17 0.4 USD JACOS Hangingstone 3Q17 0.2 CAD Dawn-Parkway Extension 3Q17 0.6 CAD Panhandle Reinforcement 3Q17 0.3 CAD Access South, Adair Southwest & Lebanon Extension 3Q17- 4Q17 0.5 USD Atlantic Bridge (phased ISDs) 3Q17 0.5 USD Regional Oil Sands Optimization – Wood Buffalo Extension 4Q17 1.3 CAD Reliability & Maintainability (RAM) – BC Pipeline (phased ISDs) 4Q17-3Q18 0.5 CAD EGD Core Capital 2017 0.4 CAD Union Gas Core Capital 2017 0.4 CAD
2017 TOTAL ~ $12B*

$22 billion of diversified low-risk secured growth projects
Enterprise-wide Secured Growth Projects
10
Segments: Liquids Pipelines GTM – US Gas Transmission GTM – Canadian Gas Transmission & Midstream Gas Distribution Green Power & Transmission
Project Expected ISD Capital (C$B)
2019
Stratton Ridge 1Q19 0.2 USD PennEast 2H19 0.3 USD Hohe See Wind & Expansion – Germany 2H19 2.1 CAD Line 3 Replacement – Canada Portion 2H19 5.3 CAD Line 3 Replacement – U.S. Portion 2H19 2.9 USD Southern Access to 1,200 kbpd 2H19 0.4 USD Spruce Ridge 2H19 0.5 CAD Utility Core Capital 2019 0.8 CAD
2019 TOTAL $13B*
2020
T-South Expansion 2H20 1.0 CAD Utility Core Capital 2020 0.7 CAD
2020 TOTAL $2B* TOTAL Capital Program $22B*
* Rounded, USD capital has been translated to CAD using an exchange rate of $1 U.S. dollar = $1.25 Canadian dollars.
Project Expected ISD Capital (C$B)
2018
High Pine 1Q18 0.4 CAD Stampede Lateral 1Q18 0.2 USD Wyndwood 1Q18 0.2 CAD Rampion Wind – UK 2Q18 0.8 CAD RAM In service + 3Q18 0.5 CAD NEXUS 3Q18 1.3 USD TEAL 3Q18 0.2 USD Atlantic Bridge In service + 4Q18 0.5 USD Valley Crossing Pipeline 4Q18 1.5 USD STEP 4Q18 0.1 USD Utility Core Capital 2018 0.5 CAD Other Various 0.1 CAD
2018 TOTAL $7B*

Project Execution Highlights
11
Natural Gas: NEXUS
Natural Gas: Valley Crossing
Renewables: Rampion
• Construction began October 2017 • 25% complete in Michigan • Expected in service 3Q18
• Construction began April 2017 • 80% complete • Expected in service 4Q18
• All 116 turbines installed • Grid connections under way • Full operations expected 2Q18
Rampion
Offshore wind assets Under construction In pre-construction In development
Key 2018 projects on track for completion
TX
Mexico
Valley Crossing Pipeline
Brownsville
Texas Eastern
Nueces Hub

Line 3 Replacement Project Update
• Critical infrastructure replacement project
• 2017 Canadian construction program completed on time and on budget
– 400km of pipeline laid
• Wisconsin construction complete
• Minnesota regulatory process advancing on timeline
– ALJ recommendation April 23
– MPUC vote expected in June
Expected in-service date in the second half of 2019
Edmonton
Hardisty
Kerrobert
Gretna
Superior ND
WI MN
Regina
Construction complete
In service segments
to date
Construction complete
12

Sponsored Vehicle Update
Rationale:
• Lower SEP cost of capital to be more competitive for future growth
• Aligns interest of all unitholders
• Simplifies the SEP structure Terms:
• 172.5 million common shares in SEP
• Economic value of ~ US$7.2 billion
• 15.7x 2018 GP incentive
• Neutral accretion by end of 2019
Positioning SEP for future organic growth, acquisition or dropdown of natural gas assets
SEP IDR Elimination
13
30%
52%
83%
18% 17%
Before AfterENB IDR & GP 2% interests ENB LP interest Public LP interest
SEP Equity Capital Structure (2018e)
ENB economic interest
Proportion of distributed cash flows

2016 2017
$6,902
$10,317
2016 2017
$1,762
$2,963
2016 2017
$3,713
$5,614
2016 2017
$879
$1,741
2017 Consolidated Financial Results Summary
Adjusted earnings before interest, taxes, depreciation and amortization (adjusted EBITDA) and DCF are non-GAAP measures. For more information on non-GAAP measures please refer to disclosure in the Q4 earnings release and MD&A available at www.enbridge.com. Adjusted EBITDA is not presented on a $/share basis. 14
Q4: $0.95/share $1.05/share
3 months ended Dec 31
Adjusted EBITDA ($ millions)
12 months ended Dec 31 3 months ended Dec 31 12 months ended Dec 31
DCF ($ millions, except per share amounts)
YTD: $4.08/share $3.68/share
Achieved 2017 DCF/share guidance range of $3.60 - $3.90/share

(C$ Millions) Q4 FY 2016 Consolidated Adjusted EBITDA 1,762 6,902 EBIDTA Drivers:
VA
RIA
NC
E
Liquids Pipelines +127 +157 + Higher throughput on Mainline System + New Projects placed into service - Normalization policy changes (make-up rights)
Gas Transmission and Midstream +854 +2,691 + Spectra Energy assets + Increased fractionation margins - Weaker processing volumes at Midcoast
Gas Distribution +212 +546 + Union Gas assets + Q4 2017 benefited from colder weather - Full year 2017 had slightly warmer weather ($18MM)
Green Power and Transmission +18 +24 + Stronger wind resources + Contributions from new assets
Energy Services (17) (82) - Low commodity prices impacted location and quality xdifferentials
Eliminations and Other +7 +79 + Lower hedge settlement losses + Corporate synergies
2017 Consolidated Adjusted EBITDA 2,963 10,317
Q4 and FY 2017 Consolidated Adjusted EBITDA Variance
15
(1) Adjusted EBITDA is a non-GAAP measure. Reconciliations to GAAP measures can be found in the Q4 earnings release available at www.enbridge.com. (2) Reflects results from Spectra Energy assets from close of merger transaction, February 27, 2017.
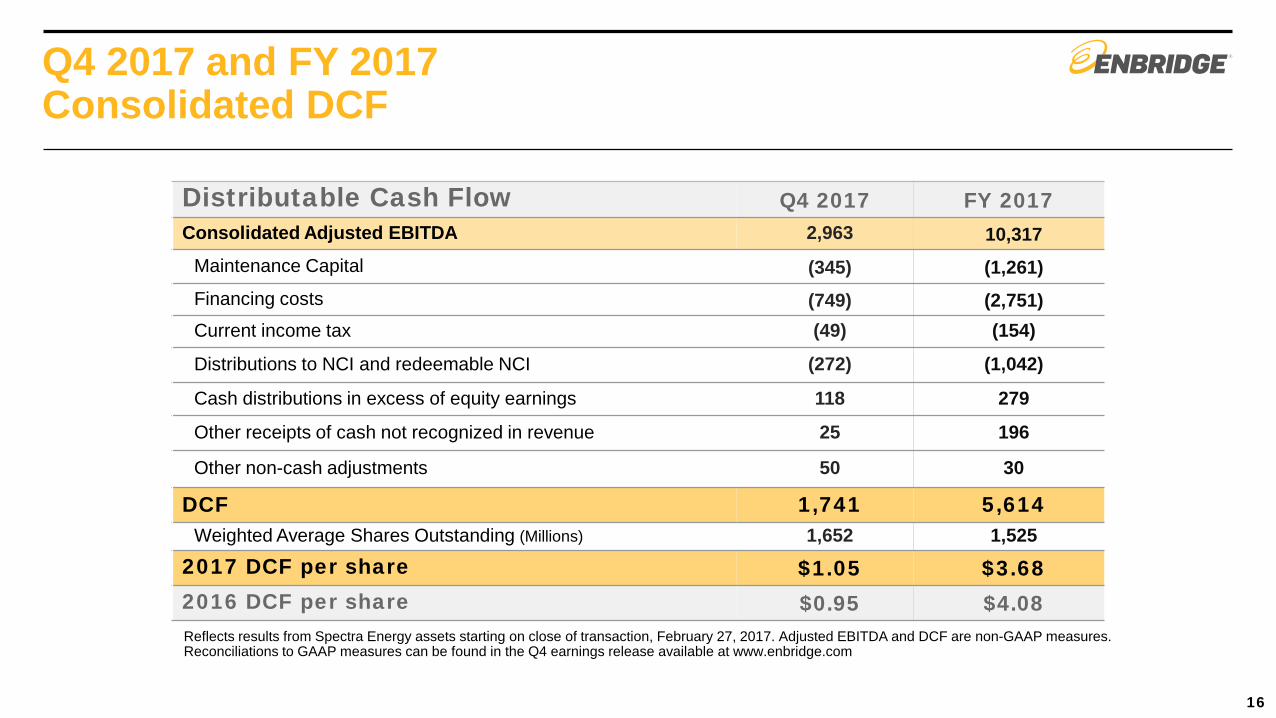
Q4 2017 and FY 2017 Consolidated DCF
Reflects results from Spectra Energy assets starting on close of transaction, February 27, 2017. Adjusted EBITDA and DCF are non-GAAP measures. Reconciliations to GAAP measures can be found in the Q4 earnings release available at www.enbridge.com
16
Distributable Cash Flow Q4 2017 FY 2017 Consolidated Adjusted EBITDA 2,963 10,317
Maintenance Capital (345) (1,261) Financing costs (749) (2,751) Current income tax (49) (154)
Distributions to NCI and redeemable NCI (272) (1,042)
Cash distributions in excess of equity earnings 118 279
Other receipts of cash not recognized in revenue 25 196
Other non-cash adjustments 50 30
DCF 1,741 5,614 Weighted Average Shares Outstanding (Millions) 1,652 1,525
2017 DCF per share $1.05 $3.68 2016 DCF per share $0.95 $4.08

US Tax Reform Impacts
Q4 2017 Consolidated GAAP Reporting Impacts • Re-measurement of deferred tax liability for US federal tax rate reduction and other measurable impacts
– Estimated $2.0B net recovery flows through GAAP earnings (non-cash, normalized in Adjusted EBITDA, Adjusted Earnings and DCF)
Potential Long Term Impacts • Changes to revenue/DCF generated from Cost of Service (COS) arrangements
– Immediate: neutral to consolidated Company Outlook
– Longer term: not expected to be material
• Cash taxes – In combination, impacts are not expected to be material to DCF
– Benefits from lower tax rate and bonus depreciation offset by limits on interest deductibility and use of NOLs
• Components of legislation still subject to clarification through regulation and/or further interpretive guidance
Sponsored Vehicle Impacts • MLPs retain tax advantage • Immediate and/or potential impacts on COS revenue
– Modestly negative for EEP; modestly positive for ENF; neutral for SEP
No material economic impact within 2018 – 2020 planning horizon
17

Re-affirming 2018 Guidance
2018 EBITDA Guidance ($MM) 2017 2018e
Growth Drivers: 2018e vs 2017
Liquids Pipelines 5,484 ~6,350 + New projects placed into service + Capacity optimization and supply growth + Realized FX rates
Gas Transmission & Midstream 3,350 ~3,900
+ New projects placed into service + Full year results from Spectra assets - Planned asset monetization
Gas Distribution 1,379 ~1,650 + Full year results from Spectra assets + Rate base growth
Green Power & Transmission 379 ~425 + New projects
- Planned asset monetization
Energy Services (52) ~25 + Termination of certain capacity commitments
Eliminations & Other (223) ~150 + Enterprise-wide cost saving initiatives
Consolidated EBITDA: 10,317 ~12,500
Guidance underpinned by liquids volume growth and new projects coming into service
18
2017a 2018e
~$12,500
Consolidated EBITDA ($MM)
$10,317
(1) Adjusted EBITDA is a non-GAAP measure. Reconciliations to GAAP measures can be found in the Q4 earnings release available at www.enbridge.com.

Spectra Energy Partners (SEP): Q4 2017
19
IDR elimination positions SEP for extended growth
(US$ millions, except per share amounts) Q4 2017
Q4 2016 Variance FY 2017
FY 2016 Variance
FY 2017 Guidance
FY 2018 Guidance
Ongoing EBITDA 532 +22 2,179 +306
Ongoing DCF 358 +28 1,530 +235 $1,400 – 1,480 $1,630 - 1,670 Distribution Coverage (as declared) 1.1x 1.2x 1.05x – 1.15x 1.1x – 1.2x
Debt/EBITDA1 4.1x 4.1x ~4.0x < 4.0x through 2020
Distribution per unit (as declared) $0.73875 +$0.05 $2.88 +$0.20
$0.0125/unit increase
per quarter
$0.0125/unit increase
per quarter
Ongoing EBITDA and Ongoing Distributable Cash Flow are non-GAAP measures. Reconciliations to GAAP measures can be found in the SEP Q4 earnings release and Reg G schedule available at www.spectraenergypartners.com. 1) As reported, after internal adjustments for trailing 12 months.
Effect of US Tax Reform • 4Q17 Reporting Implications
– $860 million non-cash charge due to the establishment of a regulatory liability related to lower tax rate • Future Implications
– Impacts to recourse rates subject to rate case – Tax allowance would be one of many potentially offsetting factors in establishing go-forward rates in a rate case
No material impact to DCF expected over 2018-2020 plan horizon; guidance unchanged
Financial Results
(US$ millions, except per share amounts) Q4 2017
Q4 2016 Variance FY 2017
FY 2016 Variance
FY 2017 Guidance
FY 2018 Guidance
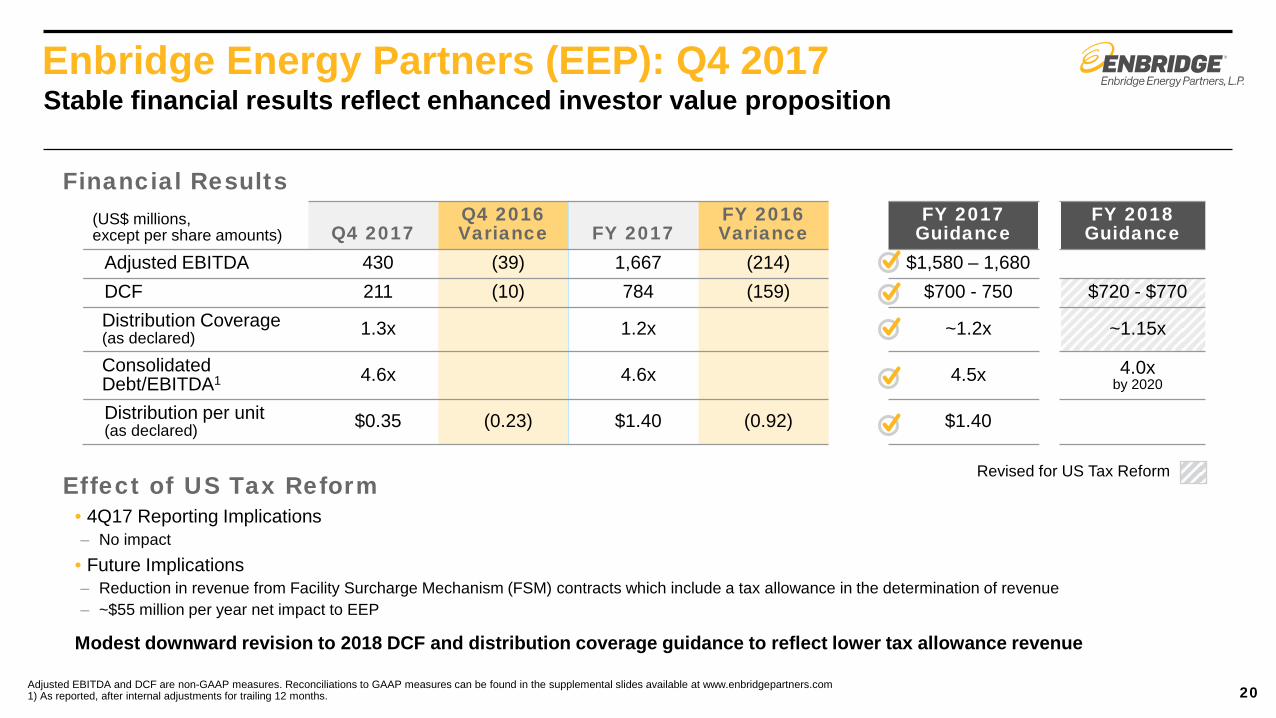
Adjusted EBITDA 430 (39) 1,667 (214) $1,580 – 1,680 DCF 211 (10) 784 (159) $700 - 750 $720 - $770 Distribution Coverage (as declared) 1.3x 1.2x ~1.2x ~1.15x
Consolidated Debt/EBITDA1 4.6x 4.6x 4.5x 4.0x
by 2020
Distribution per unit (as declared) $0.35 (0.23) $1.40 (0.92) $1.40
Enbridge Energy Partners (EEP): Q4 2017
20
Stable financial results reflect enhanced investor value proposition
Adjusted EBITDA and DCF are non-GAAP measures. Reconciliations to GAAP measures can be found in the supplemental slides available at www.enbridgepartners.com 1) As reported, after internal adjustments for trailing 12 months.
Effect of US Tax Reform • 4Q17 Reporting Implications – No impact
• Future Implications – Reduction in revenue from Facility Surcharge Mechanism (FSM) contracts which include a tax allowance in the determination of revenue – ~$55 million per year net impact to EEP
Modest downward revision to 2018 DCF and distribution coverage guidance to reflect lower tax allowance revenue
Revised for US Tax Reform
Financial Results

(US$ millions, except per share amounts) Q4 2017
Q4 2016 Variance FY 2017
FY 2016 Variance
FY 2017 Guidance
FY 2018 Guidance
Fund Group DCF 565 +74 1,976 +139 $1,900 – 2,100 $2,450 - 2,650 Distributions Paid 409 +6 1,618 +23
Fund Group Debt/EBITDA1 5.3x 5.3x < 5.0x by end of 2018
Fund Group Payout Ratio 72% 82% 80-90% 80-90%
ENF Earnings 86 +19 307 +55 ENF Dividend/Share $0.5133 +0.0468 $2.0532 +0.1872 $2.05 $2.26
Effect of US Tax Reform • 4Q17 Reporting Implications – $52 million non-cash charge related to re-measurement of deferred tax asset at reduced tax rates
• Future Implications – Revenue gain as a result of EEP’s FSM toll decrease
No expected material impact to Fund Group DCF going forward; guidance unchanged
Financial Results
ENF & Fund Group: Q4 2017
21
New projects and strong mainline volume drive cash flow growth
Adjusted EBITDA and DCF are non-GAAP measures. Reconciliations to GAAP measures can be found in the ENF Q4 earnings release and MD&A available at www.enbridgeincomefund.com. 1) As reported, after internal adjustments for trailing 12 months.

0%
5%
10%
15%
20%
2015 2016 2017 2018e 2019e 2020e
$22
$14
$4 $3
$13
$0
$5
$10
$15
$20
$25
$30
$35
$40
$45
Uses Sources
Funding Plan Update
22
Prudent and executable plan to accelerate de-leveraging, while funding secured capital growth
0
2
4
6
8
2015 2016 2017 2018e 2019e 2020e
Consolidated DEBT to EBITDA
Consolidated FFO to Debt
Target: ≤ 5.0x
Target: ≥ 15%
Capital Expenditures
Sr. Debt Reduction
DRIP/ Optional hybrid securities / Optional SV Equity
Optional asset sales
$4
2018 – 2020 Funding Plan*($C billions)
$23B Internal cash flow net of dividends
Common equity
Hybrid securities
Asset sales
$2
* Includes amounts “pre-funded” in December 2017

Wrap Up
• 2017 was a transformational year – Well diversified, best in class North
American energy infrastructure assets
• Strong outlook – Fundamentals supportive
– Secured growth projects
• Strategic plan in place – Monetize non-core businesses
– Strengthen balance sheet
– 10% DCF growth
• Focus on execution in 2018
23
Line 3 Replacement project

Q&A

Enbridge Income Fund Holdings Inc. Fourth Quarter 2017 Supplemental Slides
Investor Relations Nafeesa Kassam
403-266-8325 | [email protected]

Fund Group: Distributable Cash Flow
(C$ Millions) 4Q16 4Q17 Liquids Pipelines 507 599 Gas Pipelines 40 56 Green Power 62 71 Eliminations and Other 15 22 Adjusted EBITDA 624 748
Cash distributions received in excess of equity earnings 23 9 Maintenance capital expenditures (38) (30) Interest expense (80) (104) Current income taxes (2) (27) EIPLP cash incentive distribution rights (12) (12) Other adjusting items 28 32
EIPLP DCF 543 616 Fund and ECT operating, administrative and interest expense (52) (51)
Fund Group DCF 491 565
26 *Distributable Cash Flow (DCF) is a non-GAAP measure. For more information on non-GAAP measures please refer to disclosure in the MD&A available at www.enbridgeincomefund.com

Fund Group: 2017e-2020e Outlook
1Includes Enbridge Commercial Trust incentive fees *Distributable Cash Flow (DCF) is a non-GAAP measure. For more information on non-GAAP measures please refer to disclosure in the MD&A available at www.enbridgeincomefund.com
$1,900
27
Distributable Cash Flow 2018e 2019e 2020e EIPLP Adjusted EBITDA ~$3,550 ~$3,650 ~$4,350
Maintenance capital ~(80) ~(85) ~(85)
Current income taxes ~(230) ~(300) ~(450)
Financing Costs ~(550) Cash distributions in excess (less than) equity earnings ~50
Special interest rights distributions – IDR and Incentive fees1 ~(250)
Other non-cash adjustments ~60
Fund Group DCF $2,450 - $2,650 ~$2,600 ~$2,900
Fund Group Payout Ratio 80-90% 80-90% 80-90%
Coverage 1.2x-1.3x 1.2x-1.3x 1.2x-1.3x
EBITDA Growth Drivers
Liquids Pipelines ++ Gas Pipelines ~ Green Power ~ Cost management +
Distribution Growth Secured Capital Program
2018: $2.26 (10% vs 2017)
2019/20 10% Growth
Liquids pipelines expansion and volume growth drives attractive cash flow and dividend growth

Fund Group: Key Balance Sheets Metrics & Funding Progress
12/31/17 Consolidated Fund Group Leverage 40.5%
Consolidated Fund Group Debt/EBITDA 5.3x
Enbridge Income Fund Credit Ratings Baa3 / BBB (High)(2)
Enbridge Pipelines Inc. Credit Ratings BBB+ / A (3) (1) Calculated in accordance with the credit agreements (2) Moody’s / DBRS senior unsecured ratings (3) S&P / DBRS senior unsecured ratings.
November 2017
$0.7B ENF common share offering
2018e Debt to EBITDA forecast
Below 5.0x by end of 2018
All equity requirements through 2020 have been met
28
All equity requirements through 2020 have been met

• Low cost, phased expansions of the Mainline
• Alliance pipeline expansion
– Expression of interest underway
• Right of first offer with ENB on growth within existing asset footprint
$1.59 $1.87
$2.05 $2.26
$-
$0.50
$1.00
$1.50
$2.00
$2.50
$3.00
2015 2016 2017 2018e 2020e
Significant Dividend Income
Dividend per Share 2015 – 2020e
Growth Beyond 2020
29

Investor Value Proposition
Outstanding asset footprint
• High quality, strategically positioned Canadian energy infrastructure assets
• Infrastructure connecting growing supply basins with premium markets
Low risk business model
• Minimal commodity price and throughput exposure
• Long-term commercial agreements with strong counterparties
Visible growth
• 10% annual DPS growth through 2020
• Highly visible and secured growth in execution
• Opportunities for future development
• Embedded growth providing dividend growth through 2020 and beyond
Strong sponsor
• Aligned with ENF shareholders
• Ongoing backstop for funding secured growth
• Access to operational and financial project execution expertise
Premier Canadian Energy Infrastructure Income Investment
30

Spectra Energy Partners Fourth Quarter 2017 Supplemental Slides
Investor Relations Roni Cappadonna
713-627-4778 | [email protected]
Spectra Energy Partners (SEP): Ongoing Distributable Cash Flow
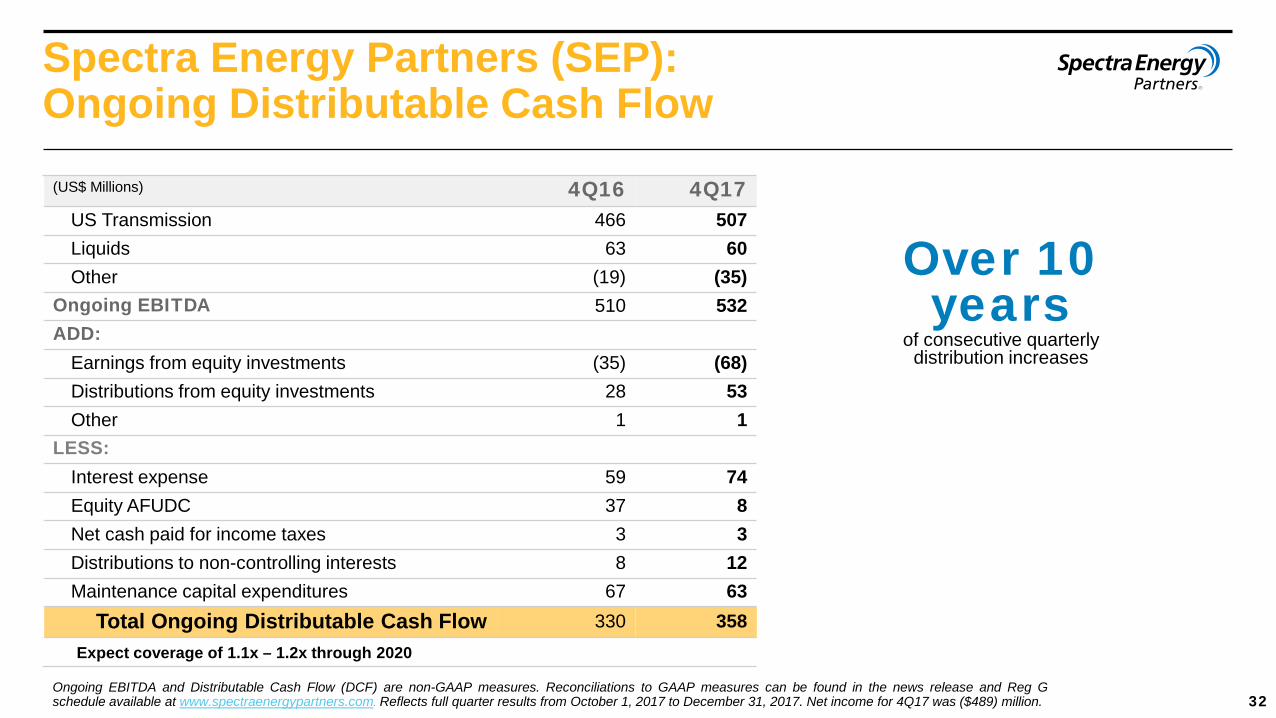
Over 10 years
of consecutive quarterly distribution increases
(US$ Millions) 4Q16 4Q17 US Transmission 466 507 Liquids 63 60 Other (19) (35)
Ongoing EBITDA 510 532 ADD:
Earnings from equity investments (35) (68) Distributions from equity investments 28 53 Other 1 1
LESS: Interest expense 59 74 Equity AFUDC 37 8 Net cash paid for income taxes 3 3 Distributions to non-controlling interests 8 12 Maintenance capital expenditures 67 63
Total Ongoing Distributable Cash Flow 330 358 Expect coverage of 1.1x – 1.2x through 2020
32 Ongoing EBITDA and Distributable Cash Flow (DCF) are non-GAAP measures. Reconciliations to GAAP measures can be found in the news release and Reg G schedule available at www.spectraenergypartners.com. Reflects full quarter results from October 1, 2017 to December 31, 2017. Net income for 4Q17 was ($489) million.

Spectra Energy Partners: Key Balance Sheets Metrics
Committed to investment grade balance sheet
12/31/17 Total Debt $8.5B
Financial Covenant Metrics(1) 4.1x Debt/EBITDA
Credit Ratings(2) Baa2 / BBB+ / BBB Available Liquidity $0.4B (1) Calculated in accordance with the credit agreements; max 5.0x (2) Moody’s / S&P / Fitch senior unsecured ratings
33
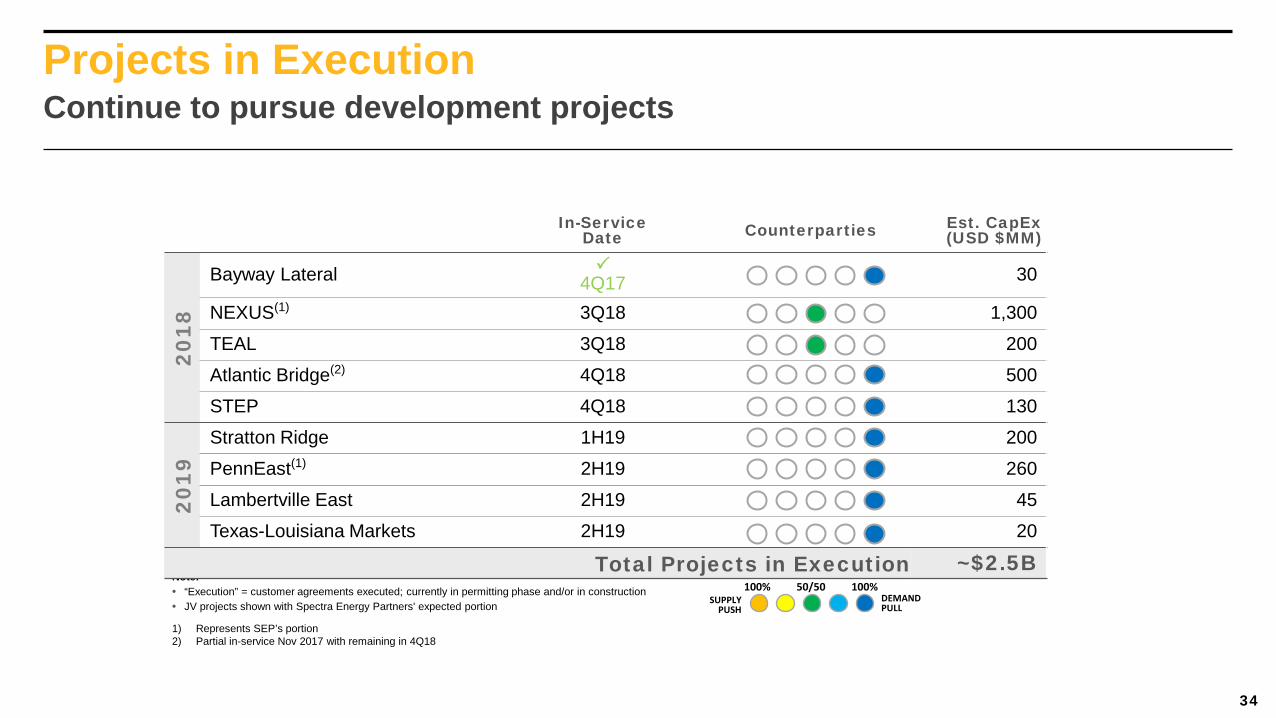
Projects in Execution
SUPPLY PUSH
100% 100%50/50DEMAND PULL
Note: • “Execution” = customer agreements executed; currently in permitting phase and/or in construction • JV projects shown with Spectra Energy Partners' expected portion
In-Service Date Counterparties Est. CapEx
(USD $MM)
2018
Bayway Lateral 4Q17 30
NEXUS(1) 3Q18 1,300
TEAL 3Q18 200
Atlantic Bridge(2) 4Q18 500
STEP 4Q18 130
2019
Stratton Ridge 1H19 200
PennEast(1) 2H19 260
Lambertville East 2H19 45
Texas-Louisiana Markets 2H19 20
Total Projects in Execution ~$2.5B
Continue to pursue development projects
1) Represents SEP’s portion 2) Partial in-service Nov 2017 with remaining in 4Q18
34

Investor Value Proposition
Stable business model
• Primarily natural gas pipeline focused
• Fee-based revenues with no direct commodity exposure and minimal volume risk
• Strong investment-grade customers
Outstanding asset footprint
• Well-positioned platform for further demand-pull expansion
• Track record of successful project execution
Prudent financial management
• Commitment to investment grade balance sheet
• Significant liquidity
Attractive distribution
growth
• 41st consecutive quarterly distribution increase
• Sustainable growth with strong coverage
Stable. Disciplined. Reliable. We go “where the lights are” – connecting diverse supply basins with regional demand markets – “last mile” competitive advantage
35

Enbridge Energy Partners Fourth Quarter 2017 Supplemental Slides
Investor Relations Roni Cappadonna
713-627-4778 | [email protected]

EEP Unit Structure as of December 31, 2017
Unit Class(1) ENB(5) Public TOTAL Cash Paying LP units(2) A 110.8 215.7 326.5 B 7.8 - 7.8 E 18.1 - 18.1 EEQ PIK Shares(4) 10.5 79.3 89.8 Incentive units – Class F(6) - - - TOTAL 147.2 295.0 442.2
Economic Interest(3) 34.6% 65.4%
(Millions of units)
(1) Does not include 2% GP interest (2) All limited partner units receive the same US $1.40 annualized distribution (3) Includes GP Interest (4) Enbridge Energy Management, L.L.C. (EEQ) Listed Shares outstanding equals the number of I-units issued by EEP, all of which i-units are owned by EEQ (5) Unless otherwise specified, units are owned by Enbridge Energy Company, Inc. or its wholly-owned subsidiaries (6) 1,000 Class F units outstanding
SLIDE 37
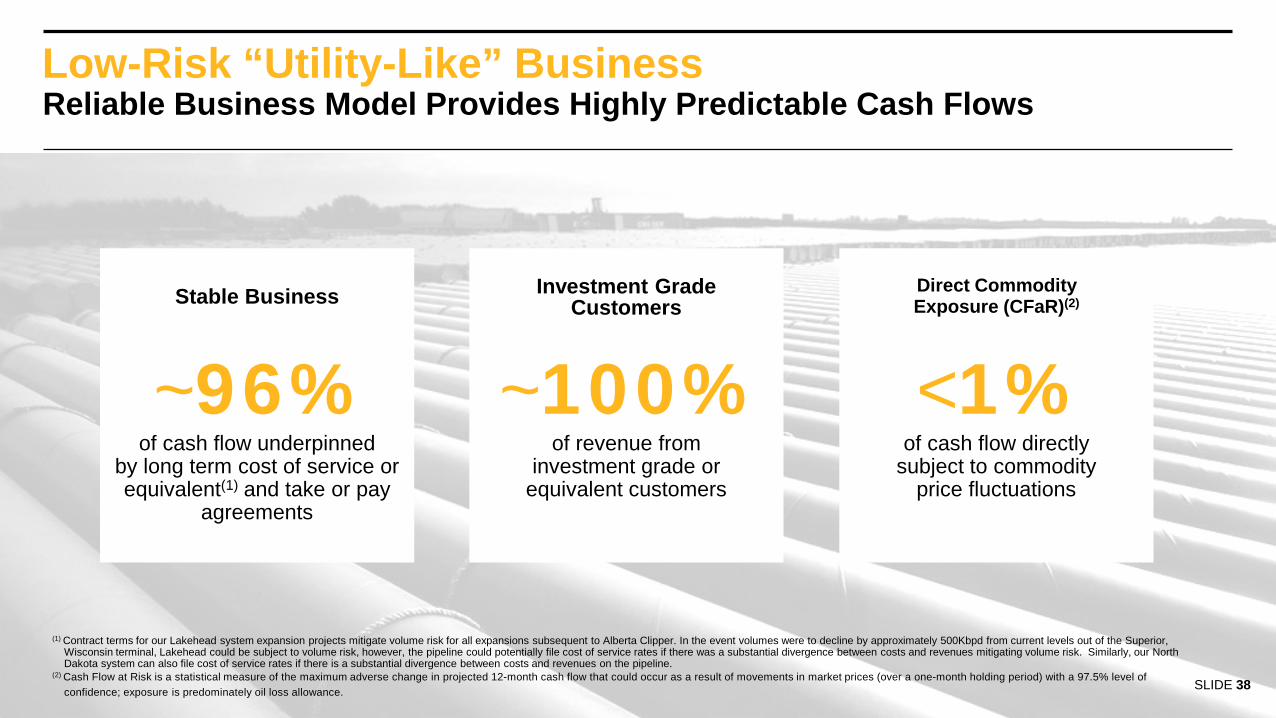
Low-Risk “Utility-Like” Business
Stable Business Direct Commodity Exposure (CFaR)(2)
Reliable Business Model Provides Highly Predictable Cash Flows
Investment Grade Customers
<1% of cash flow directly
subject to commodity price fluctuations
~100% of revenue from
investment grade or equivalent customers
~96% of cash flow underpinned
by long term cost of service or equivalent(1) and take or pay
agreements
(2) Cash Flow at Risk is a statistical measure of the maximum adverse change in projected 12-month cash flow that could occur as a result of movements in market prices (over a one-month holding period) with a 97.5% level of confidence; exposure is predominately oil loss allowance.
(1) Contract terms for our Lakehead system expansion projects mitigate volume risk for all expansions subsequent to Alberta Clipper. In the event volumes were to decline by approximately 500Kbpd from current levels out of the Superior, Wisconsin terminal, Lakehead could be subject to volume risk, however, the pipeline could potentially file cost of service rates if there was a substantial divergence between costs and revenues mitigating volume risk. Similarly, our North Dakota system can also file cost of service rates if there is a substantial divergence between costs and revenues on the pipeline.
SLIDE 38

Investor Value Proposition
SLIDE 39
Pure-play liquids pipeline MLP
• Exceptional North American liquids infrastructure
• Low-risk commercial agreements
• Competitive and stable tolls
Low risk business model
• ~96% cost of service or equivalent1 and take or pay agreements
• ~100% of revenue from investment grade or equivalent customers
• No direct commodity price exposure
Prudent financial management
• Commitment to investment grade balance sheet
• Healthy distribution coverage targeted
Moderate visible growth
• Secured through embedded organic growth and JFAs
• Sustainable growth with strong coverage
Low risk, pure-play liquids pipeline MLP provides attractive risk-adjusted returns for unitholders
Attractive long term risk-return proposition
1 Contract terms for our Lakehead system expansion projects mitigate volume risk for all expansions subsequent to Alberta Clipper. In the event volumes were to decline by approximately 500Kbpd from current levels out of the Superior, Wisconsin terminal, Lakehead could be subject to volume risk, however, the pipeline could potentially file cost of service rates if there was a substantial divergence between costs and revenues mitigating volume risk. Similarly, our North Dakota system can also file cost of service rates if there is a substantial divergence between costs and revenues on the pipeline.