fourth quarter 2015 investor presentation
TRANSCRIPT

4Q154Q15Financial and operating results for the period ended December 31, 2015February 11, 2016
Unless otherwise specified, comparisons in this presentation are between 4Q15 and 4Q14.

Forward-Looking StatementsCertain statements made in this presentation should be considered forward-looking statements as defined in the Private Securities Litigation Reform Act of 1995. These include statements about future results of operations and capital plans. We caution investors that these forward-looking statements are not guarantees of future performance, and actual results may differ materially. Investors should consider the important risks and uncertainties that may cause actual results to differ, including those included in our press release issued on February 10, 2016, our Quarterly Reports on Form 10-Q, our Annual Report on Form 10-K and th fili k ith th S iti d E h C i i Wother filings we make with the Securities and Exchange Commission. We
assume no obligation to update this presentation, which speaks as of today’s date.
CNO Financial Group | 4Q2015 Earnings | February 11, 2016 2
Non-GAAP MeasuresThis presentation contains the following financial measures that differ from the comparable measures under Generally Accepted Accounting Principles (GAAP): operating earnings measures; book value excluding accumulated other comprehensiveoperating earnings measures; book value, excluding accumulated other comprehensive income (loss) per share; operating return measures; earnings before the net loss on the sale of CLIC and gain (loss) on reinsurance transactions, the earnings of CLIC prior to being sold, net realized investment gains (losses), fair value changes in embedded derivative liabilities, fair value changes related to the agent deferred compensation plan,derivative liabilities, fair value changes related to the agent deferred compensation plan, loss on extinguishment of debt, other non-operating items, corporate interest expense and taxes; and debt to capital ratios, excluding accumulated other comprehensive income (loss). Reconciliations between those non-GAAP measures and the comparable GAAP measures are included in the Appendix, or on the page such measure is presented.measures are included in the Appendix, or on the page such measure is presented.
While management believes these measures are useful to enhance understanding and comparability of our financial results, these non-GAAP measures should not be considered substitutes for the most directly comparable GAAP measures.
Additional information concerning non-GAAP measures is included in our periodic filings with the Securities and Exchange Commission that are available in the “Investors – SEC Filings” section of CNO’s website, www.CNOinc.com.
CNO Financial Group | 4Q2015 Earnings | February 11, 2016 3

CNO Financial Group | 4Q2015 Earnings | February 11, 2016 4
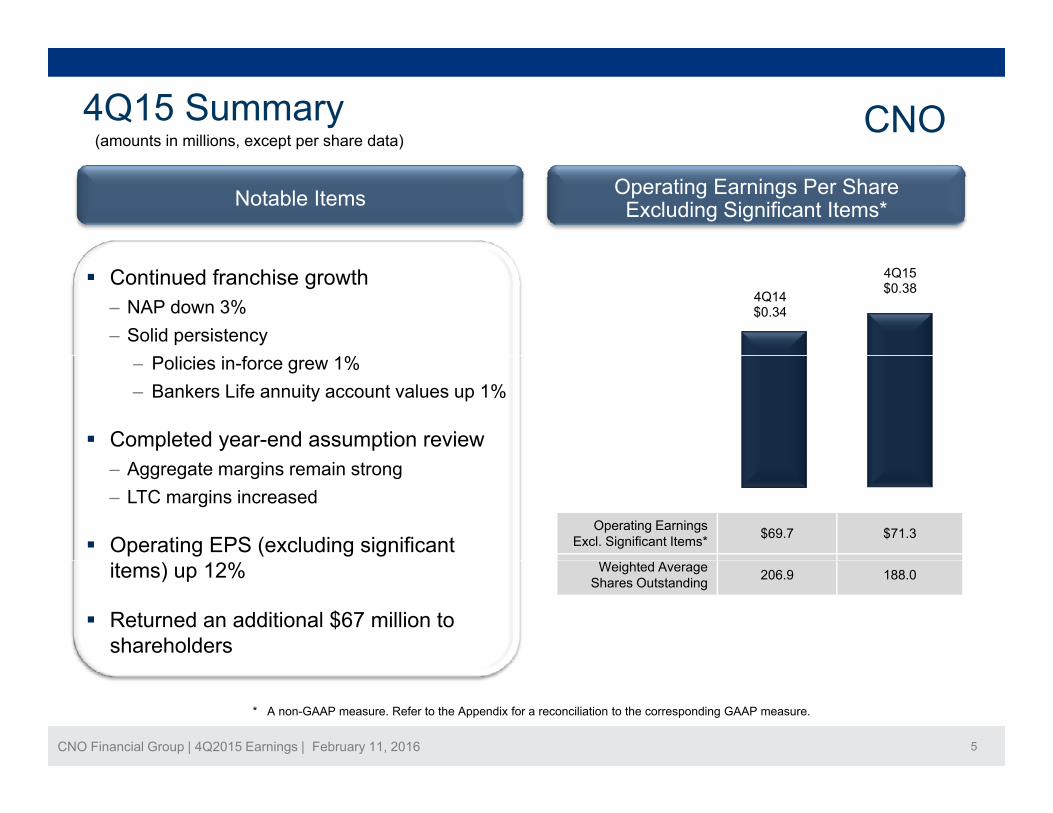
CNO4Q15 Summary(amounts in millions, except per share data)
Operating Earnings Per Share Excluding Significant Items*Notable Items
Continued franchise growth‒ NAP down 3% ‒ Solid persistency
4Q14$0.34
4Q15$0.38
‒ Policies in-force grew 1%‒ Bankers Life annuity account values up 1%
Completed year-end assumption review
Operating Earnings Excl. Significant Items* $69.7 $71.3
‒ Aggregate margins remain strong‒ LTC margins increased
Operating EPS (excluding significant Weighted Average
Shares Outstanding 206.9 188.0items) up 12%
Returned an additional $67 million to shareholders
CNO Financial Group | 4Q2015 Earnings | February 11, 2016 5
* A non-GAAP measure. Refer to the Appendix for a reconciliation to the corresponding GAAP measure.

CNO2015 Year in Review
Mixed sales results; continued to grow the franchise− Collected premiums up 1%; policies issued up 3%; 3rd party fee income up 14%
Strong performance at Colonial Penn resulting from successful execution and investments in our direct to consumer business
− NAP up 15% and collected premiums up 7%
Investments in Washington National Worksite gaining traction
Solid financial results− Double digit operating EPS growth over 2014− Diluted book value per share up 7%− Strengthened capital position
Continued to generate strong cash flow and return capital to shareholders− 2015 common stock repurchases and dividends of $417 million− Increased common stock dividend 17% and maintained a 20% dividend payout ratio
CNO Financial Group | 4Q2015 Earnings | February 11, 2016 6
Received three additional upgrades from rating agencies

4Q15 Sales and Distribution Results Bankers Life($ millions)($ millions)
Quarterly NAP* 4Q NAP down 6%; total year NAP down 4%
4Q14$73.6
1Q15$61.6
2Q15$61.3
3Q15$59.9
4Q15$69.1
‒ Driven mainly by lower life premium per policy; partially offset by higher annuity sales
Total year agent metrics‒ New agent recruiting down 3%‒ Average producing agents down 2%‒ Veteran agent counts up 3%
Third party fee income up 14% on a trailing 4-quarter basis
Third Party Policies Sold** 23,993 5,392 4,273 2,980 20,711
Trailing 4-Quarters NAP $261.6 $260.1 $258.3 $256.4 $251.9
Collected Premiums $659.9 $584.2 $603.9 $648.7 $654.5
CNO Financial Group | 4Q2015 Earnings | February 11, 2016 7* Third party sales are excluded from NAP in all periods** Includes Medicare Advantage, Medicare supplement, PDP, Dental/Vision and ACA products
(prior periods have been restated to include ACA product sales)
Trailing 4-Quarters Third PartyFee Income, Net $15.5 $15.8 $16.4 $16.6 $17.6

Washington National4Q15 Sales and Di t ib ti R lt
gDistribution Results($ millions)
Quarterly NAP 4Q NAP flat; total year NAP up 1%
‒ Worksite sales up 12%‒ Individual sales down 7%
4Q14$26.3
1Q15$22 6
2Q15$25.7
3Q15$25.8
4Q15$26.3
Growth in PMA agent force‒ Average producing agents up 8%
$22.6
Supplemental health collected premiums up 3%
Trailing 4-Quarters NAP $99.2 $99.8 $100.2 $100.4 $100.4
CNO Financial Group | 4Q2015 Earnings | February 11, 2016 8
Supplemental Health Collected Premiums $133.3 $132.7 $136.1 $138.6 $137.4

4Q15 Sales and Di t ib ti R lt
Colonial PennDistribution Results
($ millions)
Quarterly NAP
4Q NAP 5% t t l NAP 15%1Q15$21.1
2Q15$18.5
3Q15$18.9
4Q15
4Q NAP up 5%; total year NAP up 15%‒ Solid growth in Direct Mail and Web
Collected premiums up 8% 4Q14$14.9
4Q15$15.6
Collected premiums up 8%
Total EBIT: $6.7mm‒ Inforce EBIT: $14.8mm, up 31%Inforce EBIT: $14.8mm, up 31%
2016 EBIT guidance of $0-6mm‒ Expect 1Q16 EBIT of ($8)-($10)mm
Trailing 4-Quarters NAP $64.6 $68.9 $70.9 $73.4 $74.1
$ $ $ $ $
CNO Financial Group | 4Q2015 Earnings | February 11, 2016 9
Collected Premiums $61.3 $65.1 $65.1 $66.7 $66.0
Inforce EBIT $11.3 $10.6 $13.3 $14.9 $14.8

4Q Consolidated Financial Highlights CNO
Earnings Remain Strong‒ Operating earnings per diluted share* of $0.52; $0.38 excluding significant items
‒ Operating ROE* of 9.2%; 8.8% excluding significant items
‒ Health benefit ratios in-line with expectations
‒ Favorable prepayment income in the quarterFavorable prepayment income in the quarter
‒ Annuity results favorably impacted by year-end assumption review
C i d S h i C hfl d K C i l M Continued Strength in Cashflows and Key Capital Measures‒ Estimated consolidated risk-based capital of 449%, up from 431% at year-end 2014
‒ Leverage* of 19.6%g
‒ Holding company cash and investments of $382 million, up from $345 million at year-end 2014
‒ Repurchased $54 million of common stock; total year repurchases of $365 million
CNO Financial Group | 4Q2015 Earnings | February 11, 2016 10
‒ 2016 share repurchase guidance range of $275-$375 million, absent compelling alternatives
* A non-GAAP measure. See the Appendix for a reconciliation to the corresponding GAAP measure.

($ millions)Segment Earnings CNO
4Q15 EarningsSegment EBIT Excluding Significant Items*
$30.2 $29 1
$31.3
$118.7
$106.5$114.7
$106.6
$122.2 Bankers Life results reflect incremental
LTC FLR build in 4Q15 and favorable LTC claims experience in 4Q14
$31.5 $29.1
$30.6 LTC claims experience in 4Q14
Washington National supplemental health margins in-line
$4 2
$94.5
$82.2 $86.4
$79.8
$89.1 Colonial Penn results reflect growth in in-force block and in-line with seasonal expectations
Corporate segment results consistent$(8.8)
$(1.3)
$(5.0) $(4.4) $(4.9)
$2.8
$(5.9)
$4.2 $0.6 $6.7
4Q14 1Q15 2Q15 3Q15 4Q15
Corporate segment results consistent with expectations
CNO Financial Group | 4Q2015 Earnings | February 11, 2016 11
Corporate CP BLC WN
* A non-GAAP measure. See the Appendix for a reconciliation to the corresponding GAAP measure.

($ millions)Health Margins CNO
4Q15 Highlights & OutlookBankers Life Medicare Supplement
Medicare supplement benefit ratio of 70 8% reflects
$193 $193 $193 $193 $192
70 0% 68 7%71.5% 70.8% Medicare supplement benefit ratio of 70.8% reflects
slightly higher claims experience, total year results of 69.6% in-line with expectations
2016 Outlook: Benefit ratio of 70-73%
70.0%67.4% 68.7%
4Q14 1Q15 2Q15 3Q15 4Q15
Bankers Life Long-term Care IABR*
4Q14 1Q15 2Q15 3Q15 4Q15
$124 $123 $121 $119 $119
83.0% 84.6% 83.8%
79 6%
IABR* improvement due to reserve releases caused by impact of policyholder actions following rate increases
Washington National Supplemental Health IABR*
77.8% 79.6%
4Q14 1Q15 2Q15 3Q15 4Q15
IABR* of 85.5% excluding favorable reserve impacts 2016 Outlook: Interest-adjusted benefit ratio of
81-86%, excluding rate increase impacts
$132 $133 $134 $137 $138
54.4%57.6%
65.7%
57.4% 57.5% Supplemental health IABR* of 57.5%, in-line with
expectations 2016 Outlook: Interest-adjusted benefit ratio of 56-59%
CNO Financial Group | 4Q2015 Earnings | February 11, 2016 12
4Q14 1Q15 2Q15 3Q15 4Q15Earned Premium Reported Benefit Ratio
* Interest-adjusted benefit ratio (IABR); a non-GAAP measure. Refer to the Appendix for the corresponding GAAP measure.
2016 Outlook: Interest adjusted benefit ratio of 56 59%

Investment Results CNO($ millions)
$
( )
Average Invested Assets and Cash Realized Gains, Losses and Impairments
Gross Realized Gains$21,852 $21,854 $21,956 $22,042 $22,219
$305.4 $300.1 $302.1 $298.2 $303.2 Net Investment
$18.3
Gross Realized Gains
Gross Realized Losses
Impairments
$66.8
$42.7
$51.0
Income
$21 3$30.3
$48.5
$12 6
$1.3 $7.9
$12.4
$16.8$13.7
$20.2**$22.6
$13.2
$23.3 $23.1
4Q14 1Q15 2Q15 3Q15 4Q15$4.2
$21.3 $15.4
$12.6
Earned Yield*: 5.83% 5.81% 5.78% 5.68% 5.72%
New Money Rate: 5.01% 5.36% 5.06% 5.21% 5.17%
Pre-Pay / Call / Make-h l I $8.3 $5.1 $9.9 $5.6 $10.3
4Q14 1Q15 2Q15 3Q15 4Q15
Higher level of realized gains and losses due to market whole Income: $8.3 $5.1 $9.9 $5.6 $10.3
4Q15 yield curve flattened substantially, although new money rate benefited from wider spreads
g gvolatility and tactical repositioning in credit and structured sectors
Impairments largely related to recognition of post quarter end sales activity, with over 70% due to CLO repositioning
CNO Financial Group | 4Q2015 Earnings | February 11, 2016 13* Earned Yield excludes FHLB.** Excludes $11.3 million gain on dissolution of variable interest entity.
Sequential and year-over-year increase in pre-pay/make-whole income
$1.6 billion of energy exposure; high quality (88% IG), diversified and liquid

2015 GAAP Loss Recognition Testing Results
Aggregate GAAP margins
• Increased to $3.8 billion or 22% of net GAAP li bilitiliabilities
• Run-on / Run-off: +$260mm
$• Experience assumptions: +$50mm
• Earned rate assumptions: $(35)mm
• Recovery in rates flattened and pushed out one year; no changes to ultimate new money rate
CNO Financial Group | 4Q2015 Earnings | February 11, 2016 14

LTC - Margin & Sensitivity Testing
Limited benefit structure reduces volatility and
overall tail riskTesting Results
Margin of ~$180mm or 4%, up from ~$100mm Run-on / Run-off : +$30mm, including FLR accrual Net experience related: +$60mm New money rates: $(10)mm
1-4 years 59%
>4 10
Experience Assumptions
y ( )
Comprehensive review of persistency and claim costs; results reviewed by third party
No morbidity or mortality improvements assumed No shock lapses or new rate increases assumed >4-10
years 18%
New Money Rates
No shock lapses or new rate increases assumed
Reflects year-end markets Recovery flattened & pushed out one year No change to ultimate rate
Key Variable Sensitivity Test* LRT Margin Impact
Lifetime 10%
<= 1 year 13%
$3.4 billion Active Life Reserves
No change to ultimate rate
Lapse Rate +/- 10% +/- $70mm
Morbidity +/- 1% +/- $60mm
Mortality +/- 1% +/- $30mm
$4.4b
$120$158
Additional Actuarial Reserves ($ millions)
GAAP STAT
CNO Financial Group | 4Q2015 Earnings | February 11, 2016 15
Ultimate New Money Rate - 50bps - $50mm
* Represents a one-time permanent shift
$120 $56
$115
2014 2015 2014 2015

2015 Milestones Established in 2013
2015 Milestones 2013-2015 Result
Invest $80-$85mm in strategic business initiatives
Accelerate run-on and run-off
Invested ~$100mm
Sold/Reinsured ~$4 billion in run-
Enhance customer experience d i l ffi i
off business; continued to grow core franchise
Multiple successful initiatives (C S f )and operational efficiency
ROE run-rate of 9%
Drive to investment grade
(Cognizant, Salesforce, iPipeline)
2015 operating ROE* of 9.2%
13 d i 2012 t Drive to investment grade
Target dividend payout ratio of 20%
13 upgrades since 2012, stage set for IG
Met 20% target since 2014
CNO Financial Group | 4Q2015 Earnings | February 11, 2016 16
20%
* A non-GAAP measure. Refer to the Appendix for a reconciliation to the corresponding GAAP measure.
CNO2016 Priorities
Re-energize growth in Bankers Life and Washington National
Roll out of wholly owned Broker/Dealer and Registered Investment AdvisorInvestment Advisor
Transform and leverage data
Reduce LTC exposure
Corporate Development / M&A
CNO Financial Group | 4Q2015 Earnings | February 11, 2016 17

Questions and Answers
CNO Financial Group | 4Q2015 Earnings | February 11, 2016 18
Appendix
CNO Financial Group | 4Q2015 Earnings | February 11, 2016 19
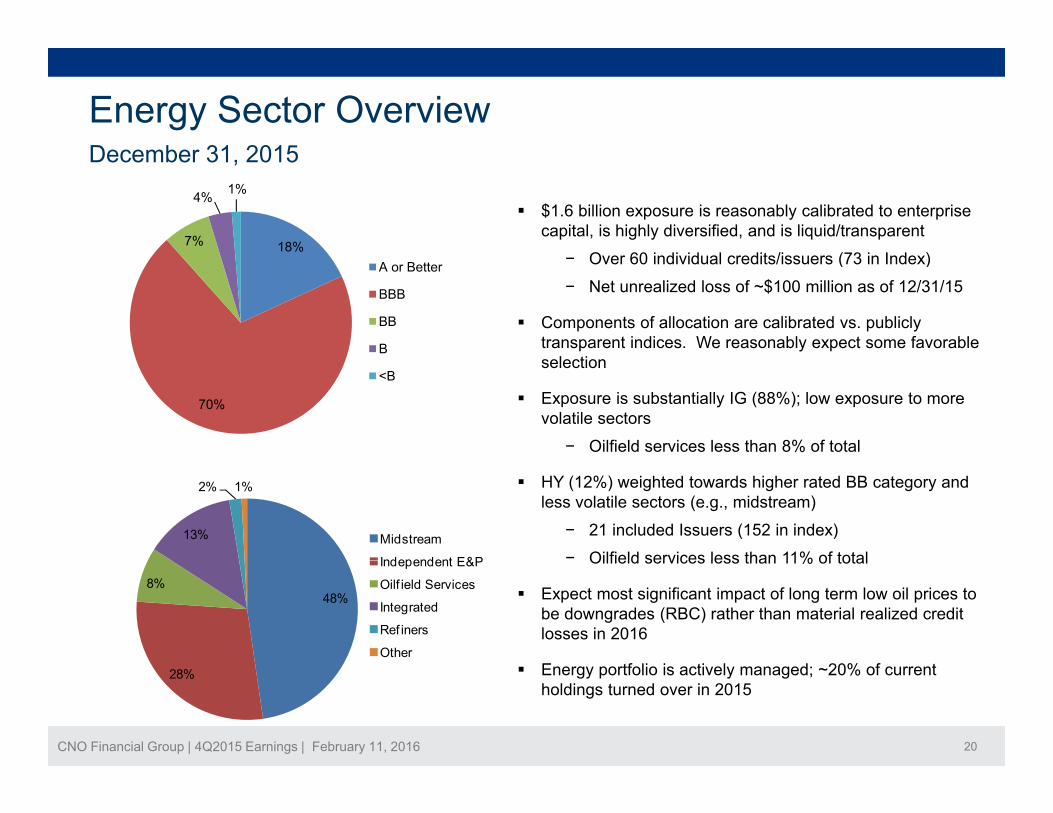
Energy Sector Overview December 31 2015December 31, 2015
18%7%
4% 1%
$1.6 billion exposure is reasonably calibrated to enterprise capital, is highly diversified, and is liquid/transparent
O 60 i di id l dit /i (73 i I d )A or Better
BBB
BB
B
− Over 60 individual credits/issuers (73 in Index)
− Net unrealized loss of ~$100 million as of 12/31/15
Components of allocation are calibrated vs. publicly transparent indices. We reasonably expect some favorable
70%
<Bselection
Exposure is substantially IG (88%); low exposure to more volatile sectors
− Oilfield services less than 8% of total
13%
2% 1%
Midstream
Independent E&P
HY (12%) weighted towards higher rated BB category and less volatile sectors (e.g., midstream)
− 21 included Issuers (152 in index)
− Oilfield services less than 11% of total
48%8%
Independent E&P
Oilf ield Services
Integrated
Ref iners
Other
Oilfield services less than 11% of total
Expect most significant impact of long term low oil prices to be downgrades (RBC) rather than material realized credit losses in 2016
f % f
CNO Financial Group | 4Q2015 Earnings | February 11, 2016 20
28% Energy portfolio is actively managed; ~20% of current holdings turned over in 2015
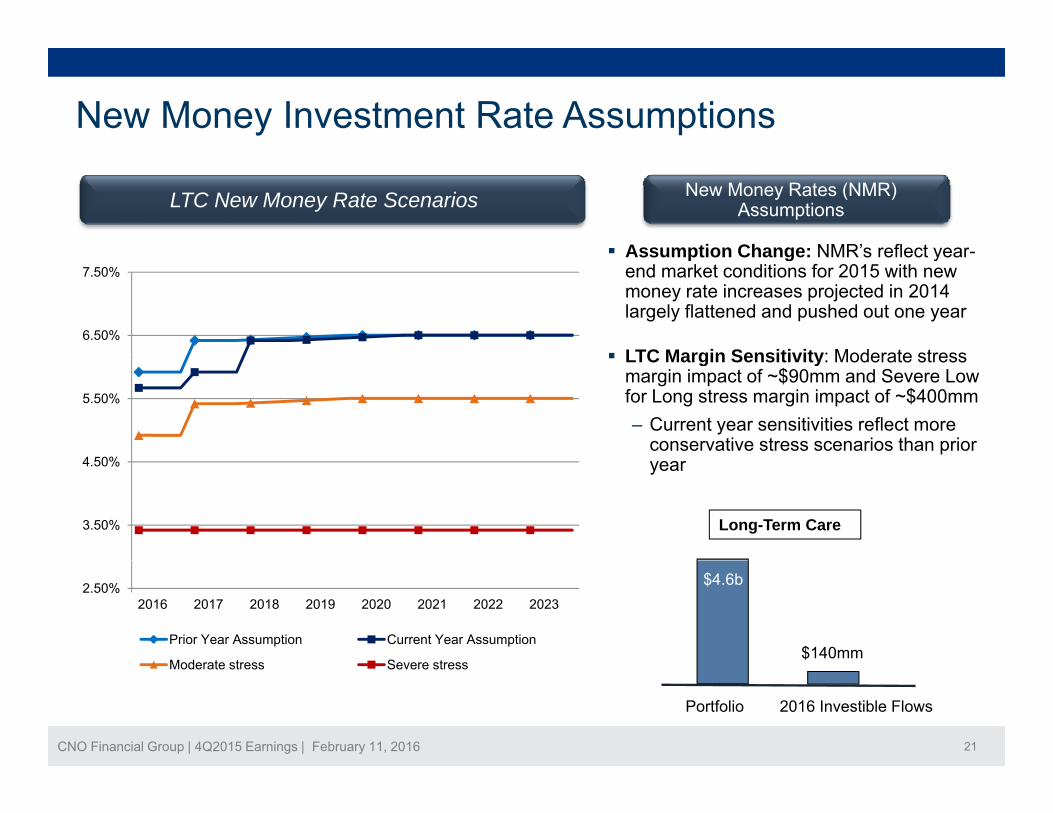
New Money Investment Rate Assumptions
Assumption Change: NMR’s reflect year-
New Money Rates (NMR) AssumptionsLTC New Money Rate Scenarios
Assumption Change: NMR s reflect year-end market conditions for 2015 with new money rate increases projected in 2014 largely flattened and pushed out one year
LTC Margin Sensitivity: Moderate stress6.50%
7.50%
LTC Margin Sensitivity: Moderate stress margin impact of ~$90mm and Severe Low for Long stress margin impact of ~$400mm‒ Current year sensitivities reflect more
conservative stress scenarios than prior 4 50%
5.50%
year
Long-Term Care3.50%
4.50%
$4.6b
$140mm
2.50%2016 2017 2018 2019 2020 2021 2022 2023
Prior Year Assumption Current Year Assumption
Moderate stress Severe stress
CNO Financial Group | 4Q2015 Earnings | February 11, 2016 21
Portfolio 2016 Investible Flows
Moderate stress Severe stress
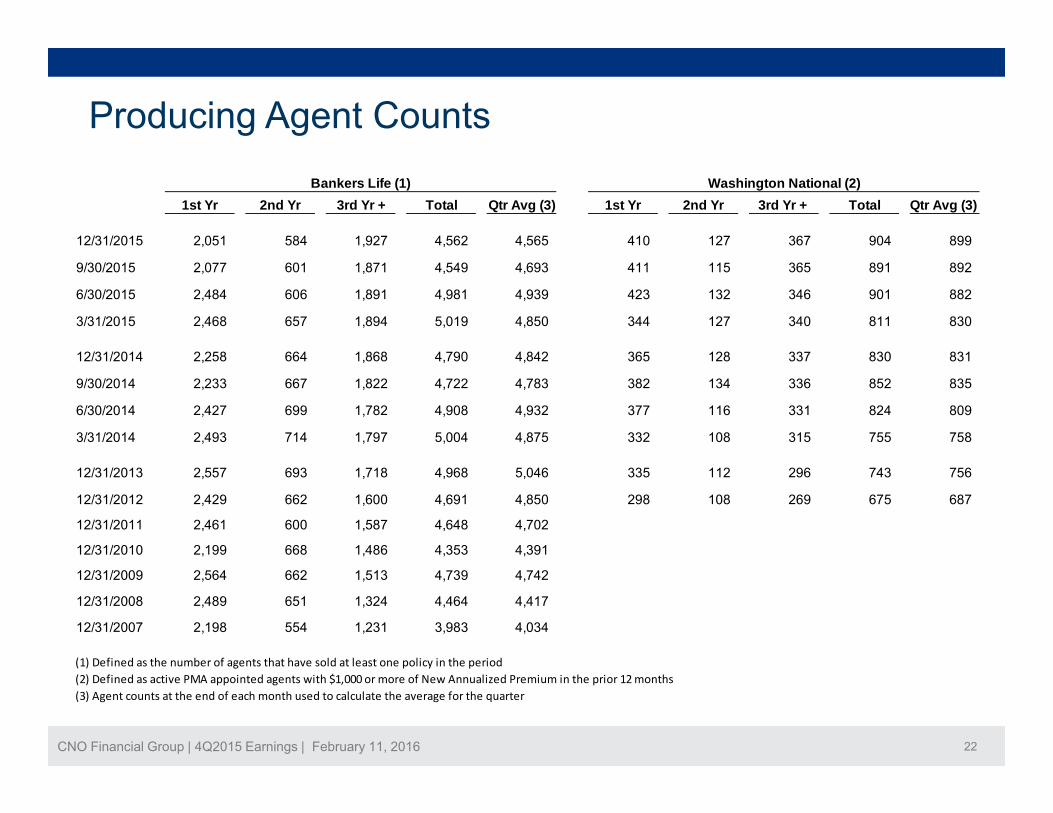
Producing Agent Counts
1st Yr 2nd Yr 3rd Yr + Total Qtr Avg (3) 1st Yr 2nd Yr 3rd Yr + Total Qtr Avg (3)
12/31/2015 2,051 584 1,927 4,562 4,565 410 127 367 904 899
Bankers Life (1) Washington National (2)
9/30/2015 2,077 601 1,871 4,549 4,693 411 115 365 891 892
6/30/2015 2,484 606 1,891 4,981 4,939 423 132 346 901 882
3/31/2015 2,468 657 1,894 5,019 4,850 344 127 340 811 830
12/31/2014 2 258 664 1 868 4 790 4 842 365 128 337 830 83112/31/2014 2,258 664 1,868 4,790 4,842 365 128 337 830 831
9/30/2014 2,233 667 1,822 4,722 4,783 382 134 336 852 835
6/30/2014 2,427 699 1,782 4,908 4,932 377 116 331 824 809
3/31/2014 2,493 714 1,797 5,004 4,875 332 108 315 755 758
12/31/2013 2,557 693 1,718 4,968 5,046 335 112 296 743 756
12/31/2012 2,429 662 1,600 4,691 4,850 298 108 269 675 687
12/31/2011 2,461 600 1,587 4,648 4,702
12/31/2010 2,199 668 1,486 4,353 4,391
12/31/2009 2,564 662 1,513 4,739 4,742
12/31/2008 2,489 651 1,324 4,464 4,417
12/31/2007 2,198 554 1,231 3,983 4,034
(1) Defined as the number of agents that have sold at least one policy in the period
CNO Financial Group | 4Q2015 Earnings | February 11, 2016 22
(1) Defined as the number of agents that have sold at least one policy in the period(2) Defined as active PMA appointed agents with $1,000 or more of New Annualized Premium in the prior 12 months(3) Agent counts at the end of each month used to calculate the average for the quarter

4Q15 Holding Company LiquidityCNO($ millions) CNO($ )
4Q15 YTDCash and Investments Balance - Beginning $354.1 $344.6
SourcesNet Dividends from Insurance Subsidiaries 88.5 265.7Dividends from Non-insurance Subsidiaries (1.0) 4.3 Interest/Earnings on Corporate Investments 5.2 16.5Surplus Debenture Interest 12.3 60.6Service and Investment Fees Net 14 3 70 1Service and Investment Fees, Net 14.3 70.1Gross Proceeds from Unsecured Notes 0.0 825.0Gross Proceeds from Revolver 0.0 100.0Other 0.9 4.3
Total Sources 120.2 1,346.5
UsesInterest 22.3 42.3Share Repurchases 55.3 361.5 Debt Payments - 797.1 Financing Costs - 33.7 Common Stock Dividend 13.0 51.9Holding Company Expenses and Other 6.9 17.9
Total Uses 97.5 1,304.4
CNO Financial Group | 4Q2015 Earnings | February 11, 2016 23
Non-cash changes in investment balances 5.4 (4.5)
Unrestricted Cash and Investments Balance - 12/31/2015 $382.2 $382.2

Leveraging Considerable Tax Assets CNO($ millions)($ millions)
4Q 2015 Loss Carryforwards Outlook and Value
Life$68
v Expect modest future valuation allowance releases as taxable income has stabilized
Annual cash flows are expected to be d d lif NOL’ f ll tili d
$916*
Non-Life
reduced as life NOL’s are fully utilized: $30 million in 2016 and $60 million in 2017
Significant non-life NOL’s expire in 2023Non Life$848
$197**
Estimated economic value of $500 million @ 10% discount rate
Non-Life
Loss Carryforwards Valuation Allowance
CNO Financial Group | 4Q2015 Earnings | February 11, 2016 24
* Excludes $14 million related to state operating loss carryforwards and $14 million related to capital loss carryforwards.** Excludes $10 million related to state operating loss carryforwards and $7 million related to capital loss carryforwards.

f f f Q201
4Q14 Significant Items CNO
Three months ended
December 31, 2014
E l di
The table below summarizes the financial impact of the significant items on our 4Q2014 net operating income. Management believes that identifying the impact of these items enhances the understanding of our operating results (dollars in millions).
Net Operating Income:
Bankers Life $ 103.5 $ (9.0) (1) $ 94.5
Washington National (2)20 2 10 0 30 2
Actual results Significant items
Excluding significant
items
Washington National (2)
Colonial Penn
EBIT from business segments continuing after the CLIC sale
Corporate Operations, excluding corporate interest expense
EBIT from operations continuing after the CLIC sale
(8.8) - (8.8)
117.7 1.0 118.7
2.8 - 2.8
126.5 1.0 127.5
20.2 10.0 30.2
Corporate interest expense
Operating earnings before tax
Tax expense on operating income
Net operating income * $ 69.1 $ 0.6 $ 69.7
106.9 1.0 107.9
37.8 0.4 38.2
(10.8) - (10.8)
Net operating income per diluted share* $ 0.34 $ - $ 0.34
(2) Pre-tax earnings in the Washington National segment were reduced by $10 million primarily related to the impact of loss recognition on a closed block of payout
(1) Pre-tax earnings in the Bankers Life segment included: (i) $6 million of positive impacts from our comprehensive annual actuarial review including impacts from model enhancements, net of changes in assumptions related to mortality and long-term interest rates; and (ii) the receipt of a $3 million settlement related to the early termination in 2013 of a PDP quota-share agreement.
CNO Financial Group | 4Q2015 Earnings | February 11, 2016 25
annuities resulting from changes in assumptions related to long-term interest rates and mortality experience.
* A non-GAAP measure. See pages 30 and 32 for a reconciliation to the corresponding GAAP measure.

f f f 1Q201
1Q15 Significant Items CNOThe table below summarizes the financial impact of the significant item on our 1Q2015 net operating income. Management believes that identifying the impact of these items enhances the understanding of our operating results (dollars in millions).
Three months ended
March 31, 2015
E l di
Net Operating Income:
Bankers Life $ 82.2 $ - $ 82.2
Washington National (1)
Actual results Significant items
Excluding significant
items
28 5 3 0 31 5Washington National (1)
Colonial Penn
EBIT from business segments continuing after the CLIC sale
Corporate Operations, excluding corporate interest expense
EBIT from operations continuing after the CLIC sale
107.8
28.5 3.0 31.5
3.0 106.5
(5.9) - (5.9)
104.8 3.0
(1.3) - (1.3)
103.5
Corporate interest expense
Operating earnings before tax
Tax expense on operating income
Net operating income * $ 60.1 $ 1.9 $ 62.0
(10.5) - (10.5)
93.0 3.0 96.0
32.9 1.1 34.0
Net operating income per diluted share* $ 0.30 $ 0.01 $ 0.31
(1) Pre-tax earnings in the Washington National segment included $3 million of unfavorable reserve developments in the supplemental health block related to claims incurred in prior periods.
CNO Financial Group | 4Q2015 Earnings | February 11, 2016 26
* A non-GAAP measure. See pages 30 and 32 for a reconciliation to the corresponding GAAP measure.

f f f 2Q201
2Q15 Significant Items CNOThe table below summarizes the financial impact of the significant item on our 2Q2015 net operating income. Management believes that identifying the impact of these items enhances the understanding of our operating results (dollars in millions).
Three months ended
June 30, 2015
E l di
Net Operating Income:
Bankers Life $ 86.4 $ - $ 86.4
Washington National (1)
Actual results Significant items
Excluding significant
items
20 1 9 0 29 1Washington National (1)
Colonial Penn
EBIT from business segments continuing after the CLIC sale
Corporate Operations, excluding corporate interest expense
EBIT from operations continuing after the CLIC sale
119.7
20.1 9.0 29.1
9.0 114.7
4.2 - 4.2
110.7 9.0
(5.0) - (5.0)
105.7
Corporate interest expense
Operating earnings before tax
Tax expense on operating income
Net operating income * $ 60.8 $ 5.8 $ 66.6
(11.9) - (11.9)
93.8 9.0 102.8
33.0 3.2 36.2
Net operating income per diluted share* $ 0.31 $ 0.03 $ 0.34
(1) Pre-tax earnings in the Washington National segment included $9 million of unfavorable reserve developments in the supplemental health block related to claims incurred in prior periods.
CNO Financial Group | 4Q2015 Earnings | February 11, 2016 27
* A non-GAAP measure. See pages 30 and 32 for a reconciliation to the corresponding GAAP measure.

f f f 3Q201
3Q15 Significant Items CNOThe table below summarizes the financial impact of the significant item on our 3Q2015 net operating income. Management believes that identifying the impact of these items enhances the understanding of our operating results (dollars in millions).
Three months ended
September 30, 2015
E l di
Net Operating Income:
Bankers Life $ 79.8 $ - $ 79.8
Washington National 30 6 - 30 6
Actual results Significant items
Excluding significant
items
Washington National
Colonial Penn
EBIT from business segments continuing after the CLIC sale
Corporate Operations, excluding corporate interest expense (1)
EBIT from operations continuing after the CLIC sale
(11.9) 7.5 (4.4)
99.1 7.5 106.6
0.6 - 0.6
111.0 - 111.0
30.6 - 30.6
Corporate interest expense
Operating earnings before tax
Tax expense on operating income
Net operating income * $ 56.8 $ 7.5 $ 64.3
87.8 7.5 95.3
31.0 - 31.0
(11.3) - (11.3)
Net operating income per diluted share* $ 0.30 $ 0.03 $ 0.33
(1) Pre-tax earnings in the Corporate segment included the impact of current market conditions on the value of investments backing our Company-owned life insurance ("COLI") utilized as a vehicle to fund Bankers Life's agent deferred compensation plan. It should be noted that changes in the value of COLI investments are not subject to income tax.
CNO Financial Group | 4Q2015 Earnings | February 11, 2016 28
* A non-GAAP measure. See pages 30 and 32 for a reconciliation to the corresponding GAAP measure.

f f f Q201
4Q15 Significant Items CNOThe table below summarizes the financial impact of the significant item on our 4Q2015 net operating income. Management believes that identifying the impact of these items enhances the understanding of our operating results (dollars in millions).
Three months ended
December 31, 2015
Excluding
Net Operating Income:
Bankers Life $ 121.2 $ (32.1) (1) $ 89.1
Washington National (2) 32.3 (1.0) 31.3
Actual results Significant items
Excluding significant
items
Colonial Penn
EBIT from business segments continuing after the CLIC sale
Corporate Operations, excluding corporate interest expense (3)
EBIT from operations continuing after the CLIC sale
C t i t t
(0.7) (4.2) (4.9)
159.5 (37.3) 122.2
(11 3) (11 3)
6.7 - 6.7
160.2 (33.1) 127.1
Corporate interest expense
Operating earnings before tax
Tax expense on operating income
Net operating income * $ 97.0 $ (25.7) $ 71.3
Net operating income per diluted share* $ 0 52 $ (0 14) $ 0 38
148.2 (37.3) 110.9
51.2 (11.6) 39.6
(11.3) - (11.3)
Net operating income per diluted share* $ 0.52 $ (0.14) $ 0.38
(2) Pre-tax earnings in the Washington National segment included $1.0 million of favorable impacts from our comprehensive annual actuarial review.
(1) Pre-tax earnings in the Bankers segment included: (i) $25.8 million of favorable impacts from our comprehensive annual actuarial review including the net impact from model enhancements and changes in assumptions related to mortality, long-term interest rates and the spread earned on fixed index annuities; and (ii) the $6.3 million release of long-term care reserves (net of the reduction in insurance intangibles) due to the impact of policyholder actions following rate increases.
CNO Financial Group | 4Q2015 Earnings | February 11, 2016 29
* A non-GAAP measure. See pages 30 and 32 for a reconciliation to the corresponding GAAP measure.
(3) Pre-tax earnings in the Corporate segment included a $4.2 million positive impact of current market conditions on the value of investments backing our Company-owned life insurance ("COLI") used as a vehicle to fund Bankers Life's agent deferred compensation plan.

Quarterly Earnings CNOy g
4Q14 1Q15 2Q15 3Q15 4Q15Bankers Life 103.5$ 82.2$ 86.4$ 79.8$ 121.2$ Washington National 20 2 28 5 20 1 30 6 32 3
($ millions)
Washington National 20.2 28.5 20.1 30.6 32.3 Colonial Penn 2.8 (5.9) 4.2 0.6 6.7
EBIT from business segments continuing after the CLIC sale 126.5 104.8 110.7 111.0 160.2 Corporate operations, excluding interest expense (8.8) (1.3) (5.0) (11.9) (0.7) EBIT* from operations continuing after the CLIC sale 117.7 103.5 105.7 99.1 159.5 Corporate interest expense (10.8) (10.5) (11.9) (11.3) (11.3)
O ti i b f t 106 9 93 0 93 8 87 8 148 2 Operating earnings before taxes 106.9 93.0 93.8 87.8 148.2 Tax expense on period income 37.8 32.9 33.0 31.0 51.2 Net operating income 69.1 60.1 60.8 56.8 97.0 Net loss on sale of CLIC and gain (loss) on reinsurance transactions, including impact of taxes 2.9 - - - - Net realized investment gains (losses), net of related amortization and taxes (2.3) (1.4) (6.8) (12.3) (10.3) Fair value changes in embedded derivative liabilities, net of related amortization and taxes (11.4) (8.3) 16.8 (10.2) 9.4 Fair value changes related to the agent deferred compensation plan, net of taxes (9.8) - - - 9.8 Loss on extinguishment of debt, net of taxes - - (21.3) - - Valuation allowance for deferred tax assets and other tax items 34.1 - - - 32.5 Other 1.3 2.4 (2.7) (0.5) (1.1) Net income 83.9$ 52.8$ 46.8$ 33.8$ 137.3$
*Management believes that an analysis of earnings before the net loss on sale of CLIC and gain (loss) on reinsurance transactions, net realized investment gains (losses), fair value changes in embedded derivative liabilities, fair value changes related to the agent deferred compensation plan, loss on extinguishment of debt, other non-operating items, corporate interest expense and taxes (“EBIT,” a non-GAAP financial measure) provides a clearer comparison of the operating results of the company quarter-over-quarter because it excludes: (1) the net loss on sale of CLIC and gain (loss) on reinsurance transactions, (2) net realized investment gains (losses); (3) fair value changes due to fluctuations in the interest rates used to discount embedded derivative liabilities related to our fixed index annuities that are unrelated to the company’s underlying fundamentals; (4) fair value changes related to the agent deferred compensation plan; (5) loss on extinguishment of debt; (6) charges in the valuation allowance for deferred tax assets; and (7) other non-operating items consisting primarily of
CNO Financial Group | 4Q2015 Earnings | February 11, 2016 30
deferred compensation plan; (5) loss on extinguishment of debt; (6) charges in the valuation allowance for deferred tax assets; and (7) other non operating items consisting primarily of equity in earnings of certain non-strategic investments and earnings attributable to variable interest entities. The table above provides a reconciliation of EBIT to net income.

Information Related to Certain Non-GAAP Financial Measures
The following provides additional information regarding certain non-GAAP measures used in this presentation. A non-GAAP measure is a numerical measure of a company’s performance, financial position, or cash flows that excludes or includes amounts that are normally excluded or included in the most directly comparable measure calculated and presented in accordance with GAAP. While management believes these measures are useful to enhance understanding and comparability of our financial results these non-GAAP measuresare useful to enhance understanding and comparability of our financial results, these non-GAAP measures should not be considered as substitutes for the most directly comparable GAAP measures. Additional information concerning non-GAAP measures is included in our periodic filings with the Securities and Exchange Commission that are available in the “Investors – SEC Filings” section of CNO’s website, www.CNOinc.com.
Operating earnings measuresManagement believes that an analysis of net income applicable to common stock before net loss on sale of CLIC and gain (loss) on reinsurance transactions, net realized gains or losses, fair value changes due to fluctuations in the interest rates used to discount embedded derivative liabilities related to our fixed index annuities, fair value changes related to the agent deferred compensation plan, loss on extinguishment of debt, changes in our valuation allowance for deferred tax assets and other non-operating items consisting primarilychanges in our valuation allowance for deferred tax assets and other non-operating items consisting primarily of equity in earnings of certain non-strategic investments and earnings attributable to variable interest entities (“net operating income,” a non-GAAP financial measure) is important to evaluate the performance of the Company and is a key measure commonly used in the life insurance industry. Management uses this measure to evaluate performance because these items are unrelated to the Company’s continuing operations.
CNO Financial Group | 4Q2015 Earnings | February 11, 2016 31
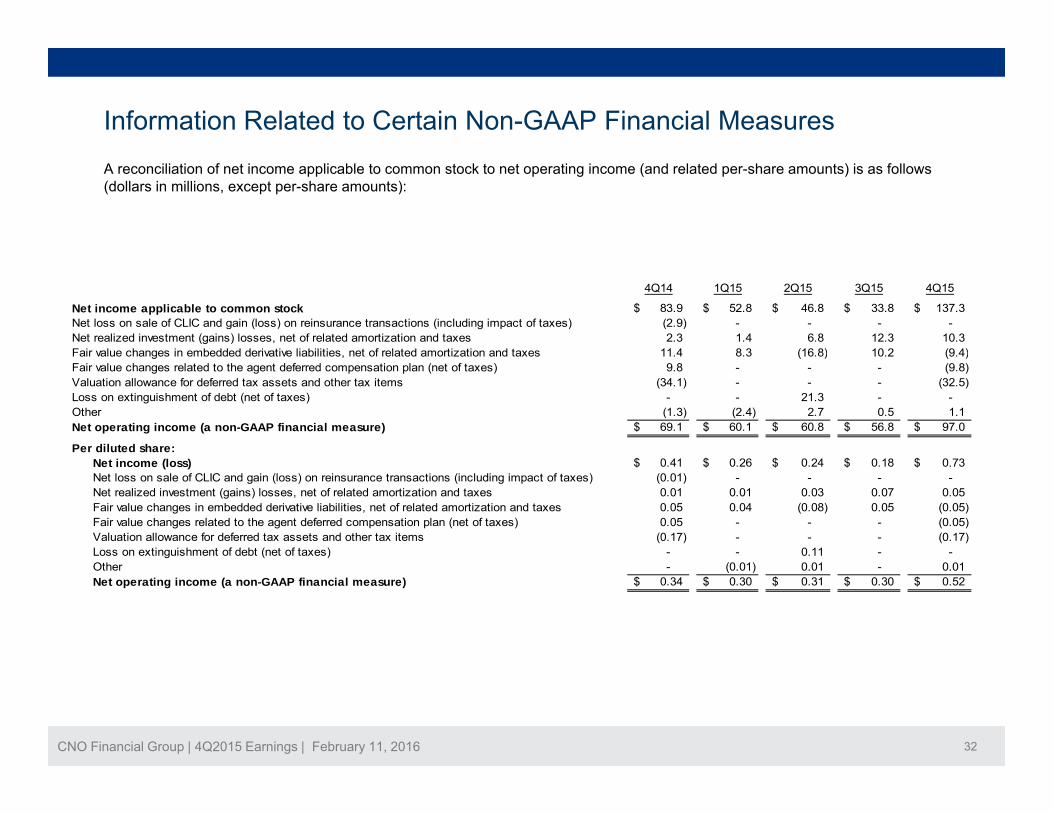
Information Related to Certain Non-GAAP Financial MeasuresA reconciliation of net income applicable to common stock to net operating income (and related per-share amounts) is as follows (dollars in millions, except per-share amounts):
4Q14 1Q15 2Q15 3Q15 4Q15
Net income applicable to common stock 83.9$ 52.8$ 46.8$ 33.8$ 137.3$ Net loss on sale of CLIC and gain (loss) on reinsurance transactions (including impact of taxes) (2.9) - - - - Net realized investment (gains) losses, net of related amortization and taxes 2.3 1.4 6.8 12.3 10.3 Fair value changes in embedded derivative liabilities, net of related amortization and taxes 11.4 8.3 (16.8) 10.2 (9.4)Fair value changes in embedded derivative liabilities, net of related amortization and taxes 11.4 8.3 (16.8) 10.2 (9.4) Fair value changes related to the agent deferred compensation plan (net of taxes) 9.8 - - - (9.8) Valuation allowance for deferred tax assets and other tax items (34.1) - - - (32.5) Loss on extinguishment of debt (net of taxes) - - 21.3 - - Other (1.3) (2.4) 2.7 0.5 1.1 Net operating income (a non-GAAP financial measure) 69.1$ 60.1$ 60.8$ 56.8$ 97.0$
Per diluted share:$ $ $ $ $Net income (loss) 0.41$ 0.26$ 0.24$ 0.18$ 0.73$
Net loss on sale of CLIC and gain (loss) on reinsurance transactions (including impact of taxes) (0.01) - - - - Net realized investment (gains) losses, net of related amortization and taxes 0.01 0.01 0.03 0.07 0.05 Fair value changes in embedded derivative liabilities, net of related amortization and taxes 0.05 0.04 (0.08) 0.05 (0.05) Fair value changes related to the agent deferred compensation plan (net of taxes) 0.05 - - - (0.05) Valuation allowance for deferred tax assets and other tax items (0.17) - - - (0.17) Loss on extinguishment of debt (net of taxes) - - 0.11 - - Other - (0.01) 0.01 - 0.01 Net operating income (a non-GAAP financial measure) 0.34$ 0.30$ 0.31$ 0.30$ 0.52$
CNO Financial Group | 4Q2015 Earnings | February 11, 2016 32

Information Related to Certain Non-GAAP Financial Measures
A reconciliation of operating income and shares used to calculate basic and diluted operating earnings per share is as follows (dollars in millions, except per-share amounts, and shares in thousands):
4Q14 1Q15 2Q15 3Q15 4Q15
Operating income 69.1$ 60.1$ 60.8$ 56.8$ 97.0$
Weighted average shares outstanding for basic earnings per share 204,298 200,491 195,857 190,259 185,608
Effect of dilutive securities on weighted average shares:
Stock options, restricted stock and performance units 2,645 1,784 2,216 2,106 2,342
Weighted average shares outstanding for diluted earnings per share 206 943 202 275 198 073 192 365 187 951Weighted average shares outstanding for diluted earnings per share 206,943 202,275 198,073 192,365 187,951
Operating earnings per diluted share 0.34$ 0.30$ 0.31$ 0.30$ 0.52$
CNO Financial Group | 4Q2015 Earnings | February 11, 2016 33

B k l dil t d h
Information Related to Certain Non-GAAP Financial MeasuresBook value per diluted shareBook value per diluted share reflects the potential dilution that could occur if outstanding stock options and warrants were exercised, restricted stock and performance units were vested and convertible securities were converted. The dilution from options, restricted shares and performance units is calculated using the treasury stock method. Under this method, we assume the proceeds from the exercise of the options and warrants (or the unrecognized compensation expense with respect to restricted stock and performance units) will be used to purchase shares of our common stock at the closing market price on the last day of the period. In addition, the calculation of this non-GAAP measure differs from the corresponding GAAP measure because accumulated other comprehensive income (loss) has been excluded from the value of capital used to determine this measure. Management believes this non-GAAP measure is useful because it removes the volatility that arises from changes in the unrealized appreciation (depreciation) of our investmentsuseful because it removes the volatility that arises from changes in the unrealized appreciation (depreciation) of our investments.
A reconciliation from book value per share to book value per diluted share, excluding accumulated other comprehensive income (loss) is as follows (dollars in millions, except per share amounts):
4Q14 1Q15 2Q15 3Q15 4Q15
Total shareholders' equity 4,688.2$ 4,753.6$ 4,364.2$ 4,171.0$ 4,138.5$
Shares outstanding for the period 203,324,458 198,631,949 193,467,712 186,741,760 184,028,511
Book value per share 23.06$ 23.93$ 22.56$ 22.34$ 22.49$
Total shareholders' equity 4,688.2$ 4,753.6$ 4,364.2$ 4,171.0$ 4,138.5$
Less accumulated other comprehensive income (825.3) (934.2) (605.0) (510.4) (402.8)
Adjusted shareholders' equity excluding AOCI 3,862.9$ 3,819.4$ 3,759.2$ 3,660.6$ 3,735.7$
Shares outstanding for the period 203,324,458 198,631,949 193,467,712 186,741,760 184,028,511
Dilutive common stock equivalents related to:
Stock options, restricted stock and performance units 2,645,322 1,857,139 2,243,615 2,176,988 2,311,877
Diluted shares outstanding 205,969,780 200,489,088 195,711,327 188,918,748 186,340,388
Book value per diluted share (a non-GAAP financial measure) 18.75$ 19.05$ 19.21$ 19.38$ 20.05$
CNO Financial Group | 4Q2015 Earnings | February 11, 2016 34

Information Related to Certain Non-GAAP Financial Measures
The interest-adjusted benefit ratio (a non-GAAP measure) is calculated by dividing the product's insurance policy benefits less imputed interest income on the accumulated assets backing the insurance liabilities by insurance policy income. Interest income is an important factor in measuring the performance of longer duration health products. The net cash flows generally cause an accumulation of amounts in the early years of a policy (accounted for as reserve increases), which will be paid out as benefits in later policy years (accounted for as reserve decreases) Accordingly as the policies age the benefit ratio will typically increase but
Interest-adjusted benefit ratios
later policy years (accounted for as reserve decreases). Accordingly, as the policies age, the benefit ratio will typically increase, but the increase in the change in reserve will be partially offset by the imputed interest income earned on the accumulated assets. The interest-adjusted benefit ratio reflects the effects of such interest income offset. Since interest income is an important factor in measuring the performance of these products, management believes a benefit ratio, which includes the effect of interest income, is useful in analyzing product performance.
4Q14 1Q15 2Q15 3Q15 4Q15
Bankers LifeLong-term care benefit ratiosEarned premium 124.0$ 122.6$ 120.5$ 119.0$ 118.6$ B fit ti b f i t d i t t i 131 8% 137 8% 140 7% 141 1% 137 1%Benefit ratio before imputed interest income on reserves 131.8% 137.8% 140.7% 141.1% 137.1%Interest-adjusted benefit ratio 77.8% 83.0% 84.6% 83.8% 79.6%Underwriting margin (earned premium plus imputed interest income on reserves less policy benefits) 27.6$ 20.8$ 18.6$ 19.3$ 24.2$
Washington NationalSupplemental health benefit ratiosEarned premium 132 1$ 132 8$ 134 4$ 136 6$ 138 0$Earned premium 132.1$ 132.8$ 134.4$ 136.6$ 138.0$ Benefit ratio before imputed interest income on reserves 79.1% 82.4% 90.3% 81.7% 81.8%Interest-adjusted benefit ratio 54.4% 57.6% 65.7% 57.4% 57.5%Underwriting margin (earned premium plus imputed interest income on reserves less policy benefits) 60.3$ 56.2$ 46.1$ 58.2$ 58.6$
CNO Financial Group | 4Q2015 Earnings | February 11, 2016 35

Information Related to Certain Non-GAAP Financial MeasuresOperating return measuresManagement believes that an analysis of net income applicable to common stock before the net loss on sale of CLIC and gain (loss) on reinsurance transactions, the earnings of CLIC prior to being sold, net realized gains or losses, fair value changes due to fluctuations in the interest rates used to discount embedded derivative liabilities related to our fixed index annuities, fair value changes related to the agent deferred compensation plan, loss on extinguishment of d bt h i l ti ll f d f d t t d th ti it i ti i il fdebt, changes in our valuation allowance for deferred tax assets and other non-operating items consisting primarily of equity in earnings of certain non-strategic investments and earnings attributable to variable interest entities (“net operating income,” a non-GAAP financial measure) is important to evaluate the performance of the Company and is a key measure commonly used in the life insurance industry. Management uses this measure to evaluate performance because these items are unrelated to the Company’s continuing operations.
Management also believes that an operating return, excluding significant items, is important as the impact of these items enhances the understanding of our operating results.
This non-GAAP financial measure also differs from return on equity because accumulated other comprehensive income (loss) has been excluded from the value of equity used to determine this ratio. Management believes this non-GAAP financial measure is useful because it removes the volatility that arises from changes in accumulated other comprehensive income (loss). Such volatility is often caused by changes in the estimated fair value of our investment portfolio resulting from changes in general market interest rates rather than the business decisions made by management.
In addition our equity includes the value of significant net operating loss carryforwards (included in income tax assets)In addition, our equity includes the value of significant net operating loss carryforwards (included in income tax assets). In accordance with GAAP, these assets are not discounted, and accordingly will not provide a return to shareholders (until after it is realized as a reduction to taxes that would otherwise be paid). Management believes that excluding this value from the equity component of this measure enhances the understanding of the effect these non-discounted assets have on operating returns and the comparability of these measures from period-to-period. Operating return measures are used in measuring the performance of our business units and are used as a basis for incentive
CNO Financial Group | 4Q2015 Earnings | February 11, 2016 36
measures are used in measuring the performance of our business units and are used as a basis for incentive compensation.
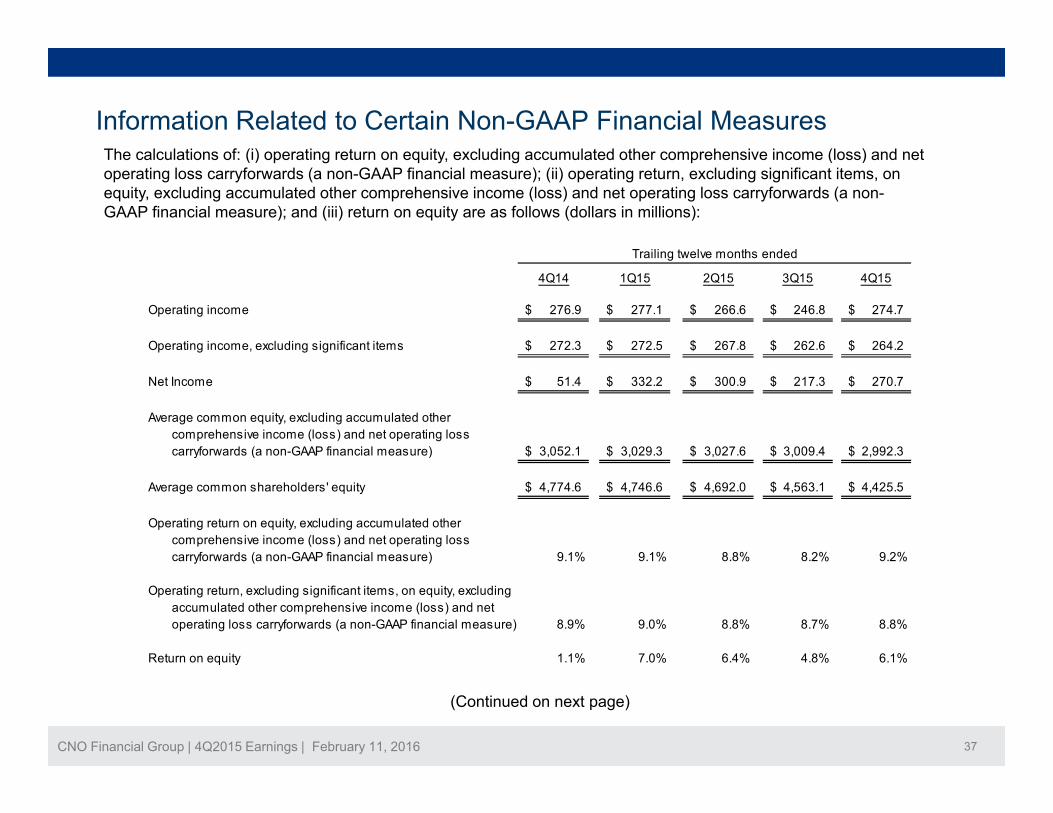
Information Related to Certain Non-GAAP Financial MeasuresTh l l ti f (i) ti t it l di l t d th h i i (l ) d tThe calculations of: (i) operating return on equity, excluding accumulated other comprehensive income (loss) and net operating loss carryforwards (a non-GAAP financial measure); (ii) operating return, excluding significant items, on equity, excluding accumulated other comprehensive income (loss) and net operating loss carryforwards (a non-GAAP financial measure); and (iii) return on equity are as follows (dollars in millions):
Trailing twelve months ended
4Q14 1Q15 2Q15 3Q15 4Q15
Operating income 276.9$ 277.1$ 266.6$ 246.8$ 274.7$
Operating income, excluding significant items 272.3$ 272.5$ 267.8$ 262.6$ 264.2$
Trailing twelve months ended
Net Income 51.4$ 332.2$ 300.9$ 217.3$ 270.7$
Average common equity, excluding accumulated othercomprehensive income (loss) and net operating losscarryforwards (a non-GAAP financial measure) 3,052.1$ 3,029.3$ 3,027.6$ 3,009.4$ 2,992.3$ y ( )
Average common shareholders' equity 4,774.6$ 4,746.6$ 4,692.0$ 4,563.1$ 4,425.5$
Operating return on equity, excluding accumulated othercomprehensive income (loss) and net operating losscarryforwards (a non-GAAP financial measure) 9.1% 9.1% 8.8% 8.2% 9.2%carryforwards (a non GAAP financial measure) 9.1% 9.1% 8.8% 8.2% 9.2%
Operating return, excluding significant items, on equity, excludingaccumulated other comprehensive income (loss) and netoperating loss carryforwards (a non-GAAP financial measure) 8.9% 9.0% 8.8% 8.7% 8.8%
Return on equity 1.1% 7.0% 6.4% 4.8% 6.1%
CNO Financial Group | 4Q2015 Earnings | February 11, 2016 37
q y
(Continued on next page)

Information Related to Certain Non-GAAP Financial MeasuresThe following summarizes: (i) operating earnings; (ii) significant items; (iii) operating earnings, excluding significant items; and (iv) net income (dollars in millions):
OperatingOperating earningsOperating earnings,earnings, excluding Netexcluding significant income -
Operating Significant significant items - trailing Net trailingearnings (a) items (b) items four quarters income four quarters
1Q14 59 9$ 1 9$ 61 8$ 246 2$ (228 0)$ 238 1$1Q14 59.9$ 1.9$ 61.8$ 246.2$ (228.0)$ 238.1$ 2Q14 71.3 - 71.3 260.1 78.1 239.1 3Q14 76.6 (7.1) 69.5 266.8 117.4 73.5 4Q14 69.1 0.6 69.7 272.3 83.9 51.4 1Q15 60.1 1.9 62.0 272.5 52.8 332.2 2Q15 60.8 5.8 66.6 267.8 46.8 300.9 3Q15 56.8 7.5 64.3 262.6 33.8 217.3 4Q15 97.0 (25.7) 71.3 264.2 137.3 270.7
(a) - Operating earnings excludes the results from CLIC prior to being sold.(b) - The significant items have been discussed in prior press releases.
CNO Financial Group | 4Q2015 Earnings | February 11, 2016 38
(Continued on next page)

Information Related to Certain Non-GAAP Financial Measures
A reconciliation of pretax operating earnings (a non-GAAP financial measure) to net income is as follows (dollars in millions):
4Q14 1Q15 2Q15 3Q15 4Q15
Twelve months ended
Pretax operating earnings (a non-GAAP financial measure) 427.4$ 428.4$ 413.5$ 381.5$ 422.8$
Income tax (expense) benefit (150.5) (151.3) (146.9) (134.7) (148.1)
Operating return 276.9 277.1 266.6 246.8 274.7
Earnings of CLIC prior to being sold, net of taxes 15.2 8.5 - - -
Net loss on sale of CLIC and gain (loss) on reinsurance transactions,inculding impact of taxes (269.7) 28.3 25.8 2.9 -
Net realized investment gains, net of related amortization and taxes 21.4 6.4 (7.9) (22.8) (30.8)Net realized investment gains, net of related amortization and taxes 21.4 6.4 (7.9) (22.8) (30.8)
Fair value changes in embedded derivative liabilities, net of relatedamortization and taxes (23.4) (24.5) (2.9) (13.1) 7.7
Fair value changes related to the agent deferred compensation plan, net of taxes (17.4) (17.4) (9.8) (9.8) 9.8
Loss on extinguishment or modification of debt (net of taxes) (0.4) (0.4) (21.3) (21.3) (21.3)
Valuation allowance for deferred tax assets and other tax items 54.9 54.9 50.9 34.1 32.5
Other (6.1) (0.7) (0.5) 0.5 (1.9)
CNO Financial Group | 4Q2015 Earnings | February 11, 2016 39
Net income 51.4$ 332.2$ 300.9$ 217.3$ 270.7$
(Continued on next page)
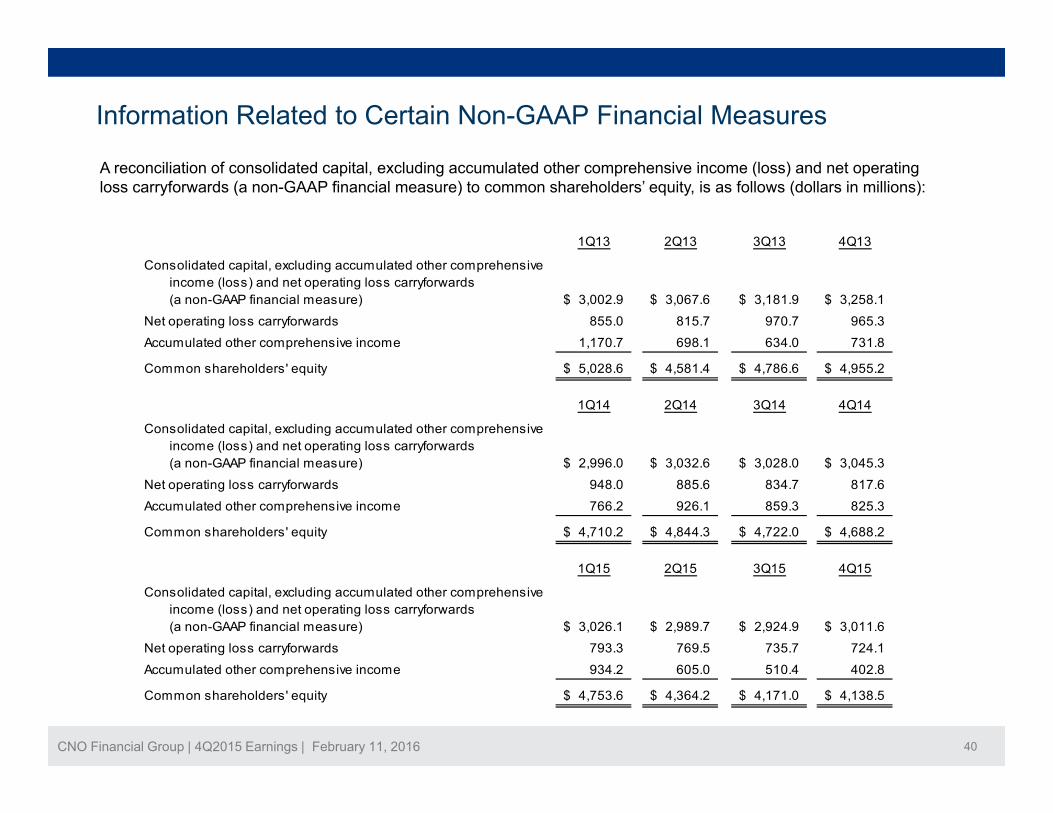
Information Related to Certain Non-GAAP Financial Measures
A reconciliation of consolidated capital, excluding accumulated other comprehensive income (loss) and net operating loss carryforwards (a non-GAAP financial measure) to common shareholders’ equity, is as follows (dollars in millions):
1Q13 2Q13 3Q13 4Q13
Consolidated capital, excluding accumulated other comprehensiveincome (loss) and net operating loss carryforwards (a non-GAAP financial measure) 3,002.9$ 3,067.6$ 3,181.9$ 3,258.1$
Net operating loss carryforwards 855.0 815.7 970.7 965.3 Accumulated other comprehensive income 1,170.7 698.1 634.0 731.8
Common shareholders' equity 5,028.6$ 4,581.4$ 4,786.6$ 4,955.2$
1Q14 2Q14 3Q14 4Q14
Consolidated capital, excluding accumulated other comprehensiveincome (loss) and net operating loss carryforwards
$ $ $ $(a non-GAAP financial measure) 2,996.0$ 3,032.6$ 3,028.0$ 3,045.3$
Net operating loss carryforwards 948.0 885.6 834.7 817.6 Accumulated other comprehensive income 766.2 926.1 859.3 825.3
Common shareholders' equity 4,710.2$ 4,844.3$ 4,722.0$ 4,688.2$
1Q15 2Q15 3Q15 4Q15
Consolidated capital, excluding accumulated other comprehensiveincome (loss) and net operating loss carryforwards (a non-GAAP financial measure) 3,026.1$ 2,989.7$ 2,924.9$ 3,011.6$
Net operating loss carryforwards 793.3 769.5 735.7 724.1
CNO Financial Group | 4Q2015 Earnings | February 11, 2016 40
Accumulated other comprehensive income 934.2 605.0 510.4 402.8
Common shareholders' equity 4,753.6$ 4,364.2$ 4,171.0$ 4,138.5$

Information Related to Certain Non-GAAP Financial Measures
A reconciliation of consolidated capital, excluding accumulated other comprehensive income (loss) and net operating loss carryforwards (a non-GAAP financial measure) to common shareholders’ equity, is as follows (dollars in millions):
4Q14 1Q15 2Q15 3Q15 4Q15Trailing Four Quarter Average
Consolidated capital, excluding accumulated other comprehensiveincome (loss) and net operating loss carryforwards (a non-GAAP financial measure) 3,052.1$ 3,029.3$ 3,027.6$ 3,009.4$ 2,992.3$
Net operating loss carryforwards 890.0 852.1 818.3 791.4 767.3Net operating loss carryforwards 890.0 852.1 818.3 791.4 767.3
Accumulated other comprehensive income 832.5 865.2 846.1 762.3 665.9
Common shareholders' equity 4,774.6$ 4,746.6$ 4,692.0$ 4,563.1$ 4,425.5$
CNO Financial Group | 4Q2015 Earnings | February 11, 2016 41
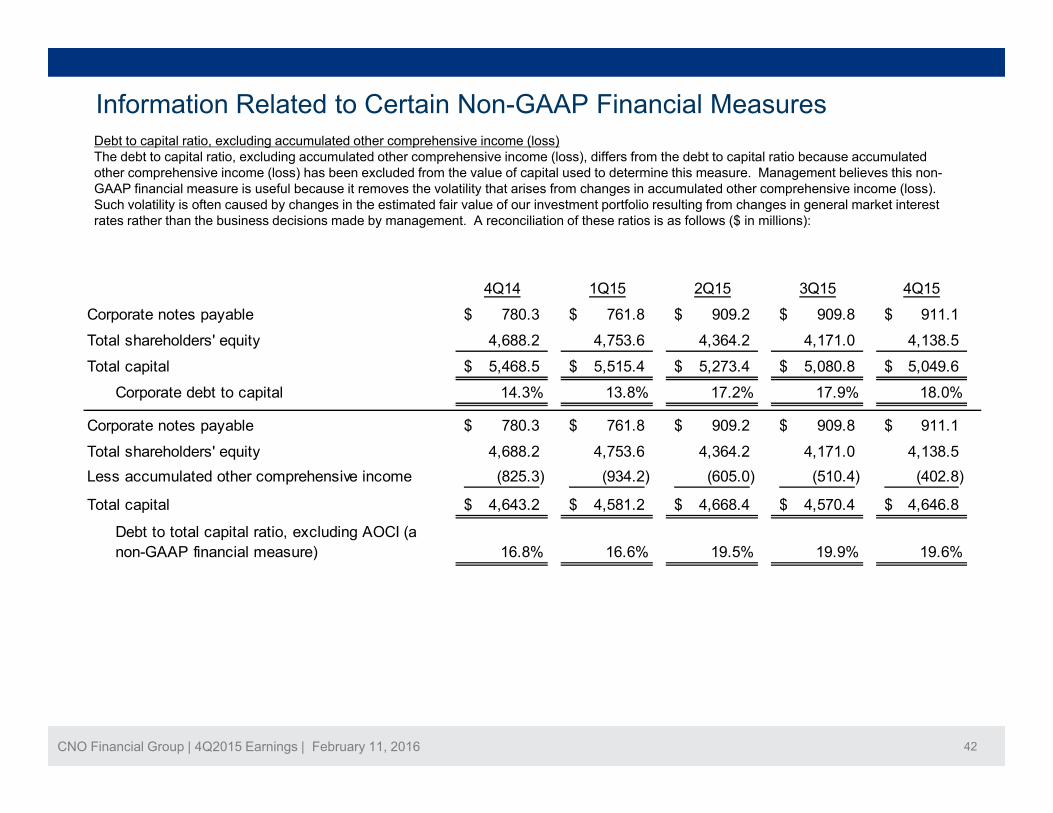
Information Related to Certain Non-GAAP Financial MeasuresDebt to capital ratio, excluding accumulated other comprehensive income (loss)The debt to capital ratio, excluding accumulated other comprehensive income (loss), differs from the debt to capital ratio because accumulated other comprehensive income (loss) has been excluded from the value of capital used to determine this measure. Management believes this non-GAAP financial measure is useful because it removes the volatility that arises from changes in accumulated other comprehensive income (loss). Such volatility is often caused by changes in the estimated fair value of our investment portfolio resulting from changes in general market interest rates rather than the business decisions made by management. A reconciliation of these ratios is as follows ($ in millions):
4Q14 1Q15 2Q15 3Q15 4Q15
Corporate notes payable 780.3$ 761.8$ 909.2$ 909.8$ 911.1$
Total shareholders' equity 4,688.2 4,753.6 4,364.2 4,171.0 4,138.5
Total capital 5,468.5$ 5,515.4$ 5,273.4$ 5,080.8$ 5,049.6$
Corporate debt to capital 14.3% 13.8% 17.2% 17.9% 18.0%
Corporate notes payable 780.3$ 761.8$ 909.2$ 909.8$ 911.1$
Total shareholders' equity 4,688.2 4,753.6 4,364.2 4,171.0 4,138.5 q y , , , , ,Less accumulated other comprehensive income (825.3) (934.2) (605.0) (510.4) (402.8)
Total capital 4,643.2$ 4,581.2$ 4,668.4$ 4,570.4$ 4,646.8$
Debt to total capital ratio, excluding AOCI (anon-GAAP financial measure) 16.8% 16.6% 19.5% 19.9% 19.6%
CNO Financial Group | 4Q2015 Earnings | February 11, 2016 42