foundations for measuring volume rendering quality
TRANSCRIPT
Foundations for Measuring
Volume Rendering Quality
Peter L. Williams t and Samuel P. Uselton _
Wassar College
Poughkeepsie, N.Y. I2601
U_ltt J Inc.
NASA Ames Research Center
Moffett Field, CA 94035-1000
Abstract
The goal of this paper is to provide a foundation for objectively compar-
ing volume rendered images. The key elements of the foundation are: (1) a
rigorous specification of all the parameters that need to be specified to de-fine the conditions under which a volume rendered image is generated; (2)
a methodology for difference classification, including a suite of functions or
metrics to quantify and classify the difference between two volume rendered
images that will support an analysis of the relative importance of particulardifferences. The results of this method can be used to study the changes
caused by modifying particular parameter values, to compare and quantify
changes between images of similar data sets rendered in the same way, andeven to detect errors in the design, implementation or modification of a
volume rendering system. If one has a benchmark image, for example one
created by a high accuracy volume rendering system, the method can be
used to evaluate the accuracy of a given image.
1 INTRODUCTION
As the availability and use of scientific visualization software has increased, the need to
improve methods of evaluating this software has become apparent. In the beginning, havinga visualization of data was so much better than not having one that much could be forgiven.

The visualizationprogrammerswerethe domainscientistsor workeddirectly with them. Iftherewereerrors in the visualization,they would be obviousto the scientistand so couldeasilybe fixed. But now asthe developersof visualizationsoftwarebecomemoreremovedfrom the users,the importanceof verifiable accuracygrows. Visualizationscanbe verymisleadingand the errorsareeasyto miss. It is essentialto be ableto distinguishbetweenthe resultsof the visualizationthat reflect the dataand the resultsdueto the visuMizationprocessitself [19]. This concernis evident in the visualizationcommunityfrom the recentproliferationof panelsand paperson the subject [9, 19,20, 23,38,51,63, 76].
For scientific visualization, the best. evaluation of an image's accuracy and quality is its
ability to support a viewer's accomplishment of particular tasks -- so the ideal method
for evaluating visualization software is by user testing. But user testing is difficult, time
consuming and expensive; and the results don't generalize easily. Therefore, we would like
to have computable functions for evaluating visualizations which at least, roughly predict
human performance of tasks dependent on the visualization.
In this paper, we focus on the evaluation of volume rendered images because this area is
sufficiently narrow to be tractable and sufficiently broad to be useful. The methods used for
direct volume rendering and the results generated are sufficiently similar across applications
to raise hopes that the same design process, if not exactly the same functions, will be broadly
applicable.
Methods for volume rendering rectilinear or voxel data sets, such as scanned medical data,
have been intensively investigated [8, 10, 25, 27, 29, 30, 33, 34, 40, 52, 5.5, 59, 62, 67, 77].
As a result of this research, and by exploiting the geometric regularity of the data samples,
volume rendering systems now exist that can interactivety generate useful images of such
data, even when the data sets are very large.
On the other hand, volume rendering systems for nonrectilinear (curvilinear, unstrlict.ured,
or scattered) data sets are relat{veiy slow due to the complex geometric confignrai_ion of the
underlying mesh [5, 11, 12, 13, 15, 28, 35, 37, 40, .5.5, 57, 64, 65, 68, 69, 74, 78]. For large
unstructured data Sets, it is currently necessary either to wait a substantial time for an image
to be generated or to introduce various approximations into the volume rendering process to
reduce the time. Some approximation methods are justifiable and can result in useful images
for visualization, a However, it is important, to know exactly how much these approximations
are distorting the volume rendered image. Therefore, this class of applications is in especial
need of methods for evaluating image quality and accuracy.
The goal of this paper is to provide a foundation for objectively comparing volume rendered
images. The two key elements of the foundation are: (1) a exhaustive list of all the parameters
(hat need to be specified to define the conditions under which a volume rendered image is
_The question "Why not resample an unstructured data set to a rectilinear mesh?" is frequently enconn-tered. Unfortunately, there are theoretical and practical difficulties associated with this. These issues areaddressed in Appendix A.
generated;(2) a methodologyfor differenceclassification,including a suiteof flmctionsormetricsto quantify and classifythe differencebetweentwo volumerenderedimagesthat willsupport ananalysisof the relative importanceof particulardifferences.
A completespecificationof the parametersis necessaryto properly compare the results from
different software rendering "the same" image, and to be able to isolate the effects on an
image of particular parameter choices. In addition, such a list of all the possible parameters
available for selection may bring to mind new applications and possibilities t.ha( had not
occurred to the visualization scientist. Some of these possibilities are discussed in Section 3.
In designing metrics, we are specifically interested in measuring the differences between two
images that affect the interpretation of the data. Some differences, such as a small amount
of random noise or the overall brightness of the image, may have no significant effect on
what the user notices. Other differences, such as an edge or a bright spot., could seriously
mislead a scientist who is looking for patterns or structure in a data set.. Our approach is to
develop: (a) a methodology for difference classification, (b) metrics which can be objectively
calculated and that. yield a numerical measure of the various classes of difference, and (c)
techniques for analyzing the content of each of these categories of difference and, if possible,
finding the source of the differences. The differences are separated into three classes, each
of which has a distinct, perceptual impact. The importance of a particular class of difference
will depend on the visualization task being performed.
The difference metrics have several potential applications. The results of this method can be
used to study the changes caused by modifying particular parameter values, or to compare
and quantify changes between images of similar data sets rendered in t.he same way, for
example air flow past the same aircraft but at different velocities, or changes in images of
different time slices from the same time-varying data set. They can even be used to to detect
errors in the design, implementation or modification of a volume rendering system. If one
has a benchmark image, for example one created by a trusted system of high precision, the
metrics can be used to evaluate the accuracy of a given image and t.o measure the effect on
images when approximations are introduced into the volume rendering process.
This paper provides a complete specification of the input parameters for a volume rendering
system. In addition, we present a methodology for analyzing the difference between two vol-
ume rendered images. A companion paper will report on the application of the methodology
developed herein to evaluate images produced by several existing volume rendering systemsfor a suite of nonrectilinear data sets. Several benchmark scenes will be included. The design
and implementation of a high accuracy volume rendering system for generating benchmark
quality images of unstructured data sets is described by Williams, Max and Stein in [73].
The following section refines the problem statement and places the problem in context.
Section 3 proposes a standard generation specification for volume rendered images. Section 4
describes a set of metrics to classify and quantify the differences between two volume rendered
images.

2 PROBLEM STATEMENT
The best test of the quality of a visualization is whether it enables the user to accomplish
the intended task more accurately, more rapidly and more easily than alternatives. Such
an evaluation requires careful specification of the task and precise measures of accuracy
in accomplishing it. It also requires extensive testing with an appropriate user population
and a carefillly defined testing procedure. The results of such testing are dependable but
expensive and narrowly applicable. If the task to be accomplished or the population using
the tool are varied or if some characteristics of the visualizations or input data differ, then
the previous results do not necessarily apply. Volume rendering has an extremely wide range
of applications, the tasks in each application vary dramatically, and many techniques are
available for generating the images. Once many narrow studies have been done, it may be
possible to formulate and test more general models, but these models will not be available
for USe soon.
We would like a set of analytical tests which provide an objective basis for comparing the
quality of visualizations. Ideally, the results of these tests will be good predictors of human
performance on a range of tasks when using these visualizations. These tests must measure
differences in images in a way that corresponds to differences in users' perceptions and
interpretations of the images.
Three examples illustrate the diversity of applications and tasks that can be addressed with
volume rendering. In medicine, volume rendering is used to display CT and MR data.
The tasks to be performed range from material classification of regions of the volume to
estimating size and relative position of particular features. The users are highly trained and
there is a clear standard of what to expect, for example a kidney has a typical size, shape
and location. Variations from the norm are of primary interest.
In seismic exploration, the data collected resembles ultrasound medical data, and some of
the tasks, particularly classification, are also similar. However, the context is quite different.
The training of a seismic interpreter is very different from that of a physician, and there is
a much wider range in the possible structures to discover. The kind of structures of interest
also vary with the intent of the scientist, for example earthquake prediction as opposed to
seeking oil.
In computational aerodynamics, a fluid is being modeled. Therefore material classification is
not a significant part of the visualization as it is in the ca_e of seismic or medical applications.
Vector rather than scalar quantities are the primary focus. Scalar values are derived which
highlight information about the vector field. A vortex in a flow field is a very different kind
of feature from a kidney stone inside a human patient.
To develop tools that are useful across such a broad range of applications, the ta_sks to be
accomplished must be considered very abstractly, and human perceptual abilities must be a
major guide. Several sources [4, 14, 16, 49, 60, 61] have developed guidelines for producing
good visualizations. Theserules are basedon humanperceptualabilities and propensitiesbut are generallyfocusedon presentationof information to an audience,rather than onconstructingvisualizationsfor a scientistto explorenew data.
A number of image quMity metrics have beenproposedand discussedin the literature.Barrett [2, 3] discussesthe derivationof a "mathematicalobserver"in the contextof radio-logical images,wherethe task is restrictedto assigningthe imageto oneof a fixed numberof classes(eg "lesionpresent"or "lesionabsent"). Imagequality is thendeterminedby theperformanceof the mathematicalobserver.We seeka methodfor comparingimagesthatis lesstask specific. Neumann[43] describes an aggregate comparison metric in which an
image is represented as a single vector of pixel attributes and the metric is calculated a_ the
inner product of two normalized image-vectors. Neumann also discusses a non image-based
feature scale method for measuring image quality. Wilhelms and Van Gelder [70] use the
combination of RMS and maximum absolule difference as a metric. A good deal of atten-
tion has been given to investigating and developing metrics which include a consideration
of human perceptual performance/experience. Several overall image quality measures based
on the human visual system are discussed in [18, 22, 24, 36, 45, 47, 53, 56, 58]. However,
these measures are complex and not entirely complete, and no nniversal agreement has been
achieved despite years of research. We prefer to objectively classify the difference between
two images into categories, each of which has a unique perceptual impact on the user, and
then to apply a metric to each category individually.
3 STANDARD GENERATION SPECIFICATIONS
We want to measure the differences in volume rendered images in a way' that will allow us
to determine whether two systems given the same input really make the same picture. We
also want to be able to measure the impact of changing rendering parameters or the effect.
of changes in the data (the scene content).
To make a usefid comparison of images generated by different volume rendering systems
requires great care in assuring that all the parameters (the scene, the viewing specifications,
the data set, etc) are appropriately matched. Similarly, a study of the effects of changing
a single parameter requires the careful control of all the other parameters. So a complete
listing of all the parameters that require specification is an important prerequisite for using
the metrics. The set of specific instances of all these parameters that is used to generate an
actual image is called the generation spemfication for that image.
Certain image generation information may be specified in different but equivalent ways,
e.g. a viewing position may be stated as a series of rotations and translations, or by an
eye position, a look-at position and an up-vector. We will choose one and assume that.
conversions can be computed.

Most volume rendering systems will not have explicit inputs for controlling all the possible pa-
rameters. Many parameter choices are made as design decisions during system development;
other choices may not have even occurred to the developers. These hardwired parameters
must also be determined in order to do a thorough job of understanding a comparison.
Sub-Section A gives a complete and detailed list of all the parameters that must be specified
to precisely define the conditions under which a volume rendered image is generated. In
Sub-See(ion B, the parameters are described in further detail.
A. Parameter Listing
The following summarizes the general:categories of information needed to specify (,he condi-
tions under which a volume rendered image is generated.
General Specification Categories
Scene Description
Data Set
Transfer Functions
Background
I,ighting
Derived and Embedded Objects
Viewing Parameters
Optical Model
Image Specification
The information within each of the above categories is enumerated below.
Scene Description:Data Set:
• geometry
• data field name(s), data values, and precision
• time step
• data location (at vertices, or face- or cell-centered)
. mathematical operations on ttle field values resulting in derived values
• intra-cell interpolation information
• modeling transformations for multiple grids
• symmetry transformationsTransfer Functions:
• mapping from scalar data value to color emission
• mapping from scalar data value to extinction coefficient
6
Background:
. background color and/or texture map
Lighting:
• intensity, location and direction of lights
• intensity of ambient light
• illumination model
Derived and Embedded Objects:
, surface or procedural description
. material properties and shading model for snrfaces
Viewing Parameters:
• projection type (orthographic/perspective)
• eye position, look-at position, up vector
• viewplane window (right, left, top, bottom,)
• distance from eye to viewplane
. z-near, z-far clipping planes
. viewing coordinate system handedness
Optical Model:
• underlying theoretical optical model or light intensity differential equation
, precise definition of optical properties of volume density
Image Specification:
• image size in pixels
• image format
B. Explanations, Preferences and Assumptions
In this section, the descriptions of certain parameters listed in the previous section are
amplified and/or qualified. Any related assumptions as well as our preferences are stated.
The Scene Description:
The Data Set:
The data set geometry must be specified -- this includes the following information: the
coordinate system (Cartesian, cylindrical, spherical, etc.) in which the data is defined, in
the case of a Cartesian system, whether it is right or left handed, the number of vertices in
the data set, and the coordinates of each vertex. If the data set is defined on an underlying
grid or mesh, the following information should also be given: the number of cells of each type
(tetrahedron, pyramid, prism, brick, etc.), the vertices which define each cell and each face
of each cell. Currently, there is no standard format for these specifications. For unstructured
7
datasets,weusethe format givenby Williams, Max andStein in [73].For structuredCFDdata sets, suchas curvillnear mesheswith hexahedralcells,the PLOT3D file formats, asupdatedin [66],seemuseful.
Sincea dataset usually consists of several fields, each specified for one or more time steps,
the name(s) of the specific data field(s) being visualized and their associated time step must
be specified. (As described in the following section on transfer functions, more than one
field may be used directly in creating the visualization.) If the field being visualized is itself
derived from one or more of the raw data fields, the flmction to calculate this derived field
must be specified. In addition, the precision of the data fields in the data set should bestated.
To allow the field to be correctly evaluated within a cell, interpolation fimctions need to
be specified for each cell type. If applicable, the order 0f the cells should be stated; for
example, finite element data sets may have |_near, quadratic or cubic cells and the cell
faces may" be planar or curvilinear. To ensure maximum accuracy in the visualization, the
scientist generating the data set should provide as much information as possible about the
interpolation methods used in the simulation, including if applicable, the actual shape or
parameter fimctions used to generate the data. For scattered data, Nielson [44] and Ruprecht
and Muller [50] discuss appropriate interpolation methods. Either the use of locally bounded
multiquadric radial basis fimctions, or the triangulation of the points Mth a Delaunay or a
regular triangulation [32] and then use of linear interpolation seems preferable.
If a data set has multiple grids, each with its own coordinate system, the modeling trans-
formation must be provided for each grid so as to specify the relative positions of the grids.
Any symmetry transformations used to visualize symmetric areas of the field that are not
actually part of the data set should be specified.
Transfer functions:
Transfer fimctions specify the mappings from scalar field values to color and extinction
coefficient values. These mappings need to be clearly specified. One method for doing this
is described below. In addition, for non-gray-scale maps, the color model (RGB, HSV, etc.)
should be specified. Sometimes it is useful to map one data field to color and a different field
to opacity (and even to show iso-surfaces of a third field value); these mappings need to be
stated.
Transfer fimctions are commonly specified in a piecewise linear fashion; there are a number
of benefits from doing this. When the scalar field varies linearly within a cell, the differential
equation for the light intensity along a ray through the volume can be integrated exactly if
the transfer functions are linear or plecewise linear [75] (assuming the use of the RGB color
model). In addition, the use of linear or piecewise linear transfer fimctions allows certain
efficiencies in the volume rendering process.
In selecting the transfer functions, it should be recognized that a C 1 discontinuity occurs
at the junction of two adjacentlinearportions of a piecewiselinear transfer function. Thisdiscontinuitycan introduce artifacts into the volume rendered image. For example, inside a
linear tetrahedra, the field varies linearly therefore the intensity in the image should too; but
if within the cell the field values straddle a discontinuity in the transfer flmction, a nonlinear
variation in the intensity will be introduced. To eliminate this effect, would require the
transfer functions to be linear over their entire range (constant. or a ramp). This is a rather
impractical limitation and usually it. suffices just to minimize the number of breakpoints. For
maximum accuracy, the transfer flmctions should be applied after the data is interpolated
within a cell, rather than interpolating the color and extinction coefficient.
An unambiguous specification of the transfer flmctions is a key element, in tile generation
of volume rendered images. One useful method for specifying the functions is a table with
entries for the data field value, the color and the extinction coefficient, si,ci,ei , I < i < n,
where si <_ si+l. For s < sl the color and extinction coefficient are cl, el; similarly for s > s,_
they are c,,en. For si < s < Si+l, color and extinction coefficient are linearly interpolated
between ci and ci+l, and ei and ei+l, respectively. A discontinuity in the transfer flmction
can be specified by giving two different, sets of color and extinction coemcient for the same
scalar value, so for successive indices i and j, si = sj, si, ci, ei and sj, cj, ej would be specified.
The idea being that one piece of the transfer function runs from si-i to si and another piece
from sj to s j+l, thus allowing a discontinuity at si = sj.
The Background:The background may be a solid color specified as a pixel value, or a pattern specified as an
image or as a procedural mapping from either the data set coordinate system or the viewing
coordinate system to a pixel value. For the purpose of image comparison, a solid background,
preferably black, eliminates the problem of a slight, misalignment in background patterns.
However, for general use, background patterns, such as a black and white checkerboard, are
an excellent aid in understanding semitransparent images.
Lighting:
If the optical model requires lighting, for example to produce shaded contour surfaces with-
out actually constructing surface polygons as in Max's single scattering model [41], or if
lighting is required to shade the surfaces of embedded or derived objects, it is necessary
to specify the direction, position and intensity of the external light(s), the intensity of the
ambient light, and the illumination model, for example Lambert, Phong, Blinn-Phong, etc.,
Derived and Embedded Objects:
It can be very usefld to embed surfaces or solid objects in a visualization to serve as a physical
reference and give visual cues, for example an airfoil in a flow field or the biopsy needle in
an image from ultrasound data. Often this information is given as a set of polygons in the
data set. Derived objects, such Ks isosurfaces, cutting planes, stream surfaces, etc. should
9
be flllly specified,including thenameof the scalarfield from whichthey arederivedandthecriteria usedto calculatethem, suchmsthe contourvalue,rakeposition,etc.
Thecolorof theseobjectsshouldalsobespecified.If the surfacesof theseobjectsareshaded,the shadingmethod, for exampleGouraudor Phong,and the relevantmaterialproperties(ambient,diffuseand specularreflectivity,shininess,transparency,etc.) appropriatefor theillumination modelneedto be specified.In addition, the outward directionof the surfacesshouldbespecified,e.g. for a contour surface, whether the normal points in the direction of
the gradient or in the opposite direction.
Viewing Parameters:
The viewing parameters described in Section 3 are complete. However any alternative spec-
ification may be used if it can be unambiguously converted to that shown here. We assume
(he view plane is perpendicular to the line between the eye position and the look-at position
as is usual in volume rendering. If this is not the case, this should be stated. We also assume
that all parameters are given in world coordinates.
Optical Model:
A number of different optical models suitable for volume rendering are described by Max in
[41]. The optical model specification must include both (at a precise definition of the opti-
cal properties: color emission (or glow energy if monochromatic) and/or absorption (optical
density or extinction coefficient) 2, and (b) the differential equation for the light intensity
along a ray through the volume in terms of these optical properties. Examples of such dif-
ferential equations are given by equations (1), (4), and (6)in [41]. The differential equation
for the model should be specified in its basic form before any simplifications or assumptions
(such as assuming the color or scalar field is constant within a cell, or that the interpolation
function is linear). This should be done even if simplifications or assumptions are used to
actually generate the image. This allows a benchmark system to create an accurate image for
comparison based on the unsimplified differential equation. Failure to specify any aspect of
the optical model can result in ambiguity. An actual example of ambiguity in a visualization
caused by an incomplete specification of the underlying optical model is given in Appendix B.
Image Specification:
Formally, an image is a two dimensional function f(x, y), where x and y denote spatial screen
coordinates and the value of f at any point (x, y) is the pixel value of the image at that
point. For our purposes, a pixd vahte p is an n-dimensional vector p C Nn specifying light
intensity. For a gray-scale image, n is 1. For a tristimulus system such as RGI? or HSV, n
is 3. Unless otherwise specified, an image refers to a volume rendered image.
For benchmark comparisons, pixel values should have the maximum available precision. This
_Optical density p is the term used in [7,5],it is equivalent to the extinction coefficient r used in [41].
10
of coursewill depend)lot only on the compiler,but on the renderingmethod (hardwareorsoftware)andthe algorithmused. If the pixel valuesaregeneratedasfloatingpoint numbersand then convertedto limited precision(e.g. 8-bit per channel)for display,it is preferableto usethe floating point valuesfor comparisonpurposes. The pixel valuesshouldbe theraw values,before anyadjustmentssuchasfor ratio-basedintensity or gammacorrection.Compressionshouldnot beusedunlessit is lossless.Forthe workherein,the pixel valuesaresingleprecisionfloating point numbersin the range[0.0,1.0](exceptfor differenceimageswhich areintroducedand describedin the next section).
The imagesize is specifiedin pixels, as zres pixels horizontally by yres pixels vertically.
The pixel array storage convention should be clearly specified. The location of the point at
which the pixel value is calculated within the overall area of the pixel should be specified,
for example at the center of the pixel area or at the lower left hand corner, etc.
4 DIFFERENCE METRICS
A metric is a measure of the distance between two objects. In mathematical analysis, me)rics
are required to be nonnegative, independent of the order in which the objects are specified,
and abide by the triangle inequality. In addition, if the distance between objects is zero,
they must be the same object. The metrics we define are intended to be a measure of
the difference between two images. A difference of zero should surely mean the images are
the same. Making the measurements nonnegative and symmetric is easily done. Only the
verification of the triangle inequality may be difficult. Because we classify the difference
and compute measures of each class separately, calling these measurements metrics may be
abusing the term slightly, but it reminds us of the ideal we would like to have.
We may use the metric to compare an image generated by a newly constructed volume
renderer with a benchmark image, or to measure the effect on an image when a rendering
parameter is varied. We first focus on metrics for comparing a single color component of two
images. These may be two gray-scale images or a single channel of two multichannel images.
Other methods for multichannel image comparison are discussed below. For the remainder
of this paper, we assume all images have a solid black background.
Let the difference image of two images A and B be the image formed by subtracting image B
from image A on a pixel by pixel basis; this is written as diff(A, B). For the purposes of this
paper, pixel values of a difference image are in the range [-1.0, 1.0]. A difference image can
be displayed in a number of ways, for example: (a) display the absolute value of each pixel
value, (b) clamp the pixel values at +0.5 and then add 0.5 to each pixel value, (c) divide
the pixel values by 0.5 and then add 0.5 to each pixel value, or (d) convert the difference
image to a color image where the positive pixel values and the negative pixet values are each
mapped to different colors.
11
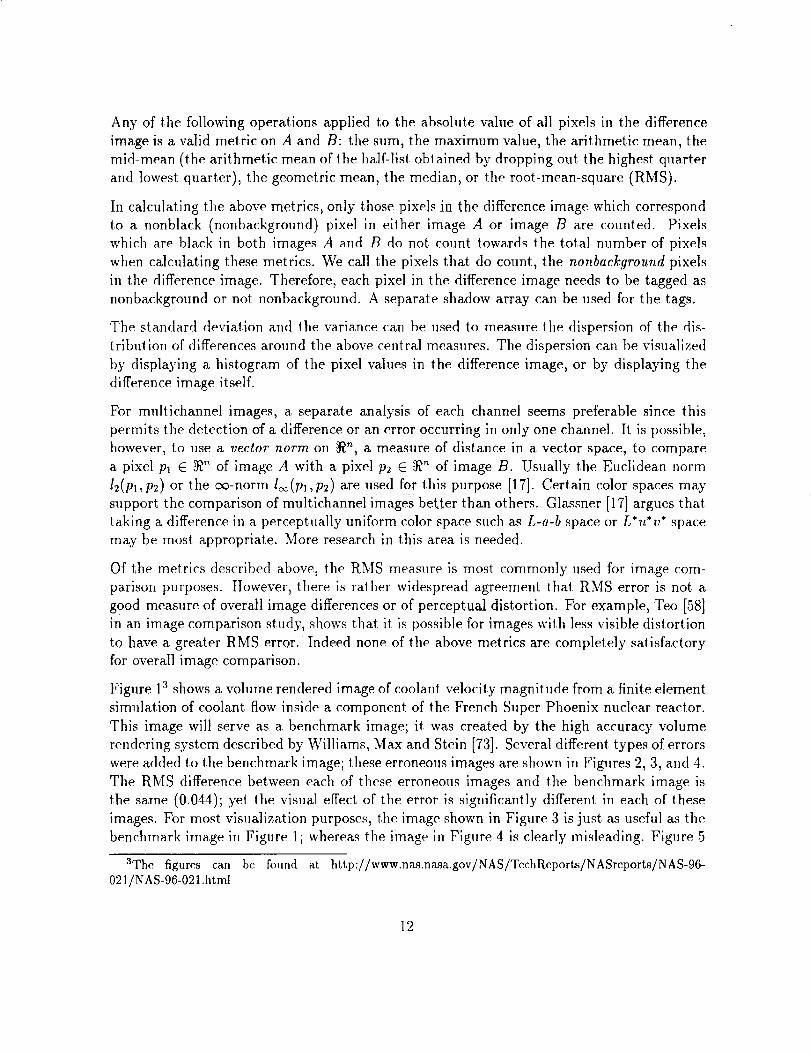
Any of the following operations applied to the absolute value of all pixels in the difference
image is a valid metric on A and B: the sum, the maximum value, the arithmetic mean, the
mid-mean (the arithmetic mean of the half-list obtained by dropping out the highest quarter
and lowest quarter), the geometric mean, tile median, or the root-mean-square (RMS).
In calculating the above metrics, only those pixels in the difference image which correspond
to a nonblack (nonbackground) pixel in either image A or image B are counted. Pixels
which are black in both images A and B do not count towards the total number of pixels
when calculating these metrics. We call the pixe]s that do count, the nonbackgro_md pixels
in the difference image. Therefore, each pixel in the difference image needs to be tagged as
nonbackground or not nonbackground. A separate shadow array can be used for the tags.
The standard deviation and the variance can be used to measure the dispersion of the dis-
tribution of differences around the above central measures. The dispersion can be visualized
by displaying a histogram of tile pixel values in the difference image, or by displaying the
difference image itself.
F'or multichannel images, a separate analysis of each channel seems preferable since this
permits the detection of a difference or an error occurring in only one channel. It is possible,
however, to use a vector norm on _n, a measure of distance in a vector space, to compare
a pixel Pl E _'_ of image A with a pixel P2 E _'_ of image B. Usually the Euclidean norm
12(p_; P2) or th e co-norm loo(pl, p2) are us,ed f0_r this purpose [17]. Certain color spaces may
support the comparison of multichannel images better than others. Glassner [17] argues that
taking a difference in a perceptually uniform color space such as L-a-b space or L*v.*v* space
may be most appropriate. More research in this area is needed.
Of the metrics described above, the RMS measure is most commonly used for image com-
parison purposes. However, there is rather widespread agreement that RMS error is not a
good measure of overall image differences or of perceptual distortion. For example, Teo [58]
in an image comparison study, shows that it is possible for images with less visible distortion
to have a greater RMS error. Indeed none of the above metrics are completely satisfactory
for overall image comparison.
Figure I a shows a volume rendered image of coolant velocity magnitude from a finite element
simulation of coolant flow inside a component of the French Super Phoenix nuclear reactor.
This image wilt serve as a benchmark image; it was created by the high accuracy volume
rendering system described by Williams, Max and Stein [73]. Several different types of errors
were added to the benchmark image; these erroneous images are shown in Figures 2, 3, and 4.
The RMS difference between each of these erroneous images and the benchmark image is
the same (0.044); yet the visual effect of the error is significantly different in each of these
images. For most visualization purposes, the image shown in Figure 3 is just as useful as the
benchmark image in Figure 1; whereas the image in Figure 4 is clearly misleading. Figure 5
aThe figures can be found at http://www.nas.nmqa.gov/NAS/TechReports/NASreports/NAS-96-021/NAS-96-021.html
12
showsthe cumulativeeffectof adding all three types of error at onceto the benchmarkimage.This imagewill beusedasanexamplein explainingour metricsand the processforcomputingthem.
Existing approachesto imagequality metrics arediscussedat the end of Section2. Ourapproachis to decomposethe overallor aggregate difference between two images into cate-
gories, each of which has a distinct perceptual impact, and then measure and analyze each
of these categories. The categories are carefldty chosen so that each category of difference is
responded to quite differently by the human visual system. When applied to these individnal
categories of difference, the metrics described above give a more useful representation of how
the images differ.
We partition the difference between two images into three categories: bias, noise and struc-
tured difference. These categories are defined in the following sections. We refer to the
overall difference image of two images A and B, cliff(A, B), as the aggregate difference im-
age. The aggregate difference image, cliff(Figure 1, Figure 5), is shown in Figure 6. (Method
(c), described above, is used to display all difference images in this paper.) Our goal then
is to use numerical statistical methods as well as image processing techniques: (a) to sepa-
rate the aggregate difference into noise, bias and structured difference, (b) to quantify with
mathematically computable metrics the amount of difference in each of these categories, and
(c) to analyze each category of difference to determine its composition, and if possible, tofind its sources.
The importance of a particular component or subcomponent of difference will depend on the
intended use of the image. Some differences, such as a small component of low level random
noise or a small difference in the overall brightness of an image, may not have a significant
effect on the user. Whereas a difference in the form of a small bright blob or a halo could
be very misleading depending on the specific visualization task being performed. Separating
the difference into different general categories allows us to discriminate between differences
that are perceptually less significant and those that can seriously affect the interpretation of
the data. Given a specific task, the metrics can then be used to predict the relative value of
two images for accomplishing that. task.
The following sections define and discuss each of these classes of difference, investigate the
implications of each on visualization, and describe methods to isolate, measure and analyze
each category of difference.
A. Noise
Noise in a signal is an uncorrelated modification to the original signal. For the purpose of
analyzing the differences between two images, we assume that random or spurious differences
in pixel values that are not part of any larger pattern are noise. Sources of noise in a volume
rendered image can include numerical or roundoff error, stochastic sampling, and numerical
overflow during the computation of the image. Numerical overflow can occur if a limited
number of bits, e.g. 8 bits, is used to accumulate pixel intensities; a slight increase or decrease
13

in intensity can cause an extreme change in the pixel value, e.g. from 255 to 0. Generally,
numerical error will cause low level random noise with a fairly high spatial frequency and
a normal distribution of differences whose mean will be close to zero. Stochastic sampling
and overflow can give rise to spike noise or pops; this form of noise will generally have a low
amplitude uniform distribution of differences.
Because of its lack of spatial correlation, noise in an image generally has a higher spatial
frequency spectrum than the more structured components of the aggregate difference image.
Therefore low-pass spatial filtering can be effective for removing noise. There are several
techniques for image smoothing including neighborhood averaging and low-pass filtering
[21, 48]. Typical smoothing filters perform some form of moving window operation that
may be a convolution or other local computation in the window. Linear smoothing can be
performed either by convolution or by Fourier filtering. There is no difference in the results;
however, Fourier domain processing often gives more insight into the nature of the noise and
so is useful in designing a noise filter. Fourier filtering methods are described in [42, 48].
It is easy to smooth an image and thereby filter out noise; the problem is how to do so without
blurring interesting features. Typically edges have a high spatial frequency so smoothing
filters tends to attenuate or blur the sharpness of edges in an image. This blurring of edges
will also result in incorrectly classifying a portion of the aggregate difference image as noise.
For this reason, we emphasize edge-preserving filters.
Typical windowing filters set the value of the center pixel in a neighborhood or window to
a function of the other pixels in the window. This function may be the mean, the weighted
mean, the median, the mode, or the mean of the k pixels in the window whose values are
closest, to the center pixel. Lee and Redner [31] describe a class of nonlinear filters called
alpha filters. In these filters, the samples in the neighborhood are sorted in increasing order,
a percentage a of the samples are removed from both ends of the sorted list, and then the
remaining samples are averaged. To improve the filtering, the alpha filter can be repeatedly
applied with different values of alpha.
Windowing filters can have different shapes. Some of the more useful window shapes are
square, plus-sign and octagonal. Typically the sizes of the windows range from 4 to 24 of
the nearer neighbors. Small sized windows are preferable since features or artifacts smaller
than about 3 x 3 to 5 × 5 pixels can often be safely ignored.
Other window filtering methods are based on gradients, homogeneity, iteration, cascaded
filtering or conditional filtering [48]. A quantitative comparison of some of these methods is
given by Chin and }%h in [6]. In addition, optimal filtering can be used for noise suppression
[26]. Shapiro and Silverman [54] present a method to characterize the amount of noise in
a Signal prior to its removal A noise M{er may work reasonably well on one type of image
but not on another so care must be taken in selecting a filter. The nature of the noise
and the attributes of _'eaGiires of lnterest, such as horizontal or vertical alignment, should be
incorporated into the design of the filter -- one way to approach to this is to use Fourier
14
analysisasreferredto above.
The median,the k nearest neighbors and the alpha filter with a plus-sign shaped window
seem to be the best edge-preserving filters. The blurring effect of neighborhood averaging
can also be reduced by using a threshold procedure [21]. The idea here is to leave unchanged
those values whose difference from their neighborhood values do not exceed the specified
value of the threshold. This technique can produce an equivalent reduction in noise to
non-threshold smoothing, but. can leave the edges much sharper.
We calculate a noise-filtered difference image by applying one of the above edge-preserving fil-
ters to the aggregate difference image. Let the aggregate difference image be D and the noise-
filtered difference image be NF, then we define the noise image X to be diff(D, NF). A metric
for the noise in the aggregate difference image D is given by .M,_ois_. = _,u_pi,_L,,,t,,_., IX] •
This metric is an approximation since the noise-filtered difference image may contain a com-
ponent of structured difference: (a) a fine grained texture or pattern whose detail is smaller
than the pixel smoothing window or (b) the effects of edge blurs resulting from the filtering
process. Isolating these components from the noise-filtered difference image before calculat-
ing the noise metric will result in a more accurate measure of noise. Methods for isolating
and removing fine grained texture in an image are given in [1,48]. One method to identify
edge blurs is described next.
The effects of edge blurs in the noise image can be detected by an analysis of the distribution
of the nonbackground pixel values in the noise image. A histogram is very useful for doing
this. Pure noise will usually have either a uniform or a normal distribution of differences.
The degree of deviation from either of these distributions is a measure of edge blur in the
noise image. For a more accurate analysis, the noise image can be successively subdivided
into smaller tiles and the distribution of difference analyzed for each tile. This procedure is
also valuable for determining if the noise is uniformly distributed spatially over the image
or is constrained to certain regions.
The human visual system is remarkably tolerant of noise [7, 72]. Therefore unless the signal
to noise ratio is low, noise has little effect on the use of the image. When an image A is being
compared with a benchmark image B, a signal to noise ratio can be calculated for image A
as (_]_tt_pi_,t__l_ B)/.A4,_oi_, where Ad,ois_. is the noise metric for the aggregate difference
image diff(A, B).
Figure 7 shows the noise-filtered difference image after filtering the aggregate difference image
shown in Figure 6. To create the noise filtered difference image, the aggregate difference
image was filtered with one pass of a median filter, followed by a single pass of an alpha
filter with a = 0.5. A 3x3 plus-sign shaped window, which included five pixels, was used for
both filters. The noise metric for the image shown in Figure 6 is Mnoi,, = 3023.42, and the
signal to noise ratio is 2770_.10 _ 9.16.,3023.42
The noise should be removed from the aggregate difference image before proceeding t.o isolate
the bias and structured difference as described in the following two sections.
15
B. Bias
If oneof two imagesbeingcomparedis uniformly brighter than the other,but hasno otherdifference,the aggregatedifferencemetricswill showasignificantdifferenceeventhoughtheinformation content of both images could be perceptually equivalent. In statistics, bias is
defined as the expected value of the difference between a value and an estimate of that value.
We use the term bias to refer to a (relatively) uniform difference in intensity between images
across the pixels of the image. The effect of bias may not be serious if the pixel intensities
lie in the linear portion of the response curve of the monitor and the human visual system.
The difference of the medians of the nonbackground pixel values of each of the images being
compared is an excellent metric for bias, J_b_, = Median(A) - Median(B), where A and B
are the two images being compared, B is the benchmark image if applicable, and background
pixels, as determined from the difference image diff(A, B), are ignored. In order to have a
measure of the bias that can be compared with the noise and structured difference metrics,
which are cumulative measures rather than per pixel measures, we define a cumulative bias
metric Mbi__o,_r_tt = n * Mbi_s where n is tile number of nonbackground pixels. The bias
metric computed by subtracting the median of the nonbackground pixels in the benchmark
image from the median of Figure 5 after the removal of noise is 3.4bi_s = +0.063. This
indicates that each pixel in the error image is 6.3% brighter than in the benchmark image.
The cumulative bias metric is .Mb/_,_o_r_zt = 8446.03.
The mode of a distribution f(x) is the value of x where f(x) is maximum. The mode of
a distribution of pixel values can be determined by an analysis of a histogram of the pixel
values using a limited number of buckets. Provided the mode of the dis(ribution of pixel
values in a noise-filtered difference image is sufficiently distinct, it can also be a metric for
bias, Mb,_.,_ = Mode(noise-filtered-difference-image).
The bias should be subtracted from the noise-filtered difference image before analyzing thestructured difference as described in the next section.
C. Structured Difference
Structured difference is that part of the aggregate difference image which consists of objects
which have a coherent structural form, such ms edges, halos, lines, bright or dark spots, blobs,
textures or pat.ternsl We refer to these objects collectively as structured objects. The presence
of structured difference means the images being compared have a meaningful difference in
content in the context of scientific visualization. These differences may be features that are
introduced or enhanced or are lost. or attenuated; they may or may not represent, features
inherent in the data set. In any case, the class of difference which is most important to focus
on when comparing and/or evaluating volume rendered images is structured difference. In
visualization, the scientist is looking for patterns or structure in the data, therefore structured
difference is highly significant as it could mislead the scientist.
After noise and bias have been removed from the aggregate difference image, the resulting
16
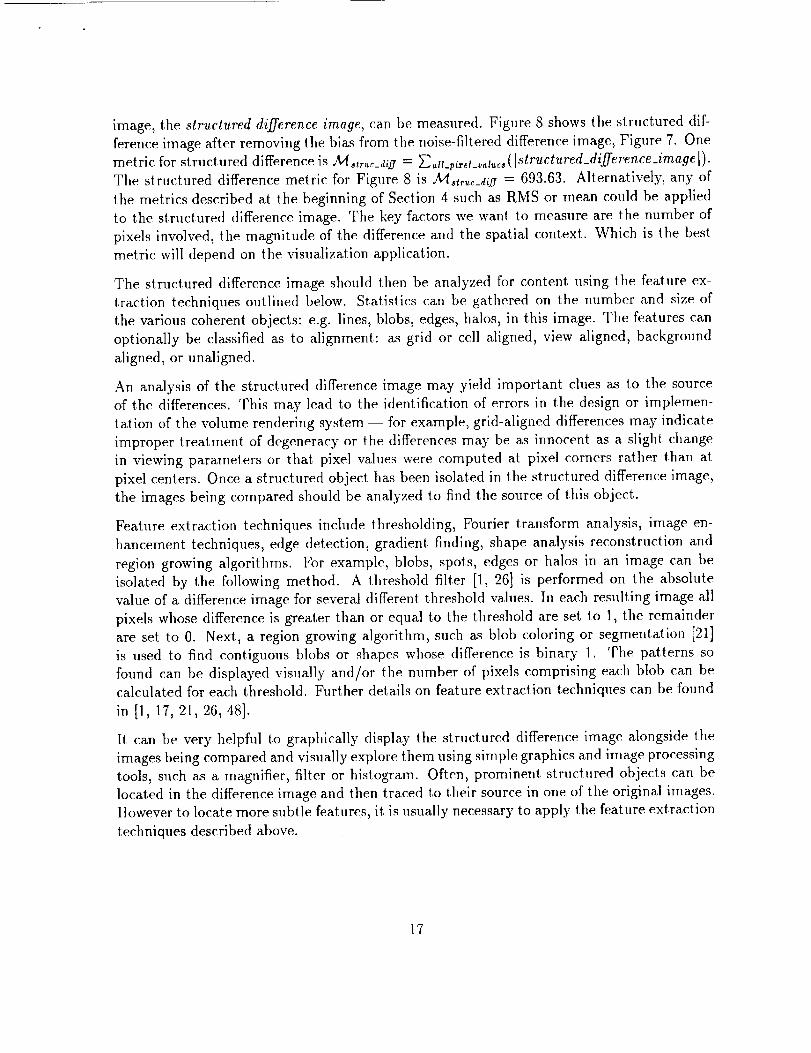
image,the structureddifference image, can be measured. Figure 8 shows the structured dif-
ference image after removing the bias from tile noise-filtered difference image, Figure 7. One
metric for structured difference is M,tr__di# = _ _u_m__,_r_,_ (1structured_difference_image [).
The structured difference metric for Figure 8 is M,tr__di2' = 693.63. Alternatively, any of
the metrics described at the beginning of Section 4 such as RMS or mean could be applied
to the structured difference image. The key factors we want to measure are the number of
pixels involved, the magnitude of the difference and the spatial context. Which is the best
metric will depend on the visualization application.
The structured difference image should then be analyzed for content using tile feature ex-
traction techniques outlined below. Statistics can be gathered on the number and size of
the various coherent objects: e.g. lines, blobs, edges, halos, in this image. The features can
optionally be classified as to alignment: a_s grid or cell aligned, view aligned, background
aligned, or unaligned.
An analysis of the structured difference image may yield important clues as to the source
of the differences. This may lead to the identification of errors in the design or implemen-
tation of the volume rendering system -- for example, grid-aligned differences may" indicate
improper treatment of degeneracy or the differences may be as innocent as a slight change
in viewing parameters or that pixe] values were computed at pixel corners rather than at
pixel centers. Once a structured object has been isolated in the structured difference image,
the images being compared should be analyzed to find the source of this object..
Feature extraction techniques include thresholding, Fourier transform analysis, image en-
hancement techniques, edge detection, gradient finding, shape analysis reconstruction and
region growing algorithms. For example, blobs, spots, edges or halos in an image can be
isolated by the following method. A threshold filter [1, 26] is performed on the absolute
value of a difference image for several different threshold values. In each resulting image all
pixels whose difference is greater than or equal to the threshold are set to 1, the remainder
are set to 0. Next, a region growing algorithm, such as blob coloring or segmentation [21]
is used to find contiguous blobs or shapes whose difference is binary 1. The patterns so
found can be displayed visually and/or the number of pixels comprising each blob can becalculated for each threshold. Further details on feature extraction techniques can be found
in [1, 17, 21, 26, 48].
It can be very helpfid to graphically display the structured difference image alongside the
images being compared and visually explore them using simple graphics and image processing
tools, such as a magnifier, filter or histogram. Often, prominent, structured objects can be
located in the difference image and then traced to their source in one of the original images.
However to locate more subtle features, it is usually necessary to apply the feature extraction
techniques described above.
17
5 SUMMARY
The goal of this paper is to lay a foundation for objectively comparing volume rendered
images, leading to objective evaluation of their accuracy and quality. In order for an image
comparison to be useful the images should be created with equivalent parameters or a)least
with any differences known. In order to generate a benchmark image for comparison pur-
poses, the parameter specifications must be provided. So an essential prerequisite for image
comparison is a complete list of all possible parameters that must be specified. We provide
such a listing and also state preferred formats and/or values for many of the parameters
which will result in maximizing the effectiveness of the comparison process, especially for
benchmark comparisons.
When comparing two images it is not enough just to look at. a measure of the overall or
aggregate difference between the images. Rather it is necessary to measure specific differences
that. affect the interpretation of the images. To dramatize this, we showed a benchmark image
and a set of three erroneous images each of which had a different category of error added
to it. The RMS difference between the benchmark image and each error image is identical.
As can be seen in these figures, the error has a very different perceptual impact in each
of the three cases. Therefore, ill this paper we focus on analyzing and decomposing the
difference before measuring it.. To do this, we develop: (a) a methodology for classifying the
difference between two images as noise, bias or structured difference, (b) a suite of metrics
to objectively quantify each class of difference, and (c) techniques to analyze the nature ofeach class of difference and relate it to its source.
The difference metrics can be used to measure the effect on images when approximations are
introduced into the volume rendering process, and they can lead to the detection of errors in
the design or implementation of a volume rendering system. The metrics can also be used to
determine the effect on an image when a rendering parameter is changed, to compare images
generated by two different volume rendering systems, and to detect and quantify changes
between images of similar data sets or images of different time steps in time-varying datasets ................
Althrmgh the methodology described herein was developed primarily for evaluating images
of nonrectilinear data sets, most of this work is also relevant to uniform grids. This research
was not designed to exclude voxel data, but rather to be as generally applicable as possible.
This work may- also be applicable to benchmarking studies of images created by general
purpose radiosity or ray' tracing systems.
The difference classification methods and the metrics described herein are currently being
used to evaluate images produced by several existing volume rendering systems for a suite of
nonrectilinear data sets. A companion paper will report on this work and also will include
several volume rendering benchmarks. Each of these benchmark scenes will consist of an
image generated by a high accuracy volume rendering system and its complete generation
18
specification,asdefinedin Section3B.
Work in this areais just beginning,so additionalwork is needed on a wide variety of top-
ics. The development of additional categories of differences and better metrics will improve
the usefldness of this work. Methods for analysis of structured difference are likely to be
application dependent, but also quite usefld. Noise filters for Gaussian noise (and other
distributions) can be developed. And finally, testing the accuracy of our hypothesis that
structured differences are what really matters (by measuring tile performance of people per-
forming specific tasks) will be useful and enlightening.
ACKNOWLEDGMENTS
We are gratefid to David Kenwright, Dan Asimov and Nelson Max for reading an early draft
of this paper and offering many valuable comments. Nelson Max and Allen Van Gelder
provided helpful discussions relating to Appendix B. Charlie Smith suggested the use of
the median as a measure of bias. Keki Burjorjee, with support from the Undergraduate
Research Summer Institute at Vassar College, implemented some of the image processing
tools described herein. The data set used to generate the images in this paper was provided by
Bruno Nitrosso and Electricit6 de France. The first author gratefidly acknowledges summer
support and equipment loans from NASA Ames Research Center
APPENDIX A
The question is often asked, "If volume rendering curvilinear and unstructured grids is so
slow, why not resample the data to a regular grid?" There are both theoretical and pragmatic
difficulties with this suggestion.
Assume the original data is completely specified by the locations of the original points, the
va]ues at these original data points and some interpolation fimction between these points.
The degree of the interpolation function and the geometry of the original mesh determinea lower limit on the size of the smallest feature that can be present. This limit and the
Nyquist sampling theorem determine the required sampling density to capture all features;
at least, two samples per interval of this feature size are needed in each dimension. For
simplicity, assume linear interpolation across tetrahedral grids, and trilinear interpolation
across hexahedral cells of curvilinear grids. These assumptions force all extrema of the field
to be at sampled locations, so no feature is smaller than the smallest distance between
original grid points. Sampling at twice the density in each dimension of the smallest cell
in a curvilinear grid of hexahedral cells results in an eightfold increase in the number of
samples required, assuming all the cells are roughly the same size. If a volume renderer for
regular grids runs between ten and one hundred times faster than one for unstructured or
19
curvilineargrids, this trade-offmay"seemadvantageous.Howeverthereareproblemswiththis approach.
A strictly pragmaticproblemis that fast volumerenderersusuallyrequireall the data to fitin memory. But nonrectilineardatasetsoften arevery large. Resamplingsucha data setmakesit at leasteight timeslargerand probably far too large to fit in memory.Then thefast regulargrid rendererslowsto a rate limited by diskpaging.
A much more severe,but still pragmatic, difficulty ariseswhen confrontedby real datasets. The reasonfluid dynamicscomputations are performed on curvilinear grids is, in
part, because the size of the features of interest varies drastically across the volume of
the computation. The grid cell sizes vary correspondingly to capture these features. The
aeroscientists spend a great deal of time and effort designing these grids to capture features
of interest as precisely as possible with a fixed budget of nodes. This limit is determined by
the memory available on the machine performing the computational fluid dynamics (CFD)
calculation. Typical grid sizes for problems run recently at NASA's Numerical Aerodynamics
Simulation Center are between several hundred thousand and a few tens of millions of nodes.
The ratio of the longest grid cell edge to the shortest edge in typical aeronautical fluid dy-
namics calculations ranges between one thousand and one million. If the entire volume is
sampled at a uniform density, determined by the sampling requirements of the smallest grid
cell, the data set size is multiplied by several thousand or million, not just eight. This regular
grid may not fit even on a workstation disk, let alone in main memory. The appropriate
response to this difficulty would seem to be a multiresolution representation. A straightfor-
ward multiresolution representation using axis aligned samples at integral multiple step sizes
might get back to the eight-fold increase. But rendering this multiresolution structure will
not be as fast as rendering a regular grid.
The theoretical difficulties arise in dealing with the external boundaries of the volume to be
resampled, or with cell boundaries where there may be discontinuities in the data values.
Computational scientists choose curvilinear and unstructured grids not only so they can
capture features of varying size at different locations in the field, but also because these grids
can capture the unique shape of the volumes over which the computations are performed.
Aircraft fuselages and engine combustion chambers, to give two examples, are extremely
complex shapes. The boundaries of the computational grids are designed to provide a good
polygonal approximation to these shapes, often using a great many very small cells on
these boundaries. Resampling using only axis aligned cells, even with multiple resolutions,
inevitably either misses some of the volume of interest or places regular grid nodes outside
the original input volume. Missing some of the volume is unacceptable, particularly since
the regions near these boundaries are usually the most interesting part of the flow.
Cells with some points inside the aircraft body suffer another; even more unpleasant diffi-
culty; the field being approximated is discontinuous at the aircraft boundary, that is, there
is no flow inside the wing, filselage or turbine blade. This discontinuity translates into a
2O

Nyquistrequirementfor an infinitely (lensesamplein the neighborhood of this boundary. In
structural modeling, similar discontinuities may exist, between interior cells, for example atan interface between two different materials.
There is one more argument used to support the possibility of regular resa.mpling of this
data. This argument is that a digital image is a regularly sampled grid of the influence of
tile data set, so it must be possible to limit sampling by what is visible. This statement
is true, as far as it goes. However to reap the benefits of a regular grid, (he conversion
via resampling must be clone only once, or at least very infrequently; it is tile resampling
involved in creating the image that takes so long and drives us to consider converting to a
regular grid. Changes in the viewing direction or distance force resampling, invalidating the
benefits one might have expected.
APPENDIX B
Volume rendering systems are based on a theoretieM optical model for light interacting with
a volume density or cloud. This appendix gives an example of how an incomplete description
of the underlying optical model can result in an ambiguity in the genera(ion specification for
a volume rendered image. The model used for illustration is (he absorption plus emission
model [41, 75]; every point in the volume density both absorbs light and also emits light
(glows). We will assume monochromatic light; however, the example generalizes to colored
light. The different.tel equation for the light intensity along a ray lowards the eye through
the volume density is:
= ,q(s)ds- r(s)r(s),ts
where s is a length parameter along the ray and Its) is the light intensity at s. The extinct.ion
coefficient r(s) is a function of position in the volume density and is usually assigned by a
transfer hmction based on the scalar field f(s) being visualized. In the limit as ds tends to
zero, r(s)ds is the fraction of light coming from behind s that is occluded or absorbed a(
s. \Vhen a point s in (he cloud is to(ally transparent, r(s) = 0; when it. is lot, ally opaque,
7-is) = co. The term .q(s) is the source or glow lerm; it has tile meaning that in the limit, as
ds tends to zero, g(s)ds is the intensity of light emitted at s.
AI this point i( might seem that the model is completely specified. However, there are at
least two ways to treat, the glow term g(s). Wilhelms and Van Gelder [71] treat g(s) as
a physical property of each point, in the cloud. Wherea.% Williams and Max [75] consider
g(s) = t_(s)_'(s), where the chromaticity t@s) is a physical properly of each point in the
cloud. They rationalize thai if a point in the cloud has zero extinction coefficient, then it.
should also have zero glow energy. In the former case, the color transfer hmction specifies
.q(s), whereas in the latter case i( specifies s:(s). (Porter and Duff [46] allude to this difference
in their discussion of premultiplying color by opacity in the context of subpixel accumulation
and in their description of an opaque operator for dealing with luminescent objects which
21

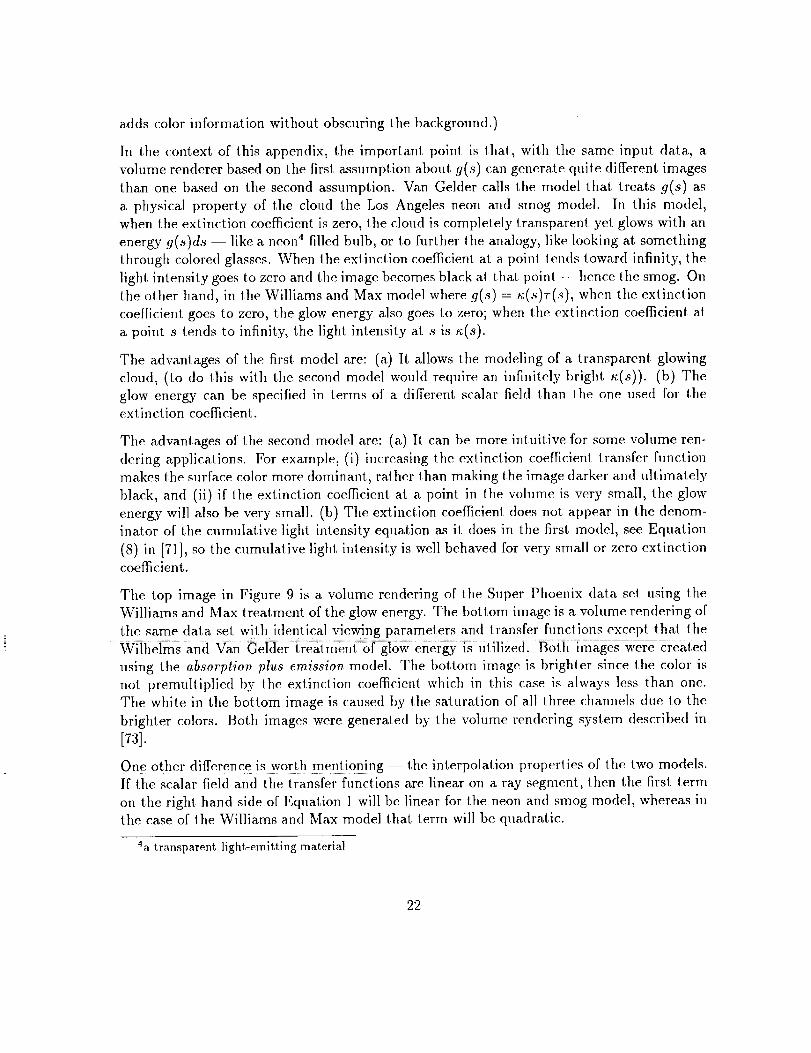
addscolorinformationwithout obscuringtile background.)
In the contextof this appendix,t.heimportant point,is thal, with the sameinput data, avolumerendererbasedon thefirst assumptionaboutg(s) can generate quite different images
than one based on the second assumption. Van Gelder calls the model that treats g(s) as
a physical property of the cloud tile Los Angeles neon and smog model. In this model,
when the extinction coefficient: is zero, the cloud is comp]el.ely transparent yet glows with an
energy g(s)d.s -- like a neon 4 filled bulb, or to further the analogy, like looking at something
throngh colored glasses. When the extinction coefficient at a poinl lends toward infinity, the
light intensity goes to zero and the image becomes black at thai point -- hence the smog. On
t.he other hand, in the Williams and Max model where .q(s) = _(s)r(.s), when the extinction
coefficient goes to zero, the glow energy also goes to zero; when the extinction coefficient, at
a point s tends to infinity, the light, intensity at s is s(s).
Tile advantages of the first model are: (a) It allows the modeling of a transparent glowing
cloud, (to do this with the second model would require an infinitely bright g(s)). (b) The
glow energy can be specified in t.erms of a different, scalar fie](t lhan the one used for theextinction coefficient.
The advant.ages of ihe second model are: (a) It can be more intuitive for some volume ren-
tiering applications. For example: (i) increasing lhe extinction coefficien! transfer flmction
makes the surface color more dominant, rather than making the image darker and ultimalely
black, and (it) if the extinction coefficient at a point in the volume is very small, the glow
energy will also be very small. (b) The extinction coefficient, does not appear in the denom-
inator of the cumulative light intensity equation as it does in the first model, see Equation
(8) in [71], so the cumulative light intensity is well behaved for very small or zero extinctioncoefficient..
The top image in Figure 9 is a volume rendering of the Super Phoenix data set using the
Williams and Max treatment of tile glow energy. The bottom image is a volume rendering of
the same data set and transfer functions except thai, the\Vliiielms and van Geiiier glow energy is UtiliZed. 'B01i_ _{mages were crealed
using the absorption plus emission model. The bottom image is brighter since the color is
not premulliplied by the extinction coefficient which in this case is always less than one.
Tile white in the bottom image is caused by the saturation of all three channels due to tile
brighter colors. Both images were generated by the volume rendering system described in
[r3].
One other difference is, worth mentionin:: g-- the interpolation properlies of the two models.If the scalar field and the transfer functions are linear on a ray segment, lhen the first lerm
on the right hand side of Equation 1 will be linear for tile neon and smog model, whereas inthe case of tim Williams and Max model that term will be quadratic.
4a transparent light-emitting material
22

Whenimagesfrom volumerenderingsystemsbasedon eachof theseversionsof the sametheoreticMoptical modalwerefirs[;comparedside-by-side,therewassomeinitial confusion.Theimageswerequitedifferent,yet it wasthoughtthat theunder]ylngmodelswereequiva-lent. Thelessonwasclear. It is importantto clearlyunderstandall aspectsandimplicationsof the optical modelon whichavolumerendereris ba.sed.
References
[1] D. H. Ballard and C. M. Brown, "Computer Vision," Prentice-Hall, 1982.
[2] H. H. Barrett, "Objective Assessment of Image Quality: Effects of Quantum Noise and
Object Variability," J. Optical Soc of Amer, vol. 7, no. 7, pp. 1266-1278, July 1990.
[3] H. H. Barrelt, J. Yao, J. P. Rolland and K. J. Myers, "Model Observers for Assessment
of Image Quality," Proc. Natl. Aead. Sci., vol. 90, pp. 9758-9765, Nov. 1993.
[4] J. Bertin, "Semiology of Graphics," 1967, reprinted by University of Wisconsin Press,
Madison, WI, 1983.
[5] J. Challinger, "Parallel Volume Rendering for Curvilinem" Volumes," Proc. Scalable High
Performance Computing Conference, April 1992.
[6] R. T. Chin and C.-L. _t_h, "Quantitative Evaluation of Some Edge Preserving Noise
Smoothing Filters," Computer Vision, Graphics, and Image Processing, no 23, 1983.
[7] R. L. Cook, "Stochastic Sampling in Computer Graphics," A CM Trans. Computer
Graphics, vol. 5, no. I, pp. 51-72, Jan. 1986.
[8] R. A. Drebin, L. Carpenter and P. Hanrahan, "Volume Rendering," Computer Graphics,
vol. 22, no. 4, pp. 65-74, Aug. 1988.
[9] F. D. Fracchia, R. D. Kriz, B. Mones-Hattal, L. Jorgenson, B. Rogowilz, "Panel: Is
Visualizalion Struggling under the Myth of Objectivity?" Proc. l.%ualizalion '95, pp.
412-4415, Oct. 1995.
[10] H. Fuchs, M.S. Levoy, and S. Pizer, "Interactive Visualization of 3D Medical Data,"
Compuler pp. 46-50, Aug. 1989.
[11] R. Gallagher and J. Nagtegaal, "An Efticient 3D Visualization Technique for FiniteElement Models and Other Coarse Volumes," Computer Graphics, vol. 23, no. 3, pp.
185-192, July 1989.
[12] M. P. Garrity, "Raytracing Irregular Volume Data," Compuler Graphics, vol. 24, no. 5,
pp. 35-40, Dec. 1990.
23

[13] C. Giertsen,"VolumeVisualizationof SparseIrregularMeshes,"Computer Graphics,
vol. 12, no. 2, pp. 40-48, Mar. 1992.
[14] C. Giertsen, "Creative Parameter Selection for V'olume Visua.lizaiion," Jrn. |._sualiza-
lion and Comput. Anita., vol. 3, pp. 1-11, 1992.
[15] C. Giertsen and A. Tuchman, "Fast Volume Rendering with Embedded Geome(ric
Primitives," l/_sual Computing - lnlegrating Computer Graphics with Computer Vision,
T.L.Kunii (ed), Springer Verlag, pp. 253-271, 1992.
[16] C. Giertsen, "Direct Volume Rendering of Multiple Scalar Fields," Jrn. Visualizalionand Compul. Anita., vol. 5, pp. 69-84, 1994.
[17] A. S. Glassner, "Principles of Digital Image Synthesis, _ Volume 1, Morgan Kaufmann
Publishers, 1995.
[18] W. Glenn, "Digital Image Compression Based on Visual Perception and Scene Proper-
ties," SMPTE Journal, pp. 392-397_ May 1993.
[19] A. Globus and S. Usel(on, "Evaluation of Visualization Software," Computer Graphics,
vol. 29, no. 2, pp 41-44, May 1995.
[20] A. Globus and E. Raible, "Fourteen Ways to Say Nothing with Scientific Visualization,"
IEEE Computer, vol 27, no. 7, pp. 86-88, July 1994.
[21] R. C. Gonzalez and R. E. Woods, "Digital Image Processing_" Addison-\g>sley, 1992.
[22] D. J. Granrath, "The Role of Human Visual Models in Image Processing," Proc. of
IEER, vol. 69, no. 5, pp 552-561, May 1981.
[23] N. Greene and M. Kass "Error-Bounded Antialiased Rendering of Complex Environ-
ments," Proc. Siggraph 9_, Orlando, pp. 59-66, July 1994.
[24] C. Hall and E. HM], "A Nonlinear Model for the Spatial Characteristics of the Human
Visual System," IEEE Trans. on Systems, Man, and Cybernetics, vol. SMC-7, no. 3,
pp. 161-170, Mar. 1977.
[25] P. Ha.nrahan, "Three-Pass Af[ine Transform for Volume Rendering," Computer Graph-
ics, vo1.24, no. 5, pp.71-78, Nov. 1990.
[26] B. K. P. Horn, "Robot Vision," MIT Press, 1986.
[27] A. Kaufman, D. Cohen, and R. Ya.gel_ "Volume Graphics," Compuler, vol.26, no.7, pp.
51-64, July 1993.
[28] K. Koyamada, "Volume Visualization for the Unstructured Dala," SPIE Vol. 1259
Extracting Meaning from Complex Data: Processing, Display, Interaction, 1990.
24

[29]
[3o]
[31]
[32]
[33]
[34]
P. Lacroute and M. Levoy, "Fast Volume Rendering Using a Shear-Warp Factorization
of the Viewing Transformation," Computer Graphics, vol. 28, no. 4, pp. 451-458, Aug.1994.
D. Laur and P. Hanrahan, "Hierarchical Splatting: A Progressive Refinement Algorithm
for Volume Rendering," ACM SIGGRAPH Comput. Gr., vol. 25, no. 4, pp. 285-288,
July 1991.
M. E. Lee and R. A. Redner, "A Note on the Use of Nonlinear Filtering in Computer
* 'CS "Gra,phl .., IEEE Computer Graphics _J Applications, vol 10, no. 5, pp. 23-29, May
1990.
C. Lee, Regular Triangulations of Convex Polytopes. Applied Geometry and Discrete
Mathematics: The Victor KIee Feslschrift P. Gritzma.nn and B. Slurmfels, e(ts. Amer
Math. Soc., Providence, RI, 1991.
M. Levoy, "A Hybrid Ray Tracer for Rendering Polygon and Volume Data," [ERE
Computer Graphics and Applications, ppp. 33-40, Mar. 1990.
M. Levoy, "Efficient Ray Tracing of Volume Data," ACM Trans on Graphics, vol. 9, no.
3, pp. 245-261, July 1990.
[35] B. A. Lucas, "A Scientific Visualization Renderer," Proc. Visualization '92, Boston, pp.
227-234, Oct. 1992.
[36] Mannos and Sakrison, "The Effects of a Vision Fidelity Criterion on tile Encoding of
I es "mag .,, IEEE Trans. Information Theory. vo]. 20, pp. 525-536, July 1974.
[37] X. Mao, L. Hong and A. Kaufman, "Splatting of Curvilinear Volumes," Proc. Visual-
ization '95, pp. 61-68, Oct. 1995.
[38] S. R. Marschner and R. J. Lobb, "An Evaluation of Reconstruction Filters for Volumee ° "Rend .ring, Proe. 1994 Symposi_m on Vohtme Visualization, Wa_sIi{ng{on, DC, pp.
100-107, Oct. 1994.
[39] G. A. Mastin, "Adaptive Filters for Digital Image Noise Smoothing: An Evaluation,"
Computer Vision, Graphics, and Image Processing, vol. 31, no. 1, pp 103'i21, July,
1985.
[4o]
[41]
N. Max, P. Hanrahan and R. Crawfis, "Area and Volume Coherence ['or Efl3cient Visu-
alization of 3D Scalar Functions," Computer Graphics, vol. 24, no. 5, pp. 27-33, Dec.
1990.
N. Max, "Optical Models for Direct Volume Rendering," IEEE Trans. on Visualization
and Computer Graphics, vol' 1, no. 2, pp. 99-108, June 1995.
25

!Z i
[42]
[43]
[44]
[45]
[46]
[47]
[48]
[49]
R. Nathan, "Spatial Frequency Filtering," in Picture Processing and Psychopictorics,
B. S. Lipkin and A. Rosenfeld, eds., Academic Press, New }%rk, pp. 151-164, 1970.
U. Neumann, "Volume Reconstruction and Parallel Rendering Algorithms: A Compar-
ative Analysis," PhD thesis, University" of North Carolina at, Chapel Hill, 1993.
G. Nielson, T. Foley, B. Hamann and D. Lane, "Visualizing and Modeling Scattered
Multivariate Data," Compu, ter Graphics, vol. 11, 11o. 3, pp. 47-55, May-, 1991.
N. B. Nill, "A Visual Model Weighted Cosine Transform for Image Compression and
Quality Assessment,"' IEEE Trans. Communications, vol. com-33, no. 6, pp. 551-557,June 1985.
T. Porter and T. Duff, "Compositing Digital Images," Computer Graphics, vol. 18, no.
4, pp 253-260, July 1984.
C. Poynton. "Gamma and It's Disguises: The Nonlinear Mappings of Intensity in Per-
ception, CRTs, Film and Video," SMPTEJournal, pp. 1099-1108, Dec. 1993.
W. K. Pratt, "Digital Image Processing," John Wiley & Sons, 2nd ed., 1991.
B. E. Rogowitz and L. A. Treinish, "An Archilecture for PerceptuM Rule-based Visu-
alization," Proc. I.%ualizalion '93, pp. 236 243, Ocl. 1993.
[50] D. Ruprecht and H. Muller, "Image Warping with Scattered Data Interpolation," Com-
puter Graphics, vol. 15, no. 2, pp. 37-43, Mar. 1995.
[51] H. Rushmeier, M. Botts, S. Uselton, J. Walton, H. Watkins and D. Watson, "Panel:Metrics and Benchmarks for Visualization," Proc. Visualization '95, pp. 422-426, Oct,.
1995.
[52]
[53]
[54]
[55]
[56]
P. Sabella, "A Rendering Algorithm for Visualizing 3D Scalar Fiehts," Computer Graph-
its, vol. 22, no. 4, pp. 51-58, Aug. 1988.
Saghri, Cheatham, and Habbi, "Image quality measure based on a human visual system
model," Optical Engineering, vol. 28, no. 7, pp. 813-818, July 1989.
H. R. Shapiro and R. A. Silverman, "Alias-free Sampling of Random Noise," Journal
Soc. Ind. and Applied Math., vol. 8, no. 2, pp. 225-248, 1960.
P. Shirley and A. Tuchman, "A Polygonal Approximation to Direct Scalar Volume
Rendering," Computer Graphics, vol. 24, no. 5, pp. 63-70, Dec. 1990.
H. Snyder. Image Quality: Measures and Visual Performance. in Fiat-Panel Displays
and CRT's, L. E. Tannas, ed., Van Nos Reinhoht, 1984.
26


[57] C. S(ein,B. BackerandN. Max, "SortingandHa,rdwareAssistedRenderingforVolumeVisualizalion," Proc. 199_ Symposivm on Volume l,_sTlalization, Washington, DC, pp.
83-90, Oct. 1994.
[58] P. C. Teo and D. J. Heeger, "Perceptual Image Distortion," Proc. First lnlernational
Con.[. on Image Processing: Austin, pp. 982-986, Nov. 1994.
[59] T. Totsuka and M. Levoy, "Frequency Domain Volume Rendering," Computer Graphics,
pp. 271-278, 1993.
[60] E. R. Tuf(e, "Tile Visual Display of Quantitative Information," Graphics Press, 1983.
[61] E. R. Tufte, "Envisioning Information," Graphics Press, 1990.
[62] C. Upson and M. Keeler, "V-BUFFER: Visible Volume Rendering," Computer Graphics,
vol. 22, no. 4, pp. 59-64, July 1988.
[63] S. P. Uselton, G. Dorn, C. Farhat, M. Vannier, K. Esbenson and A. Globus, "Valida-
(ion, Verification and Evaluation of Visualization Software," Proc. Visualization '9_,
Washington, DC, pp. 414-418, Oct. 1994.
[64] S. P. Usel(on, "Volume Rendering on Curvillnear Grids for CFD," A IA A 94-03_2, A IA A
3_?nd Aerospace Sciences Meeting Reno, Nev., Jan. 1994.
[65] A. Van Gelder and J. WHhelms, "Rapid Exploration of Curvilinear Grids Using Direct
Volume Rendering," Proc. 1.5'svalizalion '93, pp. 70-77, Oc(. 1993.
[66] P. P. Walatka, J. Clucas, R. K. McCabe, T. Plessel and [I. Potter, "FAST User Guide,"Tech. Report RND-93-OlO, NASA Ames Research Center, July I993.
[67] L. \¥estover, "Interactive Volume Rendering," Proc. 1989 14"%rkshop Vohlme I._sualiza-
lion, Chapel Hill, pp. 9-16, May 1989.
[68] J. Wilhelms, J. Challlnger, N. Alper, S. Ramamoorthy and A. Vaziri, "Direct Volume
Rendering of Curvilinear Volumes," Computer Graphics, vol. 24, no.5, pp. 41-47, Dec.1990.
[69] J. Wilhelms, "Pursuing Interactive Visualization of Irregular Grids,", The Visual Com-
puler, vol. 9, pp. 450-458, 1993.
[70] J. Wilhelms and A. van Gelder, "Multi-Dimensional Trees for Controlled Vohlme Ren-
dering and Compression," Proc. 199_ Symposi_,rn on Volume I._sualization, Wa.shington,
DC, pp. 27-34, Oct 1994.
[71] J. Wilhelms and A. van Gelder, "A Coherent Projec(ion Approach for Direct Vohnne
Rendering," Computer Graphics, vol. 25, no. 4, pp. 275-284, July 1991.
27

[72] D. R. Williams and R. Collier, "Consequencesof SpatialSamplingby a HumanPho-toreceptorMosaic,"Science, vol. 221, pp. 385-387, July 22, 1983.
[73] P. L. Williams, N. Max and C. Stein, "A High Accuracy Volume Rendering System for
Unslructured Dala," manuscript, Jan. 1996.
[74] P. L. Williams, "Interactive Splatting of Nonrectilinear Volumes," Proc. I.%ualizalion' 099_,, Boston, pp. 37-44, Oct. 1992.
[75] P. L. Williams and N. A. Max, "A Volume Densily Optical Model," Proc. I992 Work-
shop Volume Visualization, Boston, pp. 61-68, Oct. 1992.
[76] C. M. Wittenbrink, A. T. Pang and S. Lodha, "Verity Visualization: Visual Mappings,"
Ted, Report UCSC-CRL-95-48, University of Calif., Santa Cruz, 1995.
[77] R. Yagel, "Realislic Display of Volumes," SPIE Proc. Medical [magin 9 V[: Image Cap-
lure, FormaUing, and Display. vol. 1653, pp. 470-476, Feb. 1991.
[78] R. Yagel, D. S. Ebert, J. N. Scott and Y. Kurzion, "Grouping Volume Renderers for En-
hanced Visualization in Computational Fluid Dynamics," [EEE Trans. on Vis_talizalion
and Computer Graphics, vol. 1, no. 2, pp. 117-132, June 1995.
The figures for this paper can be found at
http: / / www. nas. nasa.gov/N AS / WechRep or t s /
N A Sreport s/N A S- 96-021/N A S- 96- 021 .html
28