foundations, endowments, and investments presented by barry n. berlin, cfa managing director
TRANSCRIPT

Foundations, Endowments, and Investments
Presented by
Barry N. Berlin, CFA Managing Director
2
Topics
1. Fiduciary Duty and Investments
2. Defining the Relationship – the IPS
3. Diversification, Asset Allocation, and Forecasting
4. Selecting Advisors and Managers
5. Evaluating Investments
6. Investing in Today’s Environment
3
Fiduciary Duty and Investments
Fiduciary Duty is defined by GA Code, Section 44-15 – the Uniform Prudent Management of Institutional Funds Act.
4
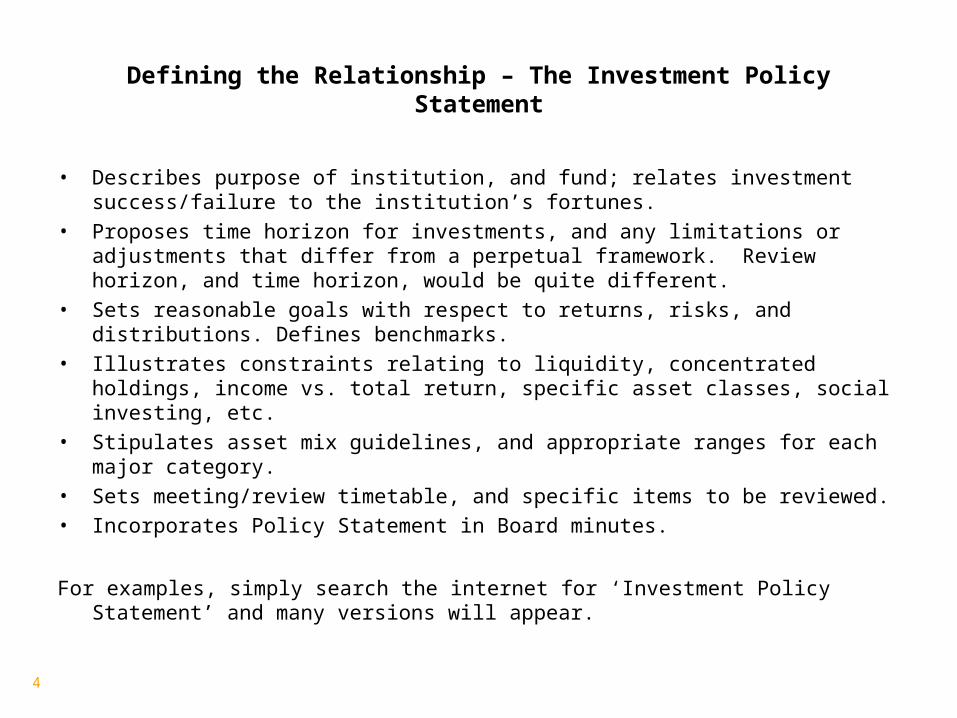
Defining the Relationship – The Investment Policy Statement
• Describes purpose of institution, and fund; relates investment success/failure to the institution’s fortunes.
• Proposes time horizon for investments, and any limitations or adjustments that differ from a perpetual framework. Review horizon, and time horizon, would be quite different.
• Sets reasonable goals with respect to returns, risks, and distributions. Defines benchmarks.• Illustrates constraints relating to liquidity, concentrated holdings, income vs. total return,
specific asset classes, social investing, etc.• Stipulates asset mix guidelines, and appropriate ranges for each major category.• Sets meeting/review timetable, and specific items to be reviewed.• Incorporates Policy Statement in Board minutes.
For examples, simply search the internet for ‘Investment Policy Statement’ and many versions will appear.

5
Diversified or Confused by Forecasts?
6
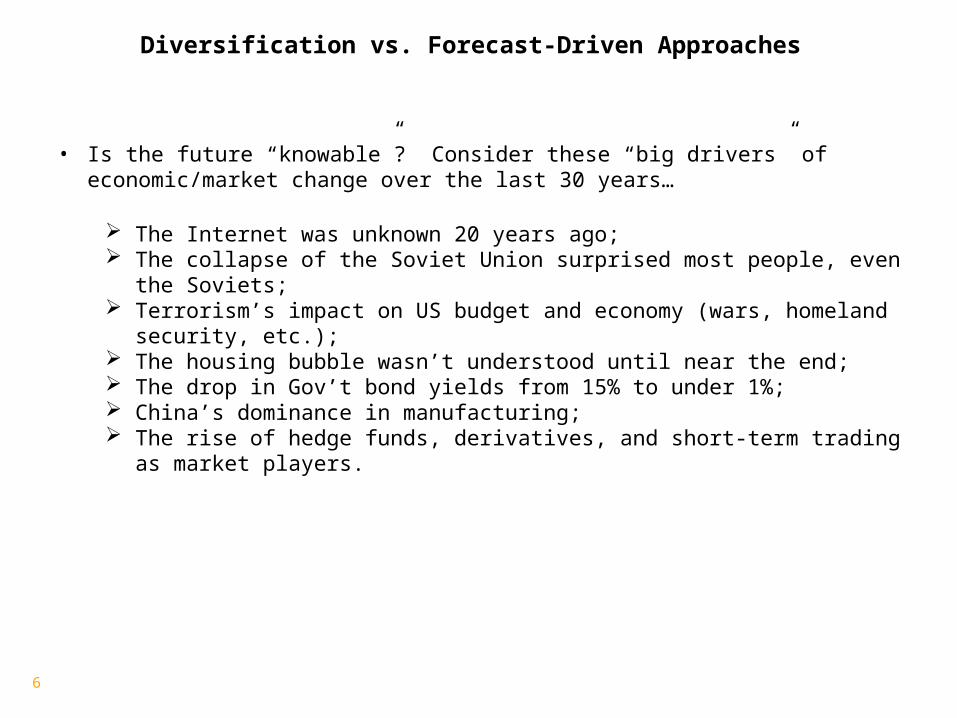
Diversification vs. Forecast-Driven Approaches
• Is the future “knowable”? Consider these “big drivers” of economic/market change over the last 30 years…
The Internet was unknown 20 years ago; The collapse of the Soviet Union surprised most people, even the Soviets; Terrorism’s impact on US budget and economy (wars, homeland security, etc.); The housing bubble wasn’t understood until near the end; The drop in Gov’t bond yields from 15% to under 1%; China’s dominance in manufacturing; The rise of hedge funds, derivatives, and short-term trading as market players.
7
What are the odds of consistently forecasting market turns correctly?
8
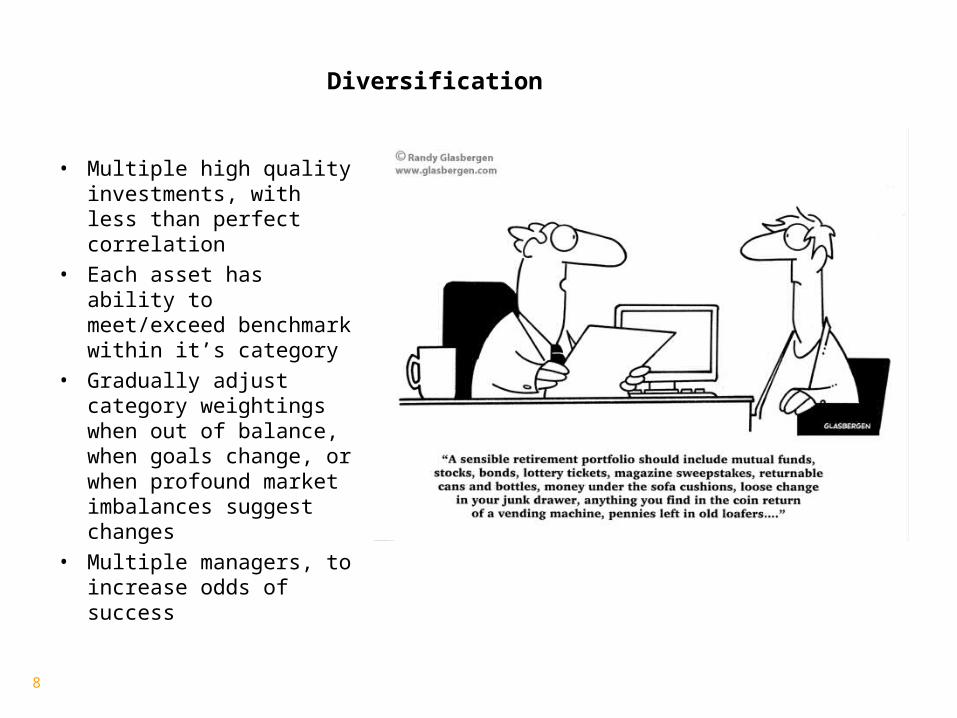
Diversification
• Multiple high quality investments, with less than perfect correlation
• Each asset has ability to meet/exceed benchmark within it’s category
• Gradually adjust category weightings when out of balance, when goals change, or when profound market imbalances suggest changes
• Multiple managers, to increase odds of success

9 For Public Use
The Case for Multi-Asset Class Investing:Annual Returns for Various Asset Classes
No single asset class exhibits the best performance consistently. However, a diversified approach balances out over the yearly returns.
Bar Agg is the Barclays Capital U.S. Aggregate Bond Index, which includes U.S. government, corporate, and mortgage-backed securities with maturities up to 30 years. The MSCI World Index is a free float-adjusted market capitalization weighted index that is designed to measure the equity market performance of developed markets. MSCI EAFE Index (Europe, Australasia, Far East) is a free float-adjusted market capitalization index designed to developed-market equity performance, excluding the U.S. & Canada. MSCI Emerging Markets Index is a free float-adjusted market capitalization index that is designed to measure equity market performance in the global emerging markets. Russell 1000 Value Index measures the performance of those Russell 1000 companies with lower price-to-book ratios and lower forecasted growth values. Russell 1000 Growth Index measures the performance of those Russell 1000 companies with higher price-to-book rations and higher forecasted growth values. Russell 2000 Index measures the performance of the 2,000 smallest companies in the Russell 3000 index. Russell 2000 Growth Index measures the performance of those Russell 2000 companies with higher price-to-book ratios and higher forecasted growth values. Russell 2000 Value Index measures the performance of those Russell 2000 companies with lower price-to-book ratios and lower forecasted growth values. Russell Midcap Index measures the performance of the 800 smallest companies in the Russell 1000 Index. S&P 500 Index, a market-value weighted index, consists of 500 U.S. stocks chosen for market size, liquidity, and industry group representation. Past performance does not guarantee comparable future results. Returns reflect reinvested distributions. Numbers displayed in NAVY represent the variance between the best and worst performance. Source: Lazard, StyleADVISOR, Atlantic Trust. As of 06/30/11.
2Q11
15% 43% 19% 47% 64% 68% 53% 35% 41% 52% 22% 32% 28% 49% 58% 73% 23% 8%
1994 1995 1996 1997 1998 1999 2000 2001 2002 2003 2004 2005 2006 2007 2008 2009 2010 2011 YTD
MSCI EAFE7.8%
R1000V38.4%
R1000G23.1%
R1000V35.2%
R1000G38.7%
MSCI EM66.4%
R2000V22.8%
R2000V14.0%
Bar Agg10.3%
MSCI EM56.3%
MSCI EM26.0%
MSCI EM34.5%
MSCI EM32.6%
MSCI EM39.2%%
Bar Agg5.2%
MSCI EM78.5%
R2000G29.1%
R2000G8.6%
MSCI Wrld5.1%
S&P 50037.6%
S&P 50023.0%
S&P 50035.2%
S&P 50028.6%
R2000G43.1%
Bar Agg11.6%
Bar Agg8.4%
MSCI EM-6.0%
R2000G48.5%
R2000V22.3%
MSCI EAFE13.5%
MSCI EAFE26.3%
R1000G11.8%
R2000V-28.9%
RMIDCAP40.5
R200026.9%
RMIDCAP8.1%
R1000G2.6%
R1000G37.2%
R1000V21.6%
R2000V31.8%
MSCI Wrld24.3%
R1000G33.2%
RMIDCAP8.3%
R20002.5%
R2000V-11.4%
R200047.3%
MSCI EAFE20.3%
RMIDCAP12.7%
R2000V23.5%
MSCI EAFE11.8%
R2000-33.7%
R1000G37.2%
RMIDCAP25.5%
R1000G6.8%
S&P 5001.3%
RMIDCAP34.5%
R2000V21.4%
R1000G30.5%
MSCI EAFE20.0%
MSCI EAFE30.0%
R1000V7.0%
MSCI EM-2.4%
R1000V-15.5%
R2000V46.0%
RMIDCAP20.2%
MSCI Wrld9.6%
R1000V22.3%
MSCI Wrld9.0%
R1000V-36.8%
R2000G34.5%
R2000V24.5%
R20006.2%
R2000V-1.5%
R2000G31.0%
RMIDCAP19.0%
RMIDCAP29.0%
R1000V15.6%
MSCI Wrld24.7%
R2000-3.0%
R1000V-5.6%
MSCI EAFE-15.9%
RMIDCAP40.0%
R200018.3%
R1000V7.1%
MSCI Wrld19.9%
R2000G7.1%
S&P 500-36.8%
MSCI EAFE31.8%
MSCI EM59.9%
S&P 5006.0%
R2000-1.8%
R200028.5%
R200022.4%
R200022.4%
RMIDCAP10.1%
R200021.3%
S&P 500-9.1%
RMIDCAP-5.6%
RMIDCAP-16.2%
MSCI EAFE38.6%
R1000V16.5%
R1000G5.3%
R200018.4%
Bar Agg7.0%
R1000G-38.4%
MSCI Wrld30.0%
R1000G16.7%
R1000V5.9%
R1000V-2.0%
R2000V25.8%
MSCI Wrld13.5%
MSCI Wrld15.8%
Bar Agg8.7%
S&P 50021.0%
MSCI Wrld-13.1%
R2000G-9.2%
MSCI Wrld-19.9%
MSCI Wrld33.1%
MSCI Wrld14.7%
S&P 5004.9%
S&P 50015.8%
RMIDCAP5.7%
R2000G-38.5%
R200027.2%
R1000V15.5%
MSCI Wrld5.3%
RMIDCAP-2.1%
MSCI Wrld20.7%
R2000G11.3%
R2000G13.0%
R2000G1.2%
RMIDCAP18.2%
MSCI EAFE-14.2%
S&P 500-11.9%
R2000-20.2%
R1000V30.0%
R2000G14.3%
R2000V4.7%
RMIDCAP15.3%
S&P 5005.5%
RMIDCAP-41.4%
S&P 50026.5%
S&P 50015.1%
MSCI EAFE5.0%
R2000G-2.4%Bar Agg18.5%
MSCI EAFE6.1%
Bar Agg9.7%
R2000-2.6%
R1000V7.4%
R1000G-22.4%
MSCI Wrld-16.8%
S&P 500-22.1%
R1000G29.8%
S&P 50010.9%
R20004.6%
R2000G13.4%
R1000V-0.2%
MSCI Wrld-40.6%
R2000V20.6%
MSCI Wrld11.8%
R2000V3.8%
Bar Agg-2.9%
MSCI EAFE11.2%
MSCI EM6.0%
MSCI EAFE1.8%
R2000V-6.5%
Bar Agg-0.8%
R2000G-22.4%
R1000G-20.4%
R1000G-27.9%
S&P 50028.7%
R1000G6.3%
R2000G4.2%
R1000G9.1%
R2000-1.6%
MSCI EAFE-43.3%
R1000V19.7%
MSCI EAFE7.8%
Bar Agg2.7%
MSCI EM-7.3%
MSCI EM-5.2%
Bar Agg3.6%
MSCI EM-11.6%
MSCI EM-25.3%
R2000V-1.5%
MSCI EM-30.6%
MSCI EAFE-21.4%
R2000G-30.3%
Bar Agg4.1%
Bar Agg4.3%
Bar Agg2.4%
Bar Agg4.3%
R2000V-9.8%
MSCI EM-53.2%
Bar Agg5.9%
Bar Agg6.5%
MSCI EM0.9%
Best
Worst

10
Correlations

11 Multi-Manager Investment Program - OverviewFor Public Use 08/11
Access Across Asset Classes
Fixed
Income
Cash Management
High-Quality Municipal
Bonds
High-Quality
Taxable Bonds
Non-Directional
Hedge Funds
Hedge Fund-of-Funds
Multi-Strategy
Non-Directional Equity
Non-Directional Credit
Non-U.S. Equity
Directional Hedge Funds
Developed
International
Emerging Markets
Private
Equity
Venture Capital
Leveraged Buyouts
Special Situation
Funds
Fund-of-Funds
Lower Risk / Lower Potential Return
Higher Risk / Higher Potential Return
U.S. Equity
Real Estate
This is a generalization of asset classes. Many of the sub-asset classes would appear in different positions on the risk/reward chart. *As of June 30, 2011.
Private Real Estate
Partnerships
Large Cap Growth
Large Cap Value
Mid Cap Growth
Mid Cap Value
Small Cap Growth
Small Cap Core
Small Cap Value
Directional Equity
Directional Credit
12
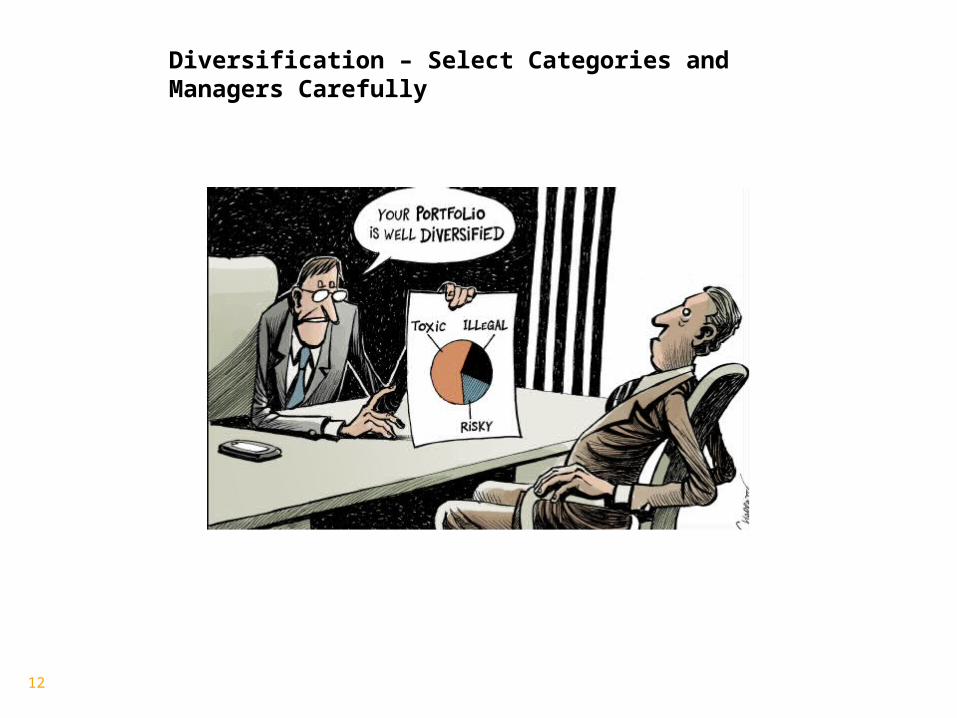
Diversification – Select Categories and Managers Carefully
13
Selecting Advisors – Some Key Questions
1. Is your investment platform in-house, out-sourced, or a blend? What incentives, if any, exist to predispose recommendations towards in-house, vs. outside, programs?
2. Fee layering is an ongoing issue in the wealth management arena. Distinguish between fees paid directly by XYZ to your firm, and other fees to be absorbed by XYZ. In what instances will XYZ experience layered fees?
3. Will your firm receive income of any kind from outside money managers or vendors you use or recommend? These types of fees include but are not limited to 12b-1 fees, rebates and soft dollars. Describe in detail.
14
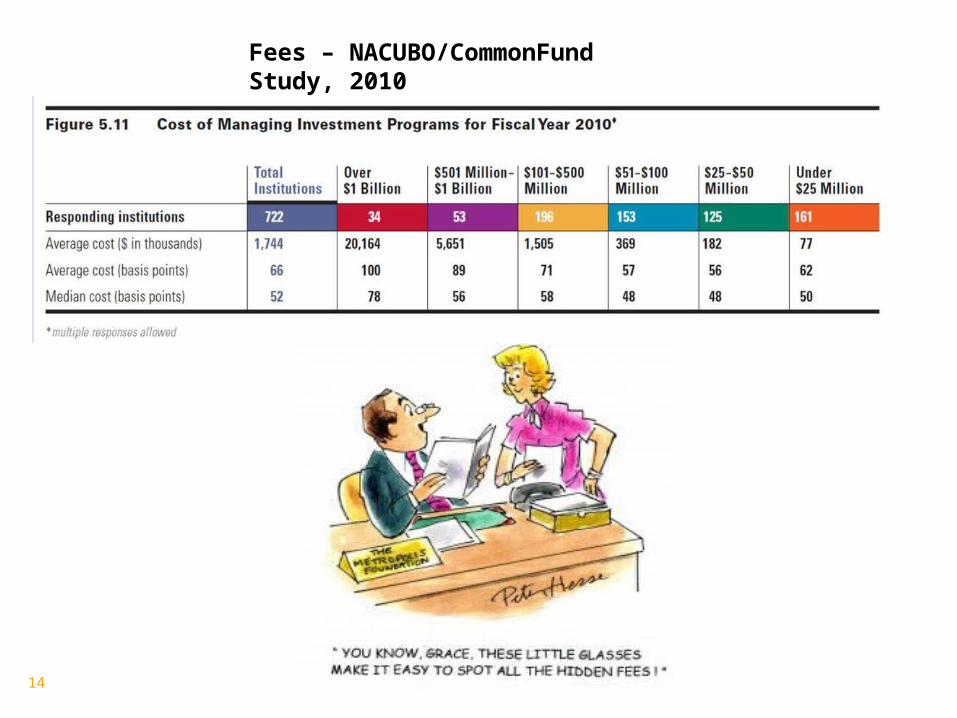
Fees – NACUBO/CommonFund Study, 2010
15
4. Do you use a captive broker/dealer to execute client trades? Do any of your outside managers trade through this broker-dealer, generating commissions of any kind for your firm? If the XYZ account trades securities, will trades route through your captive broker/dealer? Will you make money on the bid/ask spread of any stocks, bonds, or other instruments that your firm recommends and/or implements?
5. What is the total fee for the money market fund where our cash reserves will be held? Who earns the fee?
6. When representing investment performance, do your statistics include all accounts of a similar description, including those that have since left your firm? Are your statistics “actual”, or is some of the historical data pro forma, representing a back-test of recommended managers that weren’t in use at the time?

16
7. Describe the team supporting the XYZ relationship. What are the professional credentials of each participant? Please describe all past and current regulatory, legal, or ethics actions raised against any of these team members.
8. Do you provide customized reports detailing performance and other important items? How often? Please provide examples.
9. What practices does your firm engage to ensure consistency among clients?
10. Describe your regulatory framework, and audit practices. Which CPA firm audits your books?
11. Where will XYZ’s investment be held in custody? Can assets be verified independently?
17
Evaluating Investments
18 For Qualified Existing Fund Investor Use Only 8551 7/11 | XYZ Hedge Fund
Portfolio Management
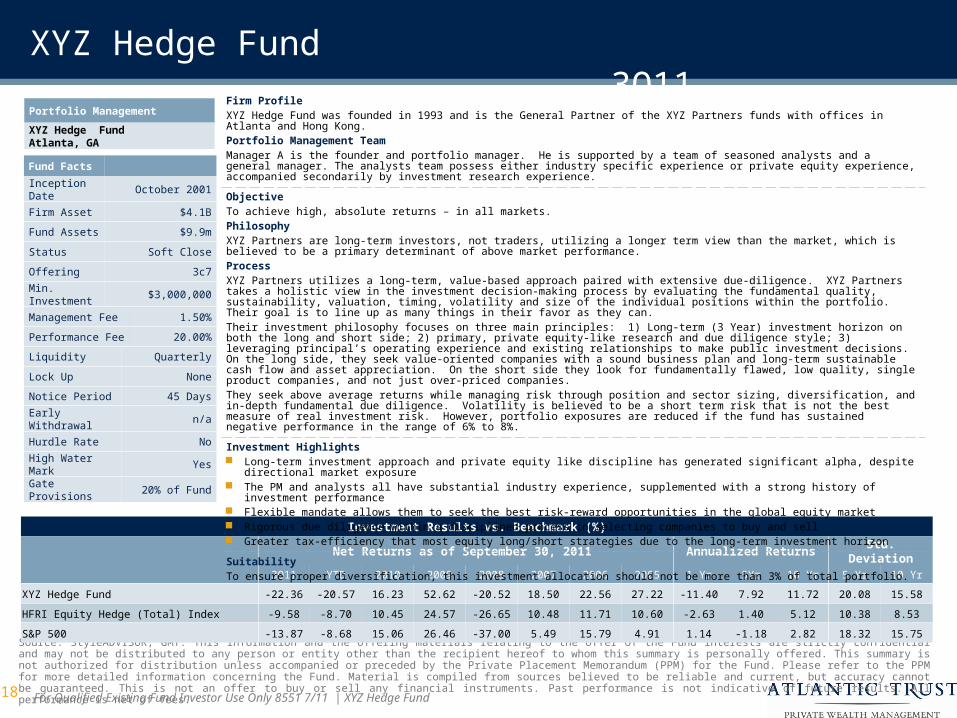
XYZ Hedge FundAtlanta, GA
Fund Facts
Inception Date October 2001
Firm Asset $4.1B
Fund Assets $9.9m
Status Soft Close
Offering 3c7
Min. Investment
$3,000,000
Management Fee 1.50%
Performance Fee 20.00%
Liquidity Quarterly
Lock Up None
Notice Period 45 Days
Early Withdrawal n/a
Hurdle Rate No
High Water Mark Yes
Gate Provisions 20% of Fund
Source: StyleADVISOR, GMT. This information and the offering materials relating to the offer of the Fund interests are strictly confidential and may not be distributed to any person or entity other than the recipient hereof to whom this summary is personally offered. This summary is not authorized for distribution unless accompanied or preceded by the Private Placement Memorandum (PPM) for the Fund. Please refer to the PPM for more detailed information concerning the Fund. Material is compiled from sources believed to be reliable and current, but accuracy cannot be guaranteed. This is not an offer to buy or sell any financial instruments. Past performance is not indicative of future results. All performance is net of fees.
Investment Results vs. Benchmark (%)
Net Returns as of September 30, 2011 Annualized Returns Std. Deviation
3Q11 YTD 2010 2009 2008 2007 2006 2005 1 Yr 5Yr 10 Yr 5 Yr 10 Yr
XYZ Hedge Fund -22.36 -20.57 16.23 52.62 -20.52 18.50 22.56 27.22 -11.40 7.92 11.72 20.08 15.58
HFRI Equity Hedge (Total) Index -9.58 -8.70 10.45 24.57 -26.65 10.48 11.71 10.60 -2.63 1.40 5.12 10.38 8.53
S&P 500 -13.87 -8.68 15.06 26.46 -37.00 5.49 15.79 4.91 1.14 -1.18 2.82 18.32 15.75
Firm ProfileXYZ Hedge Fund was founded in 1993 and is the General Partner of the XYZ Partners funds with offices in Atlanta and Hong Kong.Portfolio Management TeamManager A is the founder and portfolio manager. He is supported by a team of seasoned analysts and a general manager. The analysts team possess either industry specific experience or private equity experience, accompanied secondarily by investment research experience.
ObjectiveTo achieve high, absolute returns – in all markets.PhilosophyXYZ Partners are long-term investors, not traders, utilizing a longer term view than the market, which is believed to be a primary determinant of above market performance.ProcessXYZ Partners utilizes a long-term, value-based approach paired with extensive due-diligence. XYZ Partners takes a holistic view in the investment decision-making process by evaluating the fundamental quality, sustainability, valuation, timing, volatility and size of the individual positions within the portfolio. Their goal is to line up as many things in their favor as they can.Their investment philosophy focuses on three main principles: 1) Long-term (3 Year) investment horizon on both the long and short side; 2) primary, private equity-like research and due diligence style; 3) leveraging principal’s operating experience and existing relationships to make public investment decisions. On the long side, they seek value-oriented companies with a sound business plan and long-term sustainable cash flow and asset appreciation. On the short side they look for fundamentally flawed, low quality, single product companies, and not just over-priced companies. They seek above average returns while managing risk through position and sector sizing, diversification, and in-depth fundamental due diligence. Volatility is believed to be a short term risk that is not the best measure of real investment risk. However, portfolio exposures are reduced if the fund has sustained negative performance in the range of 6% to 8%.
Investment Highlights Long-term investment approach and private equity like discipline has generated significant alpha, despite directional market exposure The PM and analysts all have substantial industry experience, supplemented with a strong history of investment performance Flexible mandate allows them to seek the best risk-reward opportunities in the global equity market Rigorous due diligence within a disciplined process in selecting companies to buy and sell Greater tax-efficiency that most equity long/short strategies due to the long-term investment horizon
SuitabilityTo ensure proper diversification, this investment allocation should not be more than 3% of total portfolio.
XYZ Hedge Fund 3Q11
19 For Qualified Existing Fund Investor Use Only 8551 7/11 | XYZ Hedge Fund
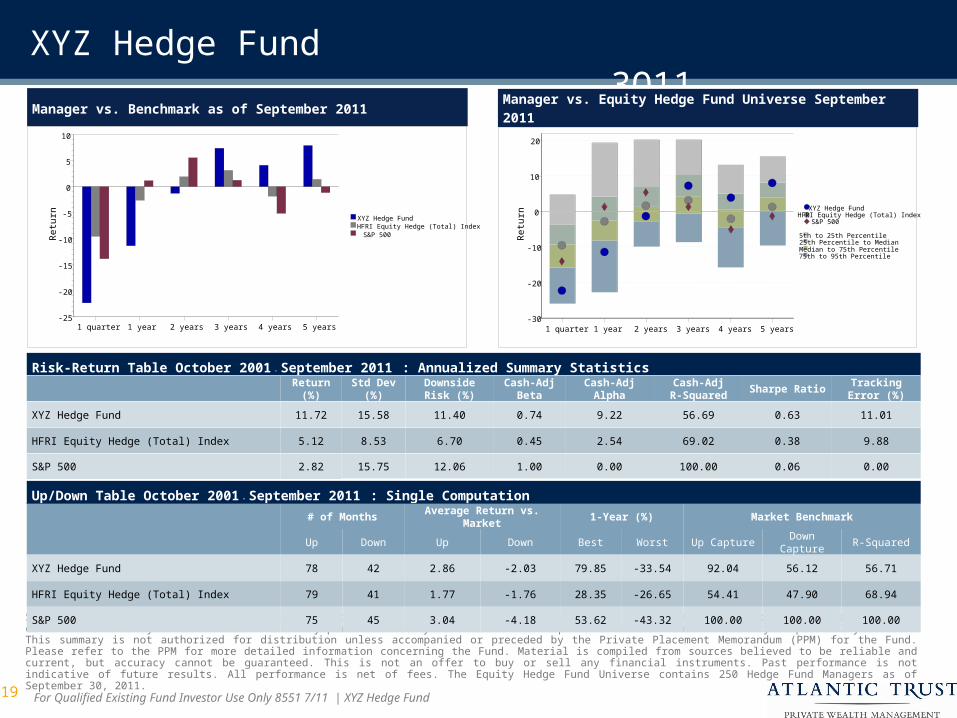
Source: StyleADVISOR, XYZ Partners. This information and the offering materials relating to the offer of the Fund interests are strictly confidential and may not be distributed to any person or entity other than the recipient hereof to whom this summary is personally offered. This summary is not authorized for distribution unless accompanied or preceded by the Private Placement Memorandum (PPM) for the Fund. Please refer to the PPM for more detailed information concerning the Fund. Material is compiled from sources believed to be reliable and current, but accuracy cannot be guaranteed. This is not an offer to buy or sell any financial instruments. Past performance is not indicative of future results. All performance is net of fees. The Equity Hedge Fund Universe contains 250 Hedge Fund Managers as of September 30, 2011.
Up/Down Table October 2001 - September 2011 : Single Computation# of Months Average Return vs. Market 1-Year (%) Market Benchmark
Up Down Up Down Best Worst Up Capture Down Capture R-Squared
XYZ Hedge Fund 78 42 2.86 -2.03 79.85 -33.54 92.04 56.12 56.71
HFRI Equity Hedge (Total) Index 79 41 1.77 -1.76 28.35 -26.65 54.41 47.90 68.94
S&P 500 75 45 3.04 -4.18 53.62 -43.32 100.00 100.00 100.00
Risk-Return Table October 2001 - September 2011 : Annualized Summary StatisticsReturn
(%)Std Dev
(%)Downside Risk
(%)Cash-Adj
BetaCash-Adj
AlphaCash-Adj
R-SquaredSharpe Ratio
Tracking Error (%)
XYZ Hedge Fund 11.72 15.58 11.40 0.74 9.22 56.69 0.63 11.01
HFRI Equity Hedge (Total) Index 5.12 8.53 6.70 0.45 2.54 69.02 0.38 9.88
S&P 500 2.82 15.75 12.06 1.00 0.00 100.00 0.06 0.00
XYZ Hedge Fund 3Q11
Manager vs. Equity Hedge Fund Universe September 2011
Ret
urn
-30
-20
-10
0
10
20
1 quarter 1 year 2 years 3 years 4 years 5 years
XYZ Hedge FundHFRI Equity Hedge (Total) IndexS&P 500
5th to 25th Percentile25th Percentile to MedianMedian to 75th Percentile75th to 95th Percentile
Manager vs. Benchmark as of September 2011
Ret
urn
-25
-20
-15
-10
-5
0
5
10
1 quarter 1 year 2 years 3 years 4 years 5 years
XYZ Hedge FundHFRI Equity Hedge (Total) Index
S&P 500
20 For Qualified Existing Fund Investor Use Only 8551 7/11 | XYZ Hedge Fund
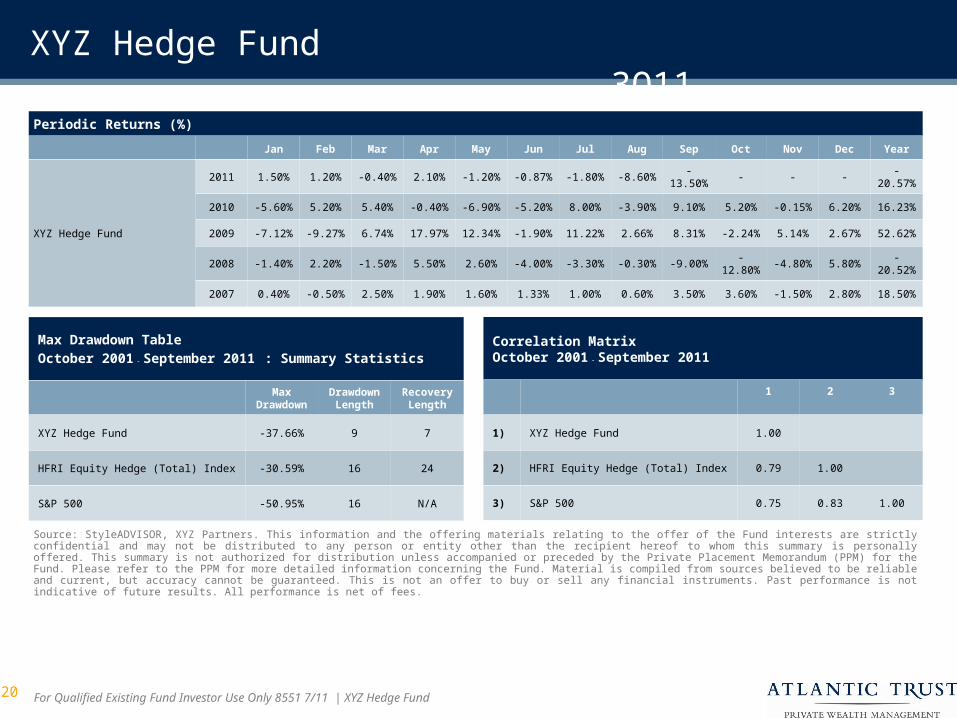
Periodic Returns (%)
Jan Feb Mar Apr May Jun Jul Aug Sep Oct Nov Dec Year
XYZ Hedge Fund
2011 1.50% 1.20% -0.40% 2.10% -1.20% -0.87% -1.80% -8.60% -13.50% - - - -20.57%
2010 -5.60% 5.20% 5.40% -0.40% -6.90% -5.20% 8.00% -3.90% 9.10% 5.20% -0.15% 6.20% 16.23%
2009 -7.12% -9.27% 6.74% 17.97% 12.34% -1.90% 11.22% 2.66% 8.31% -2.24% 5.14% 2.67% 52.62%
2008 -1.40% 2.20% -1.50% 5.50% 2.60% -4.00% -3.30% -0.30% -9.00% -12.80% -4.80% 5.80% -20.52%
2007 0.40% -0.50% 2.50% 1.90% 1.60% 1.33% 1.00% 0.60% 3.50% 3.60% -1.50% 2.80% 18.50%
Source: StyleADVISOR, XYZ Partners. This information and the offering materials relating to the offer of the Fund interests are strictly confidential and may not be distributed to any person or entity other than the recipient hereof to whom this summary is personally offered. This summary is not authorized for distribution unless accompanied or preceded by the Private Placement Memorandum (PPM) for the Fund. Please refer to the PPM for more detailed information concerning the Fund. Material is compiled from sources believed to be reliable and current, but accuracy cannot be guaranteed. This is not an offer to buy or sell any financial instruments. Past performance is not indicative of future results. All performance is net of fees.
Correlation MatrixOctober 2001 - September 2011
1 2 3
1) XYZ Hedge Fund 1.00
2) HFRI Equity Hedge (Total) Index 0.79 1.00
3) S&P 500 0.75 0.83 1.00
Max Drawdown Table
October 2001 - September 2011 : Summary Statistics
Max Drawdown
Drawdown Length
Recovery Length
XYZ Hedge Fund -37.66% 9 7
HFRI Equity Hedge (Total) Index -30.59% 16 24
S&P 500 -50.95% 16 N/A
XYZ Hedge Fund 3Q11

21 For Qualified Existing Fund Investor Use Only 8551 7/11 | XYZ Hedge Fund
Atlantic Trust Private Wealth Management includes Atlantic Trust Company, a division of Invesco National Trust Company (a limited-purpose national trust company), and Stein Roe Investment Counsel, Inc. (a registered investment adviser), both of which are wholly-owned subsidiaries of Atlantic Trust Group, Inc. This material is intended for informational purposes only and is being offered to prospective or current clients of Atlantic Trust, should not be relied upon as the sole factor in an investment making decision and should not be construed a an offer to buy or sell any financial instrument. If any offer of securities is made, it shall be made by the manager and/or distributor pursuant to a Private Placement Memorandum which contains material information not contained herein. Under no circumstances should a prospective investor elect to invest in the securities without reviewing the terms of the Private Placement Memorandum. In the event of any inconsistency between the information contained herein and the Private Placement Memorandum, the Private Placement Memorandum will govern. The opinions expressed herein are those of Atlantic Trust and are subject to change without notice. To ensure compliance with requirements imposed by the IRS, we inform you that any U.S. federal tax advice contained in this communication (including any attachments) is not intended or written to be used, and cannot be used, for the purpose of (i) avoiding penalties under the Internal Revenue Code or (ii) promoting, marketing or recommending to another party any transaction or matter addressed herein. Atlantic Trust does not provide legal advice, and the information contained herein should only be used in consultation with your legal, accounting and tax advisers.To the extent that information contained herein is derived from third-party sources, although we believe the sources to be reliable, we cannot guarantee their accuracy. As with all investments there are associated risks. The opinions expressed herein are based on current market conditions and are subject to change without notice. Past performance is not indicative of future results. Hedge funds and funds of hedge funds can be highly illiquid and may engage in leveraging and other speculative investment practices which may involve volatility of returns and significant risk of loss, including the potential for loss of the principal invested. Hedge fund investments are not suitable for all investors. Hedge fund investing is intended for experienced and sophisticated investors only who are willing to bear the high economic risks of the investment.
THIS DOCUMENT SHOULD BE ACCOMPANIED BY A PRIVATE PLACEMENT MEMORANDUM.
Investment Products Offered are Not FDIC-Insured, May Lose Value and are Not Bank Guaranteed.
Definitions: Alpha – Alpha is the incremental return on a manager when the market is stationary or the extra expected return due to non-market factors. The risk-adjusted measurement takes into account both the performance of the market as a whole and the volatility of the manager. A positive alpha indicates that a selected portfolio has produced returns above the expected level at that level of risk, and vice versa for negative alpha. Beta – A measurement indicating the volatility of a manager relative to a chosen market. A beta of 1 means a manager has about the same volatility as the market. A beta higher than 1 means the manager is more volatile than the market, while a beta lower than 1 means less volatile.Best Return – Within a selected date range (e.g., 5 years), the manager’s best rate of return.Downside Market Capture – A measure of the manager’s performance in down markets relative to the market itself. A value of 90% suggests the manager’s loss is only nine tenths of the market’s loss.R-Squared – A statistical measure that represents the percentage of a portfolio’s or security’s movements that are explained by the movements in a benchmark index.Sharpe Ratio – A measure of the risk-adjusted return of a portfolio, the Sharpe Ratio is equal to the excess return over the risk-free rate divided by the standard deviation of the portfolio. The ratio can be used to compare the performance of managers. If two managers had the same level of risk but different levels of excess return, the manager with the higher Sharpe ratio would be preferable because the manager achieved a higher return with the same level of risk as the other manager.Standard Deviation – Standard deviation is a statistical measure of a portfolio’s total risk and indicates the variability of the portfolio’s returns over a period of time. A higher standard deviation implies a riskier portfolio whose returns varied widely.Tracking Error – Tracking error is a statistical measure of how closely a portfolio tracks the performance of the index to which it is benchmarked and is generally defined by the annualized standard deviation of active returns. Upside Market Capture – A measure of the manager’s performance in up markets relative to the market itself. A value of 110% suggests the manager performs ten percent better than the market when the market is up.Worst Return – Within a selected date range (e.g., 5 years), the manager’s worst rate of return.
Disclosure