fostering students’ comprehension of topographic maps · the discrepancy in knowledge and...
TRANSCRIPT
ABSTRACT
Novice earth science students often have difficultyvisualizing three-dimensional interpretations of flat,two-dimensional displays. This challenge becomesapparent when students attempt to comprehendtopographic maps. In this study, we investigatedconditions that influence such activity. Earth sciencestudents viewed standard topographic maps, maps thatincluded shading, maps that included stereovisualization (affording a three-dimensional percept ofthe map), or maps with both stereo visualization andshading. Students answered line-of-sight questions (i.e.,intervisibility tasks) while viewing their assigned map.These questions required students to visualize aroute-perspective from the map's survey-perspective,with particular attention to the terrain relief. Tasks likethis are routinely completed during topographic mapexperiences, and provide insight into a user'sunderstanding of the dynamic land surfaces conveyedby those maps. Overall, stereo visualization was moresuccessful than shading in facilitating students'completion of the task. Students' general performancewas not influenced by gender, but was influenced byother background characteristics (e.g., expected coursegrades, prior map experience, and predilections foroutdoors activity). Students also preferred mapsemploying three-dimensional cues more than mapswithout them. Classroom activities in the earth sciencesmay benefit from incorporating stereo visualizations intomap-learning exercises.
INTRODUCTION
Topographic maps are two-dimensional depictions oflandscapes that use contour lines to convey informationabout the actual shape of the earth. Points that lie along asingle contour line are part of the same elevation in thereal world; each contour serves as a conceptual linejoining points of equal height. The relationships betweencontour lines (i.e., the relief of the land surface) conveydetail about the nature of terrain and the topography of aregion (e.g., the height, depth, and steepness of slopes).To experienced geographers and geologists (and evenhikers), this information affords inferences about thegeometry of the land surface, the probable origins oflandscape features, current water flow, distancerelationships, and the ease or difficulty of particulartravel routes. Thus, topographic maps are indispensabletools for understanding a region's geologic development,describing its current state, and forecasting potentialchange. Scientists use these symbolic two-dimensionalrepresentations to construct the complex, three-
dimensional mental models necessary to "truly know" anenvironment (Rapp, 2005; Rapp and Uttal, 2006).
But consider, in stark contrast, novice geosciencestudents' comprehension of such maps. Given their lackof training or experience with these maps, topographicdisplays can resemble a jumbled array of randomlyconverging lines, circling and curving in haphazarddirections across a map's surface. The relationshipsamong these lines are not immediately apparent, andstudents may ask relatively naïve questions such as:Does a line convey height or distance in some specificway, and if so how? Do the lines indicate slope orterraced relationships? How do these lines relate to oneanother - are they grooves or boundaries of some sort?Yet the novice is still expected to generate informedscientific explanations from these maps despite a lack offamiliarity with map features, limited overall experiencewith earth science theories, and little specific training asto how novel symbolic representations of the worldmight relate or 'map on to' real world locations (e.g.,Gilhooly et al., 1988; Liben and Downs, 1989;MacEachren, 1995; Shimron, 1978; Thorndyke and Stasz,1980; Tversky, 2000; Uttal, 2000). Simply put, novices areoften confused as to how a flat depiction represents adynamic, complex 3-D landscape.
The discrepancy in knowledge and performancebetween expert and novice map users is a critical issue inintroductory earth science classrooms. Instructors oftenmust plan protracted sequences of lessons and practiceactivities to help students learn to read and usetopographic maps. Such tasks are intended to familiarizestudents with the basics of map use (e.g., recognizingfeatures and identifying landmarks). For example,students are often asked to graph vertical profiles alongselected lines on a map, to draw successive contour linesas an irregular surface is incrementally flooded in a tank,or to compare a contour map with a three-dimensionalmodel of the depicted surface. On campuses with somerelief, the campus area itself is often recruited as ateaching aid with students constructing or using contourmaps of the campus to complete tasks.
However, the ultimate goal of map instruction is notjust for students to easily recognize or identify fixedaspects of maps, but to also use that information togenerate inferences that go beyond the explicit featuresof the map itself, such as the relationships betweenlocations that are not explicitly depicted or immediatelyobvious (e.g., Morrow et al., 1987; Taylor and Tversky,1992, 1996). And, of course, the intention is for studentsto transfer these skills to new maps and unfamiliarregions. Thus, instruction seeks to help students thinkdeeply about the real-world locations that underlie thesymbolic representation of a map. Activities that testwhether students can do this successfully might require
Rapp et. al - Fostering Students’ Comprehension of Topographic Maps 5
Fostering Students’ Comprehension of Topographic Maps
David N. Rapp School of Education and Social Policy & Department of Psychology,Northwestern University, 2120 Campus Drive, Evanston, IL 60208,[email protected]
Steven A. Culpepper Department of Educational Psychology, University of Minnesota, 206 Burton Hall, 178 Pillsbury Drive SE, Minneapolis, MN 55455, [email protected]
Kent Kirkby Department of Geology and Geophysics, University of Minnesota, 310 PillsburyDrive SE, Minneapolis, MN 55455, [email protected]
Paul Morin Department of Geology and Geophysics, University of Minnesota, 310 PillsburyDrive SE, Minneapolis, MN 55455, [email protected]

them to determine the direction of water or lava flow as afunction of terrain, to hypothesize how particular landformations developed, to identify real-world locationson a survey map using route-perspective photos, or toconsider what someone at a particular location would beable to see; in other words, to complete the types of tasksexperts normally do when they use topographic maps(Ishikawa and Kastens, 2005). Despite extended training,students often find these tasks considerably difficult tocomplete, and their difficulty may begin with simplyunderstanding that the two-dimensional map is adepiction of three-dimensional space (Pick et al., 1995).
The primary purpose of this study was to examinewhether map features can be modified to help studentsdevelop a basic understanding of the 2-D to 3-Drelationships conveyed in topographic displays.Specifically, we were interested in whether particularvisualization manipulations that naturally affordedsalient, perceptual experiences of elevation mightconvey these relationships in a more direct way. Asecondary purpose of this study was to investigatewhether differences in students' backgroundcharacteristics (i.e., gender, previous topographic mapexperiences, self-identified performance in earth scienceclasses, and predilections for outdoors activity) mightprovide insight into some of the conditions that fostergeneral topographic map comprehension. Examiningthese factors in a single project allowed us to assess thecontributions of map type and prior experience onlearning from topographic maps. Research in cognitivescience has successfully outlined conditions that fostereffective learning experiences by studying these types ofparticipant and task content influences (e.g., Rapp andvan den Broek, 2005; Taylor et al., 1999). A similarapproach should prove useful for elucidating conditionsthat facilitate general map comprehension (e.g., Kulhavyand Stock, 1996; Lobben, 2004), and in this particularproject, the comprehension of topographic maps (alsosee Schofield and Kirby, 1994). Below we describe ourtheoretical motivations for these manipulations and ourassessment measures.
MAP MANIPULATIONS AND MAPCOMPREHENSION
Beyond the obvious importance of the content of a map,map features also have direct influences on learning(MacEachren, 1995). Borders and roads depicted on amap, for instance, constrain the ways in which map usersgroup and organize locations (e.g., McNamara et al.,1984; McNamara et al., 1989; Stevens and Coupe, 1978).In some cases, these groupings can createcomprehension difficulties, such as when they lead toperceptual confusion or to biased interpretations. Forexample, borders can convey the notion that certainregions are closer or farther apart than actually true(McNamara, 1986), with a concomitant impact onmemory for the locations depicted in those maps. Othertypes of map cues, in contrast, can enhancecomprehension by explicitly identifying importantspatial features and relationships. For example, arrowscan indicate the importance of map elements forunderstanding particular areas of interest on a map (e.g.,Tversky et al., 2000).
Existing work has investigated whether such cuesspecifically influence interpretations of relief. Thesestudies have looked directly at the role of mapmanipulations designed to highlight particular features
of maps, and the related benefits to map legibility andmap comprehension that accrue as a function of suchmanipulations. Cues such as color, tints, shading,layering, height labeling, and map symbols have allproven potentially useful as aids for understandingtwo-dimensional presentations of dynamic landscapes(e.g., Eley, 1987; Phillips et al., 1975; Shurtleff andGeiselman, 1986). The design and selection of reliefmaps, and the cues to be implemented in those maps,should certainly be guided by the particular task at hand,as there are many cartographic methods available forpresenting dynamic geographic data (e.g., Brandes,1983). Obviously, the utility of a map and its particularset of cues depend critically upon factors such as theexpertise of the map user and the nature of the map task.Consider that while experts can rely upon theirbackground knowledge to generate inferences about theinformation depicted in a map, novices do not have thesame resources and practiced skills to draw upon duringcomprehension tasks.
Map activities can be particularly difficult for novicestudents, as comprehension requires devoting cognitiveresources to multiple processes (e.g., Baddeley, 1992;Kahneman, 1973; Mayer, 2001), such as the basicidentification and categorization of map regions andfeatures, as well as inferential problem solving. That is,students must recognize the parts of a map, connectthose parts into a coherent whole, and derive hypothesesfrom those products. Visualizing a two-dimensionalmap in three-dimensions, as is necessary withtopographic maps, requires considerable effort on thepart of the novice student (Taylor et al., 2004). It involvesprocesses including spatial orientation, mental rotation,and spatial visualization (Pellegrino et al., 1984;Schofield and Kirby, 1994). Thus, we sought toimplement map features that would embody thethird-dimension of topographic maps in accord withperceptual experience, alleviating some of the mentaleffort necessary for such visualization. In the followingstudy, we assessed map shading and stereo visualizationas methods for emphasizing the elevation-basedrelationships inherent in topographic maps. Wehypothesized that shading might provide one methodfor more directly conveying the relationshipsrepresented by contour lines in a topographic map.Shading is a cue that can convey information aboutheight and depth, as a function of the extent or reach ofshadow from various points on a physical structure (e.g.,Langer and Bülthoff, 2000). To build shading intotopographic maps, we imagined an illuminating sourceon one side of the map, and then modeled appropriatedarkened regions to the opposite side of the terrain,taking height into account.
While shading may be effective, another method ofmaking topographic relief more explicit and salient isthrough stereo visualization. During stereo visualizationexperiences, anaglyph images are presented to each eye,with each image taken from a slightly different yetoverlapping perspective. When these two perspectivesare viewed simultaneously (usually using speciallydesigned lenses, as for example, red-cyan lens anaglyphglasses), the perception of depth is conveyed by thedisparity of the flat images. Stereo visualization has oftenbeen used in entertainment experiences, includingmovies and comic books, to make viewers feel as if visualstimuli are 'popping out at them.' Thus, a flat image canbe changed into a 3-D perceptual experience. In thismanner, we used stereo visualization to make the terrain
6 Journal of Geoscience Education, v. 55, n. 1, January, 2007, p. 5-16

appear to 'pop out' of the map. When a topographic mapis designed using 3-D stereo visualization, landscapeswith higher elevation appear closer to the viewer thanlandscapes with lower elevation; from a survey view ofthe map, for example, mountaintops appear closer thanvalleys. Contour lines overlaid on these landscapes thenmore directly embody actual landscape formations.
STUDENT CHARACTERISTICS AND MAPCOMPREHENSION
We also investigated how characteristics of map usersmight influence performance with topographic maps(Ishikawa and Kastens, 2005; Schofield and Kirby, 1994).Because our project sought to specifically examine hownovice earth science students comprehend topographicmaps, we considered characteristics that, based on bothface validity and existing research, might obviouslyinfluence performance in introductory earth scienceclassrooms. As one characteristic, we were interestedwhether earth science course grades might predictsuccess with topographic maps. However, due to ethicalconsiderations involved in soliciting course grades fromidentified participants, as well as the fact that theexperiment took place during the semester so finalgrades were not yet available, we could not use actualgrades as a measure of performance. Instead, we askedparticipants to self-report their expected grades in theearth science class. While there is concern over the degreeto which self-reports are valid indicators of performance(Gonyea, 2005; Paulhus et al., 1998; Pohlmann and Beggs,1974), we believed such reports would provide at leastpreliminary insight into map comprehension as afunction of students' course experiences. In addition topredicted course performance, we also examinedparticipants' map knowledge and predilections towardusing maps, as measured, respectively, by their priorfamiliarity with topographic maps and their generalinterest in outdoors activity (queried with respect to theirpredilections for hiking and camping). Finally, there hasbeen considerable interest in potential genderdifferences with respect to geoscientific comprehension(e.g., Libarkin and Kurdziel, 2001), map comprehension(e.g., Brown et al., 1998; Montello et al., 1999; Tlauka etal., 2005), and more generally, spatial abilities (e.g.,Lawton, 1994; Lawton et al., 1996; Linn and Petersen,1985). Consequently, we examined whether gender wasrelated to topographic map comprehension.
ASSESSMENT OF TOPOGRAPHICCOMPREHENSION
As a dependent measure, we looked at the degree towhich participants could effectively understandtopographic contours, particularly with respect to therelationships between locations of differing heights. Weasked participants to imagine standing at particularpoints on a topographic map and to identify whetherthey would be able to see a campfire located at anotherpoint on the map. This intervisibility task requiredparticipants to imagine route perspectives from a surveyperspective and to make line-of-sight judgments. Thesetypes of activities, more formally labeled viewshedanalyses, are traditionally associated with the use oftopographic maps for exploration, navigation, terrainanalysis, and geoscientific hypothesis-testing (Eley, 1988;Potash et al., 1978). Line-of-sight questions were used to
measure students' basic perceptions of mapped landsurfaces as they are easily conceptualized andunderstood by novice earth science students. They alsodo not require expert-level content knowledge toanswer, in comparison to questions testing geologicinterpretations and conceptual inferences. Thus, webelieved this task would provide a valid test of whetherparticular map manipulations might facilitate novicestudents' basic understanding and use of topographicmaps.
To recap, we examined students' performance ontopographic maps that conveyed elevation using avariety of visualizations. Participants studied standardtopographic maps, topographic maps that includedshading, stereo visualization versions of the topographicmaps, or topographic maps that included both shadingand stereo visualization. These four conditions allowedus to investigate the separable contributions of each mapfeature, as well as their potentially combinatorial andinteractive effects. Performance was also examined withconsideration of student characteristics that areconsidered relevant to map comprehension. Our"campfire" task required both basic recognition skills(i.e., identify map points and topographies) as well ashigher-order cognitive processes (i.e., consider currentlyviewed locations from multiple viewpoints). Theexperiment was intended to examine factors thatinfluence topographic map comprehension.
METHOD
Participants - 190 undergraduate students (118 femalesand 72 males) enrolled in an introductory geology courseat the University of Minnesota participated for extracourse credit. Participants were randomly assigned toone of four map groups (a between-subjects design):traditional topographic map (n = 46), traditionaltopographic map with shading (n = 45), stereovisualization topographic map (n = 51), or stereovisualization topographic map with shading (n = 48).
Materials - We used two maps; one map depicted aregion of Crater Lake in Oregon, and the other depictedYosemite National Park in California. We selected theseregions for their surface geometry as well as because theywere relatively unfamiliar to University of Minnesotaundergraduate students. For this experiment, weconstructed four versions of each map: standard, shaded,stereo visualization, and stereo visualization withshading. The standard versions of the maps wereobtained from the U.S. Geological Survey (USGS), andwere 1:24,000 scale topographic maps. To construct theshaded versions of these maps, we used digital elevationmodel (DEM) data (also from USGS) to model elevationfor each of the base maps, and then projected a lightsource onto the elevations from the Northwest region ofthe map using Global Mapper software (see Collier et al.,2003, for discussion of shading techniques withtopographic maps). To construct the stereo visualizationversions of the maps, we also used DEM data to modelmaps for which high elevations were pushed to the leftand low elevations were pushed to the right in the image.These modified maps were then combined with standardversions of the maps using PokeScope Pro software tocreate a single anaglyph image. The percept of athree-dimensional map can be obtained while viewingthese anaglyph images using special red-cyan lensglasses, wherein one map-image is filtered to the left eye
Rapp et. al - Fostering Students’ Comprehension of Topographic Maps 7

and the other to the right-eye. Finally, stereovisualization maps with shading were produced usingboth methods described above; these maps appeared asan anaglyph image with shading along the elevations.Each map was printed on an HP 5000ps graphic artsprinter; the Crater Lake maps were 3'x 2' and theYosemite maps were 1.5' x 2' in size (although, again, thesame scale).
Each map included four dark squares to be used asstarting points for participants to imagine whether theycould view campfires located around the map. Campfirepoints were selected using two general criteria; weselected points that, in general 1) required a fairunderstanding of the land surface to make line-of-sightdecisions, and 2) could clearly and definitively beanswered by novices who understood the basicgeometry of the land surface. With respect to this latterpoint, we did not place locations on the crests of ridges orpeaks, but rather on slopes. We also avoided points thatwould rely only on vertical scale, since this scale is oftendifficult to grasp without extended training. Based onthese general criteria, we selected nine campfire pointsfor the Crater Lake map (each represented on the mapwith a large asterisk and a number from 1 to 9), andtwelve campfire points for the Yosemite National Parkmap (again, represented with large asterisks on the mapand numbered from 1 to 12). Each individual shadedlocation was tested with each numbered campfire,presented in a fixed numeric order. This resulted in 36items for the Crater Lake map, and 48 items for theYosemite National Park map. The options 'yes,' 'no,' or'not sure' appeared below each item as answer choices.
To provide an example of this campfire task, Figure 1presents a portion of the traditional Crater Lake mapwith shading. In this example, the two dark shadedsquares (one close to the rim of Crater Lake and the otherlocated on Wizard Island) would be necessary for
deciding whether a campfire (in this case, the asterisklabeled 7) is visible from those starting points. Examplesof items pertaining to the land surface shown in Figure 1included:
1. You are standing near Lightning Spring on thewestern rim of Crater Lake. Would you be able to seethe flames of campfire #7 from that location?
2. You are standing beside Governors Bay on WizardIsland. Would you be able to see the flames ofcampfire #7 from that location?
Participants were asked to circle either 'yes,' 'no,' or 'notsure' for each item. (Note: The correct answer is yes forboth of these examples.)
We constructed test packets that included a consentform, a pre-exercise survey, a brief introduction totopographic maps, the campfire test items for CraterLake, the campfire test items for Yosemite National Park,a Crater Lake map evaluation task, and a debriefingform, always in that fixed order. (Note: Crater Lake itemsalways preceded the Yosemite items to provide aconceptual break before the Crater Lake evaluation task,as a means of avoiding potential map conditionpreferences as a function of familiarity with a particularstudied map.) The pre-exercise survey was designed tocollect information on participants' backgroundcharacteristics. The survey questions asked participantsto identify their gender (male/female), indicate theirexpected course grade in the class (A, B, C, or less thanC), indicate their preference for engaging in outdoorsactivities as a function of whether they liked to hike orcamp (yes/no), and specify whether they had any priorexperience with topographic maps (yes/no). Theintroduction to topographic maps briefly described howthree-dimensional surfaces can be represented bytwo-dimensional topographic maps. This three-page
8 Journal of Geoscience Education, v. 55, n. 1, January, 2007, p. 5-16
Figure 1. Sample of the Crater Lake shaded topographic map.
presentation explained what topographic maps areintended to do and how contour lines in a topographicmap can represent elevation. The introduction alsoprovided a picture of a sample land surface as well as itstwo-dimensional topographic representation. Thecampfire items followed, as previously described. Themap evaluation task included four questions askingparticipants to evaluate the four different versions of theCrater Lake map with respect to how clearly eachillustrated the land surface (in comparison to each other).Each question included a Likert-type rating scale rankingfrom 1 (very poor) to 7 (very good). Finally, thedebriefing form briefly described the purpose of thestudy, and provided contact information if participantshad further questions about their experience.
Procedure - Participants signed up for session timesduring their class; sessions were held outside of the classperiod. Each session included four to six students, and allparticipants in a single session were assigned to the samemap condition (between-subjects: standard, shading,stereo visualization, or stereo visualization plusshading). Each participant was assigned a single table tothemselves, with the test packet and the appropriateversion of the Crater Lake map placed face down on thetabletop. Participants were instructed to open their testpacket, asked to complete the packet in order withoutreturning to previous sections, and then told they couldbegin. If participants were assigned to either the stereovisualization or stereo visualization plus shadingconditions, they were required to wear red-cyananaglyph glasses while viewing the maps; they were also asked to stand while viewing the maps to enhance thethree-dimensional effect, as viewing the maps from anodd angle or from close proximity can distort the effect.After completing the Crater Lake items, the Crater Lakemap was removed and the Yosemite map from the samecondition was placed on the table. After completing theYosemite items, each participant was taken to a secondroom with a table displaying all four versions of theCrater Lake maps, to complete the evaluation task. Eachmap in this task included a label to indicate whetherparticipants should wear the anaglyph glasses whileviewing that map.
RESULTS
For our analyses, we omitted participants who hadmissing data on any of the variables of interest. Twoparticipants did not answer items on the Yosemite testand one student did not provide an expected courseperformance score. Thus, the final sample size was 187(116 females and 71 males).
Successful and careful test construction requiresgathering evidence concerning the reliability anddimensionality of measures. To ensure the reliability ofour test items we conducted item analyses (Libarkin and
Kurdziel, 2001; Netemeyer et al., 2003) of the Crater Lakeand Yosemite items, and omitted items with lowitem-total correlations. Accordingly, nine Crater Lakeand seven Yosemite items were omitted. The remaining27 and 41 items for Crater Lake and Yosemite wereinternally reliable (i.e., the corresponding Cronbachalpha indices were 0.860 and 0.862, respectively, on ascale that ranges from zero to one, with one representingperfect reliability). Evidence from a multidimensionalscaling analysis suggested the tests were alsounidimensional (Chen and Davison, 1996), which meansthat only one latent trait facilitated performance on thetests.
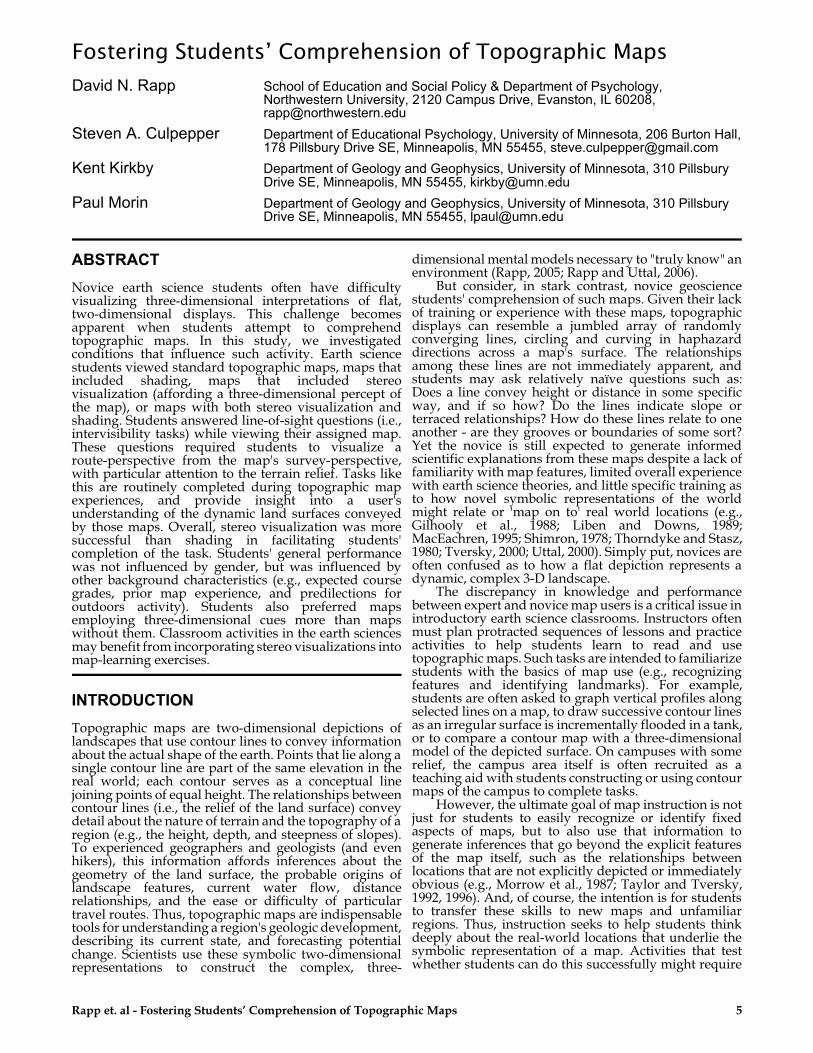
Topographic Map Formats - Table 1 providesperformance data (in percentages) for the Crater Lakeand Yosemite test items as a function of map condition.We predicted that, based on the more complex patternpresented by the topography of the Yosemite map(containing many valleys and ridges) as compared to theless complex Crater Lake map (containing a large lakesurrounded by a rim with few hills and valleys), thatparticipants would in general answer more itemscorrectly on the easier Crater Lake map. Overall,however, participants answered more items correctly forthe Yosemite map (64%) than for the Crater Lake map(59%) (t(187) = -5.27, p < 0.001). This counterintuitivefinding might be explained as a function of practiceeffects; recall that participants always completed theCrater Lake items before the Yosemite items. We discussthis finding further in the General Discussion.
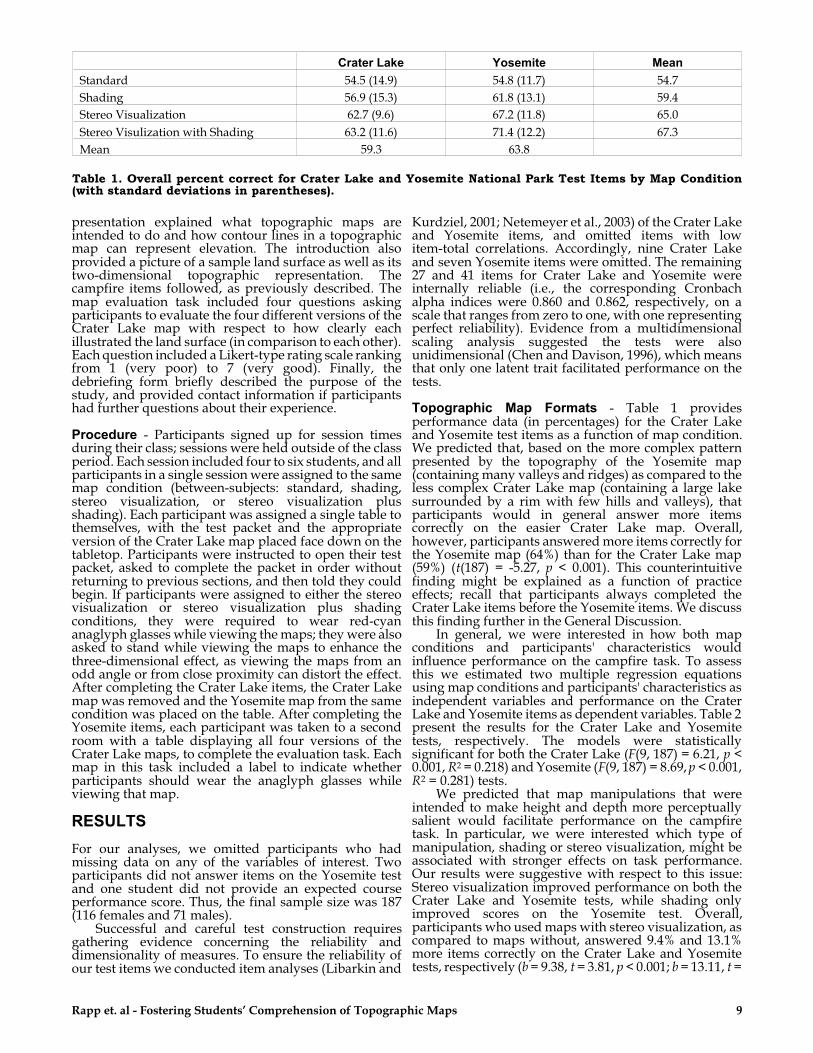
In general, we were interested in how both mapconditions and participants' characteristics wouldinfluence performance on the campfire task. To assessthis we estimated two multiple regression equationsusing map conditions and participants' characteristics asindependent variables and performance on the CraterLake and Yosemite items as dependent variables. Table 2present the results for the Crater Lake and Yosemitetests, respectively. The models were statisticallysignificant for both the Crater Lake (F(9, 187) = 6.21, p <0.001, R2 = 0.218) and Yosemite (F(9, 187) = 8.69, p < 0.001,R2 = 0.281) tests.
We predicted that map manipulations that wereintended to make height and depth more perceptuallysalient would facilitate performance on the campfiretask. In particular, we were interested which type ofmanipulation, shading or stereo visualization, might beassociated with stronger effects on task performance.Our results were suggestive with respect to this issue:Stereo visualization improved performance on both theCrater Lake and Yosemite tests, while shading onlyimproved scores on the Yosemite test. Overall,participants who used maps with stereo visualization, ascompared to maps without, answered 9.4% and 13.1%more items correctly on the Crater Lake and Yosemitetests, respectively (b = 9.38, t = 3.81, p < 0.001; b = 13.11, t =
Rapp et. al - Fostering Students’ Comprehension of Topographic Maps 9
Crater Lake Yosemite Mean
Standard 54.5 (14.9) 54.8 (11.7) 54.7
Shading 56.9 (15.3) 61.8 (13.1) 59.4
Stereo Visualization 62.7 (9.6) 67.2 (11.8) 65.0
Stereo Visulization with Shading 63.2 (11.6) 71.4 (12.2) 67.3
Mean 59.3 63.8
Table 1. Overall percent correct for Crater Lake and Yosemite National Park Test Items by Map Condition(with standard deviations in parentheses).
5.48, p < 0.001), after controlling for the otherindependent variables in the regression models. Theunconditional effects, i.e., the effects or averagedifferences without controlling for the other variables inthe models, are illustrated in Figure 2, across three levelsof self-reported course grade (i.e., 'C or less,' 'B,' and 'A').
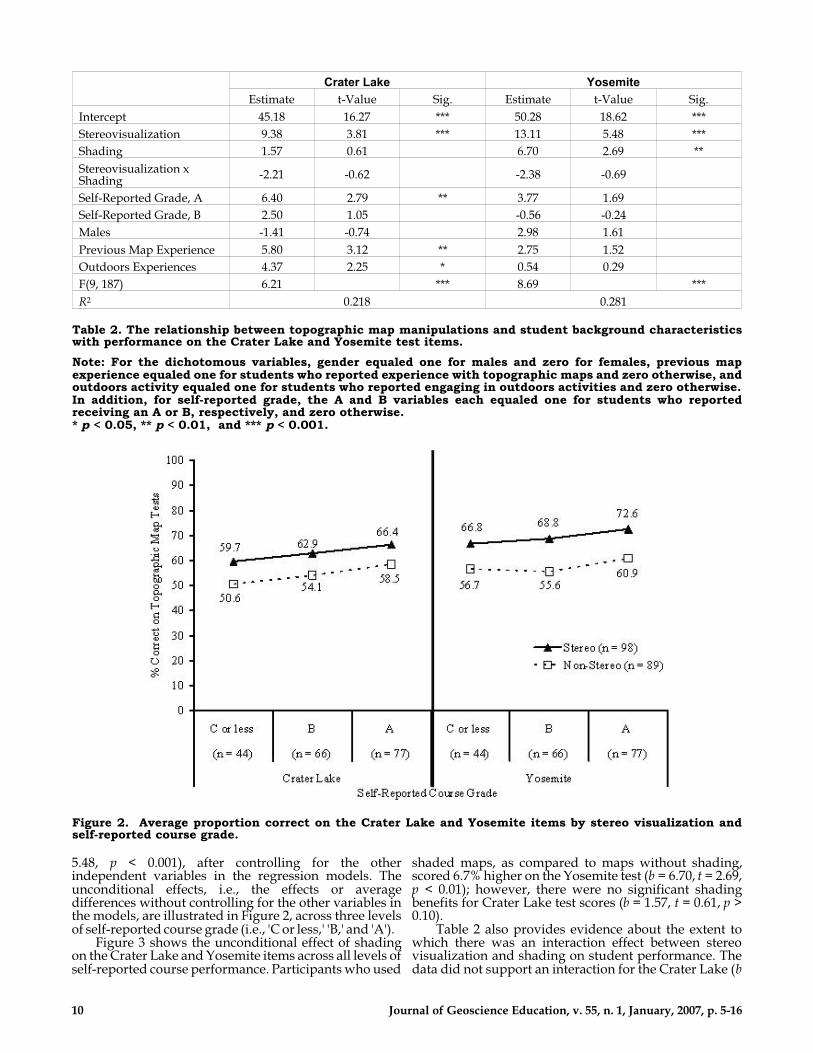
Figure 3 shows the unconditional effect of shadingon the Crater Lake and Yosemite items across all levels ofself-reported course performance. Participants who used
shaded maps, as compared to maps without shading,scored 6.7% higher on the Yosemite test (b = 6.70, t = 2.69,p < 0.01); however, there were no significant shadingbenefits for Crater Lake test scores (b = 1.57, t = 0.61, p >0.10).
Table 2 also provides evidence about the extent towhich there was an interaction effect between stereovisualization and shading on student performance. Thedata did not support an interaction for the Crater Lake (b
10 Journal of Geoscience Education, v. 55, n. 1, January, 2007, p. 5-16
Crater Lake Yosemite
Estimate t-Value Sig. Estimate t-Value Sig.
Intercept 45.18 16.27 *** 50.28 18.62 ***
Stereovisualization 9.38 3.81 *** 13.11 5.48 ***
Shading 1.57 0.61 6.70 2.69 **
Stereovisualization xShading
-2.21 -0.62 -2.38 -0.69
Self-Reported Grade, A 6.40 2.79 ** 3.77 1.69
Self-Reported Grade, B 2.50 1.05 -0.56 -0.24
Males -1.41 -0.74 2.98 1.61
Previous Map Experience 5.80 3.12 ** 2.75 1.52
Outdoors Experiences 4.37 2.25 * 0.54 0.29
F(9, 187) 6.21 *** 8.69 ***
R2 0.218 0.281
Table 2. The relationship between topographic map manipulations and student background characteristicswith performance on the Crater Lake and Yosemite test items.
Note: For the dichotomous variables, gender equaled one for males and zero for females, previous mapexperience equaled one for students who reported experience with topographic maps and zero otherwise, andoutdoors activity equaled one for students who reported engaging in outdoors activities and zero otherwise.In addition, for self-reported grade, the A and B variables each equaled one for students who reportedreceiving an A or B, respectively, and zero otherwise.* p < 0.05, ** p < 0.01, and *** p < 0.001.
Figure 2. Average proportion correct on the Crater Lake and Yosemite items by stereo visualization andself-reported course grade.
= -2.21, t = -0.62, p > 0.10) or Yosemite items (b = -2.38, t =-0.69, p > 0.10). This suggests that shading did notmoderate performance differences between participantswho used a stereo visualization map with shading andparticipants who used a map with only stereovisualization. In other words, there was no additionaleffect on performance for the stereo visualization withshading version of the map as a function of shading;benefits appeared to be a function of the three-dimensional presentation.
Participants' Background Characteristics - The mapmanipulation variables (shading and stereovisualization) were included in regression analyses toexamine the impact of map type after controlling forparticipants' background characteristics. Gender,predilections for outdoors activity, and priortopographic map experience were included in ouranalyses as dichotomous variables. Expected coursegrade was included as two dichotomous variables in ouranalyses and thus requires a short explanation: The firstvariable included students who expected to earn an 'A' ornot, while the second variable included students whoexpected to earn a 'B' or not. Self-reported course gradesof 'C' or 'less than C' were collapsed into one category ('Cor less') since few students reported these expectedgrades. The 'C or less' category was not included as adichotomous variable to prevent linear dependence withthe intercept. Consequently, the 'C or less' category wasdefined as neither 'A' nor 'B' on the dichotomous coursegrade variables. This allowed us to compare the testperformance of students who received an 'A' or 'B' tostudents who received a 'C or less.' Below we discuss theimpact of each background characteristic in ourregression analyses, with the hypothesis that thecharacteristics would correlate with performance on theline-of-sight items.
First, we tested the correlation between gender andperformance, as previous work has considereddifferences in spatial performance as a function ofgender (Lawton, 1994; Linn and Petersen, 1985).However, we obtained no evidence for genderdifferences (Crater Lake: b = -1.41, t = -0.74, p > 0.10;Yosemite: b = 2.98, t = 1.61, p > 0.10).
We next examined whether participants' self-reported course grades would correlate to itemperformance, with the general expectation that higherexpected course grades would be related to betterperformance. Overall, 44 students indicated theyexpected to earn a 'C or less', 66 a 'B', and 77 an 'A'. Weobtained partial support that students who expected toearn an 'A' outperformed students who expected to earna 'C or less' for the Crater Lake test, but no suchrelationship for the Yosemite test (Crater Lake: b = 6.40, t= 2.79, p < 0.01; Yosemite: b = 3.77, t = 1.69, p > 0.05). Therewas no evidence that participants who expected a 'B'performed any better on either the Crater Lake orYosemite test than students who expected a 'C or less'(Crater Lake: b = 2.50, t = 1.05, p > 0.10; Yosemite: b =-0.56, t = -0.24, p > 0.10).
We also investigated whether prior topographic mapexperience would correlate with item performance,based on relatively intuitive (and somewhat obvious)expectations that map experience should facilitate mapcomprehension. Evidence for this relationship wassupported by the fact that participants who reportedprevious topographic map experience (n = 104), ascompared to those who reported no experience (n = 83),scored 5.8% higher on the Crater Lake test (b = 5.80, t =3.12, p < 0.01) after controlling for the other variables inthe model; however, there was no evidence that priorexperience with topographic maps had an effect on theYosemite test (b = 2.75, t = 1.52, p > 0.10). Theunconditional averages for Crater Lake and Yosemite inthis regard are illustrated in Figure 4.
Rapp et. al - Fostering Students’ Comprehension of Topographic Maps 11
Figure 3. Average proportion correct on the Crater Lake and Yosemite items by shading and self-reportedcourse grade.

In addition, we tested whether or not predilectionsfor outdoors activity would correlate with performance.The results show that participants who reportedengaging in hiking and camping (n = 131) scored 4.4%higher than those who did not (n = 56) on the Crater Laketest (b = 4.37, t = 2.25, p < 0.05); yet the evidence did notsupport a similar relationship for the Yosemite test (b =0.54, t = 0.29, p > 0.10). The unconditional results are alsoillustrated in Figure 4.
Interactions between Map Formats and BackgroundCharacteristics - We also wanted to examine thecombinatorial influences of map manipulations andbackground characteristics. Thus, an additional modelwas estimated to test effects between stereo visualizationand the statistically significant participant characteristicvariables on comprehension of the Crater Lake surface.(Note: Interactions between background characteristicsand shading were not included, since shading was notstatistically related to performance on the Crater Laketest.) The results suggest that the effects of expecting an'A' (stereo x 'A' grade: b = 2.20, t = 0.61, p > 0.10), previoustopographic experience (stereo x previous: b = -5.32, t =-1.48, p > 0.10), and predilections for outdoors activity(stereo x outdoors: b = -5.64, t = -1.46, p > 0.10) wereconstant across the two stereo visualization versions ofthe Crater Lake topographic map. (Note: An interactionmodel was not estimated for Yosemite items, since noneof the background characteristics were statisticallyrelated to performance on the Yosemite test.)
Student Preferences for Map Formats - Finally, weassessed participants' ratings of the different map typesfor Crater Lake. A repeated-measures ANOVA wasconducted to determine whether participants preferred aparticular map, and to assess if those preferences were afunction of the map type they actually viewed while
completing the campfire tasks. Figure 5 showsparticipants' overall preference ratings for the maps.Participants quite clearly differed in their preferences(F(3,183) = 60.35; p < 0.001), with planned contrastsrevealing that participants preferred the stereovisualization map with shading more than the othermaps (vs. standard: F(1, 185) = 137.94, p < 0.001; vs.shaded: F(1, 185) = 56.40, p < 0.001; vs. stereovisualization F(1, 185) = 33.47, p < 0.001). Plannedcontrasts also provided evidence that participantsactually preferred the standard map less than the shaded(F(1, 185) = 38.09, p < 0.001) and stereo visualization (F(1,185) = 74.85, p < 0.001) versions of the maps. We found noevidence that participants' ratings were a function of themap they had actually used to complete the Crater Lakecampfire tasks (stereo visualization: F(3, 183) = 0.64; p >0.1; shading: F(3, 183) = 1.97; p > 0.1).
Overall, these results suggest that stereovisualization had a positive impact on the completion ofthe campfire tasks, as compared to standard and shadedmaps. The findings support the view that novelvisualizations that embody perceptually salient featuresof height and depth (i.e., stereo visualization) maybenefit performance on tasks involving topographic mapcomprehension. Participants' characteristics (save forgender) also demonstrated an influence on mapperformance, particularly for the Crater Lake items (andsimilarly across maps incorporating stereovisualization). Finally, participants showed a preferencefor maps that utilized stereo visualization and shading ascompared to standard map types.
GENERAL DISCUSSION
In this project, we were interested in whether novelvisualizations might facilitate comprehension oftopographic maps by helping to make salient the
12 Journal of Geoscience Education, v. 55, n. 1, January, 2007, p. 5-16
Figure 4. Performance differences on the Crater Lake and Yosemite items as a function of topographic mapexperience and predilections for outdoors activity.

important features of such maps. Our sample includedstudents in an introductory earth science course. Thissample allowed us to examine how differentpresentation formats might influence mapcomprehension for a group with little formal training asto the use of topographic data. To do this, weinvestigated the use of stereo visualization and shadingas mechanisms for embodying the elevation-relatedfeatures that are traditionally conveyed usingtwo-dimensional cues (i.e., contour lines) provided inthese maps. As a test of the usefulness of suchmanipulations, we asked participants to complete tasksthat necessitated visualizing the maps' land surfacesfrom a route-oriented view to make line-of-sightjudgments. These types of judgments are common, andoften necessary, in field situations, as well as inassessments of map utility (e.g., Potash et al., 1978).These tasks also provide one method of assessingindividuals' understanding and use of maps (Ishikawaand Kastens, 2005; Liben and Downs, 1993).
The data revealed performance differences as afunction of map format. Participants were consistentlymore successful at answering test questions when theyviewed maps that implemented stereo visualization ascompared to maps without. Importantly, similar gainswere not as consistently observed with maps that reliedonly on shading to convey surface features; shadingpromoted map comprehension only for the Yosemitemap. Shading also provided little added benefit whencoupled with stereo visualization; students performedequally well while viewing maps implementing stereovisualization with shading and only stereo visualization.These results suggest that stereo visualization is onemethod for helping students understand relationshipsthat may be challenging to visualize using flat,two-dimensional map displays.
Previous work on topographic map comprehensionhas focused specifically on manipulations of features
that, in some cases, simulate three-dimensional visualpercepts (e.g., shading), or in others make some aspect ofthose features more salient (e.g., color). Thesemanipulations do not, however, directly embody theperspectives that topographic maps intend to display.Our focus on three-dimensional presentations allowedus to test whether perceptual experiences that embodyspecific qualities of a dynamic landscape (e.g., height anddepth), would help students complete map tasks thatrely on those dynamic qualities. This approach is a moregeneral example of how the nature of a particularlearning experience should, as much as possible, matchthe type of mental representation, process, or skill thatindividuals (and their instructors) are hoping will beacquired from the experience (Glenberg et al., 2004; Rappand Kurby, in press). The notion that particular types ofembodied experiences might improve particular skills isone we hope will prove fruitful for thinking about novelways to improve students' map learning, and moregenerally, foster spatial comprehension.
Overall we noted differential performance for theCrater Lake map as compared to the Yosemite map. Apriori, we believed the Crater Lake map to be the lesscomplex of the two. The Crater Lake region illustrated asingle feature (the lake) that dominated the land surfacewith simple geometry (that, in fact, is similar in geometryto craters that students have likely seen from widelycirculated images of the moon, which could haveprovided a frame of reference for the land surface). Incontrast, the Yosemite region is a more dynamic patternof interwoven ridges and valleys without any dominant,easily interpreted feature that might guide students'attention (and for which there are few widely circulatedimages of the area beyond those that might show a singlepeak, valley, or mountain range). However the datasuggested participants actually had less difficulty withthe Yosemite task. One potential explanation for thesecounterintuitive results may be that map content can
Rapp et. al - Fostering Students’ Comprehension of Topographic Maps 13
Figure 5. Participants' mean ratings of each map's utility for distinguishing land surface features.

mediate the success of particular map visualizations.That is, more complex maps may exhibit greater benefitsfrom stereo visualizations and shading than less complexones. For example, the enhanced effect of shading forYosemite items could be a function of differences insurface geometry between Yosemite and Crater Lakemaps. Because we did not manipulate map complexity,though, we cannot specifically assess the viability of thiscomplexity hypothesis. In addition, since participantsalways completed the Crater Lake task before theYosemite task, performance may have improved for theYosemite task simply due to practice effects. Studentsmay have become more familiar or comfortable withline-of-sight decisions as they completed their secondcampfire task, which was always the Yosemite map.Studies should continue to investigate the influence ofextended practice with such questions, as well as thedegree to which different types of map content (ofdiffering complexity) (e.g., Eley, 1991; Phillips et al.,1975) may be easier to comprehend as a function ofspecific novel visualizations.
Beyond particular map formats, we were alsointerested in the effects of a variety of studentcharacteristics on topographic map comprehension. Wefelt this investigation was also important as it wouldprovide insight into individual differences that mightmediate success with topographic map tasks. Weobtained evidence that characteristics including gradeexpectations, prior topographic map experience, andpredilections for outdoors activity were associated withline-of-sight task performance. While it is not surprisingthat these factors play a role in successful mapexperiences, they explicitly delineate the types ofcharacteristics that instructors might consider as theydevelop and implement map training tasks inclassrooms. In addition, because these results were mostclearly obtained with the Crater Lake task, they again aresuggestive with respect to interactions betweenindividual differences and map content. Perhaps the lesscomplex, relatively familiar land surface of Crater Lakewas more likely to engender benefits as a function ofstudents' characteristics, in comparison to the lessfamiliar, more dynamic geography of Yosemite.Research on learning has contended that priorknowledge can mediate success with particular learningtasks (e.g., Kendeou et al., 2004), and thus perhapsinfluence the likelihood that novel visualizations willobtain performance benefits. In future projects, we hopeto examine whether individual differences in priorknowledge mediate such effects as a function of thecomplexity of maps. We also plan on investigating therole of general spatial ability, as measured throughpsychometric tests, with respect to users' comprehension of such visualizations.
In addition, not all individual characteristics exertedan influence on map performance. Our data failed toreveal an influence of gender on students' success withthe campfire questions. There are several possibleexplanations for both obtaining or failing to obtain suchfindings, and these explanations may appeal todevelopmental differences, the nature of theinstructional experience, and the underlying mentalprocesses that may drive particular map tasks (seeBaenniger and Newcombe, 1989, Caplan et al., 1985,Geary et al., 1992, and Montello et al., 1999, fordiscussions of gender effects). We must take caution ininterpreting our results with respect to claims of anygeneralized trends in spatial ability as a function of
gender, and thus are hesitant to make claims about thecurrent findings with respect to this literature given ourexperimental task. For example, spatial ability mayencompass a variety of skills and processes, and onemight argue that the campfire task recruits only a smallsubset of the characteristics, if any, that comprise suchability. In future work we hope to incorporate otherassessment activities and spatial tasks (e.g., memory forthe map features, distance estimates, more complexspatial manipulations) to further examine underlyingmechanisms of map comprehension, which mightprovide insight into potential gender effects (ornon-effects). Such analyses are critical in considerationsof how to encourage the success of under-representedgroups (i.e., women) in science (clearly not limited to thegeosciences).
An important issue with respect to the mapmanipulation and student characteristics data is thedegree to which these results are generalizable acrossdifferent map displays. There is a distinct need fortesting different types of map activities with differenttypes of map content. Issues including (but not limitedto) map complexity, region familiarity, and familiaritywith particular types of landforms and how they mightbe represented on maps may all play a role intopographic map comprehension. The degree to whichdifferent types of map manipulations (e.g., stereovisualization) confer some form of benefit on thesefactors would provide an indication of thegeneralizability of the current findings. An additionalcore question, intended to assess the scope of anybenefits, would be the extent to which practice with these"enhanced" maps might transfer to better understandingof standard topographic maps (e.g., Taylor et al., 2004).
This experiment also involved the collection of datawith respect to students' stated preferences for aparticular map type. Regardless of the map thatparticipants studied over the course of the experiment,students identified maps containing novel elevation cues(i.e., more than just flat contour lines) as useful forunderstanding the land surface. Identifying theconditions that students expect to be most useful isimportant, as it can provide insight into factors thatmight prove more motivating for learning activities (aswell as align with expectations of success, a criticalcomponent in learning self-efficacy, e.g., Bandura, 1997).Just as important, though, is the degree to whichmethodologies that students find motivating or usefulresult in actual learning benefits (Phillips, 1984). Thepreference responses, when coupled with students'performance data, provide converging evidence for theutility of elevation-focused visualizations duringtopographic map tasks.
Taken together, these findings suggest severalimplications for earth science classrooms - in particular,for situations that involve learning about topographicmaps. First, map manipulations that provide salient,perceptually-driven visualizations of map content canbenefit map comprehension. Contour lines are designedto convey elevation, but because they are flat cues theycan be difficult for novices to visualize as relief in threedimensions. Developing a map that conveys a thirddimension (as those in this study attempted to do) maybe a pragmatic challenge without the appropriatecomputational and cartographic resources (although seewww.geowall.org for a description of open-source toolsand applications for many earth science topics), but othermethods of conveying such relationships may confer
14 Journal of Geoscience Education, v. 55, n. 1, January, 2007, p. 5-16

similar benefits (e.g., presenting three-dimensionalmodels that students can examine while simultaneouslybuilding a two-dimensional map of the region). Second,knowledge about students' prior experiences andexpectations with respect to map-related activities mayoffer insight into which students may need extended ordirected map learning activities. This could be especiallyrelevant for classes that involve laboratory-based groupwork, wherein students with different backgrounds allcontribute to the unfolding map lessons. To address this,curricula might offer activities that are designed toengage students in particular sets of relevant experiences(e.g., providing opportunities for outdoors explorationto help build navigational skills and encourage mapfluency). Third, interventions that are novel, in the sensethat they engage students by their perceived 'fun' value(i.e., viewing three-dimensional pictures) might, underthe right conditions, provide a viable methodology fordesigning successful learning interventions. The goal, ofcourse, is to assess whether these methodologies actually derive learning benefits, both in the short-term (e.g.,better understanding of core course concepts for testing)and in the long-term (e.g., motivation to continuestudying course topics and knowledge transfer). Stereovisualization appears to be one engaging method forhelping students visualize information that necessarilyrequires extended practice and skill to comprehend.
Acknowledgements
We are grateful to Panayiota Kendeou and Holly Taylorfor their helpful comments on the ongoing project andearlier versions of the manuscript. We also thank JillBaumtrog, Amy Chen, and Benjamin Friesen for theirassistance in materials development and data collection. This project is based upon work supported by the MarciaEdwards Fund from the University of Minnesota and aResearch and Development mini-grant awarded by theNational Science Foundation to David N. Rapp, as wellas a Fund for the Improvement of PostsecondaryEducation (FIPSE) grant No. P116B030781 from the U.S.Department of Education to Kent Kirkby. Please addresscorrespondence to David N. Rapp, NorthwesternUniversity, 2120 Campus Drive, Evanston, IL, 60208(e-mail: [email protected]).
REFERENCES
Baddeley, A. D., 1992, Working memory, Science, v. 255,p. 556-559.
Baenniger, M. and Newcombe, N., 1989, The role ofexperience in spatial test performance: A metaanalysis, Sex Roles, v. 20, p. 327-345.
Bandura, A., 1997, Self-efficacy: The Exercise of Control,New York, Freeman, 604 p.
Brandes, D., 1983, Sources for relief representationtechniques, The Cartographic Journal, v. 20, p. 87-94.
Brown, L. N., Lahar, C. J., and Mosley, J. L., 1998, Age andgender related differences in strategy use for routeinformation. A map present direction givingparadigm, Environment and Behavior, v. 30, p.123-143.
Caplan, P. J., MacPherson, G. M., and Tobin, P., 1985, Dosex-related differences in spatial abilities exist? Amultilevel critique with new data, AmericanPsychologist, v. 40, p. 786-799.
Chen, T. H., and Davison, M. L., 1996, Amultidimensional scaling, paired comparisons
approach to assessing unidimensionality in theRasch model, In: G. Engelhard and M. Wilson,editors, Objective Measurement: Theory IntoPractice (Vol. 3), Norwood, NJ, Ablex.
Collier, P., Forrest, D., and Pearson, A., 2003, Therepresentation of topographic information on maps:The depiction of relief, The Cartographic Journal, v.40, p. 17-26.
Eley, M.G., 1987, Colour-layering and the performance ofthe topographic map user, Ergonomics, v. 30, p.655-663.
Eley, M. G., 1988, Determining the shapes of landsurfaces from topographic maps, Ergonomics, v. 31,p. 355-376.
Eley, M. G., 1991, Selective encoding in the interpretationof topographic maps, Applied CognitivePsychology, v. 5, p. 403-422.
Geary, D., Gilger, J., Elliot-Miller, B., 1992, Genderdifferences in three-dimensional mentalrotation: A replication, Journal of GeneticPsychology, v. 153, p. 115-117.
Gilhooly, K. J., Wood, M., Kinnear, P. R., and Green, C.,1988, Skill in map reading and memory for maps,Quarterly Journal of Experimental Psychology, v.401A, p. 87-107.
Glenberg, A. M., Gutierrez, T., Levin, J. R., Japuntich, S.,and Kaschak, M. P., 2004, Activity and imaginedactivity can enhance young children's readingcomprehension, Journal of Educational Psychology,v. 96, p. 424-436.
Gonyea, R. M., 2005, Self-reported data in institutionalresearch: Review and recommendations, NewDirections for Institutional Research, v. 127, p. 73-89.
Ishikawa, T., and Kastens, K. A., 2005, Why somestudents have trouble with maps and other spatialrepresentations, Journal of Geoscience Education, v.53, p. 184-197.
Kahneman, D., 1973, Attention and Effort, EnglewoodCliffs, NJ, Prentice-Hall, 246 p.
Kendeou, P., Rapp, D. N., and van den Broek, P., 2004,The influence of readers' prior knowledge on textcomprehension and learning from text, In: R. Nata,editor, Progress in Education (Vol. 13), New York,Nova Science Publishers, Inc., p. 189-209.
Kulhavy, R. W., and Stock, W. A., 1996, How cognitivemaps are learned and remembered, Annals of theAssociation of American Geographers, v. 86, p.123-145.
Langer, M. S., and Bülthoff, H. H., 2000, Depthdiscrimination from shading under diffuse lighting,Perception, v. 29, p. 649-660.
Lawton, C. A., 1994, Gender differences in way-findingstrategies: Relationship to spatial ability and spatialanxiety, Sex Roles, v. 30, 765-779.
Lawton, C. A., Charleston, S. I., and Zieles, A. S., 1996,Individual- and gender-related differences inindoor-wayfinding, Environment and Behavior, v.28, p. 204-219.
Libarkin, J. C., and Kurdziel, J. P., 2001, Strategies forproductive assessment, Journal of GeoscienceEducation, v. 49, p. 300-304.
Liben, L. S., and Downs, R. M., 1989, Understandingmaps as symbols: The development of map conceptsin children, In: H. W. Reese, editor, Advances inChild Development and Behavior (Vol. 22), NewYork, Academic Press, p. 145-201.
Liben, L. S., and Downs, R. M., 1993, Understandingperson-space-map relations: Cartographic and
Rapp et. al - Fostering Students’ Comprehension of Topographic Maps 15

developmental perspectives, DevelopmentalPsychology, v. 29, p. 739-752.
Linn, M. C., and Petersen, A. C., 1985, Emergence andcharacterization of sex differences in spatial ability:A meta-analysis, Child Development, v. 56, p.1479-1498.
Lobben, A. K., 2004, Tasks, strategies, and cognitiveprocesses associated with navigational map reading:A review perspective, The Professional Geographer,v. 56, p. 270-281.
MacEachren, A. M., 1995, How Maps Work:Representation, Visualization, and Design, NewYork, The Guilford Press, 513 p.
Mayer, R. E., 2001, Multimedia Learning, New York,Cambridge University Press, 222 p.
McNamara, T. P., 1986, Mental representation of spatialrelations, Cognitive Psychology, v. 18, p. 87-121.
McNamara, T. P., Hardy, J. K., and Hirtle, S. C., 1989,Subjective hierarchies in spatial memory, Journal ofExperimental Psychology: Learning, Memory, andCognition, v. 15, p. 211-227.
McNamara, T. P., Ratcliff, R., and McKoon, G., 1984, Themental representation of knowledge acquired frommaps, Journal of Experimental Psychology:Learning, Memory, and Cognition, v. 10, p. 723-732.
Montello, D. R., Lovelace, K. L., Golledge, R. G., and Self,C. M., 1999, Sex-related differences and similaritiesin geographic and environmental spatial abilities,Annals of the Association of American Geographers,v. 89, p. 515-534.
Morrow, D.G., Greenspan, S.L., and Bower, G.H., 1987,Accessibility and situation models in narrativecomprehension, Journal of Memory and Language,v. 26, p. 165-187.
Netemeyer, R. G., Bearden, W. O., and Sharma, S., 2003,Scaling Procedures: Issues and Applications,Thousand Oaks, California, Sage Publications, Inc.,224 p.
Paulhus, D. L., Lysy, D. C., and Yik, M. S. M., 1998,Self-report measures of intelligence: Are they usefulas proxy IQ tests?, Journal of Personality, v. 66, p.525-554.
Pellegrino, J. W., Alderton, D. L., and Shute, V. J., 1984,Understanding spatial ability, EducationalPsychology, v. 19, p. 239-253.
Phillips, R. J., 1984, Experimental method in cartographiccommunication: Research on relief maps,Cartographica, v. 21, 120-128.
Phillips, R. J., De Lucia, A., and Skelton, N., 1975, Someobjective tests of the legibility of relief maps, TheCartographic Journal, v. 12, 39-46.
Pick, H. L., Heinrichs, M. R., Montello, D. R., Smith, K.,Sullivan, C. N., and Thompson, W. B., 1995,Topographic map reading, In: P. A. Hancock, J. M.,Flach, J. Caird, and K. J. Vicente, editors, LocalApplications of the Ecological Approach toHuman-machine Systems, Hillsdale, NJ, Erlbaum, p.255-284.
Pohlmann, J. T., and Beggs, D. L., 1974, A study of thevalidity of self-reported measures of academicgrowth, Journal of Educational Measurement, v. 11,p. 115-119.
Potash, L. M., Farrell, J. P., and Jeffrey, T., 1978, Atechnique for assessing map relief legibility, TheCartographic Journal, v. 15, p. 28-35.
Rapp, D. N., 2005, Mental models: Theoretical issues forvisualizations in science education, In J. K. Gilbert,
editor, Visualization in Science Education, TheNetherlands, Springer, p. 43-60.
Rapp, D. N., and Kurby, C. A., in press, The 'ins' and'outs' of learning: Internal representations andexternal visualizations, In J. K. Gilbert, M. Nakhleh,and M. Reiner, editors, Visualization: Theory andPractice in Science Education, The Netherlands,Springer.
Rapp, D. N., and Uttal, D. H., 2006, Understanding andenhancing visualizations: Two models ofcollaboration between earth science and cognitivescience, In: C. Manduca and D. Mogk, editors, Earthand Mind: How Geologists Think and Learn Aboutthe Earth, Boulder, CO, Geological Society ofAmerica Press, p. 121-127.
Rapp, D. N., and van den Broek, P., 2005, Dynamic textcomprehension: An integrative view of reading,Current Directions in Psychological Science, v. 14, p.276-279.
Shimron, J., 1978, Learning positional information frommaps, The American Cartographer, v. 5, p. 9-19.
Schofield, N. J., and Kirby, J. R., 1994, Position location ontopographical maps: Effects of task factors, training,and strategies, Cognition and Instruction, v. 12, p.35-60.
Shurtleff, M., and Geiselman, R. E., 1986, Ahuman-performance based evaluation oftopographic maps and map symbols with novicemap users, The Cartographic Journal, v. 23, 52-55.
Stevens, A., and Coupe, P., 1978, Distortions in judgedspatial relations, Cognitive Psychology, v. 10, p.422-437.
Taylor, H. A., Naylor, S. J., and Chechile, N. A., 1999,Goal-directed influences on the representation ofspatial perspective. Memory and Cognition, v. 27, p.309-319.
Taylor, H. A., Renshaw, C. E., and Choi, E., 2004, Theeffect of multiple formats on understanding complexvisual displays, Journal of Geoscience Education, v.52, p. 115-121.
Taylor, H. A., and Tversky, B., 1992, Spatial mentalmodels derived from survey and route descriptions,Journal of Memory and Language, v. 31, p. 261-282.
Taylor, H. A., and Tversky, B., 1996, Perspective inspatial descriptions, Journal of Memory andLanguage, v. 35, p. 371-391.
Thorndyke, P. W., and Stasz, C., 1980, Individualdifferences in procedures for knowledge acquisitionfrom maps, Cognitive Psychology, v. 12, p. 137-175.
Tlauka, M., Brolese, A., Pomeroy, D., and Hobbs, W.,2005, Gender differences in spatial knowledgeacquired through simulated exploration of a virtualshopping centre, Journal of EnvironmentalPsychology, v. 25, p. 111-118.
Tversky, B., 2000, What maps reveal about spatialthinking, Developmental Science, v. 3, p. 281-282.
Tversky, B, Zacks, J., Lee, P. U., and Heiser, J., 2000,Lines, blobs, crosses, and arrows: Diagrammaticcommunication with schematic figures, In: M.Anderson, P. Cheng, and V. Haarslev, editors,Theory and Application of Diagrams, Berlin,Springer, p. 221-230.
Uttal, D. H., 2000, Seeing the big picture: Map use and thedevelopment of spatial cognition, DevelopmentalScience, v. 3, p. 247-286.
16 Journal of Geoscience Education, v. 55, n. 1, January, 2007, p. 5-16