foster care needs assessment july 2019
TRANSCRIPT
Foster Care Needs Assessment
July 2019

Texas Foster Care Needs Assessment (August 2019)
2
Contents Executive Summary ....................................................................................... 3
Maximizing Placements with Kinship Caregivers .............................................. 4
Facilitating More Effective and Efficient Use of Existing Foster Care Capacity ....... 5
Supporting Capacity for Higher Needs Children ............................................... 5
Financial Incentives for Contracted Providers Who Build Needed Capacity .......... 6
CPS Staff Who Support Contracted Provider Capacity Building Efforts ................ 7
Data on Substitute Care Demand and Supply .................................................... 7
Placement with Kinship Caregivers ................................................................... 8
Non-Relative Foster Care ................................................................................ 9
Estimated Daily Demand and Supply for Basic and Moderate Service Levels ....... 9
Demand and Supply for Specialized and Intense Service Levels ...................... 10
Emergency Shelter Capacity ....................................................................... 11
Supervised Independent Living (SIL) ........................................................... 12
Leveraging Existing Foster Care Capacity ..................................................... 13
Conclusion .................................................................................................. 14
Appendix A – Service Level and Placement Type Descriptions ............................ 15
Appendix B – Methodology for Estimating Daily Non-Relative Foster Care Demand and Supply .................................................................................................. 18
Appendix C – CBC Catchment Areas ............................................................... 20
Appendix D – Forecasted Non-Relative Foster Care Daily Demand ...................... 21
Appendix E – Youth 14 and Older ................................................................... 25
Appendix F – Children per Foster Home with Basic or Moderate Service Levels .... 26
Appendix G – Children per Foster Home with Higher Needs ............................... 27
Appendix H - DFPS and Contracted CPA Foster Homes ...................................... 28
Appendix I – Cross Catchment Placements ...................................................... 30
Texas Foster Care Needs Assessment (August 2019)
3
Executive Summary In accordance with Senate Bill 11 (85th Texas Legislature, 2017), Department of Family and Protective Services (DFPS) Child Protective Services (CPS) Regional Directors must use data DFPS collects on substitute care needs and availability to develop an annual, collaborative, regional substitute care capacity needs plan for areas in which Community-Based Care (CBC) has not been implemented. Using the data from the 2017 and 2018 DFPS needs assessment reports, the regions created and published on the DFPS website their first annual, collaborative capacity strategic plans in Fall 2018. To help regions further refine these plans going forward and to give contracted providers the data they need to build capacity, this report provides a forecast for daily demand for substitute care through Fiscal Year 2021 and an estimated daily current supply, along with some additional insights and information around capacity. With the goal to place more children in family settings that are close to their home, the analysis in this report indicates that to the following is needed:
• Safely placing as many children as possible with relatives. Relative placements not only keep children with family, they reduce the need for non-relative foster care.
• More foster home capacity across the state for: o youth 14 and older with basic and moderate service levels; o for all higher needs children and youth; and o in rural areas, capacity for all ages and service levels.
Building capacity depends largely on contracted provider efforts. Contracted providers develop and manage 90 percent of all foster homes across the state, all foster homes for higher needs children, and all congregate care. To support contracted providers in understanding and using the information in this needs assessment, each Regional Director will be hosting a regional strategic capacity building meeting including not only foster care providers but local faith-based entities, child advocates, and other organizations as well. In these meetings the Regional Director will facilitate a collaborative discussion about the data in this needs assessment and any needed revisions or updates to last year’s regional strategic capacity building plan. Updated regional strategic capacity building plans will be published on the DFPS website. Through these meetings and other collaborative efforts, DFPS will continue to partner with contracted providers and other stakeholders to address substitute care capacity needs by identifying and expanding strategies that are working, changing or discontinuing those that are not and exploring and incorporating new strategies, as appropriate.

Texas Foster Care Needs Assessment (August 2019)
4
DFPS Strategies for Substitute Care Capacity in Non-CBC Areas Child Protective Services’ primary goal for substitute care is to place as many children as possible close to home in safe, family settings that can care for the child until they can safely reunite with their family, or achieve permanency through adoption or the transfer of custody to a relative. Whenever possible, CPS places children in substitute care with a relative or kinship caregiver. For children in foster care, the goal is to place in a foster home close to their own home whenever possible. For those in foster care who require a higher level of supervision and services, CPS seeks placements that will meet their therapeutic needs. In addition to the annual regional strategic plans, DFPS has implemented several statewide initiatives to support its substitute care goals.
As discussed below, CPS provides a range of support for contracted providers to build needed capacity, including the data and analysis in this report. CPS also directly develops and manages a limited number of foster homes, primarily in rural areas for children with basic service levels through the agency’s foster and adoptive home development (FAD) division. Data about FAD homes is in Appendix H.
Maximizing Placements with Kinship Caregivers To build capacity for kinship placements, CPS provides direct financial support for the child’s care. Kinship caregivers who want to be foster parents are verified through a Child Placing Agency (CPA) or through DFPS and are provided training and support. For kinship caregivers who are not verified as foster parents, CPS conducts background checks and a home study. Additionally, approximately 200 CPS Kinship staff provide ongoing support and training. CPS also has dedicated staff that monitor and respond to questions and issues kinship caregivers send to a designated e-mail box.
Other CPS initiatives to support kinship placements include:
• Regular communication with kinship caregivers about options available for training financial and other supports (reinforced by HB 1884, 85th Legislature)
• Partnering with Texas Court Appointed Special Advocates (CASA) to support Collaborative Family Engagement which helps identify, locate, and engage family members and other caring adults so they are involved in the child’s care and permanency planning.

Texas Foster Care Needs Assessment (August 2019)
5
• Quarterly meetings with the Kinship Collaboration Group, which includes kinship caregivers who help CPS improve the kinship program by identifying ways to better support kinship placements.
• Working to create and sustain monthly kinship support groups in each region. These groups are led by former kinship caregivers and provide information and support to current caregivers.
• Improving timeliness of out-of-state relative/kinship homes studies and placements to keep children with families and support permanency.
Facilitating More Effective and Efficient Use of Existing Foster Care Capacity Precisely determining what foster care capacity is available on any given day can be a challenge. Foster homes and facilities are often verified for the maximum number of placements and to take children and youth across a variety of ages and service levels. For various reasons, however, foster parents and facilities may only accept a limited number of children or children within a certain age range or service level. These reasons may be related to the needs of children already in their care or other issues related to a particular foster family’s circumstances. Moreover, other agencies, such as the juvenile justice system or federal government, other states, and private individuals may be placing children with the same contractors CPS uses. Or, for a myriad of reasons, foster parents may be unavailable for placement for a period of time.
DFPS is developing a Child Placement Portal (”portal”) that will allow CPS to more effectively and efficiently use existing foster care capacity. Once implemented, the portal will be updated in near real-time with current vacancy information supplied by contracted providers. The portal will also include information about the potential placements so CPS staff can better match children to the most suitable placement. It is anticipated the portal will be completed by October 2019.
Supporting Capacity for Higher Needs Children To increase capacity for higher needs children who are historically the most difficult to place, DFPS created the Temporary Emergency Placement (TEP) program in June 2017. The TEP program provides emergency, short-term, highly structured quality residential care and services for children while CPS placement staff continue searching for a more suitable and longer-term placement. This is a no eject/no reject program. Participating providers have

Texas Foster Care Needs Assessment (August 2019)
6
specialized training and experience serving high needs children in substitute care. DFPS purchased 20 beds from four providers across Texas who provide emergency care, including 24-hour supervision to ensure child safety, frequent one-to-one monitoring, an inter-disciplinary meeting within 24 hours of admission to discuss the child’s needs/ daily observation notes/ weekly progress notes/ and immediate on-site crisis response. The TEP program served 353 children and youth in FY 18.
In 2018, to encourage contracted CPAs to build capacity for younger children with higher needs and to incentivize Residential Treatment Centers (RTCs) to accept children and youth who might otherwise be difficult to place, DFPS expanded the service levels to include Treatment Foster Family Care and Intense Plus.
Treatment Foster Family Care (TFFC) is designed to provide intensive services to children in a highly structured home environment, often as an alternative to RTC placement. The TFFC program is available for children and youth ages 10 and younger who have mental health and/or socio-behavioral needs that cannot be met in traditional foster care settings. The program includes innovative, multi-disciplinary treatment services that are evidenced-based and research-supported. It is a time-limited program intended to stabilize and prepare children for successful transition into less restrictive or permanent placements. Under the program, foster parents and contractors receive a higher reimbursement but have additional expectations such as more training, more frequent treatment plan reviews, and ongoing support following discharge. As of April 2019, DFPS had contracts with three TFFC providers, with TFFC homes across regions 1, 3, 6, 7, 8, and 11.1
The Intense Plus service level is available for children placed in RTCs. Caregivers must have specialized training specific to the child’s needs and clinical staff must have professional licensure or graduate level education to provide therapeutic services, intense therapeutic supports and interventions.
In addition, over the past year DFPS has partnered with providers, the Texas Alliance for Children and Families and Casey Family Programs on regional meetings around capacity building to discuss barriers and opportunities.
Financial Incentives for Contracted Providers Who Build Needed Capacity Senate Bill 11 directs DFPS to provide financial incentives for non-CBC contracted residential child-care providers who exceed specified performance outcomes. During Fiscal Year 2020, DFPS plans to implement financial incentives for non-CBC contracted providers who increase needed capacity.

Texas Foster Care Needs Assessment (August 2019)
7
Consistent with the shift to performance based contracting, the incentive structure empowers contracted providers to determine how to best meet this goal.
CPS Staff Who Support Contracted Provider Capacity Building Efforts In addition to the FAD and Kinship staff discussed previously in this report, a dedicated CPS capacity building specialist supports prospective and existing contracted providers. The specialist helps them navigate the licensing and contractual process, use and understand the data on needed capacity, and, for individuals interested in becoming a foster parent, connect them with CPAs in their area. CPS faith-based specialists also support contracted providers by working with local congregations to provide information to members about the needs of children and families in their area and how to become a foster parent. As of Fiscal Year 2018, CPS had partnerships with 1,199 faith communities.
Data on Substitute Care Demand and Supply There are many different approaches and methodologies to estimate substitute care demand and supply. As contracted providers are primarily responsible for developing new capacity, CPS met with them to determine how best to support their capacity-building efforts. Based on feedback from providers, this analysis estimates demand as the daily number of children ages 0-21 in substitute care for Fiscal Year 2019 through Fiscal Year 2021, and estimates current daily substitute care supply by beds that are filled for each placement type. For non-related foster care, demand and supply are further delineated by service level. A detailed description of the different service levels and placement types is in Appendix A. A detailed description of the methodology for determining daily demand and supply is in Appendix B.
Pursuant to Senate Bill 11, this report focuses on areas where CBC has not yet been implemented. To align with CBC and support future CBC roll outs, however, the analysis looks at data based on the proposed CBC catchment areas.2 Appendix C includes a description of the counties assigned to each catchment area and areas in which CBC Stage 1 has rolled out. More information about CBC is available on the DFPS public website.
Data on forecasted demand and estimated existing supply for relative placements and non-relative foster care is summarized below. Appendices D through I include additional detail on (1) existing foster care supply and forecasted non-relative foster care demand by service level, and for youth

Texas Foster Care Needs Assessment (August 2019)
8
ages 14 and older, (2) data on cross-catchment foster care placements, and (3) data on DFPS and contracted CPA foster homes.
Placement with Kinship Caregivers Across most catchment areas, more than 40 percent of children in substitute care are placed with a kinship caregiver. The most common placement is with a kinship caregiver who is not a verified foster parent. Increases in relative placements reduces the need for non-relative foster care, especially for children with a basic or moderate service level. While it may not have a significant impact on the number of higher needs children needing a non-relative foster care placement, increases in relative placements does make the proportion of higher needs children in non-relative foster care higher.
The rate of relative placements is currently forecasted to remain stable through Fiscal Year 2021.
Table 1: Estimated Daily Number of Children Placed with Relatives in FY 20183
Catchment
Children in Unverified
Kinship Placements
Children in
Kinship Foster Care
Total in
Substitute Care
Rate of Kinship
Placement 1 727 45 1,855 42% 3a 574 70 1,509 43% 3c 1,296 194 3,079 48% 4 862 70 1,968 47% 5 503 50 1,234 45% 6a 1,096 236 3,725 36% 6b 714 96 1,615 50% 7a 1,374 108 2,504 59% 7b 953 59 1,761 57% 8b 478 109 1,296 45% 9 337 35 879 42% 10 110 2 362 31% 11a 418 33 1,207 37% 11b 386 45 1,032 42% Statewide non-CBC 9,828 1,152 24,026 46%

Texas Foster Care Needs Assessment (August 2019)
9
Non-Relative Foster Care The number and service level mix of children in non-relative foster care is forecasted to remain relatively stable through Fiscal Year 2021. As illustrated in Chart 1, only catchment areas 1, 4, and 11a are forecasted to grow more than 5 percent from Fiscal Year 2018 to Fiscal Year 2021. If catchment areas can increase the rate of kinship placements, the forecasted need for non-relative foster care will be reduced.
Chart 1: Estimated Daily Number of Children in Non-Relative Foster Care by Service Level4
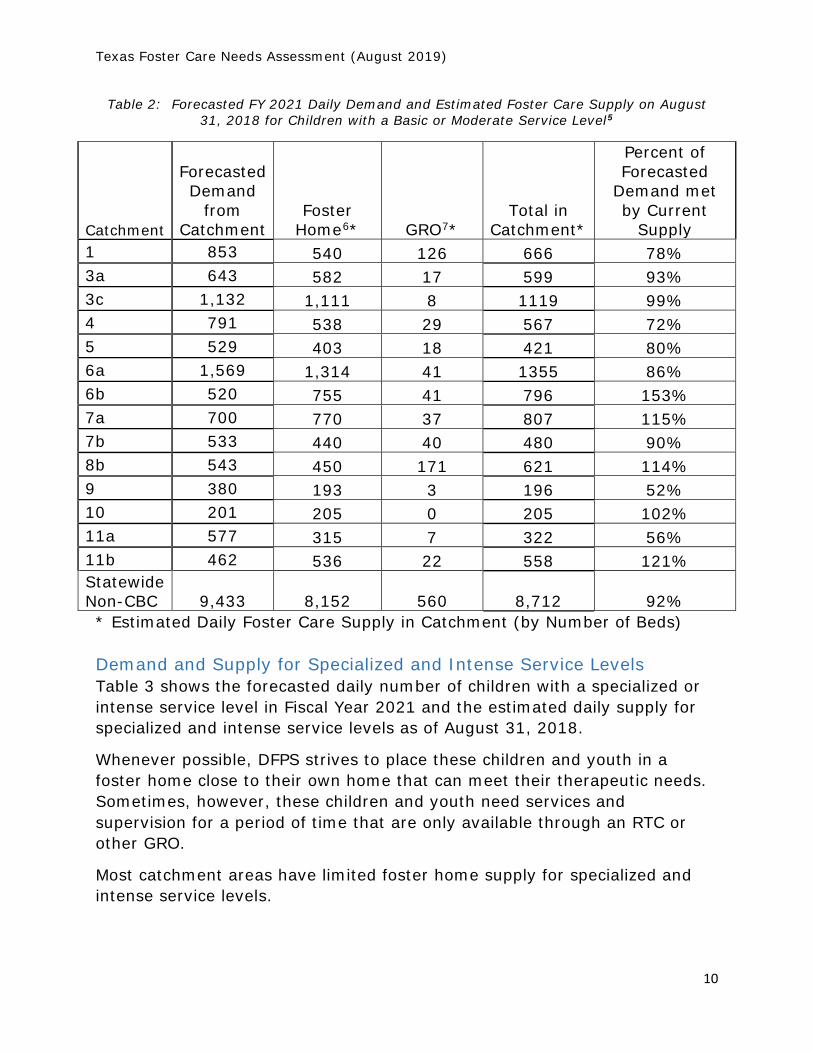
Estimated Daily Demand and Supply for Basic and Moderate Service Levels Table 2 shows the forecasted daily number of children with a basic or moderate service level in Fiscal Year 2021 and the estimated daily supply for basic and moderate service levels as of August 31, 2018.
DFPS strives to place children with a basic or moderate service level whenever possible in a foster home. If that’s not possible, CPS does use other General Residential Operations (GROs) (not an RTC or emergency shelter) that can provide as much of a home like setting as possible.
Catchment areas 3a, 3c, 6b, 7a, 10, and 11b are close to or have sufficient current foster home supply to meet the forecasted demand from their areas.
Texas Foster Care Needs Assessment (August 2019)
10
Table 2: Forecasted FY 2021 Daily Demand and Estimated Foster Care Supply on August 31, 2018 for Children with a Basic or Moderate Service Level5
Catchment
Forecasted Demand
from Catchment
Foster Home6* GRO7*
Total in Catchment*
Percent of Forecasted
Demand met by Current
Supply 1 853 540 126 666 78% 3a 643 582 17 599 93% 3c 1,132 1,111 8 1119 99% 4 791 538 29 567 72% 5 529 403 18 421 80% 6a 1,569 1,314 41 1355 86% 6b 520 755 41 796 153% 7a 700 770 37 807 115% 7b 533 440 40 480 90% 8b 543 450 171 621 114% 9 380 193 3 196 52% 10 201 205 0 205 102% 11a 577 315 7 322 56% 11b 462 536 22 558 121% Statewide Non-CBC 9,433 8,152 560 8,712 92% * Estimated Daily Foster Care Supply in Catchment (by Number of Beds) Demand and Supply for Specialized and Intense Service Levels Table 3 shows the forecasted daily number of children with a specialized or intense service level in Fiscal Year 2021 and the estimated daily supply for specialized and intense service levels as of August 31, 2018.
Whenever possible, DFPS strives to place these children and youth in a foster home close to their own home that can meet their therapeutic needs. Sometimes, however, these children and youth need services and supervision for a period of time that are only available through an RTC or other GRO.
Most catchment areas have limited foster home supply for specialized and intense service levels.

Texas Foster Care Needs Assessment (August 2019)
11
Table 3: Forecasted Daily Demand for FY 2021 and Estimated Foster Care Supply on August 31, 2018 for Children with a Specialized or Intense Level of Care8
Catchment
Forecasted Demand
from Catchment
Foster Home9* GRO10* RTC11*
Total in Catchment*
Percent of Forecasted Demand met by Current Foster Home Supply
1 180 31 11 58 100 17% 3a 154 40 2 26 68 26% 3c 297 179 2 70 251 60% 4 226 61 27 71 159 27% 5 111 23 5 10 38 21% 6a 480 208 28 339 575 43% 6b 216 192 11 220 423 89% 7a 219 104 0 87 191 47% 7b 146 20 4 158 182 14% 8b 156 46 24 143 213 29% 9 110 3 1 0 4 3% 10 38 12 0 0 12 32% 11a 156 20 0 0 20 13% 11b 94 78 3 2 83 83%
Statewide Non-CBC 2,583 1,017 118 1,184 2,319 39%
* Estimated Daily Foster Care Supply in Catchment (by Number of Beds)
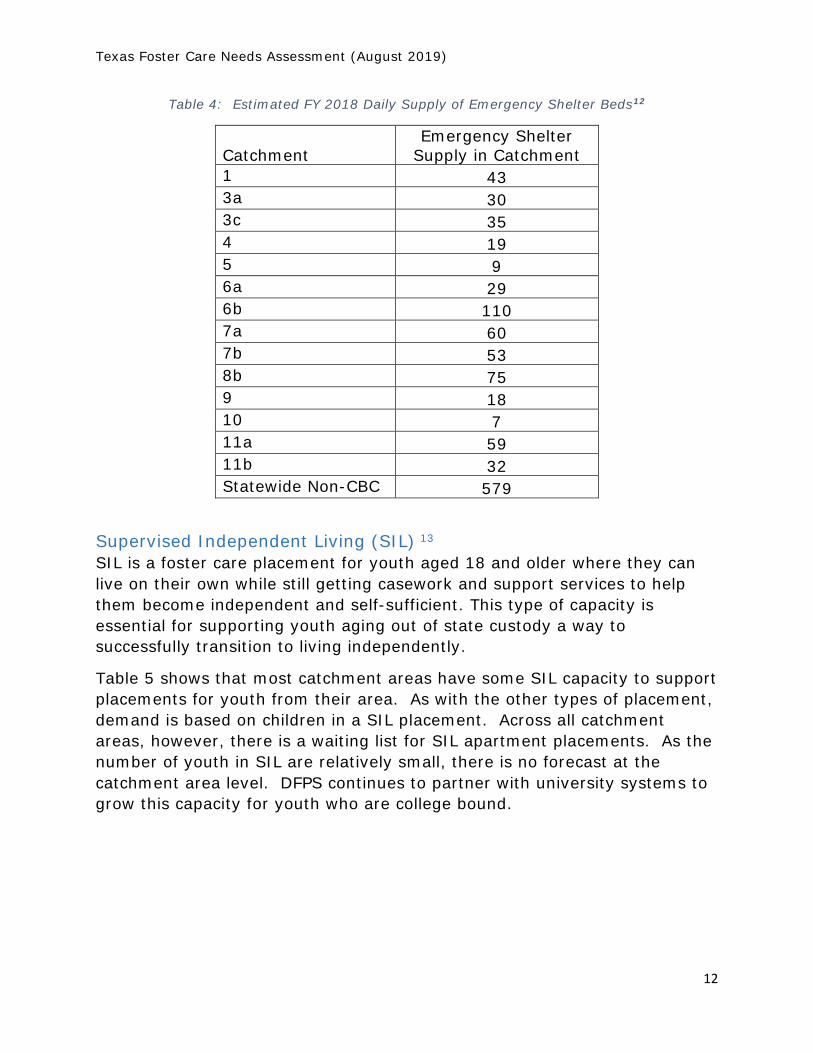
Emergency Shelter Capacity An emergency shelter is a temporary placement, generally less than 90 days, where a child stays until a more permanent placement is found. This type of capacity is needed as part of the continuum of care, but generally is not considered long-term placement capacity.
Table 4 shows that every catchment area has some emergency shelter capacity with a slight concentration in 6b. Most children placed in an emergency shelter have a basic or moderate service level. To the extent needed foster home capacity is built, the need for emergency shelter capacity should decline.
Texas Foster Care Needs Assessment (August 2019)
12
Table 4: Estimated FY 2018 Daily Supply of Emergency Shelter Beds12
Catchment Emergency Shelter
Supply in Catchment 1 43 3a 30 3c 35 4 19 5 9 6a 29 6b 110 7a 60 7b 53 8b 75 9 18 10 7 11a 59 11b 32 Statewide Non-CBC 579
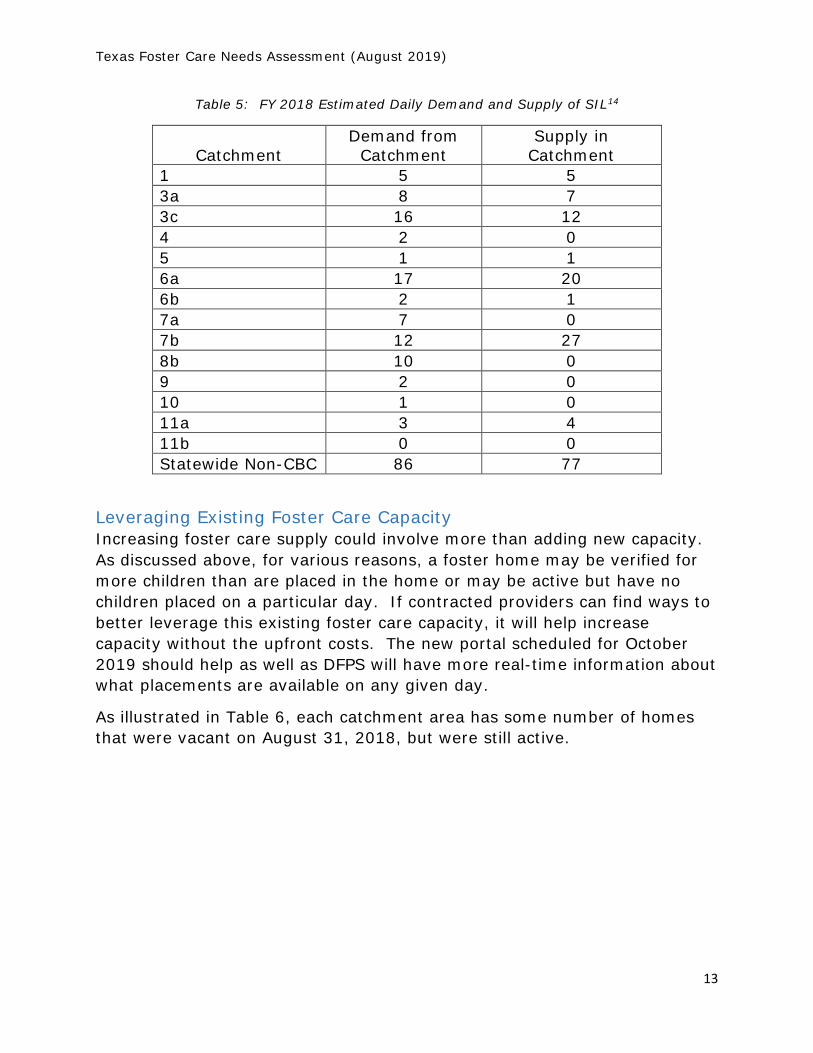
Supervised Independent Living (SIL) 13 SIL is a foster care placement for youth aged 18 and older where they can live on their own while still getting casework and support services to help them become independent and self-sufficient. This type of capacity is essential for supporting youth aging out of state custody a way to successfully transition to living independently.
Table 5 shows that most catchment areas have some SIL capacity to support placements for youth from their area. As with the other types of placement, demand is based on children in a SIL placement. Across all catchment areas, however, there is a waiting list for SIL apartment placements. As the number of youth in SIL are relatively small, there is no forecast at the catchment area level. DFPS continues to partner with university systems to grow this capacity for youth who are college bound.
Texas Foster Care Needs Assessment (August 2019)
13
Table 5: FY 2018 Estimated Daily Demand and Supply of SIL14
Catchment Demand from
Catchment Supply in
Catchment 1 5 5 3a 8 7 3c 16 12 4 2 0 5 1 1 6a 17 20 6b 2 1 7a 7 0 7b 12 27 8b 10 0 9 2 0 10 1 0 11a 3 4 11b 0 0 Statewide Non-CBC 86 77
Leveraging Existing Foster Care Capacity Increasing foster care supply could involve more than adding new capacity. As discussed above, for various reasons, a foster home may be verified for more children than are placed in the home or may be active but have no children placed on a particular day. If contracted providers can find ways to better leverage this existing foster care capacity, it will help increase capacity without the upfront costs. The new portal scheduled for October 2019 should help as well as DFPS will have more real-time information about what placements are available on any given day.
As illustrated in Table 6, each catchment area has some number of homes that were vacant on August 31, 2018, but were still active.

Texas Foster Care Needs Assessment (August 2019)
14
Table 6: Active Foster Homes that Were Vacant on August 31, 2018 but Had Children Placed in Last Year15
Catchment
Basic and Moderate in Catchment
Basic and Moderate for Youth 14+ in Catchment
Specialized and Intense in Catchment
1 99 13 13 3a 191 13 8 3c 223 20 25 4 107 8 7 5 42 2 1 6a 245 16 18 6b 179 15 15 7a 185 17 10 7b 167 9 10 8b 121 8 8 9 46 5 3 10 14 3 1 11a 47 3 1 11b 72 11 15
Statewide Non-CBC 1,738 143 135
Conclusion Throughout this report, DFPS has provided extensive data and information about forecasted daily substitute care demand and estimated daily current substitute care supply. DFPS will continue to partner with contracted providers and other stakeholders to address substitute care capacity needs by identifying and expanding strategies that are working, changing or discontinuing those that are not and exploring and incorporating new strategies, as appropriate.

Texas Foster Care Needs Assessment (August 2019)
15
Appendix A – Service Level and Placement Type Descriptions Service Levels
The basic service level consists of a supportive setting, preferably in a family, that is designed to maintain or improve the child's functioning, including:
• Routine guidance and supervision to ensure the child's safety and sense of security;
• Affection, reassurance, and involvement in activities appropriate to the child's age and development to promote the child's well-being;
• Contact, in a manner that is deemed in the best interest of the child, with family members and other persons significant to the child to maintain a sense of identity and culture; and
• Access to therapeutic, habilitative, and medical intervention and guidance from professionals or paraprofessionals, on an as-needed basis, to help the child maintain functioning appropriate to the child's age and development.
The moderate service level consists of a structured supportive setting, preferably in a family, in which most activities are designed to improve the child's functioning including:
• More than routine guidance and supervision to ensure the child's safety and sense of security;
• Affection, reassurance, and involvement in structured activities appropriate to the child's age and development to promote the child's well-being;
• Contact, in a manner that is deemed in the best interest of the child, with family members and other persons significant to the child to maintain a sense of identity and culture; and
• Access to therapeutic, habilitative, and medical intervention and guidance from professionals or paraprofessionals to help the child attain or maintain functioning appropriate to the child's age and development.
• In addition to the description in the section above, a child with primary medical or habilitative needs may require intermittent interventions from a skilled caregiver who has demonstrated competence.
The specialized service level consists of a treatment setting, preferably in a family, in which caregivers have specialized training to provide therapeutic, habilitative, and medical support and interventions including:

Texas Foster Care Needs Assessment (August 2019)
16
• 24-hour supervision to ensure the child's safety and sense of security, which includes close monitoring and increased limit setting;
• Affection, reassurance, and involvement in therapeutic activities appropriate to the child's age and development to promote the child's well-being;
• Contact, in a manner that is deemed in the best interest of the child, with family members and other persons significant to the child to maintain a sense of identity and culture; and
• Therapeutic, habilitative, and medical intervention and guidance that is regularly scheduled and professionally designed and supervised to help the child attain functioning appropriate to the child's age and development.
• In addition to the description in the section above, a child with primary medical or habilitative needs may require regular interventions from a caregiver who has demonstrated competence
The intense service level consists of a high degree of structure, preferably in a family, to limit the child's access to environments as necessary to protect the child. The caregivers have specialized training to provide intense therapeutic and habilitative supports and interventions with limited outside access, including:
• 24-hour supervision to ensure the child's safety and sense of security, which includes frequent one-to-one monitoring with the ability to provide immediate on-site response;
• Affection, reassurance, and involvement in therapeutic activities appropriate to the child's age and development to promote the child's well-being;
• Contact, in a manner that is deemed in the best interest of the child, with family members and other persons significant to the child, to maintain a sense of identity and culture;
• Therapeutic, habilitative, and medical intervention and guidance that is frequently scheduled and professionally designed and supervised to help the child attain functioning more appropriate to the child's age and development; and
• Consistent and frequent attention, direction, and assistance to help the child attain stabilization and connect appropriately with the child's environment.
• In addition to the supports and interventions listed in the section above:
• Children with intellectual or developmental disabilities needs require professionally directed, designed and monitored

Texas Foster Care Needs Assessment (August 2019)
17
interventions to enhance mobility, communication, sensory, motor, and cognitive development, and self-help skills; and
• Children with primary medical or habilitative needs require frequent and consistent interventions. The child may be dependent on people or technology for accommodation and require interventions designed, monitored, or approved by an appropriately constituted interdisciplinary team.
Included in the intense service level is the intensive psychiatric treatment program (IPTP). IPTP offers a short-term mental health treatment and placement option for children in DFPS conservatorship with acute, intensive psychiatric needs at the time of release from a psychiatric hospitalization or as an alternative to a psychiatric hospitalization. The purpose is to provide enriched services and supports to stabilize children and youth and promote successful transitions to less restrictive placements.
Children can also be placed in foster care through a Child Specific Contract (CSC). A CSC is used when placement through the service level structure is not available.
Placement Types
The different placement types include placements with relatives, non-relative foster homes, emergency shelters, RTCs, and other GROs. An emergency shelter refers to a type of GRO that is a temporary placement where a child stays until a more permanent placement is found. An RTC is a type of GRO that exclusively provides 24-hour care, supervision and treatment services for seven or more children or youth with emotional disorders. Other GROs also provide 24-hour care, supervision and services to seven or more children or youth, but they are not necessarily limited to those with emotional disorders. Supervised Independent Living (SIL) is a foster care placement for youth aged 18 and older where they can live on their own while still getting casework and support services to help them become independent and self-sufficient.

Texas Foster Care Needs Assessment (August 2019)
18
Appendix B – Methodology for Estimating Daily Non-Relative Foster Care Demand and Supply The demand and supply of substitute care on any given day is influenced by a myriad of factors that change over time, making an exact estimate or forecast virtually impossible. To align with the DFPS databook and other reporting, this analysis uses children age 0-21 in substitute care on August 31, 2018 from each catchment area to estimate the daily substitute care. Estimated daily demand for non-relative foster care is further delineated by a child’s service level on August 31, 2018. For the purposes of this analysis, all CSCs and IPTPs are excluded from the counts of children with basic, moderate, specialized and intense service levels.
To estimate the change in demand through Fiscal Year 2021, this analysis uses the DFPS forecast methodology used for reporting to the Legislative Budget Board (LBB) to ensure consistency in approach. The forecasting model incorporates historic trends, as well as expected changes in removals and length of stay, and estimates for each catchment area monthly relative placements and foster care by service level. For Fiscal Year 2020-2021, the current forecast assumes a stabilization in trends so that changes in the number of children in each level of care generally tracks changes in the overall child population. The forecast is updated quarterly and the one used for this analysis is from the second quarter of Fiscal Year 2019 incorporating data through December 2018. Each catchment areas was forecasted separately using historical data from that area.
To calculate the forecasted daily number of children needing a placement through Fiscal Year 2021, this analysis used the percentage change in the forecast from August to August of each fiscal year and multiplied that by the number of children in each level of care on August 31 for the prior fiscal year. For example, the forecasted number of children with a basic service level for Fiscal Year 2019 was calculated by multiplying the rate of change from the forecast for children with a basic service level from August 2018 to August 2019 by the number of children with a basic service level on August 31, 2018.
The forecast does not include a break out by age. As a result, for youth age 14 or older with a basic or moderate service level, this analysis uses the growth rates in the forecast for basic and moderate service levels overall.
The forecast used for this analysis does not include any assumptions as to the impact of TFFC or IP as these service levels are relatively new. Once TFFC and IP roll out and perform as expected, DFPS anticipates it will reduce

Texas Foster Care Needs Assessment (August 2019)
19
the demand for specialized, intense, and CSC placements and increase the demand for moderate placements.
To estimate the daily supply of relative beds and non-relative foster care beds in Fiscal year 2018 and align with the estimate of daily demand, this analysis uses beds filled by children and youth age 0-21 on August 31, 2018 in each catchment area by service level. Given the special and limited circumstances for IPTP and CSC placements, the count of supply excludes these placements.

Texas Foster Care Needs Assessment (August 2019)
20
Appendix C – CBC Catchment Areas Catchment County Name 1
Armstrong, Bailey, Briscoe, Carson, Castro, Childress, Cochran, Collingsworth, Crosby, Dallam, Deaf Smith, Dickens, Donley, Floyd, Garza, Gray, Hale, Hall, Hansford, Hartley, Hemphill, Hockley, Hutchinson, King, Lamb, Lipscomb, Lubbock, Lynn, Moore, Motley, Ochiltree, Oldham, Parmer, Potter, Randall, Robert, Sherman, Swisher, Terry, Wheeler, Yoakum
2 Archer, Baylor, Brown, Callahan, Clay, Coleman, Comanche, Cottle, Eastland, Fisher, Foard, Hardeman, Haskell, Jack, Jones, Kent, Knox, Mitchell ,Montague, Nolan, Runnels, Scurry, Shackelford, Stephens, Stonewall, Taylor, Throckmorton, Wichita, Wilbarger, Young
3A Collin, Cooke, Denton, Fannin, Grayson, Hunt, Wise,
3B Erath, Hood, Johnson, Palo Pinto, Parker, Somervell, Tarrant,
3C Rockwall, Dallas, Ellis, Kaufman, Navarro
4 Anderson, Bowie, Camp, Cass, Cherokee, Delta, Franklin, Gregg, Harrison, Henderson, Hopkins, Lamar, Marion, Morris, Panola, Rains, Red, River, Rusk, Smith, Titus, Upshur, Van Zandt, Wood
5 Angelina, Hardin, Houston, Jasper, Jefferson, Nacogdoches, Newton, Orange, Polk, Sabine, San Augustine, San Jacinto, Shelby, Trinity, Tyler
6A Harris 6B
Austin, Brazoria, Chambers, Colorado, Fort Bend, Galveston, Liberty, Matagorda, Montgomery, Walker, Waller, Wharton
7A
Bell, Bosque, Brazos, Coryell, Falls, Freestone, Grimes, Hamilton, Hill, Lampasas, Leon, Limestone, Llano, Madison, McLennan, Milam, Mills, Robertson, San Saba, Williamson
7B Bastrop, Blanco, Burleson, Burnet, Caldwell, Fayette, Hays, Lee, Travis, Washington
8A Bexar 8B
Atascosa, Bandera, Calhoun, Comal, De Witt, Dimmit, Edwards, Frio, Gillespie, Goliad, Gonzales, Guadalupe, Jackson, Karnes, Kendall, Kerr, Kinney, La Salle, Lavaca, Maverick, Medina, Real, Uvalde, Val Verde, Victoria, Wilson, Zavala
9 Andrews, Borden, Coke, Concho, Crane, Crockett, Dawson, Ector, Gaines, Glasscock, Howard, Irion, Kimble, Loving, Martin, Mason, McCulloch, Menard, Midland, Pecos, Reagan, Reeves, Schleicher, Sterling, Sutton, Terrell, Tom Green, Upton, Ward, Winkler
10 Brewster, Culberson, El Paso, Hudspeth, Jeff Davis, Presidio 11A Aransas, Bee, Brooks, Duval, Jim Wells, Kenedy, Kleberg, Live
Oak, McMullen, Nueces, Refugio, San Patricio, Webb 11B Cameron, Hidalgo, Jim Hogg, Starr, Willacy, Zapata
Texas Foster Care Needs Assessment (August 2019)
21
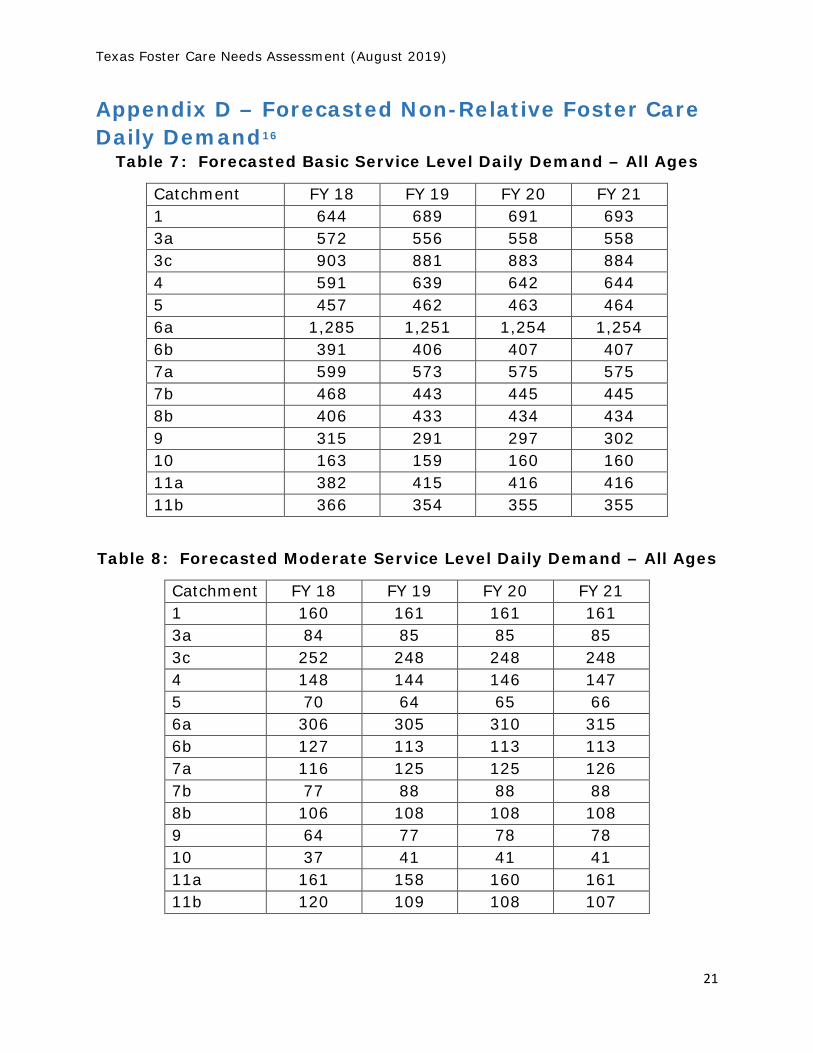
Appendix D – Forecasted Non-Relative Foster Care Daily Demand16
Table 7: Forecasted Basic Service Level Daily Demand – All Ages
Catchment FY 18 FY 19 FY 20 FY 21 1 644 689 691 693 3a 572 556 558 558 3c 903 881 883 884 4 591 639 642 644 5 457 462 463 464 6a 1,285 1,251 1,254 1,254 6b 391 406 407 407 7a 599 573 575 575 7b 468 443 445 445 8b 406 433 434 434 9 315 291 297 302 10 163 159 160 160 11a 382 415 416 416 11b 366 354 355 355
Table 8: Forecasted Moderate Service Level Daily Demand – All Ages
Catchment FY 18 FY 19 FY 20 FY 21 1 160 161 161 161 3a 84 85 85 85 3c 252 248 248 248 4 148 144 146 147 5 70 64 65 66 6a 306 305 310 315 6b 127 113 113 113 7a 116 125 125 126 7b 77 88 88 88 8b 106 108 108 108 9 64 77 78 78 10 37 41 41 41 11a 161 158 160 161 11b 120 109 108 107
Texas Foster Care Needs Assessment (August 2019)
22
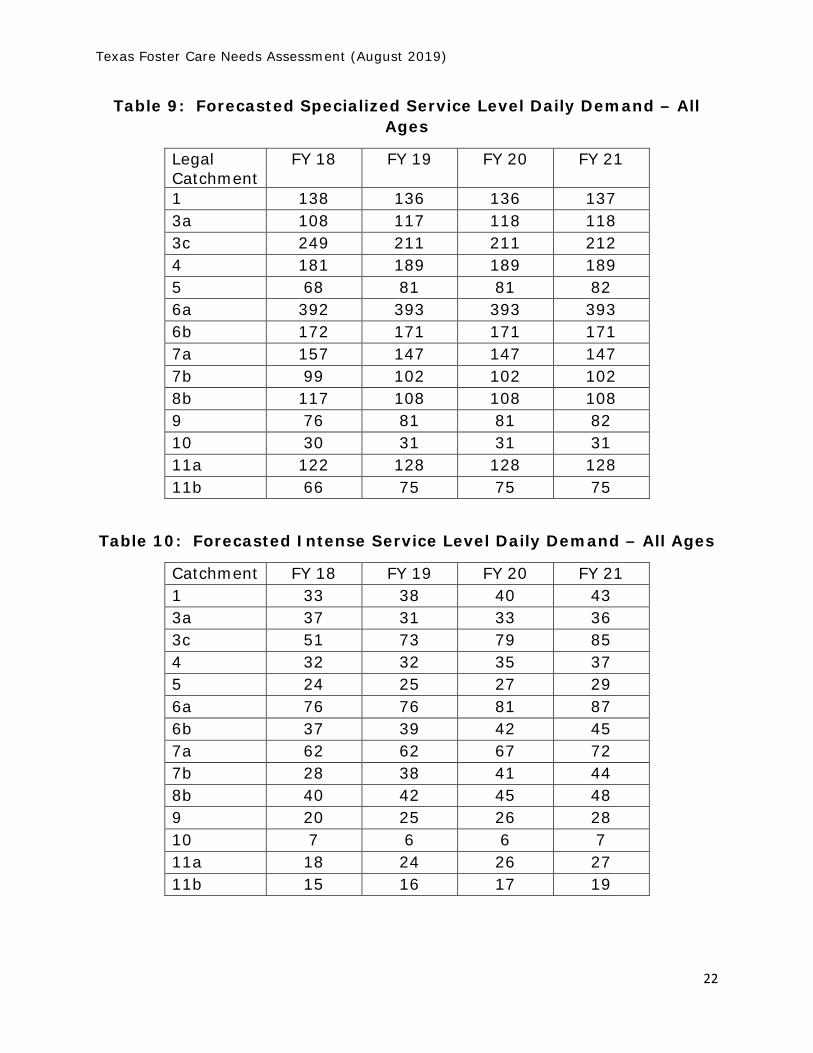
Table 9: Forecasted Specialized Service Level Daily Demand – All Ages
Legal Catchment
FY 18 FY 19 FY 20 FY 21
1 138 136 136 137 3a 108 117 118 118 3c 249 211 211 212 4 181 189 189 189 5 68 81 81 82 6a 392 393 393 393 6b 172 171 171 171 7a 157 147 147 147 7b 99 102 102 102 8b 117 108 108 108 9 76 81 81 82 10 30 31 31 31 11a 122 128 128 128 11b 66 75 75 75
Table 10: Forecasted Intense Service Level Daily Demand – All Ages
Catchment FY 18 FY 19 FY 20 FY 21 1 33 38 40 43 3a 37 31 33 36 3c 51 73 79 85 4 32 32 35 37 5 24 25 27 29 6a 76 76 81 87 6b 37 39 42 45 7a 62 62 67 72 7b 28 38 41 44 8b 40 42 45 48 9 20 25 26 28 10 7 6 6 7 11a 18 24 26 27 11b 15 16 17 19

Texas Foster Care Needs Assessment (August 2019)
23
Table 11: Forecasted Basic Service Level Daily Demand – Age 14 and Older
Catchment FY 18 FY 19 FY 20 FY 21 1 77 82 83 83 3a 49 48 48 48 3c 103 101 101 101 4 65 70 71 71 5 43 44 44 44 6a 132 129 129 129 6b 42 44 44 44 7a 72 69 69 69 7b 63 60 60 60 8b 57 61 61 61 9 25 23 24 24 10 21 21 21 21 11a 54 59 59 59 11b 44 43 43 43
Table 12: Forecasted Moderate Service Level Daily Demand – Age 14 and Older
Catchment FY 18 FY 19 FY 20 FY 21 1 58 58 58 58 3a 31 32 32 32 3c 95 94 94 94 4 50 49 49 50 5 23 21 21 22 6a 116 116 118 119 6b 58 52 52 52 7a 42 45 45 45 7b 30 34 34 34 8b 38 39 39 39 9 24 29 29 29 10 10 11 11 11 11a 55 54 55 55 11b 36 33 32 32

Texas Foster Care Needs Assessment (August 2019)
24
There are so few IPTP and CSC placements that a forecast through FY 2021 is not included.
Table 13: Number of Children from Each Catchment on August 31, 2018 placed with IPTP or a Child Specific Contract
Catchment IPTP Child Specific Contract 1 1 11 3a 4 4 3c 4 17 4 1 11 5 1 8 6a 5 27 6b 0 17 7a 4 4 7b 6 18 8b 1 2 9 4 10 10 0 0 11a 2 5 11b 3 2
Texas Foster Care Needs Assessment (August 2019)
25
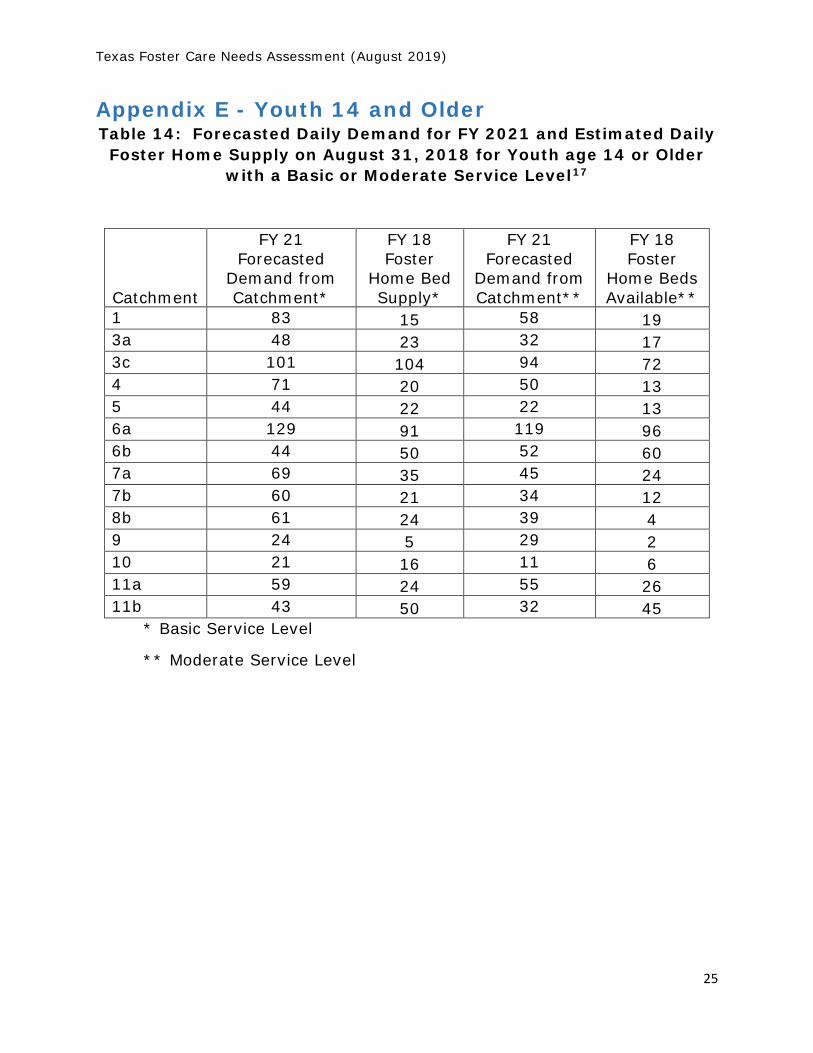
Appendix E - Youth 14 and Older Table 14: Forecasted Daily Demand for FY 2021 and Estimated Daily Foster Home Supply on August 31, 2018 for Youth age 14 or Older
with a Basic or Moderate Service Level17
Catchment
FY 21 Forecasted
Demand from Catchment*
FY 18 Foster
Home Bed Supply*
FY 21 Forecasted
Demand from Catchment**
FY 18 Foster
Home Beds Available**
1 83 15 58 19 3a 48 23 32 17 3c 101 104 94 72 4 71 20 50 13 5 44 22 22 13 6a 129 91 119 96 6b 44 50 52 60 7a 69 35 45 24 7b 60 21 34 12 8b 61 24 39 4 9 24 5 29 2 10 21 16 11 6 11a 59 24 55 26 11b 43 50 32 45
* Basic Service Level
** Moderate Service Level

Texas Foster Care Needs Assessment (August 2019)
26
Appendix F - Children per Foster Home with Basic or Moderate Service Level
Table 15: Number of Foster Homes with at Least One Child with a Basic or Moderate Service Level Placed on August 31, 2018 and
Average Number of Basic and Moderate Children per Home18
Catchment Number of Foster
Homes in Catchment Average Children per Foster Home
1 311 1.74 3a 375 1.61 3c 622 1.95 4 299 1.82 5 195 2.08 6a 671 1.96 6b 415 1.82 7a 423 1.84 7b 246 1.79 8b 256 1.76 9 108 1.80 10 102 2.01 11a 151 2.09 11b 225 2.38

Texas Foster Care Needs Assessment (August 2019)
27
Appendix G – Children per Foster Home with Higher Needs
Table 16: Number of Foster Homes with at Least One Child with a Specialized or Intense Service Level Placed on August 31, 2018 and
Average Number of Specialized and Intense Children per Home19
Catchment Number of
Foster Homes Average Children per
Foster Home 1 25 1.24 3a 30 1.37 3c 134 1.34 4 38 1.61 5 14 1.64 6a 141 1.48 6b 118 1.63 7a 67 1.55 7b 17 1.18 8b 29 1.59 9 2 1.50 10 9 1.33 11a 15 1.33 11B 52 1.50

Texas Foster Care Needs Assessment (August 2019)
28
Appendix H - DFPS and Contracted CPA Foster Homes One factor affecting non-relative foster care capacity is whether the foster home is developed and maintained through DFPS or a contracted CPA. Generally, homes DFPS develops are less likely to be vacant and children with specialized and intense service levels are placed in homes contracted CPAs develop and manage.20
Table 17: Number of DFPS and Contracted CPA Homes on August 31, 201821
Catchment DFPS
Homes
Contracted CPA
Homes Total
Homes
Percent DFPS
Homes 1 85 443 528 16% 3a 69 678 747 9% 3c 99 1,038 1,137 9% 4 133 393 526 25% 5 110 184 294 37% 6a 122 1,242 1,364 9% 6b 67 851 918 7% 7a 80 830 910 9% 7b 25 627 652 4% 8b 41 486 527 8% 9 13 188 201 6% 10 45 111 156 29% 11a 18 239 257 7% 11b 14 362 374 4% Total 921 7,670 8,591 11%

Texas Foster Care Needs Assessment (August 2019)
29
Building and maintaining new foster home capacity requires experience and an upfront investment in recruiting and training new foster parents. Areas that have more contracted CPAs with a large number of homes in a particular area may be able to better build capacity by leveraging economies of scale.
As contracted CPAs are licensed by region, the table below does not have catchment break-outs.22
Table 18: Number of Contracted CPAs on August 31, 201823
Region Contracted
CPAs
Contracted CPA
Homes
Contracted CPAs with
more than 50 foster homes
Contracted CPAs with more than 100 foster
homes 1 11 443 5 0 3 62 2,563 18 6 4 22 393 3 0 5 16 184 0 0 6 50 2,097 8 5 7 40 1,460 11 3 8 33 1,415 11 2 9 9 188 2 0 10 5 111 0 0 11 18 602 4 0
Even among the larger contracted CPAs, many focus primarily on homes verified to both foster and adopt rather than foster only homes.24 This can affect capacity because foster-adopt homes generally stay active for a shorter period of time,25 are less likely to take children with a specialized or intense service level or teens and are more likely to be active but have no placements in the prior 12 months.26

Texas Foster Care Needs Assessment (August 2019)
30
Appendix I – Cross Catchment Placements27 Table 17: Children with Basic and Moderate Service Levels in a Non-Relative Foster Home on August 31,
2018
Placement Catchment
Legal Catchment 1 2 3A 3B 3C 4 5 6A 6B 7A 7B 8A 8B 9 10 11A 11B Total 1 481 4 4 6 11 11 2 18 1 5 17 6 6 11 12 0 6 601 2 19 347 2 2 13 1 0 9 5 13 2 3 2 13 0 1 2 434 3A 2 0 310 5 241 9 0 3 7 5 0 1 0 0 0 1 0 584 3C 3 2 224 18 756 23 2 13 6 10 0 4 1 0 0 2 3 1,067 4 3 0 18 2 57 471 30 19 20 7 2 1 0 0 0 2 1 633 5 1 0 3 0 7 14 341 63 42 4 1 3 0 0 0 0 0 479 6A 0 1 3 3 3 2 15 906 433 42 9 6 0 0 17 1 0 1,441 6B 1 0 4 0 0 0 7 228 197 7 1 1 0 0 0 0 3 449 7A 1 4 4 1 12 4 3 8 9 438 111 8 2 2 0 0 4 611 7B 0 1 0 4 3 0 0 7 4 181 234 13 6 0 0 1 1 455 8A 0 1 0 3 3 1 1 10 11 28 37 684 255 0 0 1 3 1,038 8B 0 0 0 1 1 0 1 11 10 13 16 166 154 0 0 0 2 375 9 28 69 10 0 1 2 0 5 2 13 4 10 6 167 0 2 1 320 10 0 0 0 0 0 0 0 3 3 0 1 0 0 0 174 0 3 184 11A 1 0 0 3 3 0 1 11 1 4 5 2 16 0 2 286 105 440 11B 0 0 0 0 0 0 0 0 4 0 0 0 2 0 0 18 402 426 Total 540 429 582 48 1,111 538 403 1,314 755 770 440 908 450 193 205 315 536 9,537

Texas Foster Care Needs Assessment (August 2019)
31
Table 18: Children with Specialized and Intense Service Levels in a Non-Relative Foster Home on August 31, 2018
Placement Catchment
Legal Catchment 1 2 3A 3B 3C 4 5 6A 6B 7A 7B 8A 8B 9 10 11A 11B Total
1 23 1 0 0 8 7 0 4 4 5 1 2 1 1 0 1 0 58 2 1 13 1 1 4 2 0 1 4 2 1 2 3 0 0 1 0 36 3A 0 0 13 2 28 3 0 0 4 5 1 0 2 0 0 0 0 58 3C 2 0 20 4 105 6 1 7 4 8 0 5 1 0 0 0 0 163 4 0 0 2 2 20 36 9 10 7 1 0 2 0 0 0 0 1 90 5 0 0 0 0 0 2 8 11 13 1 0 1 0 0 0 0 0 36 6A 0 0 0 0 1 0 1 106 98 8 0 1 0 0 0 1 0 216 6B 1 0 0 0 1 2 1 44 32 3 0 0 0 0 0 0 0 84 7A 0 0 1 1 1 2 1 5 5 36 7 2 1 0 0 0 2 64 7B 0 1 0 0 0 0 1 1 3 13 9 0 0 0 0 0 0 28 8A 0 0 0 1 3 1 0 8 4 7 0 63 22 0 0 0 2 111 8B 0 0 0 0 5 0 0 3 4 2 1 13 15 0 0 1 1 45 9 4 3 2 0 3 0 0 3 4 8 0 1 1 2 1 0 0 32 10 0 0 0 0 0 0 0 1 0 0 0 0 0 0 11 0 0 12 11A 0 0 0 0 0 0 1 2 1 2 0 4 0 0 0 14 39 63 11B 0 0 1 0 0 0 0 2 5 3 0 2 0 0 0 2 33 48 Total 31 18 40 11 179 61 23 208 192 104 20 98 46 3 12 20 78 1,144
Table 19: All Children in a Non-Relative Foster Home on August 31, 2018
(CBC has rolled out in catchment 3B so there are no service levels)
Placement Catchment
Legal Catchment 1 2 3A 3B 3C 4 5 6A 6B 7A 7B 8A 8B 9 10 11A 11B Total 3B 2 2 26 805 107 6 2 1 0 9 0 2 0 1 0 0 0 964

Texas Foster Care Needs Assessment (August 2019)
32
Table 20: Children with Specialized and Intense Service Levels in a GRO on August 31, 2018 (Excludes Emergency Shelters and RTCs)
Placement Catchment
Legal Catchment 1 2 3A 3B 3C 4 5 6A 6B 7A 7B 8A 8B 9 10 11A 11B Total 1 9 0 0 0 0 2 0 2 0 0 1 1 1 0 0 0 0 16 2 0 4 0 0 0 0 0 1 3 0 0 0 2 0 0 0 0 10 3A 0 0 2 0 0 3 0 0 0 0 0 0 0 0 0 0 0 5 3C 0 0 0 0 1 3 0 3 0 0 0 1 0 0 0 0 0 8 4 0 0 0 0 0 9 1 2 0 0 0 0 1 0 0 0 0 13 5 0 0 0 0 0 1 1 0 1 0 0 1 0 0 0 0 0 4 6A 0 0 0 0 0 5 0 6 2 0 0 0 2 0 0 0 0 15 6B 0 0 0 0 0 1 1 3 1 0 0 0 0 0 0 0 0 6 7A 1 0 0 0 1 0 0 2 1 0 0 0 0 0 0 0 1 6 7B 0 1 0 0 0 0 1 2 0 0 2 0 0 0 0 0 0 6 8A 0 0 0 0 0 1 0 5 0 0 0 1 10 0 0 0 0 17 8B 0 1 0 0 0 2 1 2 0 0 1 0 6 0 0 0 0 13 9 1 0 0 0 0 0 0 0 1 0 0 0 1 1 0 0 0 4 10 0 0 0 0 0 0 0 0 0 0 0 0 0 0 0 0 0 0 11A 0 0 0 0 0 0 0 0 1 0 0 0 1 0 0 0 1 3 11B 0 0 0 0 0 0 0 0 1 0 0 0 0 0 0 0 1 2 Total 11 6 2 0 2 27 5 28 11 0 4 4 24 1 0 0 3 128
Table 21: All Children in a GRO in Catchment 3B on August 31, 2018 (CBC has rolled out in catchment 3B so there are no service levels)
Placement Catchment
Legal Catchment 1 2 3A 3B 3C 4 5 6A 6B 7A 7B 8A 8B 9 10 11A 11B Total 3B 0 0 1 50 0 2 2 5 1 15 0 3 1 0 0 0 0 80

Texas Foster Care Needs Assessment (August 2019)
33
Table 22: Children with Specialized and Intense Service Levels in a RTC on August 31, 2018
Placement Catchment
Legal Catchment 1 2 3A 3B 3C 4 5 6A 6B 7A 7B 8A 8B 9 10 11A 11B Total 1 5 0 4 0 7 6 2 20 8 7 9 12 6 0 0 0 0 86 2 5 19 1 0 1 1 0 10 5 20 0 4 8 0 0 0 0 74 3A 4 0 3 0 9 6 0 17 7 2 9 12 3 0 0 0 0 72 3C 2 0 4 0 15 9 0 27 23 4 7 5 5 0 0 0 0 101 4 13 0 1 0 3 12 2 20 5 4 7 12 14 0 0 0 1 94 5 2 0 1 0 3 3 0 13 10 1 3 3 1 0 0 0 0 40 6A 1 0 4 0 10 14 3 91 51 2 12 8 5 0 0 0 0 201 6B 3 0 3 0 8 3 1 31 31 4 11 2 2 0 0 0 0 99 7A 6 0 1 0 4 8 0 31 14 14 28 11 11 0 0 0 0 128 7B 2 0 0 0 1 1 0 7 8 13 28 8 6 0 0 0 0 74 8A 3 0 0 0 5 2 1 30 21 3 16 46 48 0 0 0 0 175 8B 0 0 1 0 3 2 1 11 13 3 10 20 18 0 0 0 0 82 9 5 7 2 0 0 2 0 5 4 8 7 4 3 0 0 0 0 47 10 1 0 1 0 0 1 0 6 2 2 1 7 1 0 0 0 0 22 11A 6 0 0 0 1 1 0 13 13 0 8 7 11 0 0 0 0 60 11B 0 0 0 0 0 0 0 7 5 0 2 4 1 0 0 0 1 20 Total 58 26 26 0 70 71 10 339 220 87 158 165 143 0 0 0 2 1,375
Table 23: All Children in a RTC in Catchment 3B on August 31, 2018
(CBC has rolled out in catchment 3B so there are no service levels)
Placement Catchment
Legal Catchment 1 2 3A 3B 3C 4 5 6A 6B 7A 7B 8A 8B 9 10 11A 11B Total 3B 4 0 2 11 5 1 12 37 36 19 7 16 2 0 1 0 0 153
Texas Foster Care Needs Assessment (August 2019)
34
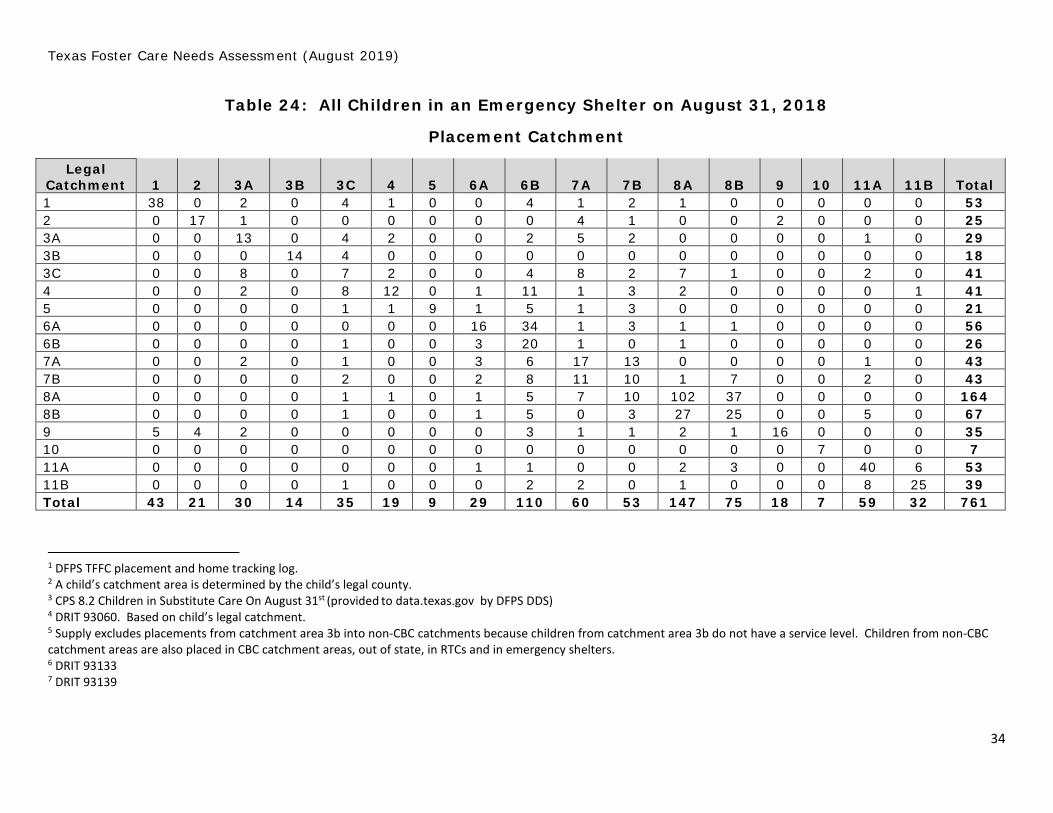
Table 24: All Children in an Emergency Shelter on August 31, 2018
Placement Catchment
Legal Catchment 1 2 3A 3B 3C 4 5 6A 6B 7A 7B 8A 8B 9 10 11A 11B Total 1 38 0 2 0 4 1 0 0 4 1 2 1 0 0 0 0 0 53 2 0 17 1 0 0 0 0 0 0 4 1 0 0 2 0 0 0 25 3A 0 0 13 0 4 2 0 0 2 5 2 0 0 0 0 1 0 29 3B 0 0 0 14 4 0 0 0 0 0 0 0 0 0 0 0 0 18 3C 0 0 8 0 7 2 0 0 4 8 2 7 1 0 0 2 0 41 4 0 0 2 0 8 12 0 1 11 1 3 2 0 0 0 0 1 41 5 0 0 0 0 1 1 9 1 5 1 3 0 0 0 0 0 0 21 6A 0 0 0 0 0 0 0 16 34 1 3 1 1 0 0 0 0 56 6B 0 0 0 0 1 0 0 3 20 1 0 1 0 0 0 0 0 26 7A 0 0 2 0 1 0 0 3 6 17 13 0 0 0 0 1 0 43 7B 0 0 0 0 2 0 0 2 8 11 10 1 7 0 0 2 0 43 8A 0 0 0 0 1 1 0 1 5 7 10 102 37 0 0 0 0 164 8B 0 0 0 0 1 0 0 1 5 0 3 27 25 0 0 5 0 67 9 5 4 2 0 0 0 0 0 3 1 1 2 1 16 0 0 0 35 10 0 0 0 0 0 0 0 0 0 0 0 0 0 0 7 0 0 7 11A 0 0 0 0 0 0 0 1 1 0 0 2 3 0 0 40 6 53 11B 0 0 0 0 1 0 0 0 2 2 0 1 0 0 0 8 25 39 Total 43 21 30 14 35 19 9 29 110 60 53 147 75 18 7 59 32 761
1 DFPS TFFC placement and home tracking log. 2 A child’s catchment area is determined by the child’s legal county. 3 CPS 8.2 Children in Substitute Care On August 31st (provided to data.texas.gov by DFPS DDS) 4 DRIT 93060. Based on child’s legal catchment. 5 Supply excludes placements from catchment area 3b into non-CBC catchments because children from catchment area 3b do not have a service level. Children from non-CBC catchment areas are also placed in CBC catchment areas, out of state, in RTCs and in emergency shelters. 6 DRIT 93133 7 DRIT 93139

Texas Foster Care Needs Assessment (August 2019)
35
8 Supply excludes placements from catchment area 3b into non-CBC catchments because children from catchment area 3b do not have a service level. Children from non-CBC catchment areas are also placed in CBC catchment areas, out of state and in emergency shelters. 9 DRIT 93138 10 DRIT 93133. 11 DRIT 93133. 12 DRIT 93133. Includes placements from catchment areas 2, 3b and 8a. 13 DRIT 93136. 14 DRIT 93136. Excludes non-CBC placements in catchment areas 2, 3b and 8 and out of state placements 15 Beds were calculated by taking the number of homes that were active and vacant on August 31. 2018 but had at least one child meeting the specified criteria placed in the last 12 months and multiplying by the average number of children per home for homes that had at least on child placed on August 31, 2018. 16 Includes youth age 18 and older and excludes children in a child specific contract or with a psychiatric transition level of care. 17 DRIT 93060, forecast and DRIT 93138. 18 DRIT 93139 19 DRIT 93139 20 Analysis of DRIT 91958 21 DFPS data warehouse report FAD_09 22 The number of CPAs in each region is counted by the CPA name rather than the facility number as the same CPA can have more than one facility number in the same region. Some CPAs operate across multiple catchments and are counted in each catchment in which they have homes. The CPAs in Region 3 include the CBC provider and other CPAs who contract with the CBC, although they may also contract with DFPS. 23 DFPS data warehouse report FAD_09 for homes and DRIT 91538 for CPAs. 24 DRIT 91958 25 DRIT 88642 26 DRIT 91958 27 The tables in this appendix exclude children placed out of state and in an unknown catchment.